

Summary
This CloneSeq protocol combines clonal expansion inside 3D hydrogel spheres and droplet-based RNA sequencing to resolve the limited sensitivity of single-cell approaches. CloneSeq can reveal rare subpopulations and support cellular stemness. CloneSeq can be adapted to different biological systems to discover rare subpopulations by leveraging clonal enhanced sensitivity. Important considerations include the hydrogel composition, adaptation of 3D cultured clones to the inDrops system, and inherent adhesive properties of the cells. CloneSeq is only validated for cell lines so far.
For complete details on the use and execution of this protocol, please refer to (Bavli et al., 2021).
Subject areas: Sequence analysis, Cell Biology, Cell culture, Single Cell, Sequencing, RNAseq, High Throughput Screening, Molecular Biology
Graphical abstract

Highlights
-
•
Integrative mRNA sequencing of single clones shows enhanced sensitivity
-
•
PEGDT-MALDEX hydrogel supports cancer cells and ESC clonal expansion
-
•
CloneSeq identifies cancer-stem like subpopulation
This CloneSeq protocol combines clonal expansion inside 3D hydrogel spheres and droplet-based RNA sequencing to resolve the limited sensitivity of single-cell approaches. CloneSeq can reveal rare subpopulations and support cellular stemness. CloneSeq can be adapted to different biological systems to discover rare subpopulations by leveraging clonal enhanced sensitivity. Important considerations include the hydrogel composition, adaptation of 3D cultured clones to the inDrops system, and inherent adhesive properties of the cells. CloneSeq is only validated for cell lines so far.
Before you begin
The method includes four steps:
-
1.
Capturing of single cells inside hydrogel spheres using a microfluidic device.
-
2.
Clonal expansion of single cells within the hydrogel spheres.
-
3.
Single-clone transcriptome barcoding in drops.
-
4.
Library preparation, sequencing and data processing.
You will need a microfluidics setup, associated control software, and microfluidic devices for single cell encapsulation for 3D hydrogel culturing and for single-clone transcriptome barcoding.
For 3D culture, you first need to choose the appropriate composition of hydrogel for your cell line. We have validated several different compositions of hydrogel. For the choice of hydrogel, you can check the manufacturer’s manual (https://www.cellendes.com/images/pdfs/manuals/manual_hydrogel.pdf) or use the flow chart below to help your decision (Figure 1). The protocol below describes the specific steps for embryonic stem cells (ESCs) culturing, which needs CD-Link. For other recipes that need PEG-Link, simply replace the CD-Link by PEG-Link (with the same volume).
Figure 1.

Flowchart for the choice of hydrogel components
For clonal expansion, you will need single cells captured in 3D hydrogel spheres from the step above, suitable cell culture plate, cell culture medium, and a cell culture incubator.
Single-clone transcriptome barcoding and the following library preparation, next-generation sequencing, and data analysis steps are performed as described in the inDrops protocol (Zilionis et al., 2017), with modifications specified in the main text below.
Microfluidic device fabrication
Timing: 1 day
-
5.
Follow the protocol reported previously (Mazutis et al., 2013) to manufacture the poly (dimethyl siloxane) (PDMS) devices with designs showed in Figure 2. The depths of the channels for Device I and II are 79.1 ± 1 μm and 123.6 μm ± 1 μm respectively. CAD files for the microfluidic devices can be found in Bavli et al., 2021 Data S1. Ready-to-use microfluidic devices can be also obtained commercially (from Fluigent, ]https://www.fluigent.com/product/microfluidic-components-3/microfluidic-chip/, or BlackHole Lab, https://www.blackholelab-soft-lithography.com/su-8-photolithography-and-pdms-soft-lithography-products). For the surface treatment step, an alternative is to use a 200 μL pipette, and drop the Aquapel at the outlet of each device. The solution will be absorbed into the whole device by capillary forces.
Figure 2.

Design of microfluidic devices
(A) Device I: single cell encapsulation device for PEGDT-MALDEX hydrogel culturing.
(B) Device II: CloneSeq device for single-clone transcriptome barcoding in drops.
The numbers indicate the inlets: (1) carrier oil inlet, (2) PEGDT mix, (3) MALDEX mix with cells, (4) outlet for collection, (5) single clone suspension, (6) RT lysis mix, (7) barcoding hydrogel bead.
Prepare hydrogel barcoding beads
-
6.
For polyacrylamide hydrogel bead production and barcoding on hydrogel beads please follow the protocol reported previously (Zilionis et al., 2017). We modified the barcode plates (eight 96-well plates) to expand barcode complexity by changing the length of barcode 1 to a variable length of 7 to 10 bases. The complete DNA oligonucleotide sequences can be found in Table S1.
Key resources table
| REAGENT or RESOURCE | SOURCE | IDENTIFIER |
|---|---|---|
| Chemicals, peptides, and recombinant proteins | ||
| Novec 7500 Engineered Fluid (HFE-7500 oil) | 3M | Cat# Novec 7500 |
| Neat (un-dissolved) 008-FluoroSurfactant | RAN Biotechnologies | Cat# 008-FluoroSurfactant |
| Methoxy PEG thiol (PEG-SH) | Sigma-Aldrich | Cat# 729108 |
| 1H, 1H, 2H, 2H-Perfluoro-1-Octanol (PFO) | Sigma-Aldrich | Cat# 370533 |
| Dulbecco’s Modified Eagle’s Medium - high glucose | Sigma-Aldrich | Cat# D5671 |
| Fetal Bovine Serum (FBS) | Biological Industries | Cat# 04-007-1A |
| Penicillin-Streptomycin Solution (10 mg/mL) | Biological Industries | Cat# 03-031-1B |
| L-Glutamine Solution (200 mM) | Biological Industries | Cat# 03-020-1B |
| Sodium Pyruvate Solution (100 mM) | Biological Industries | Cat# 03-042-1B |
| 2-Mercaptoethanol (14.3 M) | Sigma-Aldrich | Cat# M3148 |
| ECM Gel | Sigma-Aldrich | Cat# E1270 |
| 3-D Life PEG-Link (PEGDT) | Cellendes GmbH | SKU: L50-1 |
| 3-D Life CD-Link (MPEGDT) | Cellendes GmbH | SKU: L60-1 |
| 3-D Life Mal-Dextran (MALDEX) | Cellendes GmbH | SKU: M92-3 |
| 3-D Life RGD Peptide | Cellendes GmbH | SKU: 09-P-001 |
| 3-D Life Dextranase | Cellendes GmbH | SKU: D10-1 |
| 3-D Life 10× CB Buffer (pH 7.2) | Cellendes GmbH | SKU: B20-3 |
| Murine RNase inhibitor | NEB | Cat #M0314 |
| Gelatin solution, 2% in H2O | Sigma-Aldrich | Cat #G1393 |
| 1M Tris-HCl (pH 8.0) | Sigma-Aldrich | Cat #T2319 |
| IGEPAL CA-630 | Sigma-Aldrich | Cat #I8896 |
| PBS × 10 | Biological Industries | Cat #02-023-5A |
| 0.5M EDTA, pH 8 | Biological Industries | Cat #V4233 |
| Nuclease-free water | Sigma-Aldrich | Cat #W4502 |
| OptiPrep Density Gradient Medium (Optiprep) | Sigma-Aldrich | Cat #D1556 |
| Tween-20 | ENCOsc-29113 | Cat #SC-29113 sc-29113 sc-29113 sc-29113 |
| Critical commercial assays | ||
| SuperScript™ III Reverse Transcriptase Kit | Invitrogen | Cat# 18080-044 |
| NextSeq 500/550 High Output Kit v2.5 (75 Cycles) | Illumina | Cat# 20024906 |
| Experimental models: cell lines | ||
| Mouse: ES-R1 cells | Prof. Eran Meshorer (The Hebrew University of Jerusalem, Israel) | ATCC Cat# SCRC-1011, RRID:CVCL_2167 |
| Software and algorithms | ||
| Bowtie2 | Langmead et al., 2009 | http://bowtie-bio.sourceforge.net/bowtie2/index.shtml |
| Seurat v2.4 | Stuart et al., 2019 | https://satijalab.org/seurat/ |
| A-I-O SOFTWARE | Fluigent | n/a |
| Other | ||
| Microfluidic pressure control - LINEUP™ SERIES | Fluigent | LU-FEZ-0069; LU-FEZ-0345; LU-FEZ-1000; LU-FEZ-2000 |
| Hispec1 camera | Fastec Imaging | n/a |
| ECLIPSE Ti2-U inverted microscope | Nikon | n/a |
| High-Intensity UV Inspection Lamp | Capitol Scientific | Cat# 95-0127-01 |
| Magnetic stirring bar (2 × 2 mm) | Spinbar | Cat# 371210008 |
| Micro gear motor (for keeping cells suspended) | Firgelli Automation | Cat# FA-GM-6V-30 |
| pluriStrainer® Mini 70 μm (Cell Strainer) | pluriSelect | SKU 43–10070-40 |
| pluriStrainer® 40 μm (Cell Strainer) | pluriSelect | SKU 43–50040-51 |
| Eppendorf® Safe-Lock microcentrifuge tubes 1.5 Ml | Merck | Cat# T9661 |
| Eppendorf® Safe-Lock microcentrifuge tubes 2 mL | Merck | Cat# T2795 |
| Axygen® 96-well Polypropylene PCR Microplate, Half Skirt, Clear, Nonsterile | Corning | Ref# PCR-96M2-HS-C |
| Nunc™ Cell-Culture Treated Multidishes – 48 well | Thermo Fisher | Cat# 150687 |
| Deposited data | ||
| Raw and analyzed data | This paper | GEO: GSE155888 |
| Oligonucleotides | ||
| Barcode lists for CloneSeq - see Table S1 | Bavli et al., 2021 | n/a |
Materials and equipment
Gelatin 0.1%
| Reagent | Final concentration | Amount |
|---|---|---|
| Gelatin solution, 2% in H2O | 0.1% | 5 mL |
| Nuclease-free water | n/a | 95 mL |
| Total | n/a | 100 mL |
Note: Store at room temperature (15°C–25°C) for a month.
PBS 1×
| Reagent | Final concentration | Amount |
|---|---|---|
| PBS × 10 | 1× | 10 mL |
| Nuclease-free water | n/a | 90 mL |
| Total | n/a | 100 mL |
Note: Store at room temperature for a month.
ESC Medium
| Reagent | Final concentration | Amount |
|---|---|---|
| DMEM | n/a | 500 mL |
| FBS | 15% | 75 mL |
| L-Glutamine Solution (200 mM) | 2 mM | 6 mL |
| Penicillin-Streptomycin Solution (10 mg/mL) | 0.1 mg/mL | 6 mL |
| Sodium Pyruvate Solution (100 mM) | 1 mM | 6 mL |
| 2-Mercaptoethanol (14.3 M) | 10 mM | 420 μL |
| Total | n/a | 600 mL |
Note: Store at 4°C for up to 1 month.
PEGDT mix
| Reagent | Final concentration | Amount |
|---|---|---|
| Gelatin (0.1%) | n/a | 300 μL |
| 3-D Life 10× CB Buffer (pH 7.2) | 1× | 50 μL |
| 3-D Life CD-Link (MPEGDT) (20 mM) | 2.45 mM | 67.5 μL |
| 3-D Life RGD Peptide (20 mM) | 2.45 mM | 10 μL |
| PBS (1×) | n/a | 122.5 μL |
| Total | n/a | 550 μL |
Note: Pre-thaw the reagents on ice and store the mix on ice before use. Prepare in 1.5 mL Eppendorf safe-lock tube.
MALDEX mix
| Reagent | Final concentration | Amount |
|---|---|---|
| Gelatin (0.1%) | n/a | 335 μL |
| 3-D Life 10× CB Buffer (pH 7.2) | 1× | 50 μL |
| 3-D Life Mal-Dextran (MALDEX) (30 mM) | 2.45 mM | 45 μL |
| Cell suspension | n/a | 120 μL |
| Total | n/a | 550 μL |
Note: Pre-thaw the reagents on ice and store the mix on ice before use. Prepare in 2 mL Eppendorf safe-lock tube.
Drop breaking solution
| Reagent | Final concentration | Amount |
|---|---|---|
| HFE-7500 oil | n/a | 400 μL |
| PFO 97% | 12% | 100 μL |
| PEG-SH 1 g/mL | 25 mg/mL | 20 μL |
| PBS (1×) | n/a | 280 μL |
| Total | n/a | 800 μL |
Note: Make fresh PEG-SH solution, do not refreeze. Wear appropriate personal protective equipment and avoid contact with skin when handling PFO. Use it in a well-ventilated area.
CRITICAL: Avoid direct contact with Novec 7500 Engineered Fluid it may cause respiratory, skin, and eye irritation.
RT lysis mix
| Reagent | Final concentration | Amount |
|---|---|---|
| First-Strand Buffer (5×) | 1× | 60 μL |
| IGEPAL CA-630 (10%) | 0.3% | 9 μL |
| dNTPs (25 mM) | 0.5 mM | 6 μL |
| DTT (0.1 M) | 3 mM | 10 μL |
| Tris-HCl [pH 8.0] (1 M) | 20 mM | 15 μL |
| Murine RNase inhibitor | 1.3 U/μL | 10 μL |
| SuperScript III RT enzyme | 20 U/μL | 15 μL |
| nuclease-free water | n/a | 25 μL |
| Total | n/a | 150 μL |
Note: Pre-thaw the reagents on ice and store the mix on ice before use. Prepare in 1.5 mL Eppendorf safe-lock tube.
T10E0.1T0.1 buffer
| Reagent | Final concentration | Amount |
|---|---|---|
| Tris-HCl [pH 8.0] (1 M) | 100 mM | 500 μL |
| EDTA 0.5 M | 0.1 mM | 10 μL |
| Tween-20 10% | 0.1% | 500 μL |
| nuclease-free water | n/a | 49 mL |
| Total | n/a | 50 mL |
Note: Store in room temperature for up to 6 months.
2% HFE oil
| Reagent | Final concentration | Amount |
|---|---|---|
| HFE-7500 oil | n/a | 2 g |
| Neat (un-dissolved) 008-FluoroSurfactant | 2% | 98 g |
| Total | n/a | 100 g |
Microfluidics setup
Droplet formation and cell encapsulation were performed using EZ pressure-derived pumps from the Microfluidic pressure control - LINEUP™ SERIES, controlled by the A-I-O software at pressures ranged from 69 mbar to 2000 mbar. For all experiments, cells were kept in a 2 mL safe-lock Eppendorf tube surrounded by ice and were gently agitated with a magnetic stirring bar placed inside the tube and rotated using a magnet attached to a rotating motor (cell mixer) to prevent sedimentation and clumping. The flow was visualized under an optical microscope at 10× magnification and imaged at 1000–2000 frames per second using a Hispec1 camera.
Alternatives: Syringe pumps could also be used in place of the pressure-derived pumps (e.g., Harvard Apparatus, cat. no. 702226)
Step-by-step method details
Single-cell encapsulation in PEGDT-MALDEX hydrogels
This section describes how to encapsulate single cells into MALDEX-PEGDT hydrogel using microfluidic devices.
-
1.
Prepare MALDEX and PEGDT mix in a biological hood. Keep mixture on ice until use to prevent gelation.
-
2.Prepare single cell suspension.Note: We work with passage under 40, but it is recommended to use the lowest passage.
-
a.Harvest ESC cells from tissue culture plate, wash the cells with 1× PBS and centrifuge at 500 rcf for 5 min.
-
b.Wash again the cells as previous step, resuspend cells in 5 mL 1× PBS.
-
c.Pass cell suspension through a 40 μm cell strainer.
-
d.Count and pellet 1×10⁶ cells. Resuspend cells in 100 μL 1× PBS with 10% Optiprep.
-
e.Add 20μL ECM with cold tips.
-
f.Transfer cell suspension to MALDEX mix.
-
g.Wash a magnetic stirring bar three times by 1× PBS. Put it in the MALDEX mix.
-
a.
-
3.Prepare microfluidics setup. (Figure 3)
-
a.Install everything as shown in Figure 3. For more detailed instructions on the installation of the system, check the manual of FluigentTM (https://www.fluigent.com/).
-
b.Put a microfluidic device under the microscope. Check its channels for imperfections. (For example, impurity in channels, or adjacent channels sticking together, etc.)
-
c.Make sure there are at least 3 mL of 2% HFE-7500 oil in the pressurized reservoir 15 mL tube.
-
d.Attach all reagents (lysis, barcodes, oil) and single cell suspension to the corresponding pressure controllers.CRITICAL: Make sure that the tubing reaches the bottom of the tubes
-
e.Connect the cell mixer to the power supply. Add ice to the ice stand for MALDEX mix.
-
f.Prepare collection tubes: two 2 mL tubes, in a cooling block.
-
g.Turn on the pressure controllers, open the A-i-O control software. Change all the flow rate units to μL/h. Set scale factors for different inlets: 4.3 for oil, 1.1 for MALDEX and 1 for PEGDT. For the use of A-i-O software, check the manual of FluigentTM (https://www.fluigent.com/download/)
-
a.
-
4.Run the microfluidic system.
-
a.For each of the inlets, before connecting the tubing to the device, apply maximum pressure to push the liquid to the end of tubing, and then stop the pressure.
-
b.Connect tubing to the microfluidic device according to the position shown in Figure 3.
-
c.Put the outlet tubing into a collection tube.
-
d.In the A-i-O software, press “edit mode”. Use "pressure mode" and set parameters as follows: oil 200 mbar, PEGDT 100 mbar, MALDEX 100mbar. Press “edit mode” again to start all inlets simultaneously.
-
e.Wait until you see all the flows from the three inlets arrive at the junction and drops are formed properly.Note: You are supposed to see a boundary at the junction, which indicates that both MALDEX and PEGDT arrived at the junction, as highlighted in Figure 4.
-
f.Change the flow rate as follows: oil 2000 μL/h, PEG 500 μL/h, DEX 500 μL/h. Troubleshooting 1
-
g.Change to a new collection tube when the upper part of the collection gets to around 500 μL. (Figure 5A) The protocol is designed for two collections.
-
a.
-
5.Wash the hydrogel.CRITICAL: Perform the following steps in a biological hood.
-
a.Transfer the collection tubes to a 37°C incubator for at least 5 min to stabilize the formation of the hydrogel.
-
b.Transfer the upper part of the collection to the drop breaking solution. Mix by gently inverting the tubes and incubate for exactly 1 min in the 37°C incubator. (Figure 5A)
-
c.Discard the lower oil fraction and add 1 mL of PBS. (Figure 5B)
-
d.Centrifuge at 250 rcf for 2.5 min. The hydrogel is the pink solid pellet in the middle. (Figure 5C) Discard the upper PBS fraction and the lower oil fraction.
-
e.Wash two more times with 1 mL of 1× PBS. The hydrogel fraction is clear at the end (Figure 5D).
-
f.Resuspend the beads in 500 μL pre-warmed ESC medium and transfer to a well in a 48-wells plate.Alternatives: The hydrogel could also be seeded to a T25 tissue culture flask with 1.5 mL medium.CRITICAL: Do not use more than 500 μL cell medium per well, otherwise cells may lack oxygen.
-
g.Wash the collection tube with 500 μL pre-warmed ESC medium and transfer to a different well. Repeat twice. These diluted wells will facilitate the observation of individual clones under microscope. Troubleshooting 2
-
a.
Note: It will be normal to have some remnant of oil drops with hydrogels. They look like cells but in a shape of perfect circle while cells are usually not so perfect, as shown in Figure 6.
Figure 3.

Microfluidic setup for single cell encapsulation in PEGDT-MALDEX hydrogel sphere
(A) Pressure controller. Use 2000 mbar pump for carrier oil inlet, 1000 mbar pump for PEGDT and MALDEX inlets.
(B) Pressurized reservoir. Use 1.5 mL and 2 mL Safe-Lock tubes for PEGDT and MALDEX mix, respectively and use a 15 mL tube for 2% HFE-7500 oil.
(C) Cell mixer. The yellow square shows a zoom in on the MALDEX mix. The tube is surrounded by an ice stand, and the cell mixer is working outside of the tube towards the bottom of the tube, to make the magnetic stirring bar agitate the cells and prevent sedimentation.
(D) Flow sensor. Use Flow unit size M for all three inlets.
(E) Microfluidic device for single cell encapsulation in PEGDT-MALDEX hydrogel sphere. A zoom in on the design, indicating the position of each inlet: (1) 2% HFE-7500 oil, (2) PEGDT mix, (3) MALDEX mix and (4) outlet for collection.
(F) Collection tube. Use a 2 mL tube, placed in a cooling block.
(G) Control software for the microscope, zoom in on the droplet-generation junction.
(H) A-i-O software for flow control.
Figure 4.
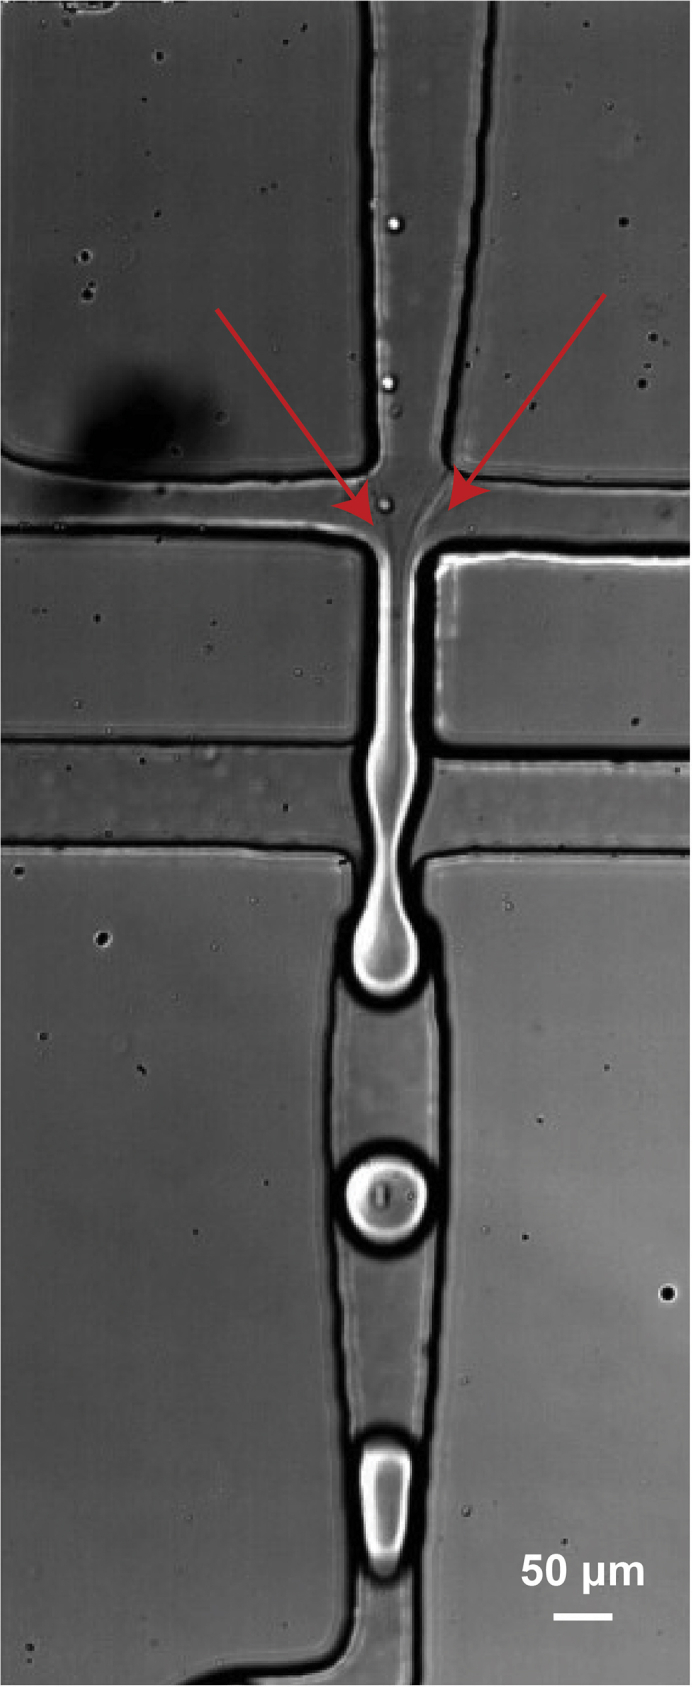
Single cell encapsulation in PEGCT-MALDEX hydrogel sphere
Red arrows indicate boundary where PEGDT and MALDEX meet. Scale bar: 50 μm.
Figure 5.

Hydrogel washing
(A) The collection should have two phases: an upper pink phase that contains the hydrogel spheres, and a lower phase that contains oil.
(B) After transferring the hydrogel to the drop breaking solution and mixing, the two phases of hydrogel and oil will separate again.
(C) After the first wash with PBS, the solution has three phases, from top to bottom: PBS, hydrogel, and oil. The separation between PBS and hydrogel should be a straight line, and the separation between hydrogel and oil is a curved surface.
(D) After the third wash, there should be only a small volume of oil left at the bottom of the tube, and the hydrogel spheres should be transparent. The arrows with different color indicate the three phases: blue – hydrogel, orange – oil, red – PBS.
Figure 6.

Microscope photo of ESC in PEGDT-MALDEX hydrogel after encapsulation
The big transparent spheres are PEGDT-MALDEX hydrogel spheres. They are about the size of 70 μm diameter. Red arrows indicate single cells in hydrogel spheres. Yellow arrows indicate oil drops. Scale bar: 50 μm.
Clone expansion in PEGDT-MALDEX hydrogels
This section describes how to culture single cells into clones in MALDEX-PEGDT hydrogel.
-
6.
After collection, check the clone formation status every day. Change medium every day: Collect hydrogel spheres from all the three wells to a 1.5 mL tube, centrifuge at 250 rcf for 2.5 min, remove the old medium, wash once with 1× PBS, resuspend the hydrogel with the 500μL pre-warmed cell medium and transfer to a new well. The clones will attain desired size (15–20 cells per clone) after 3 days of culture. Troubleshooting 3
Barcoding of transcriptomes of single clones: System setup
This section describes the encapsulation of single clones with a microfluidics device and capturing of transcriptomes. The protocol is based on inDrops protocol previously reported (Zilionis et al., 2017).
-
7.Prepare single clone suspension.
-
a.Collect all the hydrogel spheres together with their culturing ESC medium to a 1.5 mL tube. Add dextranase by 1:20 dilution. Incubate at 37°C for 30 min to dissolve the PEGDT-MALDEX hydrogel.
-
b.Gently mix the clone suspension then pass it through a 70 μm cell strainer.CRITICAL: Filtering is essential for a complete removal of hydrogel remnant.
-
c.Put the tube into a 37°C incubator. Let clones sink by gravity for 30 min. Gently remove the upper medium. Replace with 1 mL 1× PBS. Troubleshooting 4CRITICAL: Use a pipette instead of vacuum for the wash of clone suspensions, since the pellet is not well packed, and the use of vacuum may result in loss of clones.
-
d.Repeat PBS wash once, finally resuspend in 200 μL 1× PBS. Count 2 μL of the suspension using hemocytometer and get the concentration of clones.
-
e.Resuspend clones in 1× PBS with 10% Optiprep to a final concentration of 10,000 clones/mL.
-
f.Wash a magnetic stirring bar three times in 1× PBS. Put it in cell suspension.
-
a.
-
8.
Prepare RT lysis mix.
-
9.Prepare hydrogel barcoding beads.
-
a.Filter the hydrogel barcoding beads solution by a 70 μm strainer to remove aggregates and debris.
-
b.Centrifuge the hydrogel barcoding beads solution at 1500 rcf for 1 min.
-
c.Discard the buffer above the barcode beads pellet.
-
a.
-
10.Prepare microfluidics setup.
-
a.Install everything as shown in Figure 7. For more detailed instructions on the installation of the system, check the manual of FluigentTM (https://www.fluigent.com/).Note: In order to avoid blockage, we do not use the flow sensor for hydrogel barcode beads. But it is also possible to connect the flow sensor to monitor the flow rate.
-
b.Put a microfluidic device under the microscope. Check its channels for imperfections. (For example, impurity in channels, or adjacent channels sticking together, etc.)
-
c.Make sure there are at least 2 mL 2% HFE-7500 oil in the pressurized reservoir 15 mL tube.
-
d.Attach all reagents (lysis, barcodes, oil) and single clone suspension to the corresponding pressure controller. Make sure that the tubing reaches the bottom of the tubes.
-
e.Connect the cell mixer to the power supply. Add ice to the ice stand for cells.
-
f.Prepare collection plate: take a 96-well plate, for each sample prepare 4 wells for collection by adding 50 μL 2% HFE-7500 oil in the well.
-
g.Turn on the pressure controllers, open the A-i-O control software. Change all the flow rate units to μL/h. Set scale factors for different inlets: 4.3 for oil, 1 for RT lysis mix and single clone suspension. For the use of A-i-O software, check the manual of FluigentTM (https://www.fluigent.com/download/)
-
a.
Figure 7.

Microfluidic setup for CloneSeq
(A) Pressure controller. Use 69 mbar pump for carrier oil inlet, 345 mbar pump for RT lysis mix, cell and barcode bead inlets.
(B) Pressurized reservoir. Use 1.5 mL Eppendorf® Safe-Lock microcentrifuge tubes for RT lysis and hydrogel barcoding beads, 2 mL Eppendorf® Safe-Lock microcentrifuge tube for cell suspension, and 15 mL tube for 2% HFE-7500 oil.
(C) Cell mixer. The yellow square shows a zoom in on the MALDEX mix. The tube is surrounded by an ice stand, and the cell mixer is working outside of the tube towards the bottom of the tube to make the magnetic stirring bar agitate the cells and prevent sedimentation.
(D) Flow sensors. Use Flow unit size M for barcode, and size S for other inlets.
(E) Microfluidic device for CloneSeq. A zoom in on the design indicates the position for each inlet: (1) 2% HFE-7500 oil, (2) outlet for collection, (3) outlet for collection, (4) single clone suspension and (5) RT lysis mix.
(F) Collection plate. Place it in a cooling block.
(G) Control software for the microscope, zoom in on the junction for the generation of droplets.
(H) A-i-O software for flow control.
Barcoding of transcriptomes of single clones: Cell encapsulation
-
11.Run the microfluidic system.
-
a.For each of the inlets, before connecting the tubing to the device, apply maximum pressure to push the liquid to the end of tubing, and then stop the pressure.
-
b.Connect tubing to the microfluidic device according to the position shown in Figure 7. Put the outlet tubing into a collection tube.
-
c.In A-i-O software, press “edit mode”. Use "pressure mode" and set parameters as follows: oil 69 mbar, lysis 27 mbar, cell 27 mbar, barcode 100 mbar. Press “edit mode” again to start all inlets simultaneously. Wait until you see all the inlets arrive at the junction and drops are formed.Note: You are supposed to see a boundary between the cell suspension and RT lysis mix flows, like highlighted in Figure 8.
-
d.Keep oil and barcode inlets in pressure mode. Control them to achieve one barcode per droplet generated. Usually, the flow rate for oil will be around 350 μL/h and for barcode beads will be around 35–40 μL/h. To control cell and lysis flow, change to flow rate mode: cell 50–120 μL/h, lysis 70–120 μL/h. Troubleshooting 5CRITICAL: Keep lysis flow rate equal to the cell flow rate to ensure the transcriptome get enough RT reaction mix.
-
e.Take a short video to estimate encapsulation efficiency. Count the number of events of one clone and one barcode in one drop and divide by time. Troubleshooting 6
-
f.After having stable drops, put the collection tube into collection well plate. Count the time of collection to estimate the number of events per collection. Collect around 350 clones per well.
-
a.
-
12.Termination of the run.
-
a.Stop the pump.
-
b.Place the collection plate under UV lamp. Keep the plate about 3–5 cm under the lamp for 10 min.
-
c.Recycle barcodes.
-
i.Take a new 1.5 mL Eppendorf safe-lock tube, add 1 mL T10E0.1T0.1 buffer.
-
ii.Push all the buffer through the tubing used for barcodes and collect the buffer with the tube containing the unused barcodes.
-
iii.Wrap the tube with aluminum foil.
-
i.
-
a.
Figure 8.

Single clone encapsulation for transcriptome barcoding in drops
Red arrows indicate single clone and barcode beads. Yellow arrow indicates the separation line between cell suspension and RT lysis mix. Scale bar: 50 μm.
Barcoding of transcriptomes of single clones: Reverse transcription (RT) in drop
-
13.
Transfer the collection plate to a PCR machine and perform RT as follows:
| RT conditions | |||
|---|---|---|---|
| Steps | Temperature | Time | Cycles |
| cDNA synthesis | 50°C | 2 h | 1 |
| Denaturation | 70°C | 15 min | 1 |
| Hold | 4°C | Hold | |
Pause point: the cDNA can be stored at −20°C for up to 1 week.
Library preparation, sequencing, and data processing
-
14.
Follow the protocol reported previously (Zilionis et al., 2017) Troubleshooting 7
Expected outcomes
The encapsulated cells are expected to grow into a small clone after 3–7 days, based on the growth type of the module cell line. Figure 9 presents an example of ESCs after 3 days of culture. Since the hydrogel is degradable by the metalloproteinases secreted by cells, in some cases the cells could escape from the hydrogel and seed the tissue culture plate. If more than 80% of the cells are inside of hydrogels, it won’t interfere the next step, because escaped cells will adherent to the plate and won’t be able to be collected. But if most of the hydrogels are degraded, consider that the composition of the hydrogel is wrong, check Troubleshooting 2.
Figure 9.

ESCs in PEGDT-MALDEX hydrogel
Left picture shows the cells after encapsulation into hydrogel, right picture shows clones developed after 3 days of culture. The round-shaped cells are clones well defined in hydrogels, and cells with dendrites are cells that escaped from the hydrogel and grew on the tissue culture plate. Scale bars: 50 μm.
For the analysis of the clonal transcriptome, we have to remove the hydrogel first and extract the clones. After dextranase treatment, sinking and filtering, we obtain the single clone suspension ready for barcoding. As shown in Figure 10, the clones are expected to be intact. You may have some single cells as well, but after sinking they should be mostly removed.
Figure 10.

ESC clones extracted from hydrogels
Scale bars: 50 μm.
Quantification and statistical analysis
Sequencing and UMI-based filtering
It is recommended to give the sequencing depth of 80 million reads per clone.
-
1.
Perform paired-end sequencing on Illumina NextSeq 500, with 45 bp for read 1 and 35 bp for read 2.
-
2.
Use read 1 to obtain the sample barcode and UMI sequences and map read 2 to a reference transcriptome.
-
3.
Filter the reads first based on the presence of two sample barcode components separated by the W1 adapter sequence in Read 1.
-
4.
Match barcodes for each read against a list of the 3842 pre-determined barcodes, and correct errors of up to two nucleotides mismatch. Discard reads with a barcode separated by more than two nucleotides from the reference list.
-
5.
Split the reads into barcode-specific files.
Single clone alignment
-
6.
Align the reads using Bowtie2(Langmead et al., 2009) to the ENSEMBL GRCm39 mouse reference transcriptome.
-
7.
Filter the alignments from Bowtie as follows: (1) For each read, retain at most one alignment per gene, across all isoforms, by choosing the alignment closest to the end of the transcript. (2) If a read aligns to multiple genes, exclude any alignments more than 400 bp away from the end of the transcript. This step results in an approximately 5% increase in the number of final UMI reads obtained, as compared to simply discarding any ambiguous read. (3) If a read still aligns to more than two genes after UMI filtering, exclude the read altogether.
PCA and UMAP analysis
Analyze scRNA-seq data with Seurat v2.4 package(Stuart et al., 2019).
-
8.
Filter out the clones with less than 15,000 unique molecular identifiers for further analysis.
Note: We have applied CloneSeq to human cancer cell line (PC9) and mouse ESCs (R1), and we used the same threshold for both of them. For special cell lines with extremely different copy numbers of transcriptome, we recommend testing different threshold at the first time.
-
9.
Employ the global-scaling normalization method “LogNormalize” with a scale factor of 10,000.
-
10.
Identify highly variable genes by FindVariableFeatures() function with the following parameters: x.low.cutoff = 0.2, x.high.cutoff = 5, y.cutoff = 0.5, and y.high.cutoff = 10.
-
11.
Apply statistical approaches such as down sampling and linear transformation provided by Seurat package to overcome the confounders in the datasets, such as batch effect, cell alignment rate, alignment errors and clone sizes. Use ScaleData() function with default parameters.
-
12.
Perform linear dimensional reduction by RunPCA() on the scaled data with 15 principal components.
-
13.
Clusters cells by a graph-based clustering approach. First calculate the k-nearest neighbors (KNN) and then construct the KNN with FindNeighbors() function, use 15 principal components. Then apply a KNN modularity optimization-based clustering algorithm. Use FindClusters() function with resolution of 0.6.
-
14.
Run non-linear dimensional reduction. Use RunUMAP() with 15 principal components to generate UMAP for visualization.
Limitations
In the current protocol, we dissolve the hydrogel and profile intact clones. Hence, the CloneSeq is limited to cells that form cell-cell adhesions and remain physically connected outside the sphere. Secondly, the soft 3D-hydrogel microenvironment is highly supportive of the maintenance of a pluripotent state. Hence, using CloneSeq to study the exit from the pluripotent state would require adjustments and optimizations of the differentiation protocols.
Troubleshooting
Problem 1
When using the flow rate mode during the encapsulation of cells in PEGDT-MALDEX hydrogel, the flow pressures for PEGDT and MALDEX inlets raise up dramatically in a short time. Or seeing that the drops are formed not at the junction but close to the outlet for collection (step 4).
Potential solution
The hydrogel components start gelation in the tubing or in the microfluidic device, which cause an increase of the inner pressure in the tubing. You will need to remove the gelatinized part in the tubing. First, stop the run. Then, pull the tubing out from the device and push out some liquid. Finally change to a new device and restart the run.
Problem 2
No hydrogel spheres seen under microscope after encapsulation (step 5).
Potential solution
First, check the configuration of the microscope. Because the hydrogel spheres are transparent, it may be difficult to see the boundaries. Try to gently shake the well plate to see that the cells are moving with the surrounding hydrogel spheres. If you still do not see the hydrogels, it might be that the MALDEX and PEGDT were mixed in wrong proportions. Alternatively, the inlet preparation step or the microfluidic operation stage was flawed. Take 5 μL of each inlet and mix on a cover slip and mix it well, then wait 5 min at room temperature. If gelation is observed, then the proportion is correct.
Problem 3
Most of the cells die in the PEGDT-MALDEX hydrogel (step 6).
Potential solution
Change the recipe for the hydrogel components. Check the flow chart to help your decision (Figure 1).
Problem 4
No cell pellet after precipitation (step 7).
Potential solution
The clones may be small in size. Centrifuge at 100 rcf for 3 min to help clones sink.
Problem 5
No cells visible in the microfluidic device (step 11).
Potential solution
The cells may clog in the tubing or at the entrance to the microfluidic device. First, stop the run. Then, pull the tubing out from the device and push out some liquid. Insert the tubing back to the device and restart the run. If still no cells are flowing, consider that the clone concentration may not have been calculated correctly. You can concentrate the clone suspension by centrifuging at 100 rcf for 3 min, remove some liquid from the top, and resuspend the cell suspension.
Problem 6
Most of cells are single, not in clones (step 11).
Potential solution
The clones may break during the preparation of the single clone suspension. Try to treat the clone suspension gently, or reduce the number of pipetting. If that does not help, do not use the cell mixer during the run to help keep the entirety of the clone.
Problem 7
In the analysis of the data, the outcome number of unique molecular identifier (UMI) per cell is lower than expected (∼50 k/cell) (step 14).
Potential solution
There are several possible reasons for the low nUMI:
-
a.
Cell mixing occurred in the single clone encapsulation step. More than one barcode bead is encapsulated with a clone, so that each barcode is assigned with only a portion of the total transcriptome of the clone. This could happen either at the encapsulation stage, due to unregulated barcode pressure, or because of the merging of drops before or during the RT reaction. It is important to regulate the pressure to make sure only one barcode or less is encapsulated with a clone. You should also check the surfactant in the carrier oil, which is the key element to drop stability.
-
b.
The random hexamer used in the last RT before final PCR is not so “random”. In the last RT reaction random hexamers are used to generate libraries from all possible locations. But if the distribution of the hexamer sequences is not even, some locations of the template cDNA will not be reverse transcribed and eventually get lost in the final library. Consider changing your random hexamer to a fresh one.
-
c.
The cell type you used has a small amount of RNA. The amount of RNA is highly correlated to the size of the cell. If your cell is smaller than average, the number of transcripts that could be retrieved from it would be low. In this case, consider expanding the clones more to have transcripts to capture.
Resource availability
Lead contact
Further information and requests for resources and reagents should be directed to and will be fulfilled by the lead contact, Oren Ram (oren.ram@mail.huji.ac.il).
Materials availability
This study did not generate new unique reagents.
Acknowledgments
O.R. is supported by research grants from the European Research Council (ERC, # 715260 SC-EpiCode), Israeli Center of Research Excellence (I-CORE) program, Israel Science Foundation (ISF, #1618/16), Azrieli Foundation Scholar Program for Distinguished Junior Faculty, and Nofar (65883) of the Israel Innovation authority. This project has received funding from the European Union’s Horizon 2020 research and innovation program under the Marie Skłodowska-Curie grant agreement No 765966 - EpiSyStem.
Author contributions
Conceptualization and methodology, X.S., D.B., C.K., A.M., and O.R.; investigation, X.S., D.B., and C.K.; writing – original draft, X.S.; writing – review & editing, C.K., D.B., and O.R.; visualization, X.S.; resources, funding acquisition, and supervision, O.R.
Declaration of interests
The authors declare no competing interests.
Footnotes
Supplemental information can be found online at https://doi.org/10.1016/j.xpro.2021.100794.
Contributor Information
Xue Sun, Email: xue.sun@mail.huji.ac.il.
Danny Bavli, Email: danny.bavli@mail.huji.ac.il.
Oren Ram, Email: oren.ram@mail.huji.ac.il.
Supplemental information
Data and code availability
The accession number for the data reported in this paper is GEO: GSE155888
References
- Bavli D., Sun X., Kozulin C., Ennis D., Motzik A., Biran A., Brielle S., Alajem A., Meshorer E., Buxboim A. CloneSeq: A highly sensitive analysis platform for the characterization of 3D-cultured single-cell-derived clones. Dev. Cell. 2021;56:1–14. doi: 10.1016/j.devcel.2021.04.026. [DOI] [PubMed] [Google Scholar]
- Langmead B., Trapnell C., Pop M., Salzberg S.L. Ultrafast and memory-efficient alignment of short DNA sequences to the human genome. Genome Biol. 2009;10:R25. doi: 10.1186/gb-2009-10-3-r25. [DOI] [PMC free article] [PubMed] [Google Scholar]
- Mazutis L., Gilbert J., Ung W.L., Weitz D.A., Griffiths A.D., Heyman J.A. Single-cell analysis and sorting using droplet-based microfluidics. Nat. Protoc. 2013;8:870–891. doi: 10.1038/nprot.2013.046. [DOI] [PMC free article] [PubMed] [Google Scholar]
- Stuart T., Butler A., Hoffman P., Hafemeister C., Papalexi E., Mauck W.M., 3rd, Hao Y., Stoeckius M., Smibert P., Satija R. Comprehensive integration of single-cell data. Cell. 2019;177:1888–1902.e21. doi: 10.1016/j.cell.2019.05.031. [DOI] [PMC free article] [PubMed] [Google Scholar]
- Zilionis R., Nainys J., Veres A., Savova V., Zemmour D., Klein A.M., Mazutis L. Single-cell barcoding and sequencing using droplet microfluidics. Nat. Protoc. 2017;12:44–73. doi: 10.1038/nprot.2016.154. [DOI] [PubMed] [Google Scholar]
Associated Data
This section collects any data citations, data availability statements, or supplementary materials included in this article.
Supplementary Materials
Data Availability Statement
The accession number for the data reported in this paper is GEO: GSE155888