

ABSTRACT
Background
Short sleep durations are related to risks for obesity in preschool children. However, the underlying mechanism or mechanisms are not clear.
Objectives
We evaluated the relationships between sleep characteristics and body composition, energetics, and weight-regulating behaviors in preschool-aged children, as well as the longitudinal associations between children's sleep and eating patterns and body composition at a 1-year follow-up.
Methods
Data were drawn from a longitudinal study of 118 children aged 3–5 years. Sleep (duration, midpoint, regularity) and physical activity (PA) were measured by accelerometry over 6 consecutive days; total energy expenditure (TEE) was measured using the doubly labeled water method; body composition (fat mass, fat-free mass, and percent body fat) was measured by DXA; and dietary intake (energy intake, timing) was measured using two 24-hour recalls. Multivariable regression was used to estimate interindividual associations of sleep parameters with body composition, PA, TEE, and dietary outcomes and to examine the relationships between sleep and dietary behaviors and body composition 1 year later.
Results
Cross-sectionally, later sleep midpoint is associated with having a greater fat mass (0.33; 95% CI: 0.05, 0.60) and a higher percent body fat (0.92; 95% CI: 0.15, 1.70). Later sleep midpoint was associated with delayed morning mealtimes (0.51; 95% CI: 0.28, 0.74) and evening mealtimes (0.41; 95% CI: 0.29, 0.53), higher nighttime energy intakes (45.6; 95% CI: 19.7, 71.4), and lower morning energy intakes (−44.8; 95% CI: −72.0, −17.6). Longitudinally, shorter sleep duration (−0.02; 95% CI: −0.03, 0.00) and later meal timing (0.83; 95% CI: 0.24, 1.42) were associated with higher percent body fat measurements 1 year later.
Conclusions
Shorter sleep duration and later meal timing are associated with adiposity gains in preschoolers.
Keywords: sleep, obesity, physical activity, dietary behaviors, energy expenditure
Introduction
Short sleep duration has been linked to higher BMI z-scores (BMIz values) and elevated risks for obesity in young children (1–3). Furthermore, sleep duration has received the bulk of attention in assessments of risks for obesity, despite being only 1 component of sleep. Other dimensions of sleep, such as day-to-day regularity and timing, may impact the energy balance–related behaviors of young children [e.g., dietary patterns, physical activity (PA)]. Indeed, sleep patterns are maturing as children transition from multiple sleep periods per day to 1 consolidated sleep period at night. Moreover, the process of phasing out daytime naps (4) may contribute to greater variability in sleep schedules, as napping results in delayed sleep onset (5); thus, there may be greater opportunity for day-to-day shifts in young children's sleep. Later sleep timing and greater variability in sleep patterns may contribute to shorter sleep duration, especially among young children, who often fail to compensate for later bedtimes with later wake times (6–8).
It is possible that later sleep timing and greater day-to-day variability in sleep timing may result in the mistiming of sleep with the endogenous circadian clock, affecting the timing of other energy balance–related behaviors, including dietary patterns and PA. The misalignment of these behaviors with endogenous rhythms may result in metabolic changes and weight gain in children (9). Recent reviews have found that shorter duration is associated with poorer diets (10) but inconsistently related to PA in young children (11–13). Among adults, later sleep timing has been shown to contribute to a higher energy intake, adiposity, and having a greater fat mass (14–17). Because children's eating patterns (i.e., timing, energy intakes) are in part controlled by parental influences (e.g., food availability, timing of meals), it is unknown whether similar associations between later sleep timing and meal patterns are present among preschool-aged children.
We previously found that shorter sleep duration is associated with changes in fat mass over a 1-year period in preschool-aged children. The current study expands upon this previous observation (18) by considering novel pathways through which different dimensions of sleep may influence energetics, as well as the contributions of the timing of children's sleep and dietary patterns to changes in adiposity over time. We specifically aimed to examine the following: 1) the relationships between different components of sleep (duration, timing, and day-to day regularity) and children's body composition; total energy expenditure (TEE), measured by the doubly labeled water method; PA, measured by accelerometry; and energy intake and meal timing, measured by dietary recall; and 2) the longitudinal associations of different sleep components and dietary patterns with children's adiposity at a 1-year follow-up. Our primary hypothesis was that shorter sleep duration, later sleep timing, and more irregular sleep schedules would be associated cross-sectionally with having a greater fat mass and higher percent body fat measurements. Furthermore, our secondary hypothesis was that poorer sleep characteristics would be associated with less PA, TEE, higher energy intake, and later meal timing. An additional secondary hypothesis was that shorter sleep duration, later sleep timing, and more irregular sleep schedules would relate to greater 1-year increases in fat mass and percent body fat.
Methods
Study population
Healthy children aged 3 to 5 years who were without a major medical illness and living in the greater Houston area were recruited into this study. Flyers were posted at local clinics and preschool centers, and interested families contacted the study team to obtain information on the study opportunity. Children who were diagnosed with a chronic disease or had been prescribed medications that may affect growth or limit activity were excluded (Figure 1) (18). Preterm children were excluded due to differences in postnatal growth trajectories. The Institutional Review Board at Baylor College of Medicine approved the study protocol, and parents provided written informed consent to participate in this study.
FIGURE 1.
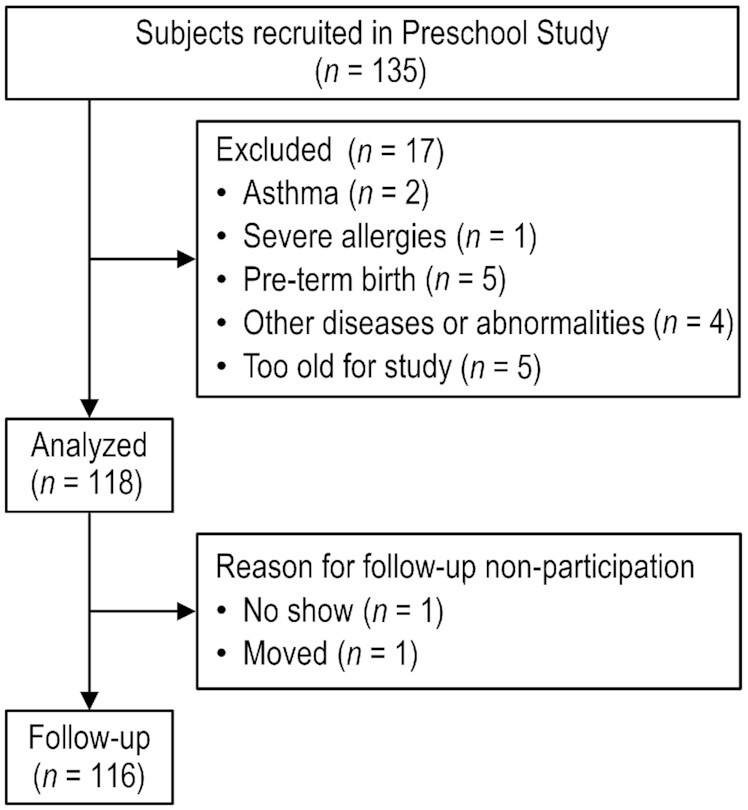
Flowchart of participant enrollment in the study.
Procedures
Parent-child dyads completed baseline and 1-year follow-up visits in the Children's Nutrition Research Center Metabolic Research Unit. At baseline, parents completed a demographics questionnaire and the first of two 24-hour dietary recalls for the child. Child anthropometric data were collected and a body composition assessment was completed. Detailed procedures for collecting urine samples each day over 1 week were described, in order to assess TEE via the doubly labeled water method, and the family was asked to have the child wear an accelerometer for the week following the visit. The second 24-hour dietary recall was completed during the week. At the end of the week following the visit, the urine samples were collected and the accelerometer data were downloaded. Children were studied throughout the year. Thirty-six were studied in the summer, 33 in the winter, 18 in the spring, and 28 in the fall. One year later, anthropometric and body composition measures were repeated.
Demographics questionnaire
Data on each child's age, sex, race and ethnicity, and time spent in childcare settings were obtained based on the parents’ report. The mother's age, height and weight (used to derive maternal BMI; kg/m2), family income, and number of people living in the home were also reported. The income-to-needs ratio was calculated, with values ≤1.0 considered to indicate the household was at or below the poverty level (19).
Anthropometrics and body composition
Child weight and height were measured using standardized procedures (18). Age- and sex-specific BMIz values and BMI percentiles were calculated using US growth references (20). Having a healthy weight was defined as having a BMI <85th percentile and having overweight or obesity was defined as having a BMI ≥85th percentile for age and sex (20). The fat-free and fat masses were measured using DXA (Delphi-A; Hologic).
Sleep and PA
Sleep and PA data were collected using the ActiGraph GT3X+ accelerometer (ActiGraph LLC) and an Actiheart monitor (CamNtech Ltd.). The accelerometer was worn on the child's right hip and the Actiheart was worn on the chest and secured with electrodes. Families were asked to have the child wear both monitors for 7 days and remove them for bathing and swimming. During the week of accelerometry data collection, the parents completed a sleep log to note the times the child went to bed and woke in the morning, as well as the periods of the day the device was removed for water-based activities. Upon return, data from both monitors were downloaded in 1-minute epochs and analyzed for missing wear time. A day was defined as the time from sleep onset of 1 day to sleep onset on the next day. A valid day required ≥1000 minutes of wear time—consistent with the criteria described by others (21, 22)—and having complete data was defined as having ≥4 valid days, including 1 weekend day. The last day of wear was excluded from analyses due to incomplete data. Approximately 89% of the sample had 6 days of complete data. The average wear time was 1410 ± 35 min/d (range: 1293–1527 min/d).
Sleep onset, offset, and nap times were identified by the parent-completed sleep log, visual inspection of 24-hour daily plots, and the epoch-by-epoch data. Sleep onset was defined as having ≥5 minutes of inactivity (vector magnitude counts at 0) and a gradual decline in heart rate, and sleep offset was defined as an abrupt increase in vector magnitude activity and heart rate. During visual inspection of the daily plots, we identified and removed periods of nonwear time. Wake after sleep onset was determined using the Sadeh algorithm (23, 24), which was also used to confirm observations of sleep onset and offset.. The sleep duration was defined as the period between sleep onset and sleep offset minus wake times after sleep onset. The sleep midpoint was defined as the halfway point between sleep onset and sleep offset for the nighttime sleep period. Mean values of sleep duration and midpoints were used in this study. The sleep regularity index—the probability of being asleep or awake at any 2 times that were 24 hours apart on any 2 consecutive days—was computed using Python code developed by Avery-Lunsford et al. (25). Values on the sleep regularity index range from 0–100, with higher scores indicating more consistent sleep-wake timing.
Minutes spent sedentary, doing light PA, and doing moderate to vigorous PA (MVPA) were defined according to published vector magnitude cut points (26). Similar to the sleep duration and midpoint values, mean values of the time spent sedentary, doing light PA, and doing MVPA were calculated.
Energy intake and meal timing by dietary recall
Two 24-hour recalls using the multiple-pass method were conducted and analyzed using the Nutrition Data Systems for Research software (Nutrition Coordinating Center, University of Minnesota). Parents were queried on their child's food and beverage intake. Recalls were analyzed to obtain the average daily energy consumption and the times of the first and last eating events. Although over-reporting of energy intake has been noted in studies of young children (27), 24-hour dietary recall was a more accurate method to estimate energy intake in children compared with the doubly labeled water method (28). Average energy intakes in the morning (06:00 to <10:00) and at night (19:00 to <06:00) were calculated using defined criteria (29).
Energy expenditure by doubly labeled water
TEE was measured over a 7-day period using the doubly labeled water method and was expressed as kilocalories per day, as described previously (18, 26).
Statistical analysis plan
Descriptive statistics, including means (SDs) and frequencies (%), were calculated to describe children's sleep, energetics, PA, and dietary behaviors. Linear relationships between dependent variables and the residuals, normality, and homogeneity of variance were examined. There was no collinearity between the 3 sleep predictor variables included in the model. Bivariate correlations were used to explore the relationships between sleep duration, sleep midpoints, and sleep regularity. Multiple regression was conducted to examine the cross-sectional relationships at baseline between all 3 sleep variables and body composition (i.e., fat mass and percent body fat). To better understand how children's sleep patterns influence energetics, we used multiple regression to model the associations between sleep duration, midpoint, and regularity together with TEE and minutes in sedentary, light, and MVPA as separate outcomes. We additionally examined the mean total energy intake, energy intakes in the morning and night, and the timing of the first and last eating events of the day as outcomes in separate models. Finally, multiple regression was used to test the longitudinal associations between children's sleep parameters and dietary patterns and body composition (fat mass and percent body fat) 1 year later while controlling for baseline fat mass and percent body fat in separate models.
Age, sex, race and ethnicity, income-to-needs ratio, childcare attendance, and BMIz data were included as covariates in the above models. Fat-free mass and fat mass were included as covariates in place of BMIz in the model that tested TEE as the outcome. The accelerometer wear time was controlled for in the analyses of sedentary, light PA, and MVPA times. The models were tested in Mplus Version 8.1 (Muthen & Muthen) and constructed using full-information maximum likelihood estimation.
Using multiple regression and power conditional on the model R², a sample size of 65 was considered to be the minimum sample size necessary to achieve 80% power to detect an R² of 0.08 attributed to the 3 independent variables (sleep duration, midpoints, and regularity) using an F-test with a significance level (alpha) of 0.05. The models were adjusted for additional covariates that increased the explained proportions of variance in the dependent variables.
Results
A total of 118 children were included in this study, with a mean ± SD age of 4.6 ± 0.9 years (Table 1). Half were male and 29% were non-Hispanic white, 29% were non-Hispanic black, 35% were Hispanic, and 7% were of another race and ethnicity. The majority were considered to have healthy weight. The mean sleep onset, offset, and midpoint times were at the following times of day: 22:16 (±1:32 hours), 07:42 (±1:20 hours), and 03:01 (±1:18 hours), respectively (Table 2). Nearly 79% of children took at least 1 nap and napped, on average, 39 ± 28 minutes. One-half of the sample met the National Sleep Foundation (30) recommendations for 10 to 13 hours of sleep based on the time in bed (duration from sleep onset to offset) plus nap duration. Later sleep midpoints were associated with poorer sleep regularity (r = −0.30; P < 0.05). There was a significant relationship between season and sleep onset, such that children studied in the summer had later sleep onset compared to children studied in the fall [F(3,114) = 3.85; P < 0.05], with a significant pairwise difference between youth studied during the summer (M = 22:79; SD: 1.91) relative to those who provided sleep data in the fall (M = 21:71; SD: 0.99).
TABLE 1.
Baseline characteristics for children and families for the total sample and by child age1
| 3 years (n = 38) | 4 years (n = 41) | 5 years (n = 39) | Total (N = 118) | |
|---|---|---|---|---|
| Age, years | 3.6 ± 0.3 | 4.5 ± 0.3 | 5.6 ± 0.3 | 4.6 ± 0.9 |
| Sex, % male | 53% | 49% | 49% | 50% |
| Race and ethnicity | ||||
| Non-Hispanic White | 18% | 37% | 31% | 29% |
| Non-Hispanic Black | 35% | 22% | 31% | 29% |
| Hispanic | 37% | 39% | 28% | 35% |
| Other or mixed race | 11% | 2% | 10% | 7% |
| Out of home childcare, % | 53% | 67% | 78% | 65% |
| Daycare, h/wk | 18.1 ± 19.5 | 21.0 ± 18.0 | 27.2 ± 16.7 | 22.1 ± 18.3 |
| BMI z-score | 0.2 ± 1.0 | 0.2 ± 1.1 | 0.2 ± 1.0 | 0.2 ± 1.0 |
| Weight status, % with overweight or obesity | 16% | 20% | 18% | 18% |
| Fat-free mass, kg | 11.2 ± 1.6 | 13.4 ± 2.1 | 15.1 ± 2.6 | 13.3 ± 2.7 |
| Fat mass, kg | 4.8 ± 1.8 | 5.1 ± 2.2 | 5.5 ± 2.0 | 5.1 ± 2.0 |
| Mother's age, y | 34.4 ± 8.2 | 34.1 ± 6.4 | 35.7 ± 7.2 | 34.7 ± 7.3 |
| Maternal BMI, kg/m2 | 29.9 ± 7.0 | 27.9 ± 5.5 | 29.1 ± 7.3 | 29.9 ± 6.6 |
| Income-to-needs ratio, % poverty | 16% | 18% | 26% | 20% |
Values are presented as means ± SDs or percentages.
TABLE 2.
Mean sleep parameters, physical activity, energy expenditure, and dietary intake behaviors for the total sample and by child age1
| 3 years | 4 years | 5 years | Total | |
|---|---|---|---|---|
| n = 38 | n = 41 | n = 39 | N = 118 | |
| Sleep | ||||
| Sleep onset, h:min | 22:28 ± 1:29 | 22:00 ± 1:30 | 22:24 ± 1:35 | 22:16 ± 1:32 |
| Sleep midpoint, h:min | 3:10 ± 1:18 | 2:50 ± 1:26 | 3:06 ± 1:28 | 3:01 ± 1:18 |
| Sleep offset, h:min | 7:49 ± 1:17 | 7:31 ± 1:23 | 7:49 ± 1:23 | 7:42 ± 1:20 |
| Time in bed, min | 557.8 ± 54.3 | 573.3 ± 44.8 | 566.6 ± 46.5 | 565.8 ± 48.7 |
| Wake after sleep onset, min | 56.5 ± 21.3 | 57.2 ± 22.4 | 46.7 ± 19.9 | 53.5 ± 21.6 |
| Total sleep duration, min | 551.2 ± 40.6 | 543.5 ± 43.4 | 535.2 ± 41.1 | 543.4 ± 41.8 |
| Sleep regularity index | 65.9 ± 8.5 | 70.3 ± 7.4 | 73.7 ± 8.5 | 69.9 ± 8.7 |
| Physical activity and energy expenditure | ||||
| Sedentary, min/d | 361.7 ± 75.0 | 369.9 ± 80.4 | 394.3 ± 56.0 | 375.2 ± 72.0 |
| Light physical activity, min/d | 385.6 ± 64.9 | 381.8 ± 53.4 | 381.1 ± 47.9 | 382.8 ± 55.5 |
| Moderate to vigorous physical activity, min/d | 52.8 ± 22.6 | 54.4 ± 30.0 | 53.4 ± 22.2 | 53.5 ± 24.9 |
| Total energy expenditure, kcal/d | 1079 ± 143 | 1239 ± 176 | 1277 ± 176 | 1197 ± 186 |
| Dietary intake | ||||
| Total energy intake, kcal/d | 1360 ± 326 | 1374 ± 277 | 1489 ± 316 | 1405 ± 308 |
| Morning energy intake, kcal/d | 294 ± 117 | 293 ± 116 | 307 ± 127 | 299 ± 119 |
| Nighttime energy intake, kcal/d | 352 ± 177 | 387 ± 202 | 409 ± 233 | 379 ± 207 |
| Time of first eating event, h:min | 8:49 ± 1:58 | 8:23 ± 1:38 | 8:31 ± 1:30 | 8:34 ± 1:38 |
| Time of last eating event, h:min | 19:19 ± 1:00 | 19:04 ± 1:08 | 19:11 ± 1:04 | 19:11 ± 1:04 |
Values are presented as means ± SDs.
The relationship of children's sleep patterns with body composition
Age was associated with having a greater fat mass ( B = 0.47; 95% CI: 0.11, 0.82) but lower percent body fat (−1.3; 95% CI: −2.38, −0.23). At baseline, being female was associated with having a greater fat mass (0.84; 95% CI: 0.28, 1.40) and a higher percent body fat (5.40; 95% CI: 3.67, 7.13). Relative to white children, black children had a lower fat mass (−1.34; 95% CI: −2.23, −0.46) and a lower percent body fat (−5.83; 95% CI: 8.25, −3.39), while the fat mass and percent body fat measurements of white and Hispanic children did not differ. Later sleep midpoints were associated with having a greater fat mass (0.33; 95% CI: 0.05, 0.60) and a higher percent body fat (0.92; 95% CI: 0.15, 1.70); (Table 3). Sleep duration and sleep regularity were not associated with measures of body composition.
TABLE 3.
Parameter estimates for the associations between sleep duration, midpoint, and regularity with body composition at baseline (N = 118)1
| Predictors | Fat mass, kg | Percent body fat |
|---|---|---|
| Effect estimate (95% CI) | ||
| Sleep duration, min/d | 0.00 (−0.01, 0.01) | −0.03 (−0.06, −0.01) |
| Sleep midpoint, hours/d | 0.33 (0.05, 0.60)2 | 0.92 (0.15, 1.70)2 |
| Sleep regularity,3 units | 0.00 (−0.04, 0.04) | 0.10 (−0.04, 0.24) |
All regression models were adjusted for age, sex, race and ethnicity, childcare attendance, and income-to-needs ratio, as well as sleep duration, midpoint, and regularity.
P < 0.05
The index scores range from 0 to 100, with higher scores reflecting more consistent sleep and wake timing.
The association between children's sleep patterns and other energy balance–related behaviors
Shorter sleep duration (−0.71; 95% CI: −1.20, −0.21) and later sleep midpoints (25.00; 95% CI: 9.20, 40.79) were associated with greater TEE (Table 4). Shorter sleep duration (−0.45; 95% CI: −0.69, −0.22) and greater sleep regularity (2.80; 95% CI: 1.65, 3.95) were associated with more time spent doing light PA. For every 1-hour decrease in sleep duration, an estimated 27 additional minutes was spent doing light PA, and a 1-unit increase in sleep regularity was associated with approximately 2–3 additional minutes of light PA. Later sleep midpoints were related to having a higher nighttime energy intake (45.58; 95% CI: 19.72, 71.43), a lower morning energy intake (−44.78; 95% CI: −71.97, −17.58), and delayed timing for both the first (0.51; 95% CI: 0.28, 0.74) and last (0.41; 95% CI: 0.29, 0.53) eating events in the day. Furthermore, a 1-hour delay in the sleep midpoint was associated with an estimated consumption increase of 46 calories at night and with consumption of 45 fewer calories in the morning. Additionally, for every 1-hour delay in the sleep midpoint, eating events were delayed by 25–31 minutes.
TABLE 4.
Parameter estimates for the average interindividual associations between sleep duration, midpoint, and regularity with energy expenditure, physical activity, and dietary intake (N = 118)1
| Outcomes | Sleep duration, min/d | Sleep midpoint, hours/d | Sleep regularity units2 |
|---|---|---|---|
| Effect estimate (95% CI) | |||
| Total energy expenditure,3 kcal/d | −0.71 (−1.20, −0.21)4 | 25.00 (9.20, 40.79)4 | 2.45 (−0.11, 5.01) |
| Sedentary time,5 min/d | −0.31 (−0.61, 0.00) | −5.24 (−14.51, 4.02) | −0.52 (−1.99, 0.95) |
| Light physical activity,5 min/d | −0.45 (−0.69, −0.22)6 | 4.09 (−2.40, 10.57) | 2.80 (1.65, 3.95)4 |
| Moderate to vigorous physical activity,5 min/d | −0.09 (−0.21, 0.04) | 0.30 (−3.69, 4.29) | 0.11 (−0.41, 0.33) |
| Total energy intake, kcal/d | −1.19 (−2.50, 0.11) | −7.70 (−50.19, 34.80) | 2.90 (−4.93, 10.74) |
| Morning energy intake, kcal/d | −0.29 (−0.87, 0.28) | −44.78 (−71.97, −17.58)6 | 0.24 (−3.14, 3.62) |
| Nighttime energy intake, kcal/d | −0.23 (−1.23, 0.78) | 45.58 (19.72, 71.43)6 | 2.33 (−2.41, 7.07) |
| Time of first eating event, hours/d | 0.00 (−0.01, 0.01) | 0.51 (0.28, 0.74)4 | 0.02 (−0.01, 0.06) |
| Time of last eating event, hours/d | −0.01 (−0.01, 0.00) | 0.41 (0.29, 0.53)4 | 0.00 (−0.02, 0.03) |
All regression models were adjusted for age, sex, race and ethnicity, childcare attendance, income-to-needs ratio, and BMI z-score, as well as sleep duration, midpoint, and regularity.
The index ranges from 0–100 with higher scores reflecting more consistent sleep and wake timing.
Adjusted for fat and fat-free masses but not BMI z-score.
P < 0.01.
Adjusted for accelerometer wear time.
P < 0.05.
Sensitivity analyses were conducted to examine each sleep predictor variable with each outcome, excluding mutual adjustment for the other sleep variables. Results were unchanged when sleep variables were examined in isolation of each other (data not shown). In addition, the sleep onset was substituted for the sleep midpoint in all analyses. The estimates between sleep onset and outcome variables were comparable to the estimates between the sleep midpoint and these variables. The only variable in which the magnitude of effect decreased was between sleep onset and fat mass (0.29; 95% CI: 0.02, 0.56).
The longitudinal relationship of children's sleep and dietary patterns to body composition
When examining the longitudinal associations between children's sleep and dietary patterns and body composition, only the fat mass at baseline was associated with the fat mass 1 year later (1.21; 95% CI: 1.12, 1.30; Table 5). In a similar model with percent body fat as the dependent variable, shorter sleep duration (−0.02; 95% CI: −0.03, 0.00) and later timing of the last meal of the day (0.83; 95% CI: 0.24, 1.42) at baseline independently contributed to percent body fat measurements 1 year later.
TABLE 5.
Parameter estimates for the longitudinal associations between sleep, dietary patterns, and body composition (N = 116)1
| Predictors | Fat mass, kg | Percent body fat |
|---|---|---|
| Effect estimate (95% CI) | ||
| Baseline fat mass, kg | 1.21 (1.12, 1.30)2 | — |
| Baseline percent body fat | — | 0.97 (0.89, 1.04)2 |
| Sleep duration, min/d | −0.04 (−0.09, 0.00) | −0.02 (−0.03, 0.00)3 |
| Sleep midpoint, hours/d | −0.04 (−0.19, 0.10) | −0.23 (−0.69, 0.23) |
| Sleep regularity,4 units | 0.01 (−0.01, 0.02) | 0.03 (−0.03, 0.08) |
| Total Energy Intake, kcal/d | 0.00 (−0.01, 0.00) | 0.01 (−0.01, 0.03) |
| Morning Energy Intake, kcal/d | 0.00 (−0.02, 0.02) | −0.03 (−0.09, 0.03) |
| Nighttime Energy Intake, kcal/d | 0.00 (−0.01, 0.01) | −0.01 (−0.04, 0.02) |
| Time of First Eating Event, hours/d | −0.01 (−0.14, 0.11) | −0.12 (−0.50, 0.27) |
| Time of Last Eating Event, hours/d | 0.17 (0.02, 0.33) | 0.83 (0.24, 1.42)* |
All regression models were adjusted for age, sex, race and ethnicity, childcare attendance, and income-to-needs ratio.
P < 0.01.
P < 0.05.
The index scores range from 0 to 100, with higher scores reflecting more consistent sleep and wake timing.
Discussion
The current study examined pathways through which the duration, timing, and regularity of preschoolers sleep patterns may be related to the risks for childhood obesity. Cross-sectionally, later sleep timing was associated with adiposity (fat mass and percent body fat); longitudinally, both shorter sleep duration and later meal timing were associated with greater adiposity 1 year later. These results are consistent with those previously observed by our research group (24). Sleep midpoints and regularity did not account for unique variance in change in children's adiposity, although we found an association between meal timing and percent body fat 1 year later.
The current study sought to expand upon our understanding of the relationship between sleep and adiposity by examining multiple dimensions of sleep behavior. We first explored the connections between sleep duration, sleep timing, and sleep regularity [as assessed by the sleep regularity index (35)]. Later sleep midpoints were related to lower sleep regularity. In addition, we observed that later sleep midpoints were linked with greater nighttime and lower morning energy intakes, as well as delayed timing of both the first and last eating occasions of the day. Furthermore, the relationships between sleep midpoints and eating behaviors demonstrated the largest effect sizes in the current study. Other relationships, such as the association between sleep regularity and doing light PA, while statistically significant, may not be clinically meaningful. Interestingly, meal patterns were not associated with sleep duration or sleep regularity, and later sleep midpoints were not associated with higher overall energy intakes. Though we cannot discern the directionality of these relationships, these cross-sectional findings underscore the interrelatedness of sleep midpoints and the timing of eating behaviors (31–34).
Later bedtimes have been correlated with breakfast skipping (35, 36), delayed meals (37), and higher evening energy consumption (37) in children. Several studies have reported that having a higher energy intake later in the day—as a proportion of total energy intake—is related to having a higher body fat percentage (38) and to prospective increases in BMIz values (39). The additional time awake in the evening due to later bedtimes likely provides more opportunities to eat, as was observed when children's energy intakes were compared between conditions of sleep restriction and sleep extension (40).
Though the exact mechanisms through which sleep and meal timing in the absence of increased total energy intake are related to adiposity gains is beyond the scope of the current study, we speculate that chronodisruption (i.e., the misalignment between the behavioral rhythms of sleep and meal patterns with endogenous circadian rhythms) may explain these associations (9, 14, 41–43). Eating later in the biological day may lead to changes in metabolism, resulting in exposure to higher evening blood glucose levels, with effects persisting through the next morning (44, 45). This may affect substrate utilization. Furthermore, diet-induced thermogenesis has been shown to be lower after later eating events (14, 46–49), suggesting that eating later may contribute to greater weight gain; however, these relationships have only been delineated in adults. Overall, the mechanisms through which shorter sleep and later meal timing affect adiposity among preschoolers is in need of further research.
Interestingly, shorter sleep duration was associated with greater TEE and more time spent doing light PA. While this may be due to time reallocation (i.e., the additional time awake may account for the higher energy expenditure), it is also possible that sleep restriction elevates energy expenditure through increased PA (50–52). In our recent work with youth, shorter sleep duration was similarly associated with higher activity energy expenditure by doubly labeled water (24). However, sleep duration was positively related to basal metabolic rates (BMRs; i.e., the major component of energy expenditure) evaluated by room calorimetry, such that shorter sleep duration was associated with having lower BMRs. Though the BMR was not assessed here, its relationship with sleep offers 1 possibility for the association between shorter sleep duration and greater weight gain. Future studies should examine the impact of sleep duration on BMR, and its impact on body composition.
In comparison, we found that sleep regularity was associated with more time spent doing light PA. The sleep regularity index is a novel measure used to characterize the consistency of sleep-wake schedules (25, 53–57). Greater intraindividual variability in children's sleep duration—a similar but distinct construct to sleep regularity—was related to greater energy, fat, and carbohydrate intakes (58) and consumption of sugar-sweetened beverages (59). In the current study, more consistent sleep patterns were associated with greater engagement in light PA, which parallels the positive associations between sleep regularity and PA in older adults (25) and school-aged children (60). Furthermore, in older adults, sleep irregularity correlated with 10-year risks of obesity, cardiometabolic disease, and dysglycemia (25).
The strengths of this study include its robust measurements and the recruitment of families from diverse backgrounds. In addition, we embraced a multidimensional approach to sleep health by studying 3 sleep characteristics in tandem. To this end, we calculated the novel sleep regularity index, a measure of day-to-day consistency of sleep-wake timing. Although this metric has not been validated with preschoolers, it allowed us to account for daytime napping and address the variability in sleep schedules inherent within this developmental period. A limitation of this work is that our analyses were conducted from the standpoint that poor sleep promotes obesogenic behaviors, which ultimately lead to greater weight gain. The reverse pattern of weight influencing sleep and relevant behaviors is equally important to consider. Second, our data are limited to a select sample of preschoolers, and research is needed to understand the generalizability of these findings. Third, it is possible that the use of a 1-minute epoch influenced the allocation of times spent in different levels of PA intensity. The use of a longer epoch may have incorrectly classified youth as participating in light PA while actually engaged in short bouts of MVPA. That said, a 1-minute epoch has been validated in preschoolers when comparing actigraphy to videosomnography (61). Fourth, residual confounding may account for some of the observed relationships. While we controlled for several important covariates, there are many factors (e.g., bedroom environment, food availability) that may be implicated in the relationships between sleep, PA, and eating behaviors that warrant rigorous statistical controls. In addition, we conducted a large number of statistical tests, which may have inflated our type 1 error rate. Fifth, the average sleep onset time of our sample was later, and SDs were larger, than those of estimates obtained by parent reports (62) or accelerometry (63–65) in other preschool samples, though our mean was consistent with at least 1 study that used accelerometry (66). We did find a significant relationship between season and sleep onset, such that children studied during summer had later sleep onset times compared to those studied during the fall. However, only one-third of children were studied in the summer, so it is unlikely that seasonality is the only driver of the late sleep onset times observed here. Although half of our sample met sleep duration recommendations based on accelerometry, the mean total sleep duration does appear comparable to other actigraphy estimates obtained for preschoolers (63, 65). Finally, while gold-standard assessments of dietary intake were utilized, these relied on parent reports, which are prone to error (28, 67). This may have limited our ability to fully understand the impacts of eating patterns on adiposity gains.
In summary, among healthy preschoolers, later sleep timing was associated with increased adiposity cross-sectionally. Additionally, going to bed later portended having a higher nighttime energy intake, lower morning energy intake, and delayed timing of both the first and last eating occasions of the day. Moreover, greater sleep regularity is linked to more time spent doing light PA. Longitudinally, shorter sleep duration and later meal timing were associated with having a higher percent body fat 1 year later. Overall, our findings suggest that earlier bedtimes may promote earlier meal timings, which may be protective of adiposity gain. Taken together, these results suggest promoting specific sleep patterns (e.g., adequate duration, earlier bedtimes to ensure the optimal timing of food intake) is of critical importance for obesity prevention efforts and is worthy of further research.
Acknowledgements
The authors’ responsibilities were as follows—ARG: analyzed the data and wrote the first draft of the manuscript; IJ: contributed to the data analyses and writing of the first draft of the manuscript; NFB, MRP, and ALA: conducted the research; JPM: contributed to the data interpretation, conceptual development of the research question, and writing of the manuscript; MRP and SM: contributed to the data analyses; FB: designed the research, oversaw the analysis plan and data interpretation, contributed to writing and editing of the manuscript, and had primary responsibility for the final content; and all authors; read and approved the final manuscript.
Author disclosures: JPM receives support from the Eunice Kennedy Shriver National Institute of Child Health & Human Development of the NIH (R00 HD091396). FB and NB report funding from the USDA/ Agricultural Research Services (FB and NB). FB received funding from AstraZeneca and Takeda through her institution for research not related to this work. All other authors report no conflicts of interest.
Notes
This work was made possible with grant funding from the USDA and Agricultural Research Service CRIS Awards 6250-5100-054 (to NFB) and 3092-5-001-057 (to FB).
The content is solely the responsibility of the authors and does not necessarily represent the official views of the NIH or the USDA and Agricultural Research Service.
Abbreviations: BMIz, BMI z-score; MVPA, moderate to vigorous physical activity; PA, physical activity; TEE, total energy expenditure.
Contributor Information
Amy R Goetz, Department of Pediatrics, USDA and Agricultural Research Service Children's Nutrition Research Center, Baylor College of Medicine, Houston, TX, USA; Department of Psychiatry and Behavioral Sciences, Baylor College of Medicine, Houston, TX, USA.
Ishita Jindal, Department of Pediatrics, USDA and Agricultural Research Service Children's Nutrition Research Center, Baylor College of Medicine, Houston, TX, USA; Division of Pediatric Endocrinology and Diabetes, Texas Children's Hospital, Department of Pediatrics, Baylor College of Medicine, Houston, TX, USA.
Jennette P Moreno, Department of Pediatrics, USDA and Agricultural Research Service Children's Nutrition Research Center, Baylor College of Medicine, Houston, TX, USA.
Maurice R Puyau, Department of Pediatrics, USDA and Agricultural Research Service Children's Nutrition Research Center, Baylor College of Medicine, Houston, TX, USA.
Anne L Adolph, Department of Pediatrics, USDA and Agricultural Research Service Children's Nutrition Research Center, Baylor College of Medicine, Houston, TX, USA.
Salma Musaad, Department of Pediatrics, USDA and Agricultural Research Service Children's Nutrition Research Center, Baylor College of Medicine, Houston, TX, USA.
Nancy F Butte, Department of Pediatrics, USDA and Agricultural Research Service Children's Nutrition Research Center, Baylor College of Medicine, Houston, TX, USA.
Fida Bacha, Department of Pediatrics, USDA and Agricultural Research Service Children's Nutrition Research Center, Baylor College of Medicine, Houston, TX, USA; Division of Pediatric Endocrinology and Diabetes, Texas Children's Hospital, Department of Pediatrics, Baylor College of Medicine, Houston, TX, USA.
Data Availability
Data described in the manuscript, code book, and analytic code will be made available upon request pending application and approval.
References
- 1. Patel SR, Hu FB. Short sleep duration and weight gain: a systematic review. Obesity (Silver Spring). 2008;16(3):643–53. [DOI] [PMC free article] [PubMed] [Google Scholar]
- 2. Fatima Y, Doi S, Mamun A. Longitudinal impact of sleep on overweight and obesity in children and adolescents: a systematic review and bias-adjusted meta-analysis. Obes Rev. 2015;16(2):137–49. [DOI] [PubMed] [Google Scholar]
- 3. Miller MA, Kruisbrink M, Wallace J, Ji C, Cappuccio FP. Sleep duration and incidence of obesity in infants, children, and adolescents: a systematic review and meta-analysis of prospective studies. Sleep. 2018;41(4):zsy018. [DOI] [PubMed] [Google Scholar]
- 4. Galland BC, Taylor BJ, Elder DE, Herbison P. Normal sleep patterns in infants and children: a systematic review of observational studies. Sleep Med Rev. 2012;16(3):213–22. [DOI] [PubMed] [Google Scholar]
- 5. Thorpe K, Staton S, Sawyer E, Pattinson C, Haden C, Smith S. Napping, development and health from 0 to 5 years: a systematic review. Arch Dis Child. 2015;100(7):615–22. [DOI] [PubMed] [Google Scholar]
- 6. Nixon GM, Thompson JM, Han DY, Becroft DM, Clark PM, Robinson Eet al. Short sleep duration in middle childhood: risk factors and consequences. Sleep. 2008;31(1):71–8. [DOI] [PMC free article] [PubMed] [Google Scholar]
- 7. Moreno JP, Razjouyan J, Lester H, Dadabhoy H, Amirmazaheri M, Reesor-Oyer Let al. Later sleep timing predicts accelerated summer weight gain among elementary school children: a prospective observational study. Int J Behav Nutr Phys Act. 2021;18(1):94. [DOI] [PMC free article] [PubMed] [Google Scholar]
- 8. Wickersham L. Time-of-day preference for preschool-aged children. Chrestomathy. 2006;5:259–68. [Google Scholar]
- 9. Moreno JP, Crowley SJ, Alfano CA, Hannay KM, Thompson D, Baranowski T. Potential circadian and circannual rhythm contributions to the obesity epidemic in elementary school age children. Int J Behav Nutr Phys Act. 2019;16(1):25. [DOI] [PMC free article] [PubMed] [Google Scholar]
- 10. Ward AL, Reynolds AN, Kuroko S, Fangupo LJ, Galland BC, Taylor RW. Bidirectional associations between sleep and dietary intake in 0–5 year old children: a systematic review with evidence mapping. Sleep Med Rev. 2020;49:101231. [DOI] [PubMed] [Google Scholar]
- 11. Kreitsch KN, Chardon ML, Beebe DW, Janicke DM. Sleep and weight-related factors in youth: a systematic review of recent studies. Sleep Med Rev. 2019;(46):87–96. [DOI] [PubMed] [Google Scholar]
- 12. Janssen X, Martin A, Hughes AR, Hill CM, Kotronoulas G, Hesketh KR. Associations of screen time, sedentary time and physical activity with sleep in under 5s: a systematic review and meta-analysis. Sleep Med Rev. 2020;49:101226. [DOI] [PMC free article] [PubMed] [Google Scholar]
- 13. Antczak D, Lonsdale C, Lee J, Hilland T, Duncan MJ, del Pozo Cruz Bet al. Physical activity and sleep are inconsistently related in healthy children: a systematic review and meta-analysis. Sleep Med Rev. 2020;(51):101278. [DOI] [PubMed] [Google Scholar]
- 14. McHill AW, Phillips AJ, Czeisler CA, Keating L, Yee K, Barger LKet al. Later circadian timing of food intake is associated with increased body fat. Am J Clin Nutr. 2017;106(5):1213–9. [DOI] [PMC free article] [PubMed] [Google Scholar]
- 15. McHill AW, Wright KP Jr.. Role of sleep and circadian disruption on energy expenditure and in metabolic predisposition to human obesity and metabolic disease. Obes Rev. 2017;18(Suppl 1):15–24. [DOI] [PubMed] [Google Scholar]
- 16. Thomas EA, Zaman A, Cornier MA, Catenacci VA, Tussey EJ, Grau Let al. Later meal and sleep timing predicts higher percent body fat. Nutrients. 2020;13(1):73. [DOI] [PMC free article] [PubMed] [Google Scholar]
- 17. St-Onge MP, Pizinger T, Kovtun K, RoyChoudhury A. Sleep and meal timing influence food intake and its hormonal regulation in healthy adults with overweight/obesity. Eur J Clin Nutr. 2019;72(S1):76–82. [DOI] [PMC free article] [PubMed] [Google Scholar]
- 18. Butte NF, Puyau MR, Wilson TA, Liu Y, Wong WW, Adolph AL, Zakeri IF. Role of physical activity and sleep duration in growth and body composition of preschool-aged children. Obesity (Silver Spring). 2016;24(6):1328–35. [DOI] [PMC free article] [PubMed] [Google Scholar]
- 19. El-Sheikh M, Bagley EJ, Keiley M, Elmore-Staton L, Chen E, Buckhalt JA. Economic adversity and children's sleep problems: multiple indicators and moderation of effects. Health Psychol. 2013;32(8):849. [DOI] [PMC free article] [PubMed] [Google Scholar]
- 20. Kuczmarski RJ, Ogden CL, Grummer-Strawn LM, Flegal KM, Guo SS, Wei Ret al. CDC growth charts: United States. Adv Data. 2000;314:1–27. [PubMed] [Google Scholar]
- 21. Graef DM, Janicke DM, McCrae CS. Sleep patterns of a primarily obese sample of treatment-seeking children. J Clin Sleep Med. 2014;10(10):1111–7. [DOI] [PMC free article] [PubMed] [Google Scholar]
- 22. Krietsch KN, Armstrong B, McCrae CS, Janicke DM. Temporal associations between sleep and physical activity among overweight/obese youth. J Pediatr Psychol. 2016;41(6):680–91. [DOI] [PMC free article] [PubMed] [Google Scholar]
- 23. Sadeh A, Sharkey M, Carskadon MA. Activity-based sleep-wake identification: an empirical test of methodological issues. Sleep. 1994;17(3):201–7. [DOI] [PubMed] [Google Scholar]
- 24. Jindal I, Puyau M, Adolph A, Butte N, Musaad S, Bacha F. The relationship of sleep duration and quality to energy expenditure and physical activity in children. Pediatr Obes. 2021;16(6):e12751. [DOI] [PubMed] [Google Scholar]
- 25. Lunsford-Avery JR, Engelhard MM, Navar AM, Kollins SH. Validation of the sleep regularity index in older adults and associations with cardiometabolic risk. Sci Rep. 2018;8(1):14158. [DOI] [PMC free article] [PubMed] [Google Scholar]
- 26. Butte NF, Wong WW, Lee JS, Adolph AL, Puyau MR, Zakeri IF. Prediction of energy expenditure and physical activity in preschoolers. Med Sci Sports Exerc. 2014;46(6):1216. [DOI] [PMC free article] [PubMed] [Google Scholar]
- 27. Fisher JO, Butte NF, Mendoza PM, Wilson TA, Hodges EA, Reidy KCet al. Overestimation of infant and toddler energy intake by 24-h recall compared with weighed food records. J Clin Nutr. 2008;88(2):407–15. [DOI] [PubMed] [Google Scholar]
- 28. Burrows TL, Martin RJ, Collins CE. A systematic review of the validity of dietary assessment methods in children when compared with the method of doubly labeled water. J Am Diet Assoc. 2010;110(10):1501–10. [DOI] [PubMed] [Google Scholar]
- 29. McDonald L, Wardle J, Llewellyn CH, Johnson L, van Jaarsveld CH, Syrad Het al. Sleep and nighttime energy consumption in early childhood: a population-based cohort study. Pediatr Obes. 2015;10(6):454–60. [DOI] [PMC free article] [PubMed] [Google Scholar]
- 30. Hirshkowitz M, Whiton K, Albert SM, Alessi C, Bruni O, DonCarlos Let al. National Sleep Foundation's sleep time duration recommendations: methodology and results summary. Sleep Health. 2015;1(1):40–3. [DOI] [PubMed] [Google Scholar]
- 31. Golley RK, Maher C, Matricciani L, Olds T. Sleep duration or bedtime? Exploring the association between sleep timing behaviour, diet and BMI in children and adolescents. Int J Obes. 2013;37(4):546–51. [DOI] [PubMed] [Google Scholar]
- 32. Arora T, Taheri S. Associations among late chronotype, body mass index and dietary behaviors in young adolescents. Int J Obes. 2015;39(1):39–44. [DOI] [PubMed] [Google Scholar]
- 33. Jansen EC, Peterson KE, Lumeng JC, Kaciroti N, LeBourgeois MK, Chen Ket al. Associations between sleep and dietary patterns among low-income children attending preschool. J Acad Nutr Diet. 2019;119(7):1176–87. [DOI] [PMC free article] [PubMed] [Google Scholar]
- 34. Honkala S, Behbehani JM, Honkala E. Daily consumption of sugary drinks and foods as a behavioural risk for health of adolescents in Kuwait. Oral Health Prev Dent. 2012;10(2):113–22. [PubMed] [Google Scholar]
- 35. Yaginuma S, Sakuraba K, Kadoya H, Koibuchi E, Matsukawa T, Ito Het al. Early bedtime associated with the salutary breakfast intake in Japanese nursery school children. Int Med J. 2015;22(1):30–2. [Google Scholar]
- 36. Thivel D, Isacco L, Aucouturier J, Pereira B, Lazaar N, Ratel Set al. Bedtime and sleep timing but not sleep duration are associated with eating habits in primary school children. J Dev Behav Pediatr. 2015;36(3):158–65. [DOI] [PubMed] [Google Scholar]
- 37. Spaeth AM, Hawley NL, Raynor HA, Jelalian E, Greer A, Crouter SEet al. Sleep, energy balance, and meal timing in school-aged children. Sleep Med. 2019;60:139–44. [DOI] [PMC free article] [PubMed] [Google Scholar]
- 38. Maffeis C, Provera S, Filippi L, Sidoti G, Schena S, Pinelli Let al. Distribution of food intake as a risk factor for childhood obesity. Int J Obes. 2000;24(1):75–80. [DOI] [PubMed] [Google Scholar]
- 39. Thompson O, Ballew C, Resnicow K, Gillespie C, Must A, Bandini Let al. Dietary pattern as a predictor of change in BMI z-score among girls. Int J Obes. 2006;30(1):176–82. [DOI] [PubMed] [Google Scholar]
- 40. Hart CN, Carskadon MA, Considine RV, Fava JL, Lawton J, Raynor HAet al. Changes in children's sleep duration on food intake, weight, and leptin. Pediatrics. 2013;132(6):e1473–80. [DOI] [PubMed] [Google Scholar]
- 41. Bray MS, Young ME. Circadian rhythms in the development of obesity: potential role for the circadian clock within the adipocyte. Obes Rev. 2007;8(2):169–81. [DOI] [PubMed] [Google Scholar]
- 42. Bray MS, Young ME. Chronobiological effects on obesity. Curr Obes Rep. 2012;1(1):9–15. [DOI] [PMC free article] [PubMed] [Google Scholar]
- 43. Coomans CP, Lucassen EA, Kooijman S, Fifel K, Deboer T, Rensen PCet al. Plasticity of circadian clocks and consequences for metabolism. Diabetes, Obesity & Metabolism. 2015;17(Suppl 1):65–75. [DOI] [PubMed] [Google Scholar]
- 44. Leung GKW, Huggins CE, Bonham MP. Effect of meal timing on postprandial glucose responses to a low glycemic index meal: a crossover trial in healthy volunteers. Clin Nutr. 2019;38(1):465–71. [DOI] [PubMed] [Google Scholar]
- 45. Tsuchida Y, Hata S, Sone Y. Effects of a late supper on digestion and the absorption of dietary carbohydrates in the following morning. J Physiol Anthropol. 2013;32(1):9. [DOI] [PMC free article] [PubMed] [Google Scholar]
- 46. Bo S, Fadda M, Castiglione A, Ciccone G, De Francesco A, Fedele Det al. Is the timing of caloric intake associated with variation in diet-induced thermogenesis and in the metabolic pattern? A randomized cross-over study. Int J Obes. 2015;39(12):1689–95. [DOI] [PubMed] [Google Scholar]
- 47. McHill AW, Melanson EL, Higgins J, Connick E, Moehlman TM, Stothard ERet al. Impact of circadian misalignment on energy metabolism during simulated nightshift work. Proc Natl Acad Sci. 2014;111(48):17302–7. [DOI] [PMC free article] [PubMed] [Google Scholar]
- 48. Morris CJ, Garcia JI, Myers S, Yang JN, Trienekens N, Scheer FA. The human circadian system has a dominating role in causing the morning/evening difference in diet-induced thermogenesis. Obesity. 2015;23(10):2053–8. [DOI] [PMC free article] [PubMed] [Google Scholar]
- 49. Romon M, Edme JL, Boulenguez C, Lescroart JL, Frimat P. Circadian variation of diet-induced thermogenesis. Am J Clin Nutr. 1993;57(4):476–80. [DOI] [PubMed] [Google Scholar]
- 50. Klingenberg L, Chaput J-P, Holmbäck U, Jennum P, Astrup A, Sjödin A. Sleep restriction is not associated with a positive energy balance in adolescent boys. Am J Clin Nutr. 2012;96(2):240–8. [DOI] [PubMed] [Google Scholar]
- 51. Patterson RE, Emond JA, Natarajan L, Wesseling-Perry K, Kolonel LN, Jardack Pet al. Short sleep duration is associated with higher energy intake and expenditure among African-American and non-Hispanic white adults. J Nutr. 2014;144(4):461–6. [DOI] [PMC free article] [PubMed] [Google Scholar]
- 52. McNeil J, Doucet É, Brunet J-F, Hintze LJ, Chaumont I, Langlois Éet al. The effects of sleep restriction and altered sleep timing on energy intake and energy expenditure. Physiol Behav. 2016;164:157–63. [DOI] [PubMed] [Google Scholar]
- 53. Li A, Chen S, Quan SF, Silva GE, Ackerman C, Powers LSet al. Sleep patterns and sleep deprivation recorded by actigraphy in 4th-grade and 5th-grade students. Sleep Med. 2020;67:191–9. [DOI] [PubMed] [Google Scholar]
- 54. Phillips AJ, Clerx WM, O'Brien CS, Sano A, Barger LK, Picard RWet al. Irregular sleep/wake patterns are associated with poorer academic performance and delayed circadian and sleep/wake timing. Sci Rep. 2017;7(1):3216. [DOI] [PMC free article] [PubMed] [Google Scholar]
- 55. Carskadon MA, Chappell KR, Barker DH, Hart AC, Dwyer K, Gredvig-Ardito Cet al. A pilot prospective study of sleep patterns and DNA methylation-characterized epigenetic aging in young adults. BMC Res Notes. 2019;12(1):583. [DOI] [PMC free article] [PubMed] [Google Scholar]
- 56. Murray JM, Phillips AJ, Magee M, Sletten TL, Gordon C, Lovato Net al. Sleep regularity is associated with sleep-wake and circadian timing, and mediates daytime function in Delayed Sleep-Wake Phase Disorder. Sleep Med. 2019;58:93–101. [DOI] [PubMed] [Google Scholar]
- 57. Brooks AT, Raju S, Barb JJ, Kazmi N, Chakravorty S, Krumlauf Met al. Sleep regularity index in patients with alcohol dependence: daytime napping and mood disorders as correlates of interest. Int J Environ Res Public Health. 2020;17(1):331. [DOI] [PMC free article] [PubMed] [Google Scholar]
- 58. He F, Bixler EO, Berg A, Kawasawa YI, Vgontzas AN, Fernandez-Mendoza Jet al. Habitual sleep variability, not sleep duration, is associated with caloric intake in adolescents. Sleep Med. 2015;16(7):856–61. [DOI] [PMC free article] [PubMed] [Google Scholar]
- 59. Kjeldsen JS, Hjorth MF, Andersen R, Michaelsen KF, Tetens I, Astrup Aet al. Short sleep duration and large variability in sleep duration are independently associated with dietary risk factors for obesity in Danish school children. Int J Obes. 2014;38(1):32–9. [DOI] [PubMed] [Google Scholar]
- 60. Stone MR, Stevens D, Faulkner GE. Maintaining recommended sleep throughout the week is associated with increased physical activity in children. Prev Med. 2013;56(2):112–7. [DOI] [PubMed] [Google Scholar]
- 61. Sitnick SL, Goodlin-Jones BL, Anders TF. The use of actigraphy to study sleep disorders in preschoolers: some concerns about detection of nighttime awakenings. Sleep. 2008;31(3):395. [DOI] [PMC free article] [PubMed] [Google Scholar]
- 62. Mindell JA, Sadeh A, Kwon R, Goh DY. Cross-cultural differences in the sleep of preschool children. Sleep Med. 2013;14(12):1283–9. [DOI] [PubMed] [Google Scholar]
- 63. Kahn M, Schnabel O, Gradisar M, Rozen GS, Slone M, Atzaba-Poria Net al. Sleep, screen time and behaviour problems in preschool children: an actigraphy study. Eur Child Adolesc Psychiatry. 2020;(30):1793–802. [DOI] [PubMed] [Google Scholar]
- 64. Goodlin-Jones BL, Tang K, Liu J, Anders TF. Sleep patterns in preschool-age children with autism, developmental delay, and typical development. J Am Acad Child Adolesc Psychiatry. 2008;47(8):930–8. [DOI] [PubMed] [Google Scholar]
- 65. Iwasaki M, Iwata S, Iemura A, Yamashita N, Tomino Y, Anme Tet al. Utility of subjective sleep assessment tools for healthy preschool children: a comparative study between sleep logs, questionnaires, and actigraphy. J Epidemiol. 2010;20(2):143–9. [DOI] [PMC free article] [PubMed] [Google Scholar]
- 66. Lam JC, Mahone EM, Mason TB, Scharf SM. Defining the roles of actigraphy and parent logs for assessing sleep variables in preschool children. Behav Sleep Med. 2011;9(3):184–93. [DOI] [PMC free article] [PubMed] [Google Scholar]
- 67. Wallace A, Kirkpatrick SI, Darlington G, Haines J. Accuracy of parental reporting of preschoolers' dietary intake using an online self-administered 24-h recall. Nutrients. 2018;10(8):987. [DOI] [PMC free article] [PubMed] [Google Scholar]
Associated Data
This section collects any data citations, data availability statements, or supplementary materials included in this article.
Data Availability Statement
Data described in the manuscript, code book, and analytic code will be made available upon request pending application and approval.