

Abstract
INTRODUCTION
Cranial computed tomography (CT) is an affordable and widely available imaging modality that is used to assess structural abnormalities, but not to quantify neurodegeneration. Previously we developed a deep‐learning–based model that produced accurate and robust cranial CT tissue classification.
MATERIALS AND METHODS
We analyzed 917 CT and 744 magnetic resonance (MR) scans from the Gothenburg H70 Birth Cohort, and 204 CT and 241 MR scans from participants of the Memory Clinic Cohort, Singapore. We tested associations between six CT‐based volumetric measures (CTVMs) and existing clinical diagnoses, fluid and imaging biomarkers, and measures of cognition.
RESULTS
CTVMs differentiated cognitively healthy individuals from dementia and prodromal dementia patients with high accuracy levels comparable to MR‐based measures. CTVMs were significantly associated with measures of cognition and biochemical markers of neurodegeneration.
DISCUSSION
These findings suggest the potential future use of CT‐based volumetric measures as an informative first‐line examination tool for neurodegenerative disease diagnostics after further validation.
Highlights
Computed tomography (CT)–based volumetric measures can distinguish between patients with neurodegenerative disease and healthy controls, as well as between patients with prodromal dementia and controls.
CT‐based volumetric measures associate well with relevant cognitive, biochemical, and neuroimaging markers of neurodegenerative diseases.
Model performance, in terms of brain tissue classification, was consistent across two cohorts of diverse nature.
Intermodality agreement between our automated CT‐based and established magnetic resonance (MR)–based image segmentations was stronger than the agreement between visual CT and MR imaging assessment.
Keywords: brain segmentation, cognition, CSF biomarkers, CT, deep learning, dementia, plasma biomarkers
1. INTRODUCTION
Neurodegenerative diseases are characterized by a progressive loss of neuronal integrity and function as well as by molecular abnormalities, leading to cognitive decline and dementia. 1 , 2 The most established biomarkers for neurodegenerative diseases include cerebrospinal fluid (CSF) measures of neuronal injury, 3 brain atrophy measured on structural MR images, 4 , 5 , 6 , 7 , 8 and positron emission tomography (PET) imaging of brain glucose metabolism, as well as disease‐specific measures of amyloid beta (Aβ) and tau. 9 , 10 However, these methods are expensive, invasive, or available only in specialized care centers. Brain imaging modalities such as CT and recently established blood‐plasma–derived biomarkers 11 , 12 can address the issue of cost and availability to some extent. With increased diagnostic utility, CT and plasma biomarkers may become scalable and cost–effective alternatives for neurodegenerative disease diagnostics.
CT is a fast, low‐cost, and widely available imaging modality and an alternative for patients who cannot undergo a magnetic resonance (MR) examination. 13 CT‐based visual ratings are comparable to those obtained from MR imaging with regard to certain pathomorphological characteristics, and they are correlated significantly with cognitive test results. 13 , 14 However, MR imaging (MRI) is extensively used for high‐resolution atrophy assessment and brain volumetry 15 , 16 , 17 due to its stronger soft‐tissue contrast. Atrophy assessment in CT is conducted through semi‐quantitative visual ratings, a subjective, time‐consuming approach that requires a trained expert. Recent studies have explored state‐of‐the‐art techniques such as deep learning in automatic cranial CT segmentation. 18 , 19 We previously used MR‐based tissue class segmentations to train deep‐learning models to perform tissue classification on cranial CT images. 20 In that study, models based on deep learning called U‐Nets 21 were trained to segment gray matter (GM), white matter (WM), CSF, and intracranial volume (ICV) in cranial CT images. Although the segmentation results agreed strongly with those of the reference methods, the question of clinical utility was relegated to future work.
In the present study, we assessed the diagnostic performance of CT‐based brain tissue classification by (1) obtaining volumetric measures from CT‐based tissue class maps, (2) evaluating the ability of these measures to distinguish patients with neurodegenerative disorders from healthy study participants, and (3) exploring the relationship between these measures and cognition, as well as relevant blood and CSF biomarkers. The results will help to assess the potential of automatic CT image analysis, along with other easily accessible and scalable diagnostic tools such as blood biomarkers, for clinical diagnostic applications.
2. MATERIALS AND METHODS
2.1. Data sets
2.1.1. Gothenburg H70 Birth Cohort
The Gothenburg H70 Birth Cohort studies are a series of epidemiological investigations carried out periodically since 1971 on large, representative samples of those residents of Gothenburg, Sweden who turn 70 during a particular period. 22 We used data from the 2014–2016 iteration, which included n = 1203 participants in total. CT images were available for n = 917 participants (Figure 1). As expected, a large majority of these (99%; n = 904) were cognitively normal.
FIGURE 1.
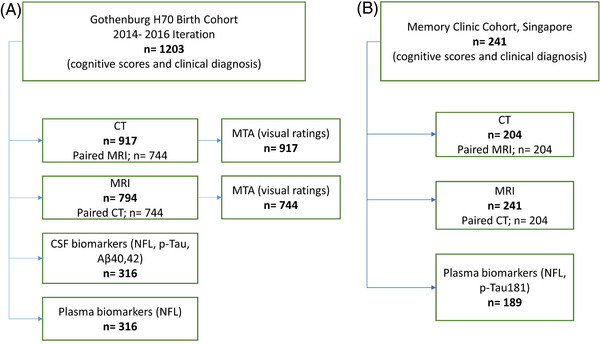
Flowchart showing the details of (A) the Gothenburg H70 Birth Cohort and (B) Memory Clinic Cohort, Singapore. Aβ, amyloid beta; CSF, cerebrospinal fluid; CT, computed tomography; MRI, magnetic resonance imaging; MTA, medial temporal atrophy; NfL, neurofilament light; p‐tau, phosphorylated tau (Color print).
RESEARCH IN CONTEXT
Systematic review: We reviewed the literature using traditional sources (PubMed, Google Scholar). Automated cranial computed tomography (CT) brain tissue classification approaches for brain atrophy assessment and brain volumetry are currently underexplored. The diagnostic performance and association of CT‐based volumetric measures with existing biomarkers of neurodegenerative diseases are yet to be evaluated. Previously, we developed a model based on deep learning to perform robust cranial CT segmentation using magnetic resonance (MR)–based labels.
Interpretation: Our study highlights the association of CT‐based volumetric measures with existing cognitive, biochemical, and other neuroimaging markers. Our findings suggest the potential application of CT‐based volumetric measures as a screening tool for patients with dementia and prodromal dementia from cognitively normal individuals.
Future directions: CT‐based volumetric measures have potential utility in neurodegenerative disease diagnosis. This potential should be explored further through longitudinal studies.
Of these 917 participants, 79% (n = 744) underwent MR scanning within a day of CT scanning. All imaging examinations were conducted at Aleris Röntgen Annedal in Gothenburg (Aleris Group AB, Stockholm, Sweden). A 64‐slice Ingenuity CT system (Philips Medical Systems, Best, The Netherlands) was used for CT acquisition, and an Achieva system (3 Tesla; Philips Medical Systems) was used for MRI. Informed consent had been obtained from the participants, and safety procedures were conducted through interviews. An experienced radiologist performed visual ratings of medial temporal atrophy (MTA) on all available CT and MR scans.
Demographic data, past medical history, and neuropsychological assessments were also obtained from all included individuals. CSF biomarkers of neurodegeneration and Alzheimer's disease (AD) pathophysiology (neurofilament light [NfL], phosphorylated tau [p‐tau], Aβ40, and Aβ42) were available for 34% (n = 316) of participants with CT. Details of CSF sampling and analyses are provided in Rydberg Sterner et al. 22 , 23 , 24 Plasma NfL concentration was measured at the University of Gothenburg Clinical Neurochemistry Laboratory (Mölndal, Sweden) using the NF‐Light Advantage kit on a Simoa HD‐1 instrument (Quanterix, Billerica, MA, USA). 25 , 26
2.1.2. Memory clinic Cohort, Singapore
Furthermore, we included patients from the Memory Clinic Cohort of the National University Hospital, Singapore (age 73.98 ± 8.2 years, 51% female), which comprised patients with dementia, patients with prodromal dementia, and cognitively normal individuals (see Table 1 and Figure 1 for details).
TABLE 1.
Demographics of the individuals from the Gothenburg H70 Birth Cohort and Singaporean Memory Clinic Cohort from whom CT data sets were included.
| CT datasets | ||||
|---|---|---|---|---|
| Singaporean Memory Clinic Cohort | ||||
| Variable |
H70 Birth Cohort CN n = 917 |
Dementia n = 93 | Prodromal dementia n = 89 | CN n = 22 |
| Age (years) | 70.46 ± 2.34 | 76 ± 7.7 | 74 ± 8.6 | 68 ± 6.4 |
| Gender, female (n) | 484 | 55 | 37 | 8 |
| Education (years) | 13 ± 4.3 | 7.3 ± 2.6 | 7.1 ± 4.5 | 9.52 ± 4.49 |
| ICV (liters) | 1.66 ± 0.21 | 1.82 ± 0.41 | 1.76 ± 0.47 | 1.69 ± 0.46 |
| MMSE | 28.9 ± 1.85 | 15.13 ± 4.21 | 23.52 ± 3.39 | 27.05 ± 2.08 |
| GM (liters) | 0.77 ± 0.03 | 0.69 ± 0.06 | 0.75 ± 0.07 | 0.79 ± 0.07 |
| WM (liters) | 0.59 ± 0.03 | 0.66 ± 0.08 | 0.69 ± 0.07 | 0.69 ± 0.06 |
| GM adjusted for CSF | 0.77 ± 0.07 | 0.67 ± 0.09 | 0.76 ± 0.11 | 0.85 ± 0.12 |
| GM adjusted for VCSF | 0.78 ± 0.09 | 0.66 ± 0.09 | 0.75 ± 0.12 | 0.83 ± 0.11 |
| BV adjusted for CSF | 1.36 ± 0.14 | 1.16 ± 0.15 | 1.28 ± 0.15 | 1.38 ± 0.14 |
| BV adjusted for VCSF | 1.36 ± 1.7 | 1.15 ± 0.16 | 1.29 ± 0.14 | 1.36 ± 0.13 |
| Biochemical markers | |||||
|---|---|---|---|---|---|
| Gothenburg H70 Birth Cohort | Singaporean Memory Clinic Cohort | ||||
| Variable | n = 316 | Variable | Dementia n = 70 | Prodromal dementia n = 72 | CN n = 14 |
| Plasma NfL (pg/mL) | 25.12 ± 25.57 | Plasma NfL (pg/mL) | 46.08 ± 47.15 | 28.84 ± 16.29 | 27.43 ± 30.71 |
| CSF NfL (pg/mL) | 906.3 ± 952.5 | Plasma p‐Tau 181 (pg/mL) | 3.86 ± 2.23 | 3.29 ± 1.99 | 2.62 ± 1.22 |
| CSF p‐tau (pg/L) | 334.04 ± 49.6 | ||||
| CSF Aβ40 (pg/mL) | 6208.6 ± 1383.47 | ||||
| CSF Aβ42 (pg/mL) | 715.44 ± 225.559 | ||||
Note: All values are mean ± SD.
Abbreviations: Aβ, amyloid beta; BV, brain volume; CN, cognitively normal; CSF, cerebrospinal fluid; ICV, intracranial volume; MMSE, Mini‐Mental State Examination; NfL, neurofilament light; p‐tau, phosphorylated tau.
We included 204 cranial CT images (dementia, n = 93; prodromal dementia, n = 89; cognitively normal, n = 22) and 241 MR (dementia, n = 109; prodromal dementia, n = 105; cognitively normal, n = 26) images for our study. For all CT images, paired MR images were available. CT scans were performed using a 256 multislice CT scanner (Philips Medical Systems; slice collimation: 30×0.625 mm for CT brain, kVp: 120, mAs: mA modulation with reference mAs of 300) at the National University Hospital, Singapore. MR scans were performed on a Magnetom Trio Tim scanner (3 Tesla; Siemens Healthineers AG, Erlangen, Germany), using a 32‐channel head coil, at the Clinical Imaging Research Centre, National University of Singapore.
Demographic data, past medical history, and clinical diagnoses were obtained. Dementia diagnoses were based on results from clinical assessment and neuropsychological tests. Plasma biomarkers (NfL, p‐tau181) were available for n = 189/241 and Aβ status based on PET‐based visual assessments was available for n = 96/241 participants with available MR images. Plasma p‐tau181 and NfL were measured using the commercially available Simoa pTau‐181 Advantage V2 kits and Simoa NF‐light Advantage kits, respectively, on the Simoa HD‐1 Analyser, per manufacturer's instructions (Quanterix, Billerica, MA, USA).
2.2. Image processing and analysis
2.2.1. Obtaining volumetric measures from CT using models based on deep learning
Previously, we trained U‐Net–based models to differentiate tissue classes (GM, WM, CSF, and ICV) on cranial CT. 20 For the present study, we developed U‐Net models to derive ventricular CSF (VCSF) maps from cranial CT images. Please refer to Supplementary Material A1 for the summary of the model development. Altogether five classes were derived from all CT scans using these models based on deep learning: GM, WM, CSF, VCSF, and ICV. The models were deployed using TensorFlow 2.0 and Keras 2.3.1 run on Nvidia GeForce RTX 2080 Ti GPU. Tissue class volumes were determined from the segmentation maps obtained using deep learning. Total brain volume (BV) was obtained by summation of GM and WM tissue class volumes. In addition, regression‐based adjusted brain tissue volumetric measures were obtained by regressing out the effect of CSF/VCSF from GM/BV 27 , 28 (Figure 2). Based on the previous literature, 16 , 29 , 30 six volumetric measures were obtained from the CT segmentation maps: GM, WM, BV adjusted for CSF, BV adjusted for VCSF, GM adjusted for CSF, and GM adjusted for VCSF.
FIGURE 2.
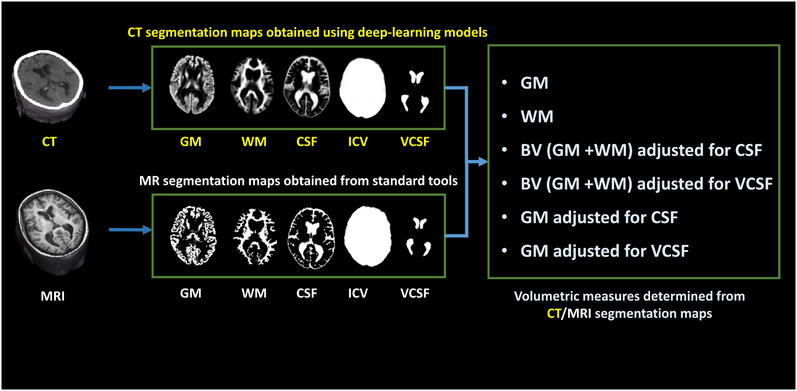
Imaging‐based volumetric measures. The CT‐based GM, WM, CSF, ICV and VCSF maps were automatically segmented using deep‐learning techniques. The MR images were automatically segmented to GM, WM, and CSF maps using SPM12, ICV map using Pincram, and VCSF map using MAPER. Six volumetric measures were determined from these segmentation maps. CSF/VCSF adjusted BV/GM volumetric measures were obtained using regression‐based adjustment of the respective brain tissue volumes. CSF, cerebrospinal fluid; CT, computed tomography; ICV, intracranial volume; GM, gray matter; MRI, magnetic resonance imaging; WM, white matter; VCSF, ventricular cerebrospinal fluid (Color print).
2.2.2. Obtaining volumetric measures from MRI
In the Singaporean Memory Clinic Cohort, we segmented 241 MRI data sets into GM, WM, and CSF using the unified segmentation routine in SPM12 (https://www.fil.ion.ucl.ac.uk/spm/software/spm12). 31 VCSF and medial temporal lobe (MTL) volumes were measured using the multi‐atlas‐based segmentation tool MAPER, 32 and ICV was measured using Pincram. 33 These analyses yielded GM, WM, BV adjusted for CSF, BV adjusted for VCSF, GM adjusted for CSF, GM adjusted for VCSF, and MTL from MR data (Figure 2).
2.3. Statistical analyses
We compared the volumetric agreement of CT‐based segmentations with MR‐based segmentations in the Singaporean Memory Clinic Cohort using intraclass correlation tests. The volumetric similarity of CT‐ and MR‐based segmentations in the Gothenburg H70 Birth Cohort had been tested in our previous work. 20
We further tested associations between the six CT‐based volumetric measures (CTVMs) and CSF biomarkers (NfL, p‐tau, Aβ42/40, and Aβ42) and plasma NfL in the Gothenburg H70 Birth Cohort, as well as with plasma biomarkers (NfL, p‐tau181) in the Singaporean Memory Clinic Cohort. In both cohorts, we also tested the relationships of CTVMs with measures of cognition (Mini‐Mental State Examination [MMSE] and Clinical Dementia Rating Sum of Boxes [CDR‐SB]). The Shapiro–Wilk test was used to examine the Gaussian distribution of the continuous variables in our data (p value > 0.05). The cognition measures (MMSE, CDR‐SB), raw fluid biomarker concentrations, and CTVMs were not normally distributed. Hence, the associations between these variables were tested using non‐parametric tests. Partial Spearman correlations between CTVMs and other markers of neurodegeneration were employed after adjustment for ICV, age, education, and gender. In the Singaporean Memory Clinic Cohort, we compared CTVMs between diagnoses using Kruskal–Wallis tests. Diagnostic accuracy was assessed by measuring the area under the receiver‐operating characteristic (ROC) curve (AUC) along with a 95% bootstrap confidence interval. 34 In addition, we computed the AUC of predicted probabilities from a logistic‐regression‐based combined model of all six CTVMs. For comparison in the same cohort, we also tested the relationship between MR‐based volumetric measures and clinical diagnoses, using the same tests and analytic procedures that were used for evaluating CTVMs. After conducting the Kruskal–Wallis tests and AUC analysis on MR‐based volumetric measures, the diagnostic performance of CT‐ and MR‐based volumetric measures was compared. In addition, to understand the relationship between CTVMs and visual atrophy assessments in the Gothenburg H70 Birth Cohort, we tested the conformity of (1) CT‐GM with MR‐GM and MR‐MTA and (2) CT‐MTA with MR‐MTA and MR‐GM using intraclass correlation tests (conformity was calculated from a single measurement and by using a two‐way model). The statistical significance threshold was set at p = 0.05. All statistical analyses were performed using IBM SPSS Statistics 27 (IBM Corp, Armonk, NY, USA) or R version 4.0.3 (2021). 35
3. RESULTS
Table 1 lists demographic information, CTVMs, and biochemical biomarker data for all participants from both cohorts. In the Singaporean Memory Clinic Cohort, mean age and education levels were comparable among diagnostic groups. As expected, patients with dementia performed worse on the MMSE than healthy participants (15.13 ± 4.21 vs 27.05 ± 2.08), and mean plasma NfL levels were higher in patients with dementia than in cognitively normal individuals (46.08 ± 47.15 pg/mL vs 27.43 ± 16.29 pg/mL) or Gothenburg H70 Birth Cohort cognitively normal participants (46.08 ± 47.15 pg/mL vs 25.12 ± 25.57 pg/mL).
CTVMs were derived from segmentation maps obtained from brain tissue classification of CT images using models based on deep learning. The models segmented CT images in GM, WM, CSF, VCSF, and ICV in less than 1 minute. In the Singaporean Memory Clinic Cohort, CT volumes correlated strongly with corresponding MR volumes (intraclass correlation coefficient [ICC] of 0.93, 0.86, and 0.81 for GM, WM, and CSF tissue classes, respectively; Figure S1) indicating that CT‐based volumes are comparable to MR‐based volumes determined from established segmentation algorithms. In the Gothenburg H70 Birth Cohort, the inter‐modality kappa coefficient between visual ratings of MTA from CT and MR scans performed by a trained rater was 0.40 for the right hemisphere and 0.43 for the left. It is notable that the conformity between CT‐ and MR‐based GM volumes (ICC = 0.93, p < 0.001) was stronger than the conformity between CT‐ and MR‐based MTA scores (ICC = 0.53, p < 0.001 [left hemisphere], ICC = 0.48, p < 0.001 [right hemisphere]) (Table S1).
3.1. CT‐based volumetric measures across diagnostic groups
In the Singaporean Memory Clinic Cohort, we found that CTVMs could distinguish dementia patients from cognitively normal subjects (CT‐GM adjusted for CSF: AUC = 0.87, 95% confidence interval [CI]: 0.79, 0.96; Figure 3A) yielding AUC values that were equal to or slightly lower than MR‐based measurements (MR‐BV adjusted for CSF, AUC: 0.91, 95% CI: 0.85, 0.96). CT‐based GM volume also yielded AUC values comparable to MR‐based MTL volume when distinguishing patients with dementia from cognitively normal individuals (CT‐GM: AUC = 0.86, MR‐MTL: AUC = 0.86; Figure S2). Predicted probabilities from logistic‐regression–based combined models of various CT volumetric measures yielded higher AUC values in comparison individual CTVMs (for combined model with all CTVMS, AUC: 0.95, 95% CI: 0.91, 0.99, Figure 3) and comparable AUCs from logistic‐regression‐based combined models of various MR volumetric measures (AUC: 0.95).
FIGURE 3.
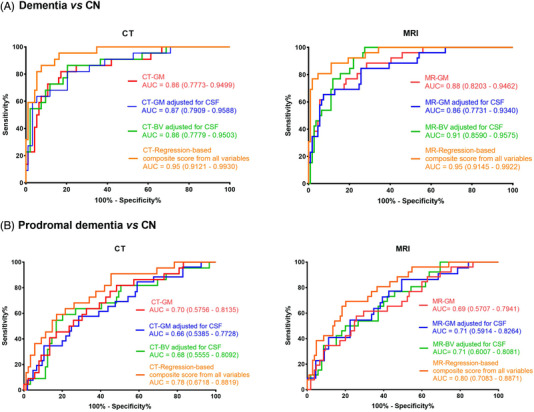
ROC curves for (A) dementia versus CN and (B) prodromal dementia versus CN using CT‐ and MR‐based volumetric measures in the Memory Clinic Cohort, Singapore (n = 204). All volumes were adjusted for intracranial volume. The ROC curves of variables with AUC above 0.6 are shown. AUC, area under the curve, BV, brain volume; CSF, cerebrospinal fluid; CN, cognitively normal; GM, gray matter; ROC, receiver‐operating characteristic (Color print).
Of interest, CTVMs and regression‐based predicted probabilities of CTVMs could distinguish patients with prodromal dementia (CT‐GM: AUC = 0.7, 95% CI: 0.57, 0.81) from cognitively normal individuals reasonably well (Figure 3B, Figure 4), with performance comparable to MR‐based volumetric measures (MR‐BV adjusted for CSF, AUC: 0.71, 95% CI: 0.60, 0.81). Figure 3 and Figure S2 show the ROC curves of various measures for distinguishing between diagnostic groups.
FIGURE 4.
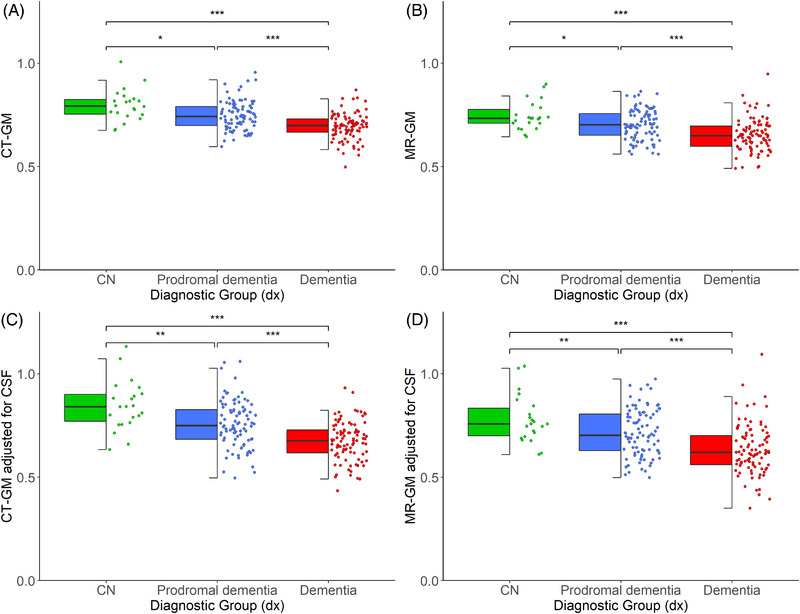
Distribution of CT‐ and MR‐based volumetric measures across diagnostic groups in the Memory Clinic Cohort, Singapore (n = 204). ***p < 0.001, **p < 0.01, *p < 0.05; uncorrected p‐values derived from Kruskal–Wallis test. All volumes were adjusted for intracranial volume. BV, brain volume; CN, cognitively normal; CSF, cerebrospinal fluid; GM, gray matter (Color print).
Overall, CTVMs differentiated robustly and significantly between the various diagnostic groups, with mean CTVMs being lowest in patients with dementia, followed by prodromal dementia and highest in the cognitively normal group (Figure 4). The distribution of CTVMs across various diagnostic groups was comparable to that of MR‐based volumetric measures (Figure 4).
3.2. CT‐based volumetric measures and cognition
In the Singaporean Memory Clinic Cohort, CTVMs were significantly associated with measures of cognitive impairment as indicated on CDR‐SB and MMSE scores (Table S2). Higher CDR‐SB and lower MMSE correlated with smaller GM volumes (ρ = −0.44, p < 0.001 and ρ = 0.42, p < 0.001, respectively; Figure 5). In the cognitively normal individuals from the Gothenburg H70 Birth Cohort, CTVMs were significantly, yet more weakly, correlated with CDR‐SB and MMSE scores (Table S3).
FIGURE 5.
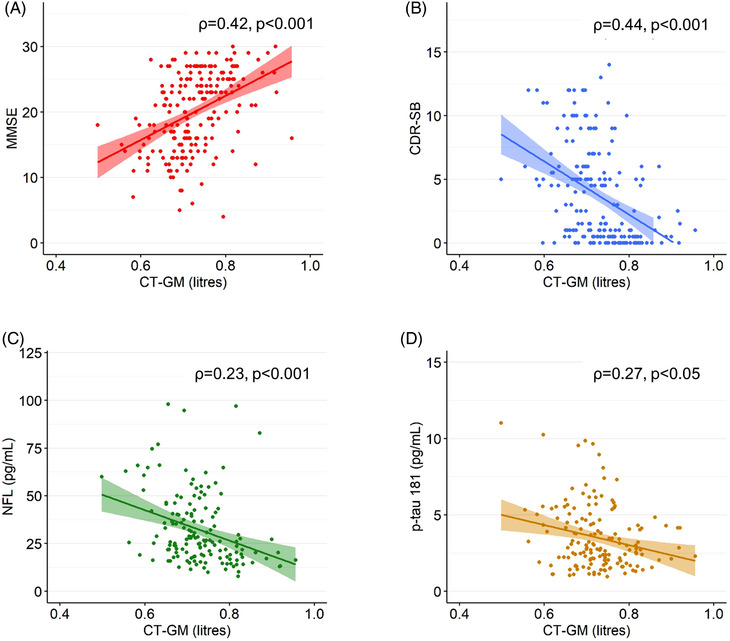
CT‐ and MR‐based volumes with other neurodegenerative disease biomarkers. Correlation of CT‐ and MR‐based GM volumes with (A) MMSE, (B) CDR‐SB, (C) plasma NfL, and (D) plasma p‐tau181 in the Memory Clinic Cohort, Singapore (n = 204). The correlation values (ρ) were obtained from partial rank correlation analysis between CT‐based volumetric measures and other biomarkers controlled for intracranial volume, age, gender and education. CDR‐SB, Clinical Dementia Rating Sum of Boxes; GM, gray matter; MMSE, Mini‐Mental State Examination; MR, magnetic resonance; NfL, neurofilament light; p‐tau, phosphorylated tau (Color print).
3.3. CT‐based volumetric measures and their association with biochemical disease markers in plasma and CSF
In the Singaporean Memory Clinic Cohort, CTVMs were significantly associated with plasma‐based NfL and p‐tau181 (Table S2, Figure 5). The strongest correlations were seen with plasma NfL (ρ = −0.33, p < 0.001, using CT‐BV adjusted for VCSF). In the cognitively normal individuals from the Gothenburg H70 Birth Cohort, CTVMs were moderately correlated with plasma levels of NfL (ρ = −0.09, p = 0.004, using GM), and CSF levels of NfL, Aβ42, t‐tau, p‐tau, and notably, Aβ42/40 (ρ = 0.18, p = 0.002, using CT‐BV adjusted for VCSF).
4. DISCUSSION
Cranial CT images contain valuable information for characterizing neurodegenerative disease that can be extracted quantitatively with automatic image analysis. The present study is the first to demonstrate comprehensively that quantitative imaging markers automatically obtained from CT images corroborate the results of standard diagnostic methods used in clinical research and practice. The measurements were enabled by training a dedicated deep neural network with suitable data sets (CT images plus tissue class maps obtained through classical MR image analysis). Once trained, the model works effectively on pure CT data, enabling quantitative assessment of structural brain integrity in persons who have not undergone MR scanning. Although runtime behavior was not assessed systematically, the results suggest that processing time does not pose an obstacle to clinical use. We demonstrated this effectiveness on CT images of 1121 participants in two distinct cohorts, one sampled from an elderly population (n = 917) and one from individuals consulting a memory clinic (n = 204). Enabling CT‐based assessment of neurodegeneration has important clinical potential, as CT scanners are more widely available than MR equipment, and CT is often suitable even for patients with contraindications for MR scanning.
We investigated the association of CT‐based volumetric measures with established markers of neurodegenerative diseases. Our main findings are that CT imaging biomarkers obtained through volumetric analysis based on deep learning (1) differentiate between patients and healthy controls, with similar performance as when using MR‐based measures; and (2) strongly correlate with relevant cognitive, biochemical, and neuroimaging markers of neurodegenerative diseases associated with dementia. Together, these findings indicate that CT‐based volumetric measures are promising imaging markers for the primary assessment of neurodegenerative diseases.
The first key finding of this study is that CTVMs differentiated between various diagnostic groups with high accuracy. The distribution pattern of CTVMs across various diagnostic groups is consistent with findings from previous studies. 16 , 36 , 37 In the patients with prodromal dementia, we measured volumes that were larger than those of the dementia groups, but smaller than those of the cognitively normal group. An interesting finding is that CTVMs differentiated between prodromal dementia and cognitively normal groups (AUC: 0.70, Figure 3b, Figure 4), indicating a potential application in the screening of dementia and neurodegeneration. Among the six volumetric measures derived from the five direct CT volumetric measures, GM, GM adjusted for CSF, and BV adjusted for CSF showed the strongest performance in differentiating between diagnostic groups. Predicted probabilities from logistic‐regression–based combined models of various CTVMs yielded the highest AUCs values in comparison individual CTVMs in distinguishing both dementia and prodromal dementia from cognitively normal individuals.
The second key finding of our study is that CTVMs are associated with cognition and biochemical markers of neurodegenerative disorders. In both cohorts, lower CT‐based volumes were associated with lower MMSE scores and with higher levels of CDR‐SB. Other studies have shown that higher levels of plasma and CSF NfL correlate with lower MMSE scores, decreased brain volume, and reduced cortical thickness. 38 , 39 We found significant indirect correlations between levels of plasma NfL and CTVMs. In the Gothenburg H70 Birth Cohort, higher levels of CSF NfL were correlated with lower levels of CTVMs. Studies by Karikari et al., 40 Moscoso et al., 41 and Wang et al. 42 similarly showed inverse correlations between plasma p‐tau181 and smaller brain volumes. In the Singaporean Memory Clinic Cohort, higher levels of plasma p‐tau181 were correlated with lower CTVMs. Together, our findings suggest that CTVMs correlate well with clinical and biochemical measures. Among the six CT‐based volumetric measures GM, GM adjusted for CSF, BV adjusted for VCSF, and GM correlated VCSF correlated with most biochemical markers of neurodegeneration in the Singaporean Memory Clinic Cohort (Table S2), as did GM adjusted for VCSF, GM adjusted for CSF, BV adjusted for VCSF, and BV adjusted for CSF in the Gothenburg H70 Birth Cohort (Table S3).
We further found that CT‐based volumetric measures correlate strongly with MR‐based measures and display comparable diagnostic performance, notably also compared with MR‐MTL (Figure S2), the most established quantitative measure of medial temporal lobe atrophy. 43 , 44 , 45 Atrophy of the MTL is an important diagnostic biomarker of many neurodegenerative disorders, most specifically in AD. 44 , 46 , 47 Furthermore, we found that the intermodality agreement between our automated CT‐ and established MRI‐segmentations was distinctly stronger than the agreement between visual CT and MRI assessment. In the Gothenburg H70 Birth Cohort, the intermodality kappa coefficient between visual ratings of MTA from CT and MR scans performed by a trained rater was 0.40 for the right hemisphere and 0.43 for the left hemisphere, and the ICC between CT‐MTA and MR‐MTA was 0.48 and 0.53 for the right hemisphere and left hemisphere, respectively. The volumetric ICC between CT‐GM and MR‐GM obtained from our automated and established MR‐based methods was 0.93 for the same data sets. Currently, brain structure integrity in CT is evaluated predominantly using visual assessments, whereas MRI is preferred for differential diagnosis and atrophy assessment. Our findings emphasize that with further validation, automatic CT image analysis could be used potentially for the evaluation of brain structure integrity in the first‐line examination of cognitive decline, with faster and more reproducible results than visual ratings, while showing performance comparable to that of MRI. Our deep‐learning models perform tissue classification on head CT images in less than 1 minute.
A major aspect of our study is that we investigated the association of CT‐based volumetric measures with established and novel markers of neurodegenerative diseases (blood‐ and CSF‐based as well as measures of cognition) in two large, well‐characterized cohorts for which paired CT and MRI data were available. The first cohort consisted predominantly of cognitively normal participants, and the other consisted of various diagnosis groups of dementia. This allowed us to train our deep‐learning models on the predominantly healthy cohort and validate the models on both cohorts. By having access to both CT and MR scans of the same subjects, we were able to validate the structural similarity of CT‐based segmentation maps and compare the classification performance of CTVMs in both cohorts. Of interest, the deep‐learning models developed in our previous study 17 worked well on the Singaporean Memory Clinic Cohort without reference to MRI data and without further training. One of the widely discussed limitations of deep‐learning models is the relative lack of reproducibility. 48 In our study, the trained model was remarkably successful when applied to previously unseen data sets acquired on other scanners.
Limitations of our study include that we had amyloid status (96 of 241) available only for a fraction of the Memory Clinic Cohort. Hence, the clinical diagnoses of patients reported in this study are likely a reflection of cognitive status and associated underlying pathology rather than diagnoses based on biomarker evidence of a specific etiology. In addition, our deep‐learning models were trained on MR‐based labels only; therefore, our study cannot answer whether alternative means of generating training labels on CT images (manual or other) would have been beneficial. Furthermore, we explored the diagnostic performance of CT‐based volumetric measures on cross‐sectional data. The diagnostic performance of CTVMs on longitudinal data is yet to be explored. In the future we plan to conduct prospective studies to study the impact of longitudinal effects of neurodegeneration on CTVMs. Along with the diagnostic performance, we evaluated the association between CTVMs and other imaging, cognitive, and biochemical markers of neurodegenerative diseases in this study. Recently few studies have explored multimodal data integration for the prediction, early detection, and assessment of neurodegenerative diseases—especially AD. 49 , 50 , 51 In the future we plan to explore the role of CTVMs in multimodal data analysis for the early detection of neurodegeneration, especially the role of CTVMs in combination with plasma and cognition‐based markers.
In summary, CT imaging biomarkers obtained through volumetric analysis based on deep learning are associated with relevant imaging, cognitive, and biochemical markers of neurodegenerative diseases. These volumetric measures differentiate between patients with dementia diagnoses (even at early disease stages) and cognitively healthy individuals, offering diagnostic performance comparable to established MR‐based markers of neurodegenerative diseases. We propose our automated method to produce CT‐based volumetric measures that can support clinical dementia diagnostics, even in early disease stages. Together with novel blood biomarkers, CT‐based quantitative measures could be useful tools for the first‐line examination of individuals presenting with cognitive decline.
CONFLICT OF INTEREST STATEMENT
H.Z. has served at scientific advisory boards and/or as a consultant for Abbvie, Acumen, Alector, Alzinova, ALZPath, Annexon, Apellis, Artery Therapeutics, AZTherapies, CogRx, Denali, Eisai, Nervgen, Novo Nordisk, Passage Bio, Pinteon Therapeutics, Prothena, Red Abbey Labs, reMYND, Roche, Samumed, Siemens Healthineers, Triplet Therapeutics, and Wave; has given lectures in symposia sponsored by Cellectricon, Fujirebio, Alzecure, Biogen, and Roche; and is a co‐founder of Brain Biomarker Solutions in Gothenburg AB (BBS), which is a part of the GU Ventures Incubator Program (outside submitted work). K.B. served as a consultant at advisory boards and data monitoring committees for Abcam, Axon, Biogen, JOMDD/Shimadzu, Julius Clinical, Lilly, MagQu, Novartis, Prothena, Roche Diagnostics, and Siemens Healthineers, and is also the co‐founder of Brain Biomarker Solutions in Gothenburg AB (BBS), which is a part of the GU Ventures Incubator Program. S.K. has served at scientific advisory boards and/or as a consultant for Geras Solutions and Biogen (outside submitted work). M.S. has served on advisory boards for and receives funding from Roche Diagnostics and Novo Nordisk (outside scope of submitted work). The other authors have no conflicts of interest pertinent to this manuscript. Author disclosures are available in the Supporting Information.
CONSENT STATEMENT
Necessary patient/participant consent for Gothenburg H70 Birth Cohort and Memory Clinic Cohort Study, Singapore, has been obtained and the appropriate institutional forms have been archived.
Supporting information
Supporting Information
Supporting Information
ACKNOWLEDGMENTS
J.B.P. is supported by grants from the Center for Medical Innovation, the Swedish Research Council, Neurotech, Alzheimerfonden, Hjärnfonden, a Senior Researcher Position grant, Gamla Tjänarinnor, Demensfonden, and Stohnes grants. H.Z. is a Wallenberg Scholar supported by grants from the Swedish Research Council (#2018‐02532), the European Union's Horizon Europe research and innovation programme under grant agreement No 101053962, Swedish State Support for Clinical Research (#ALFGBG‐71320), the Alzheimer's Drug Discovery Foundation (ADDF), USA (#201809‐2016862), the AD Strategic Fund, and the Alzheimer's Association (#ADSF‐21‐831376‐C, #ADSF‐21‐831381‐C, and #ADSF‐21‐831377‐C), the Bluefield Project, the Olav Thon Foundation, the Erling‐Persson Family Foundation, Stiftelsen för Gamla Tjänarinnor, Hjärnfonden, Sweden (#FO2022‐0270), the European Union's Horizon 2020 research and innovation programme under the Marie Skłodowska‐Curie grant agreement No 860197 (MIRIADE), the European Union Joint Programme – Neurodegenerative Disease Research (JPND2021‐00694), and the UK Dementia Research Institute at UCL (UKDRI‐1003). Part of the computations was enabled by resources provided by the Swedish National Infrastructure for Computing (SNIC) at the National Supercomputer Centre, Linköping, Sweden, partially funded by the Swedish Research Council through grant agreement no. 2018‐05973. S.K. was financed by grants from the Swedish state under the agreement between the Swedish government and the county councils, the ALF‐agreement (ALFGBG‐965923, ALFGBG‐81392, ALF GBG‐771071), the Alzheimerfonden (AF‐842471, AF‐737641, AF‐929959, AF‐939825), the Swedish Research Council (2019‐02075), Stiftelsen Psykiatriska Forskningsfonden, Stiftelsen Demensfonden, Stiftelsen Hjalmar Svenssons Forskningsfond, Stiftelsen Wilhelm och Martina Lundgrens vetenskapsfond. M.S. is supported by the Knut and Alice Wallenberg Foundation (Wallenberg Centre for Molecular and Translational Medicine; KAW 2014.0363, KAW 2023.0371), the Swedish Research Council (#2017‐02869, #2021‐02678, #2021‐06545), the Swedish state under the agreement between the Swedish government and the County Councils, the ALF‐agreement (#ALFGBG‐813971), and the Swedish Alzheimer Foundation (#AF‐740191). Image analysis computations were in part carried out with resources provided by the Swedish National Infrastructure for Computing (SNIC), partially funded by the Swedish Research Council through grant agreement no. 2018‐05973.
Srikrishna M, Ashton NJ, Moscoso A, et al. CT‐based volumetric measures obtained through deep learning: Association with biomarkers of neurodegeneration. Alzheimer's Dement. 2024;20:629–640. 10.1002/alz.13445
REFERENCES
- 1. Irvine GB, El‐Agnaf OM, Shankar GM, Walsh DM. Protein aggregation in the brain: the molecular basis for Alzheimer's and Parkinson's diseases. Mol Med. 2008;14(7‐8):451‐464. doi: 10.2119/2007-00100.Irvine [DOI] [PMC free article] [PubMed] [Google Scholar]
- 2. Jack CR, Bennett DA, Blennow K, et al. NIA‐AA Research Framework: toward a biological definition of Alzheimer's disease. Alzheimers Dement. 2018;14(4):535‐562. doi: 10.1016/j.jalz.2018.02.018 [DOI] [PMC free article] [PubMed] [Google Scholar]
- 3. Parnetti L, Eusebi P. Cerebrospinal fluid biomarkers in Alzheimer's disease: an invaluable tool for clinical diagnosis and trial enrichment. J Alzheimers Dis. 2018;64(s1):S281‐S287. doi: 10.3233/JAD-179910 [DOI] [PubMed] [Google Scholar]
- 4. Pini L, Pievani M, Bocchetta M, et al. Brain atrophy in Alzheimer's disease and aging. Ageing Res Rev. 2016;30:25‐48. doi: 10.1016/j.arr.2016.01.002 [DOI] [PubMed] [Google Scholar]
- 5. Frisoni GB, Fox NC, Jack CR, Scheltens P, Thompson PM. The clinical use of structural MRI in Alzheimer disease. Nat Rev Neurol. 2010;6(2):67‐77. doi: 10.1038/nrneurol.2009.215 [DOI] [PMC free article] [PubMed] [Google Scholar]
- 6. Sarasso E, Agosta F, Piramide N, Filippi M. Progression of grey and white matter brain damage in Parkinson's disease: a critical review of structural MRI literature. J Neurol. 2021;268(9):3144‐3179. doi: 10.1007/s00415-020-09863-8 [DOI] [PubMed] [Google Scholar]
- 7. Harper L, Bouwman F, Burton EJ, et al. Patterns of atrophy in pathologically confirmed dementias: a voxelwise analysis. J Neurol Neurosurg Psychiatry. 2017;88(11):908‐916. doi: 10.1136/jnnp-2016-314978 [DOI] [PMC free article] [PubMed] [Google Scholar]
- 8. Lee J, Burkett BJ, Min HK, et al. Deep learning‐based brain age prediction in normal aging and dementia. Nat Aging. 2022;2(5):412‐424. doi: 10.1038/s43587-022-00219-7 [DOI] [PMC free article] [PubMed] [Google Scholar]
- 9. Ehrenberg AJ, Khatun A, Coomans E, et al. Relevance of biomarkers across different neurodegenerative diseases. Alz Res Therapy. 2020;12(1):56. doi: 10.1186/s13195-020-00601-w [DOI] [PMC free article] [PubMed] [Google Scholar]
- 10. Young PN, Estarellas M, Coomans E, et al. Imaging biomarkers in neurodegeneration: current and future practices. Alzheimers Res Ther. 2020;12(1):1‐17. [DOI] [PMC free article] [PubMed] [Google Scholar]
- 11. Ashton NJ, Hye A, Rajkumar AP, et al. An update on blood‐based biomarkers for non‐Alzheimer neurodegenerative disorders. Nat Rev Neurol. 2020;16(5):265‐284. doi: 10.1038/s41582-020-0348-0 [DOI] [PubMed] [Google Scholar]
- 12. Leuzy A, Cullen NC, Mattsson‐Carlgren N, Hansson O. Current advances in plasma and cerebrospinal fluid biomarkers in Alzheimer's disease. Curr Opin Neurol. 2021;34(2):266‐274. doi: 10.1097/WCO.0000000000000904 [DOI] [PubMed] [Google Scholar]
- 13. Wattjes MP, Henneman WJ, van der Flier WM, et al. Diagnostic imaging of patients in a memory clinic: comparison of MR imaging and 64–detector row CT. Radiology. 2009;253(1):174‐183. doi: 10.1148/radiol.2531082262 [DOI] [PubMed] [Google Scholar]
- 14. Pasi M, Poggesi A, Pantoni L. The use of CT in dementia. Int Psychogeriatr. 2011;23(S2):S6‐S12. doi: 10.1017/S1041610211000950 [DOI] [PubMed] [Google Scholar]
- 15. Sluimer JD, Bouwman FH, Vrenken H, et al. Whole‐brain atrophy rate and CSF biomarker levels in MCI and AD: a longitudinal study. Neurobiol Aging. 2010;31(5):758‐764. doi: 10.1016/j.neurobiolaging.2008.06.016 [DOI] [PubMed] [Google Scholar]
- 16. Orellana C, Ferreira D, Muehlboeck JS, et al. Measuring Global brain atrophy with the brain volume/cerebrospinal fluid index: normative values, cut‐offs and clinical associations. Neurodegener Dis. 2016;16(1‐2):77‐86. doi: 10.1159/000442443 [DOI] [PubMed] [Google Scholar]
- 17. Wei M, Shi J, Ni J, et al. A new age‐related cutoff of medial temporal atrophy scale on MRI improving the diagnostic accuracy of neurodegeneration due to Alzheimer's disease in a Chinese population. BMC Geriatrics. 2019;19(1):59. doi: 10.1186/s12877-019-1072-8 [DOI] [PMC free article] [PubMed] [Google Scholar]
- 18. Aguilar C, Edholm K, Simmons A, et al. Automated CT‐based segmentation and quantification of total intracranial volume. Eur Radiol. 2015;25(11):3151‐3160. doi: 10.1007/s00330-015-3747-7 [DOI] [PubMed] [Google Scholar]
- 19. Van De Leemput SC, Meijs M, Patel A, Meijer FJ, Van Ginneken B, Manniesing R. Multiclass brain tissue segmentation in 4d ct using convolutional neural networks. IEEE Access. 2019;7:51557‐51569. doi:srikrishna. [Google Scholar]
- 20. Srikrishna M, Pereira JB, Heckemann RA, et al. Deep learning from MRI‐derived labels enables automatic brain tissue classification on human brain CT. Neuroimage. 2021;244:118606. doi: 10.1016/j.neuroimage.2021.118606 [DOI] [PubMed] [Google Scholar]
- 21. Ronneberger O, Fischer P, Brox T. U‐net: Convolutional networks for biomedical image segmentation. Springer; 2015:234‐241. doi: 10.48550/arXiv.1505.04597 [DOI] [Google Scholar]
- 22. Rydberg Sterner T, Ahlner F, Blennow K, et al. The Gothenburg H70 Birth cohort study 2014‐16: design, methods and study population. Eur J Epidemiol. 2019;34(2):191‐209. doi: 10.1007/s10654-018-0459-8 [DOI] [PMC free article] [PubMed] [Google Scholar]
- 23. Lindberg O, Kern S, Skoog J, et al. Effects of amyloid pathology and the APOE ε4 allele on the association between cerebrospinal fluid Aβ38 and Aβ40 and brain morphology in cognitively normal 70‐years‐olds. Neurobiol Aging. 2021;101:1‐12. doi: 10.1016/j.neurobiolaging.2020.10.033 [DOI] [PubMed] [Google Scholar]
- 24. Skoog I, Kern S, Najar J, et al. A Non‐APOE polygenic risk score for Alzheimer's disease is associated with cerebrospinal fluid neurofilament light in a representative sample of cognitively unimpaired 70‐Year old's. J Gerontol A Biol Sci Med Sci. 2021;76(6):983‐990. doi: 10.1093/gerona/glab030 [DOI] [PMC free article] [PubMed] [Google Scholar]
- 25. Dittrich A, Ashton NJ, Zetterberg H, et al. Plasma and CSF NfL are differentially associated with biomarker evidence of neurodegeneration in a community‐based sample of 70‐year‐olds. Alzheimers Dement. 2022;14(1):e12295. doi: 10.1002/dad2.12295 [DOI] [PMC free article] [PubMed] [Google Scholar]
- 26. Benedet AL, Leuzy A, Pascoal TA, et al. Stage‐specific links between plasma neurofilament light and imaging biomarkers of Alzheimer's disease. Brain. 2020;143(12):3793‐3804. doi: 10.1093/brain/awaa342 [DOI] [PMC free article] [PubMed] [Google Scholar]
- 27. O'Brien LM, Ziegler DA, Deutsch CK, Frazier JA, Herbert MR, Locascio JJ. Statistical adjustments for brain size in volumetric neuroimaging studies: some practical implications in methods. Psychiatry Res. 2011;193(2):113‐122. doi: 10.1016/j.pscychresns.2011.01.007 [DOI] [PMC free article] [PubMed] [Google Scholar]
- 28. Voevodskaya O, Simmons A, Nordenskjöld R, et al. The effects of intracranial volume adjustment approaches on multiple regional MRI volumes in healthy aging and Alzheimer's disease. Front Aging Neurosci. 2014;6:264. doi: 10.3389/fnagi.2014.00264 [DOI] [PMC free article] [PubMed] [Google Scholar]
- 29. Salat DH, Greve DN, Pacheco JL, et al. Regional white matter volume differences in nondemented aging and Alzheimer's disease. Neuroimage. 2009;44(4):1247‐1258. doi: 10.1016/j.neuroimage.2008.10.030 [DOI] [PMC free article] [PubMed] [Google Scholar]
- 30. Han J, Kim MN, Lee HW, et al. Distinct volumetric features of cerebrospinal fluid distribution in idiopathic normal‐pressure hydrocephalus and Alzheimer's disease. Fluids Barriers CNS. 2022;19(1):66. doi: 10.1186/s12987-022-00362-8 [DOI] [PMC free article] [PubMed] [Google Scholar]
- 31. Ashburner J, Friston KJ. Unified segmentation. Neuroimage. 2005;26(3):839‐851. doi: 10.1016/j.neuroimage.2005.02.018 [DOI] [PubMed] [Google Scholar]
- 32. Heckemann RA, Keihaninejad S, Aljabar P, Rueckert D, Hajnal JV, Hammers A. Improving intersubject image registration using tissue‐class information benefits robustness and accuracy of multi‐atlas based anatomical segmentation. Neuroimage. 2010;51(1):221‐227. doi: 10.1016/j.neuroimage.2010.01.072 [DOI] [PubMed] [Google Scholar]
- 33. Heckemann RA, Ledig C, Gray KR, et al. Brain extraction using label propagation and group agreement: pincram. PLoS One. 2015;10(7):e0129211. doi: 10.1371/journal.pone.0129211 [DOI] [PMC free article] [PubMed] [Google Scholar]
- 34. Carpenter J, Bithell J. Bootstrap confidence intervals: when, which, what? A practical guide for medical statisticians. Stat Med. 2000;19(9):1141‐1164. doi: [DOI] [PubMed] [Google Scholar]
- 35. Core R. Team . R: A Language and Environment for Statistical Computing. 2015.
- 36. Chen W, Song X, Zhang Y, et al. An MRI‐based semiquantitative index for the evaluation of brain atrophy and lesions in Alzheimer's disease, mild cognitive impairment and normal aging. Dement Geriatr Cogn Disord. 2010;30(2):121‐130. doi: 10.1159/000319537 [DOI] [PMC free article] [PubMed] [Google Scholar]
- 37. Spulber G, Simmons A, Muehlboeck JS, et al. An MRI‐based index to measure the severity of Alzheimer's disease‐like structural pattern in subjects with mild cognitive impairment. J Intern Med. 2013;273(4):396‐409. doi: 10.1111/joim.12028 [DOI] [PMC free article] [PubMed] [Google Scholar]
- 38. Pereira JB, Westman E, Hansson O. Association between cerebrospinal fluid and plasma neurodegeneration biomarkers with brain atrophy in Alzheimer's disease. Neurobiol Aging. 2017;58:14‐29. doi: 10.1016/j.neurobiolaging.2017.06.002 [DOI] [PubMed] [Google Scholar]
- 39. Zetterberg H, Skillbäck T, Mattsson N, et al. Association of cerebrospinal fluid neurofilament light concentration with Alzheimer disease progression. JAMA Neurol. 2016;73(1):60‐67. doi: 10.1001/jamaneurol.2015.3037 [DOI] [PMC free article] [PubMed] [Google Scholar]
- 40. Karikari TK, Pascoal TA, Ashton NJ, et al. Blood phosphorylated tau 181 as a biomarker for Alzheimer's disease: a diagnostic performance and prediction modelling study using data from four prospective cohorts. Lancet Neurol. 2020;19(5):422‐433. [DOI] [PubMed] [Google Scholar]
- 41. Moscoso A, Grothe MJ, Ashton NJ, et al. Longitudinal associations of blood phosphorylated Tau181 and neurofilament light chain with neurodegeneration in Alzheimer disease. JAMA Neurol. 2021;78(4):396‐406. [DOI] [PMC free article] [PubMed] [Google Scholar]
- 42. Wang YL, Chen J, Du ZL, et al. Plasma p‐tau181 level predicts neurodegeneration and progression to Alzheimer's dementia: a longitudinal study. Front Neurol. 2021;12:695696. doi: 10.3389/fneur.2021.695696 [DOI] [PMC free article] [PubMed] [Google Scholar]
- 43. Korf ESC, Wahlund LO, Visser PJ, Scheltens P. Medial temporal lobe atrophy on MRI predicts dementia in patients with mild cognitive impairment. Neurology. 2004;63(1):94‐100. doi: 10.1212/01.WNL.0000133114.92694.93 [DOI] [PubMed] [Google Scholar]
- 44. Jack CR, Petersen RC, Xu YC, et al. Medial temporal atrophy on MRI in normal aging and very mild Alzheimer's disease. Neurology. 1997;49(3):786‐794. doi: 10.1212/wnl.49.3.786 [DOI] [PMC free article] [PubMed] [Google Scholar]
- 45. Cotta Ramusino M, Altomare D, Bacchin R, et al. Medial temporal lobe atrophy and posterior atrophy scales normative values. NeuroImage Clin. 2019;24:101936. doi: 10.1016/j.nicl.2019.101936 [DOI] [PMC free article] [PubMed] [Google Scholar]
- 46. Westman E, Cavallin L, Muehlboeck JS, et al. Sensitivity and specificity of medial temporal lobe visual ratings and multivariate regional MRI classification in Alzheimer's disease. PLoS One. 2011;6(7):e22506. [DOI] [PMC free article] [PubMed] [Google Scholar]
- 47. Wahlund LO, Westman E, van Westen D, et al. Imaging biomarkers of dementia: recommended visual rating scales with teaching cases. Insights Imaging. 2017;8(1):79‐90. [DOI] [PMC free article] [PubMed] [Google Scholar]
- 48. Beam AL, Manrai AK, Ghassemi M. Challenges to the reproducibility of machine learning models in health care. JAMA. 2020;323(4):305‐306. [DOI] [PMC free article] [PubMed] [Google Scholar]
- 49. Qiu S, Miller MI, Joshi PS, et al. Multimodal deep learning for Alzheimer's disease dementia assessment. Nat Commun. 2022;13:3404. doi: 10.1038/s41467-022-31037-5 [DOI] [PMC free article] [PubMed] [Google Scholar]
- 50. El‐Sappagh S, Alonso JM, Islam SMR, Sultan AM, Kwak KS. A multilayer multimodal detection and prediction model based on explainable artificial intelligence for Alzheimer's disease. Sci Rep. 2021;11(1):2660. doi: 10.1038/s41598-021-82098-3 [DOI] [PMC free article] [PubMed] [Google Scholar]
- 51. Venugopalan J, Tong L, Hassanzadeh HR, Wang MD. Multimodal deep learning models for early detection of Alzheimer's disease stage. Sci Rep. 2021;11(1):3254. doi: 10.1038/s41598-020-74399-w [DOI] [PMC free article] [PubMed] [Google Scholar]
Associated Data
This section collects any data citations, data availability statements, or supplementary materials included in this article.
Supplementary Materials
Supporting Information
Supporting Information