

Abstract
Fracture risk is high in chronic kidney disease (CKD) and underlying pathophysiology and risk factors may differ from the general population. In a cohort study of 3939 participants in the chronic renal insufficiency cohort (CRIC), we used Cox regression to test associations of putative risk factors with the composite of first hip or vertebral fracture assessed using hospital discharge codes. Mean age was 58 years, 45% were female, 42% were Black, and 13% were Hispanic. There were 82 hip and 24 vertebral fractures over a mean (SD) 11.1 (4.8) years (2.4 events per 1000 person-years [95% CI: 2.0, 2.9]). Measured at baseline, diabetes, lower body mass index (BMI), steroid use, proteinuria, and elevated parathyroid hormone (PTH) were each associated with fracture risk after adjusting for covariates. Lower time-updated estimated glomerular filtration rate (eGFR) was associated with fractures (HR 1.20 per 10 mL/min/1.73m2 lower eGFR; 95% CI: 1.04, 1.38) as were lower time-updated serum calcium and bicarbonate concentrations. Among time-updated categories of kidney function, hazard ratios (95% CI) for incident fracture were 4.53 (1.77, 11.60) for kidney failure treated with dialysis and 2.48 (0.86, 7.14) for post-kidney transplantation, compared with eGFR ≥60. Proton pump inhibitor use, dietary calcium intake, measures of vitamin D status, serum phosphate, urine calcium and phosphate, and plasma fibroblast growth factor-23 were not associated with fracture risk. In conclusion, lower eGFR in CKD is associated with higher fracture risk, which was highest in kidney failure. Diabetes, lower BMI, steroid use, proteinuria, higher serum concentrations of PTH, and lower calcium and bicarbonate concentrations were associated with fractures and may be modifiable risk factors.
Keywords: fracture prevention, fracture risk assessment, biochemical markers of bone turnover, osteoporosis, PTH/Vit D/FGF23
Lay Summary
People with chronic kidney disease are at high risk of fractures. Our research assessed the relationship between several patient characteristics and the risk of fractures in 3939 patients with chronic kidney disease. We found that the following characteristics were associated with a higher risk of a hip or spine fracture: having diabetes, lower body mass index, use of steroid-containing medications, lower kidney filtration rate (“eGFR”), higher amounts of protein spilled in the urine, lower calcium and bicarbonate levels, and higher parathyroid hormone levels. Future studies should assess if improving these characteristics decreases the risk of fractures in patients with chronic kidney disease.
Introduction
Patients with chronic kidney disease (CKD) have a greater risk of fracture than the general population, contributing to substantial morbidity, mortality, and economic cost.1 Recent gains in life expectancy of patients with CKD have been accompanied by an increase in fractures, which are likely due to a combination of traditional and kidney-related risk factors.2 However, most published studies in this field have assessed few exposures beyond the estimated glomerular filtration rate (eGFR)3–6 or have been restricted to the dialysis population.7–10 A thorough examination of potential risk factors for fracture in non-dialysis dependent CKD is important for assessing the risk of this outcome and suggesting strategies for prevention.
Low concentrations of 25-hydroxyvitamin D (25[OH]D) and 1,25-dihydroxyvitamin D (1,25[OH]2D), elevated parathyroid hormone (PTH) and fibroblast growth factor-23 (FGF-23), and abnormal calcium and phosphate metabolism are highly prevalent features of CKD-mineral and bone disorder (CKD-MBD), hypothesized to increase skeletal fragility and fracture risk.2 Optimal treatment targets for these biomarkers remain unclear, and few studies have assessed their association with fractures in non-dialysis dependent CKD. The importance of traditional risk factors for fracture, such as age, sex, race and ethnicity, diabetes status, exercise, and body mass index (BMI), in persons with CKD is also relatively unexplored.
We used a large national cohort study of CKD with ˃11 years of median follow-up to evaluate putative risk factors for hip and vertebral fractures, including a comprehensive panel of biomarkers of mineral metabolism. eGFR, proteinuria, and serum calcium and bicarbonate concentrations were also analyzed as time-updated exposures to elucidate potential short-term effects of these measures on fracture risk.
Methods
Study population
The chronic renal insufficiency cohort (CRIC) is an ongoing prospective cohort study of persons with CKD.11 Between 2003 and 2008, CRIC recruited 3939 adults with known CKD from nephrology clinics who had eGFR ranging from 20 to 70 mL/min/1.73m2 using the Modification of Diet in Renal Disease study equation from seven clinical centers located across the United States: Ann Arbor and Detroit, MI; Baltimore, MD; Chicago, IL; Cleveland, OH; New Orleans, LA; Philadelphia, PA; and Oakland, CA. Participants underwent extensive clinical evaluation at baseline and at annual clinic visits (where data including blood and urine specimens were collected) and via telephone at 6-month intervals. Exclusion criteria included dialysis for at least 1 month, prior kidney transplant, and NYHA Class III and IV heart failure. Institutional review boards at all participating centers approved the study, and all participants gave written informed consent. This analysis used data from the National Institute of Diabetes and Digestive and Kidney Diseases (NIDDK) Central Repositories, which is publicly available and can be accessed through request at https://repository.niddk.nih.gov/studies/cric.
Exposures and covariates
At baseline, sociodemographic characteristics, smoking status, comorbidities, medication use, and vitamin D and calcium intake from food and supplements were ascertained using standardized questionnaires, and blood and 24-h urine specimens were collected. Participants identified themselves as belonging to one of four racial or ethnic groups: non-Hispanic Black, Hispanic, non-Hispanic White, or other. Diabetes was defined as a fasting blood glucose >126 mg/dL, non-fasting blood glucose >200 mg/dL, or use of insulin or any other antidiabetic medication. Anthropometric measurements and blood pressure were assessed using standardized protocols. Physical activity was ascertained using the Multi-Ethnic Study of Atherosclerosis (MESA) Typical Week Physical Activity Survey.12 Serum creatinine was measured using an enzymatic method on a Vitros 950 Chemistry Analyzer (Ortho-Clinical Diagnostics, Raritan, NJ) at the CRIC Central Laboratory and standardized to isotope dilution mass spectrometry-traceable values.13 eGFR was calculated from serum creatinine using the 2021 CKD Epidemiology Collaboration (CKD-EPI) equation. Plasma PTH was measured using a total PTH assay, which detects the 1-84 PTH molecule and 7-84 fragments (normal range 10–57 pg/mL; Scantibodies, Santee, CA), and plasma FGF-23 was measured using a second-generation carboxy-terminal assay (Immutopics, San Clemente, CA).14 Serum calcium and phosphate, and 24-h urine protein, calcium, and phosphate were also measured in the CRIC Study’s central laboratory. Serum creatinine, calcium, and bicarbonate, and 24-h urine protein were repeated at every annual CRIC Study visit and used in time-updated analyses (see Statistical Analysis below). Vitamin D metabolites were measured from serum collected at the 1-year CRIC Study visit in a subset of the CRIC Study population originally as part of another case-cohort study (Supplementary Figure S1)15 using immunoaffinity extraction and liquid chromatography–tandem mass spectrometry (LC–MS/MS).16 Total 25(OH)D and 1,25(OH)2D were calculated by the sum of their respective D2 and D3 concentrations. The vitamin D metabolite ratio (VDMR) is a relatively newer measure of vitamin D status that estimates tissue-level vitamin D activity by dividing the concentration of the major downstream metabolite (24,25-dihydroxyvitamin D3) by the concentration of available substrate (25[OH]D3) and then multiplying by 1000.15
Outcomes
The primary outcome was a composite of first hip or vertebral fracture. Fracture diagnoses were abstracted from inpatient International Classification of Diseases, Ninth Revision (ICD-9) and Tenth Revision (ICD-10) codes from all hospitalizations reported by participants at semiannual participant interviews conducted from the start of CRIC in 2003. Codes used for hip fracture were ICD-9: 820.x; ICD-10: S72.0x, S72.1x, and S72.2x; codes used for vertebral fracture were ICD-9: 805.x and 806.x; ICD-10: M48.4, M48.5, S22.0x and S32.0x.17–19 We used hip fracture codes in any position on a hospital claim and vertebral fracture codes only in the first position on the hospital claim (i.e., listed as the primary discharge diagnosis) based on a validated algorithm shown to have a positive predictive value for incident fracture that exceeds 95%.18 Follow-up was through December 2021 for all outcomes, although the beginning of follow-up time differed by exposure. For non-vitamin D exposures, follow-up time was measured from the baseline examination; for vitamin D measures (25[OH]D, 1,25[OH]2D, and VDMR) that were measured in a subset at the 1-year study visit, follow-up time began at the 1-year study visit.
Statistical analysis
We constructed nested Cox regression models to assess associations between each putative risk factor and the composite end-point of first hip or vertebral fracture. An initial analytic model adjusted for age, sex, race and ethnicity, and a second model additionally adjusted for diabetes, smoking status, self-reported physical activity, systolic blood pressure, BMI, dietary calcium, and vitamin D intake from food and supplements, anti-hypertensive use, statin use, bisphosphonate use, estrogen-containing medications, steroid use, eGFR, and log-transformed 24-h urine protein. Missing covariates were multiply imputed using chained equations via the mice package (M = 20).20 The multiple analyses over the imputations were then combined using Rubin’s rules to account for the variability in the imputation procedure.21 Analyses of vitamin D measures (25[OH]D, 1,25[OH]2D, and VDMR; N = 1784) used the same Cox regression models, but were weight-adjusted using Borgan II weights as was done previously to account for the non-random participant sampling (Supplementary Figure S1).22,23 eGFR, proteinuria, serum calcium, and serum bicarbonate were also analyzed as time-updated exposures using the same Cox regression models, where the reported hazard ratios are weighted averages of individual hazard ratios calculated using annually repeated measurements.24 Time-updated covariate values were used when available. Participants with changing eGFR, proteinuria, serum calcium, or serum bicarbonate may contribute follow-up time to multiple eGFR, proteinuria, serum calcium, or serum bicarbonate categories up to the time of first fracture or censoring. Missing values were replaced using last observation carried forward; censoring for progression to maintenance dialysis or kidney transplantation, out of 30 096 possible study visit measurements, serum creatinine was carried forward 106 times, proteinuria 14 772 times, serum calcium 1262 times, and serum bicarbonate 1258 times. Finally, we examined the functional forms of associations of exposures with fracture risk using generalized additive models.25 A two-sided P-value <0.05 was considered statistically significant. All analyses were conducted with R version 4.2.3 (R Foundation for Statistical Computing).
RESULTS
Participant characteristics
The CRIC Study cohort was 42% non-Hispanic Black, 13% Hispanic, and 42% non-Hispanic White (Table 1). At baseline, mean (standard deviation [SD]) age was 58,11 45% were female, 3% reported bisphosphonate use, and 10% reported steroid use. Mean (SD) eGFR was 4415 mL/min/1.73 m2, median (interquartile range [IQR]) 24-h urine protein was 0.2 (0.1–0.9) g/day, and median (IQR) PTH was 54 (35–90) pg/mL. Participant characteristics were similar in the subset in whom vitamin D metabolites were measured at the 1-year study visit. The mean (SD) total 25(OH)D, total 1,25(OH)2D, and VDMR in this group was 19 (10.5) ng/mL, 30 (15.5) pg/mL, and 38 (19.7) pg/ng, respectively.
Table 1.
Characteristics of chronic renal insufficiency cohort (CRIC) Study participants.
| Entire study populationa (N = 3939) | Vitamin D subsetb (N = 1784) | |
|---|---|---|
| Demographics | ||
| Age (yr), mean (SD) | 58 (11) | 59 (11) |
| Female, n (%) | 1778 (45) | 45% |
| Race or ethnicity, n (%) | ||
| Non-Hispanic Black | 1650 (42) | 42% |
| Hispanic | 497 (13) | 12% |
| Non-Hispanic White | 1638 (42) | 43% |
| Other | 154 (4) | 3% |
| Medical history and lifestyle | ||
| Hypertension, n (%) | 3391 (86) | 89% |
| Diabetes, n (%) | 1908 (48) | 50% |
| Current smoking, n (%) | 517 (13) | 11% |
| Self-reported physical activity (MET/week), median (IQR) | 164 (108–247) | 165 (113–249) |
| Dietary intake | ||
| Daily calcium intake from food (mg), median (IQR) | 616 (423–874) | 627 (436–873) |
| Daily calcium intake from supplements (mg), median (IQR) | 0 (0–143) | 0 (0–106) |
| Daily vitamin D intake from food (mcg), median (IQR) | 3 (2–5) | 3 (2–5) |
| Daily vitamin D intake from supplements (IU), median (IQR) | 7 (0–400) | 3 (0–326) |
| Medication use | ||
| Anti-hypertensives, n (%) | 3325 (84) | 82% |
| Statins, n (%) | 2153 (55) | 60% |
| Bisphosphonates, n (%) | 128 (3) | 3% |
| Estrogen-containing medications, n (%) | 154 (4) | 4% |
| Steroids, n (%) | 391 (10) | 12% |
| Physical examination data | ||
| BMI (kg/m2), mean (SD) | 32.1 (7.8) | 32.0 (7.3) |
| Systolic BP (mmHg), mean (SD) | 129 (22) | 126.5 (21) |
| Diastolic BP (mmHg), mean (SD) | 72 (13) | 69.9 (12) |
| Laboratory data | ||
| eGFR (mL/min per 1.73 m2), mean (SD) | 44 (15) | 43 (16) |
| Bicarbonate (mEq/L), mean (SD) | 24 (3) | 24 (3) |
| 24-h total urine protein (g/day), median (IQR) | 0.2 (0.1–0.9) | 0.2 (0.1–0.9) |
| 24-h urine calcium excretion (mg/day), median (IQR) | 39 (17–85) | 41 (18–88) |
| 24-h urine phosphate excretion (mg), median (IQR) | 709 (507–948) | 715 (511–941) |
| Calcium (mg/dL), mean (SD) | 9.2 (0.5) | 9.3 (0.3) |
| Phosphate (mg/dL), mean (SD) | 3.7 (0.7) | 4.0 (0.6) |
| FGF-23 (pg/mL), median (IQR) | 145 (96–239) | 134 (85–250) |
| PTH (pg/mL), median (IQR) | 54 (35–90) | 61 (40–98) |
| 24,25(OH)2D3 (ng/mL), mean (SD) | - | 0.8 (0.7) |
| 25(OH)D3 (ng/mL), mean (SD) | - | 17.1 (10.1) |
| VDMR (pg/ng), mean (SD) | - | 38.0 (19.7) |
| Total 25(OH)D (ng/mL), mean (SD) | - | 19.0 (10.5) |
| Total 1,25(OH)2D (pg/mL), mean (SD) | - | 30.0 (15.5) |
Characteristics for the entire study population are from the baseline CRIC Study visit.
Characteristics for this subset of participants are weight-adjusted to account for non-random participant sampling. Characteristics for this subset are from the 1-year CRIC Study visit, except for self-reported physical activity, dietary calcium and vitamin D intake, and 24-h urine calcium and phosphate excretion, which are from the baseline CRIC Study visit.
CRIC, Chronic Renal Insufficiency Cohort; SD, standard deviation; MET, metabolic equivalent of task; IQR, interquartile range; BMI, body mass index; eGFR, estimated glomerular filtration rate; FGF-23, fibroblast growth factor-23; PTH, parathyroid hormone; 24,25(OH)2D3, 24,25-dihydroxyvitamin D3; 25(OH)D3, 25-hydroxyvitamin D3; VDMR, vitamin D metabolite ratio; 25(OH)D, 25-hydroxyvitamin D; 1,25(OH)2D, 1,25-dihydroxyvitamin D.
Fracture events
In the full cohort, we observed 82 hip and 24 vertebral fractures over a mean (SD) follow-up of 11.1 (4.8) years for an incidence rate of 2.4 events per 1000 person-years (95% CI: 2.0, 2.9). In the subset of participants with vitamin D measurements, we observed 36 hip and 10 vertebral fractures over a mean (SD) follow-up of 9.4 (4.8) years for an incidence rate of 2.6 events per 1000 person-years (95% CI: 1.7, 3.7).
Fracture risk factor assessment
In the full cohort, older age, diabetes, lower BMI, steroid use, and baseline proteinuria >1.5 g relative to <0.1 g were significantly associated with higher fracture risk after adjusting for demographic and clinical covariates, while sex, physical activity, dietary calcium intake, proton pump inhibitor use, baseline serum bicarbonate, and baseline eGFR were not (Table 2). Non-Hispanic Black race was associated with lower fracture risk compared with Non-Hispanic White race. When analyzed as a time-updated exposure, lower serum bicarbonate was associated with higher fracture risk after adjusting for time-updated covariates including eGFR (HR 1.07 per 1 mg/dL lower serum bicarbonate; 95% CI: 1.01, 1.14; Table 3). Time-updated analyses also revealed that lower continuous eGFR was associated with higher fracture risk (hazard ratio [HR] 1.20 per 10 mL/min/1.73 m2 lower eGFR; 95% CI: 1.04, 1.38; Table 3). Generalized additive modeling of time-updated eGFR suggested an inflection point at ~40 mL/min/1.73 m2, below which there was higher fracture risk (Figure 1). Among time-updated categories of kidney function, the greatest risk was observed in kidney failure treated with dialysis (HR 4.53 relative to eGFR >60; 95% CI: 1.77, 11.60; Table 3). The hazard ratio was also high for participants who received kidney transplantation, although this finding was not statistically significant (HR 2.48 relative to eGFR >60; 95% CI: 0.86, 7.14).
Table 2.
Associations of baseline demographic and clinical characteristics with hip and vertebral fractures (N = 3939).
| N at risk (N events) | Incidence rate, events/1000 person-years (95% CI) | Hazard Ratio (95% CI) | ||
|---|---|---|---|---|
| Model 1 | Model 2 | |||
| Overall | 3939 (106) | 2.4 (2.0, 2.9) | ||
| Age, per decade higher | 1.92 (1.53, 2.42)a | 1.96 (1.51, 2.55)a | ||
| Sex | ||||
| Male | 2161 (51) | 2.2 (1.6, 2.8) | Ref | Ref |
| Female | 1778 (55) | 2.7 (2.0, 3.4) | 1.28 (0.87, 1.89) | 1.34 (0.86, 2.10) |
| Race and ethnicity | ||||
| Non-Hispanic Black | 1650 (33) | 1.9 (1.2, 2.5) | 0.60 (0.39, 0.92)a | 0.46 (0.28, 0.74)a |
| Hispanic | 497 (9) | 1.8 (0.6, 2.9) | 0.64 (0.31, 1.28) | 0.49 (0.23, 1.06) |
| Non-Hispanic White | 1638 (60) | 3.2 (2.4, 4.0) | Ref | Ref |
| Other | 154 (4) | 2.2 (0.0, 4.3) | 0.77 (0.28, 2.11) | 0.59 (0.21, 1.66) |
| Diabetes | ||||
| No | 2031 (49) | 2.0 (1.4, 2.6) | Ref | Ref |
| Yes | 1908 (57) | 3.0 (2.2, 3.8) | 1.53 (1.04, 2.27)a | 1.99 (1.29, 3.09)a |
| Body mass index (kg/m 2 ) | ||||
| ≥ 35 | 1148 (21) | 1.6 (0.9, 2.4) | 0.57 (0.33, 0.99)a | 0.51 (0.29, 0.91)a |
| 30 – <35 | 1028 (28) | 2.5 (1.6, 3.4) | 0.86 (0.53, 1.41) | 0.81 (0.50, 1.34) |
| 25 – <30 | 1124 (38) | 3.0 (2.0, 4.0) | Ref | Ref |
| < 25 | 628 (19) | 2.7 (1.5, 4.0) | 0.98 (0.56, 1.72) | 0.94 (0.53, 1.68) |
| Per 5 kg/m2 lower | 1.26 (1.08, 1.47)a | 1.30 (1.10, 1.52)a | ||
| Dietary calcium intake (food and supplements), per 100 mg/d lower | 1.01 (0.97, 1.06) | 1.02 (0.96, 1.08) | ||
| Physical activity, per 10 MET/week lower | 1.02 (1.00, 1.04)a | 1.01 (0.99, 1.03) | ||
| Steroid use | ||||
| No | 3548 (89) | 2.3 (1.8, 2.7) | Ref | Ref |
| Yes | 391 (17) | 4.0 (2.1, 6.0) | 1.68 (1.00, 2.83)a | 1.80 (1.06, 3.07)a |
| Proton pump inhibitor use | ||||
| No | 3141 (82) | 2.3 (1.8, 2.9) | Ref | Ref |
| Yes | 742 (23) | 2.9 (1.7, 4.1) | 1.05 (0.66, 1.67) | 1.04 (0.65, 1.67) |
| Bicarbonate (mEq/L) | ||||
| ≥ 22 | 3232 (86) | 2.4 (1.9, 2.9) | Ref | Ref |
| < 22 | 676 (20) | 2.9 (1.6, 4.1) | 1.47 (0.90, 2.41) | 1.19 (0.71, 1.99) |
| Per 1 mEq/L lower | 1.03 (0.97, 1.09) | 1.00 (0.94, 1.07) | ||
| eGFR (mL/min per 1.73 m 2 ) | ||||
| ≥ 60 | 606 (12) | 1.6 (0.7, 2.5) | Ref | Ref |
| 45 – <60 | 1159 (32) | 2.3 (1.5, 3.1) | 1.16 (0.59, 2.29) | 1.08 (0.54, 2.16) |
| 30 – <45 | 1433 (35) | 2.3 (1.5, 3.1) | 1.19 (0.60, 2.36) | 1.05 (0.52, 2.14) |
| < 30 | 741 (27) | 3.9 (2.4, 5.4) | 2.36 (1.15, 4.86)a | 1.94 (0.89, 4.23) |
| Per 10 mL/min per 1.73 m2 lower | 1.17 (1.01, 1.36)a | 1.12 (0.95, 1.31) | ||
| Proteinuria (g/24 h) | ||||
| < 0.10 | 1375 (43) | 2.6 (1.8, 3.4) | Ref | Ref |
| 0.10 – <0.50 | 1095 (30) | 2.4 (1.5, 3.3) | 1.14 (0.71, 1.84) | 1.05 (0.65, 1.71) |
| 0.50 – <1.50 | 583 (12) | 2.0 (0.8, 3.1) | 1.23 (0.64, 2.38) | 1.16 (0.58, 2.33) |
| ≥ 1.50 | 690 (19) | 2.8 (1.5, 4.1) | 2.14 (1.20, 3.80)a | 2.04 (1.03, 4.02)a |
| Per 500 mg/gCr higher | 1.04 (0.98, 1.09) | 1.02 (0.96, 1.08) | ||
Model 1 adjusted for age, sex, and race and ethnicity (excluding the variable when it was the exposure). Model 2 additionally adjusted for diabetes, smoking status, self-reported physical activity, systolic blood pressure, body mass index, dietary calcium intake from food and supplements, dietary vitamin D intake from food and supplements, anti-hypertensive use, statin use, bisphosphonate use, estrogen-containing medications, steroid use, eGFR, and log-transformed proteinuria (excluding body mass index, dietary calcium intake, eGFR, or proteinuria when it was the exposure).
P < 0.05.
CI, confidence interval; MET, metabolic equivalent of task; eGFR, estimated glomerular filtration rate.
Table 3.
Associations of time-updated exposures with hip and vertebral fractures (N = 3939).
| N events | Incidence rate, events/1000 person-years (95% CI) | Hazard Ratio (95% CI) | ||
|---|---|---|---|---|
| Model 1 | Model 2 | |||
| Kidney function | ||||
| eGFR ≥60 | 8 | 1.2 (0.4, 2.0) | Ref | Ref |
| eGFR 45 – <60 | 20 | 1.9 (1.1, 2.9) | 1.38 (0.60, 3.16) | 1.33 (0.58, 3.04) |
| eGFR 30 – <45 | 24 | 2.0 (1.2, 2.8) | 1.38 (0.61, 3.13) | 1.31 (0.57, 3.00) |
| eGFR <30 | 23 | 2.5 (1.6, 3.7) | 2.04 (0.89, 4.66) | 1.88 (0.79, 4.46) |
| Transplant | 7 | 3.9 (1.2, 7.3) | 4.26 (1.53, 11.92)b | 2.48 (0.86, 7.14) |
| Kidney failure treated with dialysis | 24 | 6.0 (3.8, 8.7) | 6.28 (2.72, 14.48)b | 4.53 (1.77, 11.60)b |
| eGFR, per 10 mL/min per 1.73 m2 lowera | 1.29 (1.14, 1.46)b | 1.20 (1.04, 1.38)b | ||
| Proteinuria (g/24 h) a | ||||
| < 0.10 | 30 | 2.0 (1.3, 2.7) | Ref | Ref |
| 0.10 – <0.50 | 39 | 2.5 (1.7, 3.4) | 1.54 (0.92, 2.55) | 1.21 (0.71, 2.03) |
| 0.50 – <1.50 | 21 | 2.6 (1.5, 3.9) | 2.16 (1.19, 3.92)b | 1.32 (0.68, 2.56) |
| ≥ 1.50 | 16 | 2.8 (1.8, 4.0) | 2.94 (1.65, 5.21)b | 1.51 (0.74, 3.06) |
| Proteinuria, per 500 mg/gCr highera | 1.06 (1.02, 1.09)b | 1.02 (0.98, 1.07) | ||
| Serum Calcium (mg/dL) a | ||||
| ≥ 8.5 | 95 | 2.3 (1.9, 2.8) | Ref | Ref |
| < 8.5 | 11 | 4.2 (2.0, 7.1) | 2.87 (1.50, 5.47)b | 1.59 (0.80, 3.16) |
| Per 1 mg/dL lower | 1.84 (1.32, 2.55)b | 1.44 (1.02, 2.03)b | ||
| Serum Bicarbonate (mEq/L) a | ||||
| ≥ 22 | 65 | 2.0 (1.5, 2.4) | Ref | Ref |
| < 22 | 41 | 3.9 (2.7, 5.1) | 2.36 (1.58, 3.51)b | 1.66 (1.07, 2.56)b |
| Per 1 mEq/L lower | 1.14 (1.07, 1.20)b | 1.07 (1.01, 1.14)b | ||
The units of eGFR are mL/min per 1.73 m2. Model 1 adjusted for age, sex, and race and ethnicity. Model 2 additionally adjusted for diabetes, smoking status, self-reported physical activity, systolic blood pressure, body mass index, dietary calcium intake from food and supplements, dietary vitamin D intake from food and supplements, anti-hypertensive use, statin use, bisphosphonate use, estrogen-containing medications, steroid use, eGFR, and log-transformed proteinuria (excluding eGFR or proteinuria when it was the exposure). Model covariates were time-updated.
Participants who progressed to maintenance dialysis or kidney transplantation were censored at the time of dialysis initiation or kidney transplantation in analyses of continuous eGFR, proteinuria, and serum calcium and bicarbonate.
P < 0.05.
eGFR, estimated glomerular filtration rate.
Figure 1.
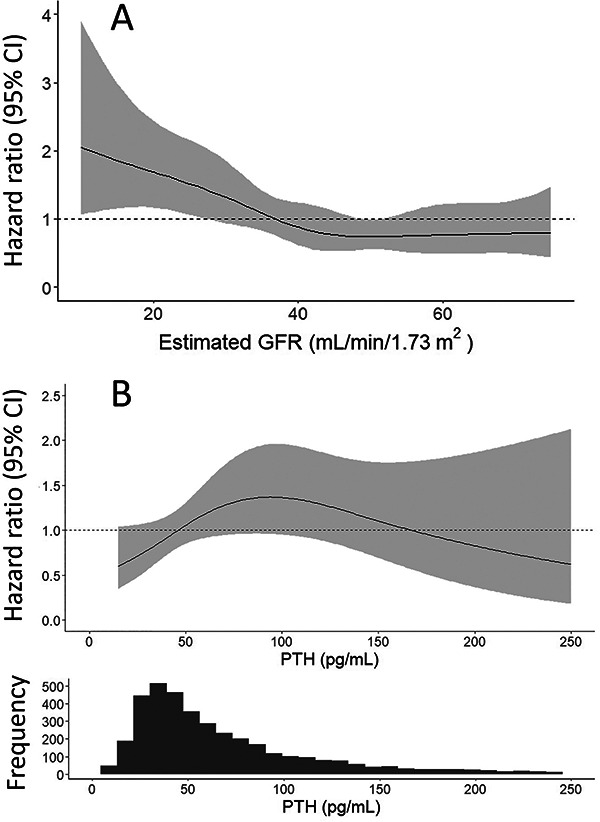
Associations of eGFR and PTH as continuous variables with risk of hip and vertebral fractures. The generalized additive models estimate the hazard ratio of hip and vertebral fractures according to (A) time-updated eGFR and (B) baseline PTH. The models are adjusted for age, sex, race and ethnicity, diabetes, smoking status, self-reported physical activity, systolic blood pressure, body mass index, dietary calcium intake from food and supplements, dietary vitamin D intake from food and supplements, anti-hypertensive use, statin use, bisphosphonate use, estrogen-containing medications, steroid use, log-transformed proteinuria. The PTH model additionally adjusts for eGFR. Covariates in the time-updated eGFR model are also time-updated. The shaded areas represent the 95% CI. The histogram shows the distribution of PTH concentration at baseline. eGFR, estimated glomerular filtration rate; PTH, parathyroid hormone; CI, confidence interval.
Among the biomarkers of mineral metabolism tested, PTH above the upper normal limit for the assay used (57 pg/mL) was significantly associated with higher fracture risk in the final covariate-adjusted model (HR 1.70; 95% CI: 1.10, 2.65; Table 4). Generalized additive modeling suggested a positive adjusted association between PTH and fracture risk to a PTH of ~100 pg/mL, above which the confidence intervals notably widened (Figure 1). Time-updated serum calcium, but not baseline serum calcium, was also associated with higher fracture risk (HR 1.44 per 1 mg/dL lower serum calcium; 95% CI: 1.02, 2.03; Table 3). Although hazard ratios suggested increased fracture risk with lower values of each of the three vitamin D measures and higher FGF-23, none of these associations were statistically significant after covariate adjustment and confidence intervals were wide.
Table 4.
Associations of biomarkers of mineral metabolism measured at a single time point with hip and vertebral fractures.
| N at risk (N events) | Incidence rate, events/1000 person-years (95% CI) | Hazard Ratio (95% CI) | ||
|---|---|---|---|---|
| Model 1 | Model 2 | |||
| Vitamin D metabolites (N = 1784) | ||||
| 25(OH)D (ng/mL) | ||||
| < 20 | 1059 (29) | 2.5 (1.3, 3.9) | 1.86 (0.82, 4.22) | 2.41 (0.86, 6.73) |
| ≥ 20 | 725 (17) | 2.7 (1.3, 4.5) | Ref | Ref |
| Per 1 SD lower | 1.44 (0.97, 2.13) | 1.58 (0.99, 2.50) | ||
| 1,25(OH) 2 D | ||||
| Tertile 1 | 702 (19) | 2.1 (0.8, 3.8) | 2.33 (0.90, 6.00) | 1.62 (0.56, 4.65) |
| Tertile 2 | 547 (18) | 3.4 (1.7, 5.7) | 2.08 (0.81, 5.33) | 1.76 (0.71, 4.35) |
| Tertile 3 | 535 (9) | 2.2 (0.7, 4.2) | Ref | Ref |
| Per 1 SD lower | 1.33 (0.99, 1.78) | 1.06 (0.77, 1.44) | ||
| VDMR | ||||
| Tertile 1 | 680 (15) | 2.4 (1.0, 4.1) | 1.57 (0.59, 4.17) | 0.94 (0.32, 2.72) |
| Tertile 2 | 595 (19) | 4.0 (2.0, 6.3) | 2.05 (0.88, 4.81) | 1.58 (0.72, 3.50) |
| Tertile 3 | 509 (12) | 1.5 (0.3, 2.9) | Ref | Ref |
| Per 1 SD lower | 1.38 (1.07, 1.78)a | 1.17 (0.87, 1.58) | ||
| Related measures of mineral metabolism (N = 3939) | ||||
| PTH (pg/mL) | ||||
| ≤ 57 | 2050 (51) | 2.1 (1.5, 2.7) | Ref | Ref |
| > 57 | 1809 (53) | 2.9 (2.1, 3.7) | 1.66 (1.12, 2.46)a | 1.70 (1.10, 2.65)a |
| Per 1 SD higher log-transformed PTH | 1.15 (0.93, 1.42) | 1.11 (0.87, 1.42) | ||
| C-FGF-23 | ||||
| Tertile 1 | 1294 (26) | 1.6 (1.0, 2.2) | Ref | Ref |
| Tertile 2 | 1292 (40) | 2.7 (1.9, 3.5) | 1.50 (0.91, 2.46) | 1.30 (0.77, 2.20) |
| Tertile 3 | 1293 (39) | 3.2 (2.2, 4.3) | 2.08 (1.25, 3.45)a | 1.53 (0.85, 2.74) |
| Per 1 SD higher in log-transformed C-FGF-23 | 1.35 (1.11, 1.64)a | 1.20 (0.95, 1.51) | ||
| Serum Calcium (mg/dL) | ||||
| < 8.5 | 229 (4) | 1.8 (0.0, 3.6) | 1.11 (0.40, 3.06) | 0.83 (0.29, 2.35) |
| ≥ 8.5 | 3678 (101) | 2.5 (2.0, 2.9) | Ref | Ref |
| Per 1 mg/dL lower | 0.97 (0.65, 1.44) | 0.86 (0.57, 1.29) | ||
| Serum Phosphate (mg/dL) | ||||
| ≤ 4.5 | 3459 (90) | 2.3 (1.8, 2.8) | Ref | Ref |
| > 4.5 | 412 (14) | 3.7 (1.8, 5.6) | 2.01 (1.13, 3.57)a | 1.56 (0.84, 2.90) |
| Per 1 mg/dL higher | 1.49 (1.12, 1.98)a | 1.32 (0.95, 1.83) | ||
| Urine Calcium Excretion (mg/day) | ||||
| Tertile 1 | 1256 (29) | 2.2 (1.4, 2.9) | Ref | Ref |
| Tertile 2 | 1256 (43) | 3.2 (2.2, 4.2) | 1.36 (0.85, 2.19) | 1.54 (0.95, 2.49) |
| Tertile 3 | 1256 (32) | 2.1 (1.4, 2.9) | 0.89 (0.53, 1.50) | 1.13 (0.64, 1.99) |
| Per 100 mg/24 h higher | 0.79 (0.57, 1.10) | 0.90 (0.63, 1.28) | ||
| Urine Phosphate Excretion | ||||
| Tertile 1 | 1256 (36) | 2.7 (1.8, 3.7) | Ref | Ref |
| Tertile 2 | 1256 (39) | 2.8 (1.9, 3.7) | 0.99 (0.62, 1.58) | 1.18 (0.73, 1.91) |
| Tertile 3 | 1256 (29) | 1.9 (1.2, 2.7) | 0.73 (0.43, 1.25) | 0.92 (0.52, 1.64) |
| Per 100 mg/24 h higher | 0.97 (0.91, 1.04) | 1.01 (0.94, 1.08) | ||
Vitamin D analyses are weight-adjusted to account for the non-random sampling of this subset of participants (N = 1784). Incidence rates for vitamin D metabolites are based on the randomly selected participants of this subset (N = 1101). Analyses of the remaining exposures use the entire CRIC Study population (N = 3939). Follow-up time was from the 1-year study visit for vitamin D metabolites and from the baseline examination for the other non-vitamin D exposures; 57 ng/mL is the upper limit of normal for the PTH assay used. Model 1 adjusted for age, sex, and race and ethnicity. Model 2 additionally adjusted for diabetes, smoking status, self-reported physical activity, systolic blood pressure, body mass index, dietary calcium intake from food and supplements, dietary vitamin D intake from food and supplements, anti-hypertensive use, statin use, bisphosphonate use, estrogen-containing medications, steroid use, eGFR, and log-transformed proteinuria.
P < 0.05.
CI, confidence interval; 25(OH)D, 25-hydroxyvitamin D; SD, standard deviation; 1,25(OH)2D, 1,25-dihydroxyvitamin D; VDMR, vitamin D metabolite ratio; PTH, parathyroid hormone; C-FGF-23, C-terminal fibroblast growth factor-23.
Discussion
In this longitudinal cohort study, we found that lower eGFR was associated with higher fracture risk, and the risk was greatest in kidney failure treated with dialysis. Baseline proteinuria, PTH above the normal range, and lower serum calcium and bicarbonate were also associated with higher fracture risk, while lower dietary calcium intake, lower vitamin D status, other measures of mineral metabolism, and proton pump inhibitor use were not. We also confirmed associations of several established risk factors derived from the general population, such as older age, diabetes, lower BMI, and steroid use, with higher fracture risk in this large population of patients with CKD.
Prior studies evaluating fracture risk in persons with CKD,3-6 while having large sample sizes (N = 9704–679 114), have largely used one-time measurements of eGFR and proteinuria, or focused exclusively on populations with kidney failure treated with dialysis7,8 or kidney transplantation.26 To our knowledge, our study is the first to test associations of time-updated measures of kidney function and proteinuria with fracture risk. By doing so in a population with a broad range of CKD severity, we were able to directly compare incidence rates across the full spectrum of kidney disease from non-dialysis dependent CKD to kidney failure treated with dialysis and kidney transplantation. The highest risk of fracture was seen in those on dialysis, which is consistent with the known severity of CKD-MBD abnormalities in this population. We found a positive association between baseline proteinuria and fractures, but not time-updated proteinuria and fractures in models that adjusted for time-updated covariates including eGFR. This may be expected if the association between proteinuria and fracture risk is mediated by a subsequent worsening of eGFR and development of kidney failure. Alternatively, it could be that hypothesized effects of proteinuria on fractures is harmful over many years rather than in the short-term. Notably, our overall event rate was lower than event rates reported in other non-dialysis dependent CKD cohorts, which has ranged from 3.9 to 46.3 per 1000 person-years.2,3 This may be due to differences in the methods used to assess fractures and the sites of the fractures assessed. Our reliance on inpatient codes will have missed outpatient fractures, especially vertebral fractures, which are often subclinical. We also studied a relatively young population, whose baseline age was nearly 20 years younger than another cohort of >100 000 participants with CKD.3 It is also possible that the CRIC Study population is a comparatively healthier CKD cohort than others.
PTH rises in CKD to compensate for 1,25(OH)2D deficiency, hypocalcemia, and hyperphosphatemia, but does so by increasing bone resorption, which may lower bone mineral density (BMD) and lead to fractures. Associations of PTH with fractures have been well-studied in the dialysis population8-10 and in children with CKD,27 but less so in non-dialysis dependent adults with CKD. The last international guideline on optimal PTH concentration in non-dialysis dependent CKD, which recommended that clinicians consider PTH-lowering therapies for persistently elevated PTH, was published in 2017 based on grade 2C evidence (very weak and low quality).28 Since then, Geng et al. reported positive associations of PTH with fracture risk in a population with stage 3 and 4 CKD.29 This finding is generally supported by our study, although we identified increased risk at a PTH threshold above the normal range, whereas Geng et al. found increased fracture risk at any PTH concentration. While not entirely unexpected given the role of calcium in the mineralized skeleton, few studies have directly identified hypocalcemia as a risk factor for fracture in non-dialysis dependent adults with CKD. This may simply be an issue of reduced availability of calcium leading to abnormal bone mineralization, as with the pathogenesis of rickets and osteomalacia; lower serum calcium has previously been associated with mineralization defects in histomorphometric studies of pediatric participants with stage 2-5 CKD and adults on dialysis.30,31 This effect could be mediated by PTH. Alternatively, confounding by other components of CKD-MBD, such as 1,25-dihdroxyvitamin D deficiency and consequent reduced dietary calcium absorption, is also possible. In our prior work, we observed that lower VDMR was associated with fractures in populations that included some participants with mild CKD.17,32 In this study, we did not observe significant associations between any of the vitamin D measures and fracture risk, although the estimates were in the direction seen in prior studies, and our study likely had insufficient power to detect these associations given that vitamin D metabolites were only measured in a subset of the CRIC Study population. Whether or not PTH-lowering therapies, including activated and supplemental vitamin D, reduce clinical fractures in CKD remains uncertain and untested by randomized clinical trials. The few trials of activated vitamin D on BMD in CKD have been small and have produced mixed results.33 Large trials of vitamin D supplementation in the general population without kidney disease or elevated PTH have also had mixed results for fractures.34,35
In one of the most racially and ethnically diverse CKD cohorts, we identified Black race as a protective factor for fractures compared with White race. The apparent “paradox” in the general population that Black Americans have higher BMD and lower fracture rates than White Americans despite markedly lower 25(OH)D and 1,25(OH)2D concentrations and higher PTH is well-described.36 It would appear that the severe mineral metabolism disturbances in CKD do not fundamentally alter the relationship between race, vitamin D status, and the yet unidentified factor(s) that may explain this paradox.
We found associations of diabetes, steroid use, and lower BMI with fracture risk. Few other large-scale studies have assessed whether traditional modifiable risk factors for fracture interact with CKD; among those that have, many lacked direct measurements of kidney function, relied on diagnosis codes to ascertain CKD status, and could not adjust for CKD severity. Diabetes may increase fracture risk through a variety of mechanisms, though data prior to this study have been mixed as to whether kidney disease compounds this risk. Two observational studies in Europe reported that a diagnosis code of diabetic kidney disease was associated with fractures in patients with type 1 diabetes,37,38 though they lacked eGFR and proteinuria measurements. Melton III et al. did not find that diabetic kidney disease was associated with higher fracture risk in patients with type 2 diabetes, and also lacked eGFR and proteinuria data.39 There are also very few studies on the risk of steroid-associated fractures in CKD. In a South Korean study of patients with a diagnosis code for glomerular disease, glucocorticoid exposure was associated with increased fracture risk regardless of dose.40 eGFR and proteinuria data were unavailable. Finally, two prior studies examined associations of BMI with fracture in CKD and had contrasting results. In a subgroup analysis of participants with CKD, South Korean adults who remained at a BMI <18.5 over an 8-year period had increased fracture risk compared with those who remained at normal BMI (HR 1.165; 95% CI: 1.113, 1.218).41 In contrast, BMI was not associated with adjudicated fractures in an ancillary study of the CREDENCE trial,42 though this study examined a slightly different population (mild kidney impairment [stage 2 and 3 CKD] exclusively from diabetic kidney disease) and had a shorter follow-up time (median 2.35 years).
Chronic acidosis suppresses bone formation and increases bone resorption, leading to a net efflux of calcium and other proton buffers from bone, which may result in reduced bone strength and fractures.43 Our time-updated analysis of bicarbonate is consistent with findings by Mathur et al., who also observed associations of lower serum bicarbonate with fractures in >50 000 persons with stage 3-5 CKD,44 as well as an abundance of experimental and observational studies that link metabolic acidosis with lower areal and volumetric BMD, impairments in bone quality, and higher markers of bone turnover.45 We can think of a few reasons why time-updated, and not baseline, serum bicarbonate was associated with fracture risk in our study. First, in vivo murine studies have shown that the cellular bone response to acidosis varies with the duration of acidosis.46 Whereas aberrant bone remodeling and function have been demonstrated in as short as 14 days of acidosis,47 these effects may attenuate over time as a result of compensatory mechanisms that may help stabilize bone mass.46 Second, serum bicarbonate concentrations change over time and baseline measurements may not have captured the complexity of a changing exposure. Alternatively, confounders and their relationship with serum bicarbonate also change over time, and time-dependent confounding may have led to biased time-updated results. Lastly, our analysis of baseline serum bicarbonate may have lacked power to detect true long-term associations with fracture. The mean serum bicarbonate concentration in the CRIC cohort was normal at baseline, in contrast to the population studied by Mathur et al., who had more prominent acidosis and significantly more events.44 Despite the supporting evidence, randomized trials of alkali therapy in CKD have not demonstrated effectiveness in improving bone health markers, BMD, or physical function48-50; trials that use fractures as clinical endpoints have not been conducted and are needed.
Strengths of our study include analyses across the full spectrum of kidney disease including kidney failure treated with dialysis and kidney transplantation, a comprehensive assessment of traditional and kidney-related risk factors for fracture, and comprehensive measurements of biomarkers of CKD-MBD. We used gold standard methods for the measurement of exposures, such as 24-h urine collections for protein, calcium, and phosphate excretion and LC–MS/MS for vitamin D metabolites. This study also has important limitations. First, this study is observational and subject to confounding. Second, most of our exposures were only measured once and may not capture the complexity of changing values over time. This includes the vitamin D measures, which were measured in a subset of CRIC participants, and their analyses may be underpowered. Third, we tested 21 exposures and acknowledge the potential of false positive findings as a limitation.
In conclusion, lower eGFR, lower serum calcium, lower serum bicarbonate, proteinuria, and elevated PTH are kidney-related risk factors associated with fracture risk in persons with non-dialysis dependent CKD. Associations of several modifiable risk factors that are well-established in the general population, such as diabetes, steroid use, and lower BMI, with fractures suggest that they remain important for fracture prevention in CKD. Future studies are needed to develop or improve fracture risk prediction tools for the CKD population and confirm whether risk factor-modifying therapies reduce fracture risk.
Supplementary Material
Acknowledgments
The authors thank the other investigators, the staff, and the participants of the CRIC Study for their valuable contributions. The data from CRIC reported here were supplied by the NIDDK Central Repositories. This manuscript was not prepared in collaboration with the investigators of the CRIC study and does not necessarily reflect the opinions or views of the CRIC study, the NIDDK Central Repositories, or NIDDK. None of the entities listed above were involved in the design and conduct of the study; collection, management, analysis, and interpretation of the data; preparation, review, or approval of the manuscript; and the decision to submit the manuscript for publication.
Contributor Information
Simon Hsu, Division of Nephrology and Kidney Research Institute, Department of Medicine, University of Washington, Seattle, WA 98195, United States.
Nisha Bansal, Division of Nephrology and Kidney Research Institute, Department of Medicine, University of Washington, Seattle, WA 98195, United States.
Michelle Denburg, Division of Nephrology, Children's Hospital of Philadelphia, Philadelphia, PA 19104, United States; Departments of Pediatrics and Biostatistics, Epidemiology, and Informatics, Perelman School of Medicine at the University of Pennsylvania, Philadelphia, PA 19104, United States.
Charles Ginsberg, Division of Nephrology-Hypertension, University of California, San Diego, San Diego, CA 92103, United States.
Andrew N Hoofnagle, Department of Laboratory Medicine, University of Washington, Seattle, WA 98195, United States.
Tamara Isakova, Division of Nephrology and Hypertension, Center for Translational Metabolism and Health, Institute for Public Health and Medicine, Northwestern University Feinberg School of Medicine, Chicago, IL 60611, United States.
Joachim H Ix, Division of Nephrology-Hypertension, University of California, San Diego, San Diego, CA 92103, United States.
Cassianne Robinson-Cohen, Division of Nephrology, Vanderbilt University Medical Center, Nashville, TN 37232, United States.
Myles Wolf, Division of Nephrology, Department of Medicine, Duke Clinical Research Institute, Duke University School of Medicine, Durham, NC 27710, United States.
Bryan R Kestenbaum, Division of Nephrology and Kidney Research Institute, Department of Medicine, University of Washington, Seattle, WA 98195, United States.
Ian H de Boer, Division of Nephrology and Kidney Research Institute, Department of Medicine, University of Washington, Seattle, WA 98195, United States.
Leila R Zelnick, Division of Nephrology and Kidney Research Institute, Department of Medicine, University of Washington, Seattle, WA 98195, United States.
Author contributions
Simon Hsu (Conceptualization, Funding acquisition, Investigation, Methodology, Writing—original draft, Writing—review & editing), Nisha Bansal (Funding acquisition, Investigation, Methodology, Writing—review & editing), Michelle Denburg (Funding acquisition, Investigation, Methodology, Writing—review & editing), Charles Ginsberg (Investigation, Methodology, Writing—review & editing), Andrew Hoofnagle (CRediT contribution not specified), Tamara Isakova (Funding acquisition, Investigation, Methodology, Writing—review & editing), Joachim Ix (Investigation, Methodology, Writing—review & editing), Cassianne Robinson-Cohen (Investigation, Methodology, Writing—review & editing), Myles Wolf (Investigation, Methodology, Writing—review & editing), Bryan Kestenbaum (Funding acquisition, Investigation, Methodology, Writing—review & editing), Ian H. de Boer (Conceptualization, Funding acquisition, Investigation, Methodology, Supervision, Writing—review & editing), and Leila R. Zelnick (Conceptualization, Data curation, Formal analysis, Funding acquisition, Investigation, Methodology, Supervision, Validation, Writing—review & editing)
Funding
This research was supported by R01DK099199 and K23DK136930. Funding for the CRIC Study was obtained under a cooperative agreement from National Institute of Diabetes and Digestive and Kidney Diseases (U01DK060990, U01DK060984, U01DK061022, U01DK061021, U01DK061028, U01DK060980, U01DK060963, U01DK060902 and U24DK060990). In addition, this work was supported in part by: the Perelman School of Medicine at the University of Pennsylvania Clinical and Translational Science Award NIH/NCATS UL1TR000003, Johns Hopkins University UL1 TR-000424, University of Maryland GCRC M01 RR-16500, Clinical and Translational Science Collaborative of Cleveland, UL1TR000439 from the National Center for Advancing Translational Sciences (NCATS) component of the National Institutes of Health and NIH roadmap for Medical Research, Michigan Institute for Clinical and Health Research (MICHR) UL1TR000433, University of Illinois at Chicago CTSA UL1RR029879, Tulane COBRE for Clinical and Translational Research in Cardiometabolic Diseases P20 GM109036, Kaiser Permanente NIH/NCRR UCSF-CTSI UL1 RR-024131, Department of Internal Medicine, University of New Mexico School of Medicine Albuquerque, NM R01DK119199, R01DK122075, and University of Washington Nutrition Obesity Research Center P30DK035816. Dr. Isakova is supported by grant R01DK110087 from NIDDK and grant K24HL150235 from NHLBI. Additional support was provided through an unrestricted fund from the Northwest Kidney Centers.
Conflicts of interest
None declared.
Data availability
This analysis used data from the National Institute of Diabetes and Digestive and Kidney Diseases (NIDDK) Central Repositories, which is publicly available and can be accessed through request at https://repository.niddk.nih.gov/studies/cric.
References
- 1.Kim SM, Long J, Montez-Rath M, Leonard M, Chertow GM. Hip fracture in patients with non-dialysis-requiring chronic kidney disease. J Bone Miner Res. 2016;31(10):1803–1809. 10.1002/jbmr.2862 [DOI] [PubMed] [Google Scholar]
- 2.Pimentel A, Ureña-Torres P, Zillikens MC, Bover J, Cohen-Solal M. Fractures in patients with CKD - diagnosis, treatment, and prevention: a review by members of the European Calcified Tissue Society and the European Renal Association of Nephrology Dialysis and Transplantation. Kidney Int. 2017;92(6):1343–1355. 10.1016/j.kint.2017.07.021 [DOI] [PubMed] [Google Scholar]
- 3.Naylor KL, McArthur E, Leslie WD, et al. The three-year incidence of fracture in chronic kidney disease. Kidney Int. 2014;86(4):810–818. 10.1038/ki.2013.547 [DOI] [PubMed] [Google Scholar]
- 4.Ensrud KE, Lui LY, Taylor BC, et al. Renal function and risk of hip and vertebral fractures in older women. Arch Intern Med. 2007;167(2):133–139. 10.1001/archinte.167.2.133 [DOI] [PubMed] [Google Scholar]
- 5.Fried LF, Biggs ML, Shlipak MG, et al. Association of kidney function with incident hip fracture in older adults. J Am Soc Nephrol. 2007;18(1):282–286. 10.1681/ASN.2006050546 [DOI] [PubMed] [Google Scholar]
- 6.Dooley AC, Weiss NS, Kestenbaum B. Increased risk of hip fracture among men with CKD. Am J Kidney Dis. 2008;51(1):38–44. 10.1053/j.ajkd.2007.08.019 [DOI] [PubMed] [Google Scholar]
- 7.Jadoul M, Albert JM, Akiba T, et al. Incidence and risk factors for hip or other bone fractures among hemodialysis patients in the dialysis outcomes and practice patterns study. Kidney Int. 2006;70(7):1358–1366. 10.1038/sj.ki.5001754 [DOI] [PubMed] [Google Scholar]
- 8.Stehman-Breen CO, Sherrard DJ, Alem AM, et al. Risk factors for hip fracture among patients with end-stage renal disease. Kidney Int. 2000;58(5):2200–2205. 10.1111/j.1523-1755.2000.00394.x [DOI] [PubMed] [Google Scholar]
- 9.Matias PJ, Laranjinha I, Azevedo A, et al. Bone fracture risk factors in prevalent hemodialysis patients. J Bone Miner Metab. 2020;38(2):205–212. 10.1007/s00774-019-01041-9 [DOI] [PubMed] [Google Scholar]
- 10.Danese MD, Kim J, Doan QV, Dylan M, Griffiths R, Chertow GM. PTH and the risks for hip, vertebral, and pelvic fractures among patients on dialysis. Am J Kidney Dis. 2006;47(1):149–156. 10.1053/j.ajkd.2005.09.024 [DOI] [PubMed] [Google Scholar]
- 11.Feldman HI, Appel LJ, Chertow GM, et al. The chronic renal insufficiency cohort (CRIC) study: design and methods. J Am Soc Nephrol. 2003;14(suppl_2):S148–S153. 10.1097/01.ASN.0000070149.78399.CE [DOI] [PubMed] [Google Scholar]
- 12.Bertoni AG, Whitt-Glover MC, Chung H, et al. The association between physical activity and subclinical atherosclerosis: the multi-ethnic study of atherosclerosis. Am J Epidemiol. 2009;169(4):444–454. 10.1093/aje/kwn350 [DOI] [PMC free article] [PubMed] [Google Scholar]
- 13.Joffe M, Hsu CY, Feldman HI, et al. Variability of creatinine measurements in clinical laboratories: results from the CRIC study. Am J Nephrol. 2010;31(5):426–434. 10.1159/000296250 [DOI] [PMC free article] [PubMed] [Google Scholar]
- 14.Isakova T, Cai X, Lee J, et al. Longitudinal evolution of markers of mineral metabolism in patients with CKD: the chronic renal insufficiency cohort (CRIC) study. Am J Kidney Dis. 2020;75(2):235–244. 10.1053/j.ajkd.2019.07.022 [DOI] [PMC free article] [PubMed] [Google Scholar]
- 15.Bansal N, Katz R, Appel L, et al. Vitamin D metabolic ratio and risks of death and CKD progression. Kidney Int Rep. 2019;4(11):1598–1607. 10.1016/j.ekir.2019.08.014 [DOI] [PMC free article] [PubMed] [Google Scholar]
- 16.de Boer IH, Sachs MC, Chonchol M, et al. Estimated GFR and circulating 24,25-dihydroxyvitamin D3 concentration: a participant-level analysis of 5 cohort studies and clinical trials. Am J Kidney Dis. 2014;64(2):187–197. 10.1053/j.ajkd.2014.02.015 [DOI] [PMC free article] [PubMed] [Google Scholar]
- 17.Ginsberg C, Katz R, de Boer IH, et al. The 24,25 to 25-hydroxyvitamin D ratio and fracture risk in older adults: the cardiovascular health study. Bone. 2018;107:124–130. 10.1016/j.bone.2017.11.011 [DOI] [PMC free article] [PubMed] [Google Scholar]
- 18.Wright NC, Daigle SG, Melton ME, Delzell ES, Balasubramanian A, Curtis JR. The design and validation of a new algorithm to identify incident fractures in administrative claims data. J Bone Miner Res. 2019;34(10):1798–1807. 10.1002/jbmr.3807 [DOI] [PubMed] [Google Scholar]
- 19.Hsu S, Criqui MH, Ginsberg C, et al. Biomarkers of vitamin D metabolism and hip and vertebral fracture risk: the multi-ethnic study of atherosclerosis. JBMR Plus. 2022;6(12):e10697. 10.1002/jbm4.10697 [DOI] [PMC free article] [PubMed] [Google Scholar]
- 20.van Buuren S, Groothuis-Oudshoorn K. Mice: multivariate imputation by chained equations in R. J Stat Softw. 2011;45(3):1–67. 10.18637/jss.v045.i03 [DOI] [Google Scholar]
- 21.Rubin DB. Multiple Imputation for Nonresponse in Surveys. New York, NY: John Wiley & Sons; 1987. [Google Scholar]
- 22.Borgan O, Langholz B, Samuelsen SO, Goldstein L, Pogoda J. Exposure stratified case-cohort designs. Lifetime Data Anal. 2000;6(1):39–58. 10.1023/A:1009661900674 [DOI] [PubMed] [Google Scholar]
- 23.Hsu S, Zelnick LR, Bansal N, et al. Vitamin D metabolites and risk of cardiovascular disease in chronic kidney disease: the CRIC study. J Am Heart Assoc. 2023;12(14):e028561. 10.1161/JAHA.122.028561 [DOI] [PMC free article] [PubMed] [Google Scholar]
- 24.Dekker FW, de Mutsert R, van Dijk PC, Zoccali C, Jager KJ. Survival analysis: time-dependent effects and time-varying risk factors. Kidney Int. 2008;74(8):994–997. 10.1038/ki.2008.328 [DOI] [PubMed] [Google Scholar]
- 25.Wood SN. Generalized Additive Models: An Introduction with R. (2nd ed.) ed. Boca Raton, FL: Chapman and Hall/CRC; 2017. [Google Scholar]
- 26.Keronen S, Martola L, Finne P, et al. Bone volume, mineral density, and fracture risk after kidney transplantation. PLoS One. 2022;17(3):e0261686. 10.1371/journal.pone.0261686 [DOI] [PMC free article] [PubMed] [Google Scholar]
- 27.Denburg MR, Kumar J, Jemielita T, et al. Fracture burden and risk factors in childhood CKD: results from the CKiD cohort study. J Am Soc Nephrol. 2016;27(2):543–550. 10.1681/ASN.2015020152 [DOI] [PMC free article] [PubMed] [Google Scholar]
- 28.Kidney Disease: Improving Global Outcomes (KDIGO) CKD-MBD Update Work Group . KDIGO 2017 Clinical Practice Guideline Update for the Diagnosis, Evaluation, Prevention, and Treatment of Chronic Kidney Disease-Mineral and Bone Disorder (CKD-MBD). Kidney Int Suppl (2011). 2017;7(1):1–59. 10.1016/j.kisu.2017.04.001 [DOI] [PMC free article] [PubMed] [Google Scholar]
- 29.Geng S, Kuang Z, Peissig PL, Page D, Maursetter L, Hansen KE. Parathyroid hormone independently predicts fracture, vascular events, and death in patients with stage 3 and 4 chronic kidney disease. Osteoporos Int. 2019;30(10):2019–2025. 10.1007/s00198-019-05033-3 [DOI] [PubMed] [Google Scholar]
- 30.Wesseling-Perry K, Pereira RC, Tseng CH, et al. Early skeletal and biochemical alterations in pediatric chronic kidney disease. Clin J Am Soc Nephrol. 2012;7(1):146–152. 10.2215/CJN.05940611 [DOI] [PMC free article] [PubMed] [Google Scholar]
- 31.Malluche HH, Davenport DL, Cantor T, Monier-Faugere M-C. Bone mineral density and serum biochemical predictors of bone loss in patients with CKD on dialysis. Clin J Am Soc Nephrol. 2014;9(7):1254–1262. 10.2215/CJN.09470913 [DOI] [PMC free article] [PubMed] [Google Scholar]
- 32.Ginsberg C, Hoofnagle AN, Katz R, et al. The vitamin D metabolite ratio is associated with changes in bone density and fracture risk in older adults. J Bone Miner Res. 2021;36(12):2343–2350. 10.1002/jbmr.4426 [DOI] [PMC free article] [PubMed] [Google Scholar]
- 33.Khelifi N, Desbiens LC, Sidibé A, Mac-Way F. Vitamin D analogues and fracture risk in chronic kidney disease: a systematic review and meta-analysis of randomized controlled trials. JBMR Plus. 2022;6(4):e10611. 10.1002/jbm4.10611 [DOI] [PMC free article] [PubMed] [Google Scholar]
- 34.Trivedi DP, Doll R, Khaw KT. Effect of four monthly oral vitamin D3 (cholecalciferol) supplementation on fractures and mortality in men and women living in the community: randomised double blind controlled trial. BMJ. 2003;326(7387):469. 10.1136/bmj.326.7387.469 [DOI] [PMC free article] [PubMed] [Google Scholar]
- 35.LeBoff MS, Chou SH, Ratliff KA, et al. Supplemental vitamin D and incident fractures in midlife and older adults. N Engl J Med. 2022;387(4):299–309. 10.1056/NEJMoa2202106 [DOI] [PMC free article] [PubMed] [Google Scholar]
- 36.Brown LL, Cohen B, Tabor D, Zappalà G, Maruvada P, Coates PM. The vitamin D paradox in Black Americans: a systems-based approach to investigating clinical practice, research, and public health—expert panel meeting report. BMC Proc. 2018;12(Suppl 6):6. 10.1186/s12919-018-0102-4 [DOI] [PMC free article] [PubMed] [Google Scholar]
- 37.Miao J, Brismar K, Nyrén O, Ugarph-Morawski A, Ye W. Elevated hip fracture risk in type 1 diabetic patients: a population-based cohort study in Sweden. Diabetes Care. 2005;28(12):2850–2855. 10.2337/diacare.28.12.2850 [DOI] [PubMed] [Google Scholar]
- 38.Vestergaard P, Rejnmark L, Mosekilde L. Diabetes and its complications and their relationship with risk of fractures in type 1 and 2 diabetes. Calcif Tissue Int. 2009;84(1):45–55. 10.1007/s00223-008-9195-5 [DOI] [PubMed] [Google Scholar]
- 39.Melton LJ III, Leibson CL, Achenbach SJ, Therneau TM, Khosla S. Fracture risk in type 2 diabetes: update of a population-based study. J Bone Miner Res. 2008;23(8):1334–1342. 10.1359/jbmr.080323 [DOI] [PMC free article] [PubMed] [Google Scholar]
- 40.Lee E, Lee MJ, Park B, Park I. Risk of fracture according to glucocorticoid use after renal biopsy: a nationwide population-based study. Sci Rep. 2020;10(1):13846. 10.1038/s41598-020-70935-w [DOI] [PMC free article] [PubMed] [Google Scholar]
- 41.Kim JG, Hong J-Y, Park J, et al. Risk of fracture according to temporal changes of low body weight changes in adults over 40 years: a nationwide population-based cohort study. BMC Public Health. 2023;23(1):948. 10.1186/s12889-023-15940-0 [DOI] [PMC free article] [PubMed] [Google Scholar]
- 42.Young TK, Toussaint ND, Di Tanna GL, et al. Risk factors for fracture in patients with coexisting chronic kidney disease and type 2 diabetes: an observational analysis from the CREDENCE trial. J Diabetes Res. 2022;2022:1–12. 10.1155/2022/9998891 [DOI] [PMC free article] [PubMed] [Google Scholar]
- 43.Bushinsky DA, Krieger NS. Effects of acid on bone. Kidney Int. 2022;101(6):1160–1170. 10.1016/j.kint.2022.02.032 [DOI] [PMC free article] [PubMed] [Google Scholar]
- 44.Mathur V, Reaven NL, Funk SE, et al. Association of metabolic acidosis with fractures, falls, protein-calorie malnutrition and failure to thrive in patients with chronic kidney disease. Clin Kidney J. 2022;15(7):1379–1386. 10.1093/ckj/sfac065 [DOI] [PMC free article] [PubMed] [Google Scholar]
- 45.Levy RV, McMahon DJ, Agarwal S, et al. Comprehensive associations between acidosis and the skeleton in patients with kidney disease. J Am Soc Nephrol. 2023;34(4):668–681. 10.1681/ASN.0000000000000085 [DOI] [PMC free article] [PubMed] [Google Scholar]
- 46.Assapun J, Charoenphandhu N, Krishnamra N. Early acceleration phase and late stationary phase of remodeling imbalance in long bones of male rats exposed to long-standing acidemia: a 10-month longitudinal study using bone histomorphometry. Calcif Tissue Int. 2009;85(1):1–9. 10.1007/s00223-009-9254-6 [DOI] [PubMed] [Google Scholar]
- 47.Peterson AK, Moody M, Nakashima I, et al. Effects of acidosis on the structure, composition, and function of adult murine femurs. Acta Biomater. 2021;121:484–496. 10.1016/j.actbio.2020.11.033 [DOI] [PubMed] [Google Scholar]
- 48.Melamed ML, Horwitz EJ, Dobre MA, et al. Effects of sodium bicarbonate in CKD stages 3 and 4: a randomized, placebo-controlled, multicenter clinical trial. Am J Kidney Dis. 2020;75(2):225–234. 10.1053/j.ajkd.2019.07.016 [DOI] [PMC free article] [PubMed] [Google Scholar]
- 49.BiCARB study group. Clinical and cost-effectiveness of oral sodium bicarbonate therapy for older patients with chronic kidney disease and low-grade acidosis (BiCARB): a pragmatic randomised, double-blind, placebo-controlled trial. BMC Med. 2020;18(1):91. 10.1186/s12916-020-01542-9 [DOI] [PMC free article] [PubMed] [Google Scholar]
- 50.Raphael KL, Katz R, Larive B, et al. Oral sodium bicarbonate and bone turnover in CKD: a secondary analysis of the BASE pilot trial. J Am Soc Nephrol. 2023;35(1):57–65. 10.1681/ASN.0000000000000264 [DOI] [PMC free article] [PubMed] [Google Scholar]
Associated Data
This section collects any data citations, data availability statements, or supplementary materials included in this article.
Supplementary Materials
Data Availability Statement
This analysis used data from the National Institute of Diabetes and Digestive and Kidney Diseases (NIDDK) Central Repositories, which is publicly available and can be accessed through request at https://repository.niddk.nih.gov/studies/cric.