

Abstract
Polymer–peptide hydrogels are being designed as implantable materials that deliver human mesenchymal stem cells (hMSCs) to treat wounds. Most wounds can progress through the healing process without intervention. During the normal healing process, cytokines are released from the wound to create a concentration gradient, which causes directed cell migration from the native niche to the wound site. Our work takes inspiration from this process and uniformly tethers cytokines into the scaffold to measure changes in cell-mediated degradation and motility. This is the first step in designing cytokine concentration gradients into the material to direct cell migration. We measure changes in rheological properties, encapsulated cell-mediated pericellular degradation and migration in a hydrogel scaffold with covalently tethered cytokines, either tumor necrosis factor- (TNF-) or transforming growth factor- (TGF-). TNF- is expressed in early stages of wound healing causing an inflammatory response. TGF- is released in later stages of wound healing causing an anti-inflammatory response in the surrounding tissue. Both cytokines cause directed cell migration. We measure no statistically significant difference in modulus or the critical relaxation exponent when tethering either cytokine in the polymeric network without encapsulated hMSCs. This indicates that the scaffold structure and rheology is unchanged by the addition of tethered cytokines. Increases in hMSC motility, morphology and cell-mediated degradation are measured using a combination of multiple particle tracking microrheology (MPT) and live-cell imaging in hydrogels with tethered cytokines. We measure that tethering TNF- into the hydrogel increases cellular remodeling on earlier days postencapsulation and tethering TGF- into the scaffold increases cellular remodeling on later days. We measure tethering either TGF- or TNF- enhances cell stretching and, subsequently, migration. This work provides rheological characterization that can be used to design new materials that present chemical cues in the pericellular region to direct cell migration.
Graphical Abstract

INTRODUCTION
Implantable polymer–peptide hydrogels are being designed to deliver human mesenchymal stem cells (hMSCs) to treat wounds, including chronic wounds.1–6 Once hMSCs arrive at the wound site, they progress the wound through the normal healing process and restart healing in chronic wounds that have stalled during inflammation.5 A current problem with implantable hydrogel scaffolds is ensuring hMSCs migrate from the scaffold to the wound.7 Cell migration can be manipulated by many environmental cues and in vivo studies have shown there are challenges directing cell migration from the gel to the wound.7,8 To address this, we characterize changes in cell-material interactions by measuring dynamic pericellular rheology and cell migration to determine the effect of tethering chemical cues into the scaffold.
Human mesenchymal stem cells are instrumental in the wound healing process. When a wound occurs it releases cytokines, causing directed hMSC migration.9–11 Once hMSCs arrive at the wound, they regulate inflammation by balancing levels of pro- and anti-inflammatory cytokines, which is essential for proper wound repair.5 Administering additional hMSCs to wounds has been shown to expedite the normal wound healing process and heal chronic wounds that without intervention would never fully heal.1,4,12 hMSCs accelerate wound closure rate, provide antiscarring and antimicrobial properties and increase new blood vessel formation rate.2 Although hMSCs provide these benefits to wounds, their delivery to wounds has been a challenge.8,13 Biomaterials have emerged as an effective vehicle for delivery of hMSCs to wounded tissues.14
hMSCs can be delivered intravenously, topically or using a scaffold.4 Advantages of using a synthetic hydrogel scaffold include the ability to tune material rheology to mimic aspects of the native tissue and incorporate chemical or physical cues, which can direct basic cellular processes.7,15–18 Synthetic hydrogels offer a blank slate to tether chemical cues or tailor material stiffness to enhance delivery.19–22 We use a well-defined poly(ethylene glycol) (PEG)-norbornene scaffold that has been used extensively for in vitro and in vivo experiments.2,3,16,17,19,20,23–31 In this work, we tether pro- and anti-inflammatory chemical cues into the scaffold and quantify how local rheological properties around encapsulated hMSCs and basic cellular processes change in response.
Our scaffold consists of a four-arm PEG-norbornene (PEG-N) as the backbone which is cross-linked with a matrix metalloproteinase (MMP)-degradable peptide to form a gel.16,32 As previously mentioned, the material is designed to be implanted at a wound site. After implantation, 3D encapsulated cells will secrete MMPs, cleaving the peptide cross-linker and degrading and remolding their microenvironment spatially and temporally.25 This material is designed to enable cell-mediated remodeling, but the material should also guide the cell from the gel to the wound site. To do this, we tether chemical cues found in the wound environment into the scaffold to enhance cell delivery.
hMSC motility is modeled as random unless the environment provides an effective cue for directed cell migration.7,33–35 To achieve successful directed cell migration, previous work has used several techniques including applying an electric current, patterning surfaces or creating gradients with stiffness or chemical cues.22,36–41 In this work, we investigate how covalently tethering either a pro- or anti-inflammatory cytokine found in the native wound environment into the hydrogel network could be effective in changing cell migration. Here, we uniformly present cytokines to encapsulated cells, a necessary first step prior to characterizing cell-material interactions when spatial gradients of cytokines are presented. The two cytokines chosen for this work are tumor necrosis factor- (TNF-) and transforming growth factor- (TGF-). TNF- is present in the early stages of wound healing and causes the surrounding tissue to inflame. In the later stages of wound healing, TGF- is present and decreases inflammation. Both of these cytokines effectively direct hMSC migration.41 Previously our group has characterized the effect of including a cytokine in the fluid environment on 3D encapsulated cells in a PEG-N hydrogel.19 In this work, they measure changes in encapsulated cell-mediated degradation and cell speed when hydrogels are incubated in fluid with dilute concentrations of TNF- or TGF- compared to no cytokine. From this work, we hypothesize we can begin to manipulate cell migration by tethering TNF- or TGF- into the scaffold.
Characterizing how a cell degrades and migrates through a scaffold is essential to account for in the design of hydrogel delivery systems.30 Material rheology plays a pivotal role in determining whether cells can migrate.17,42 If an encapsulated cell nucleus is smaller than the pore size of the surrounding region it cannot migrate, it must instead break enough cross-links or deform the network to make space to migrate. We will use multiple particle tracking microrheology (MPT) and cell tracking to characterize spatiotemporal hMSC-mediated degradation and remodeling in response to cytokines locally tethered into the scaffold.43–47 MPT measures the Brownian motion of embedded fluorescent particles, which can be related to rheological properties of the pericellular region.
Probe motion is related to the rheological properties of the material using the Generalized Stokes–Einstein Relation,
| (1) |
where is the particle radius, is the thermal energy, is the creep compliance, is the measured ensembleaveraged mean-squared displacement (MSD) and is the lag time.44,48 The logarithmic slope of the MSD, , determines the state of the material. When , probe particles are freely diffusing and the material is a viscous liquid. When , the material is gelled and the particles are not moving. When , probe motion is restricted and the material is either a viscoelastic solid or fluid. The combination of MPT and cell tracking measures both the time-dependent rheological properties around the cell and the relationship between rheology and cell motility.
We successfully tether either anti-inflammatory, TGF-, or pro-inflammatory, TNF-, cytokines into our scaffold and compare the rheological properties and dynamic structural evolution during degradation to hydrogels with no tethered cues. We measure no change in the structure or rheology of the scaffold with the addition of tethered cytokines. We 3D encapsulate hMSCs into these networks and measure significant changes in cell-mediated spatiotemporal rheology of the pericellular region when chemical cues are tethered into the material. We also measure cell area, elongation and motility of encapsulated cells. On early days postencapsulation, we measure an increase in cell-mediated degradation and encapsulated cell speed in scaffolds with tethered TNF-. On later days postencapsulation, we measure an increase in cell-mediated degradation and encapsulated cell speed in scaffolds with tethered TGF-. These findings are valuable in the design of synthetic hydrogels because they provide indepth dynamic measurements of how tethered chemical cues change cell-material interactions, which can be used to enhance cell delivery on early or later days postencapsulation.
MATERIALS AND METHODS
Hydrogel Scaffold.
The hydrogel used in this work is a photopolymerized scaffold composed of poly(ethylene glycol)-norbornene (PEG-N, , where is the number of functional groups, PEG is purchased functionalized with an ester linkage, , 3 mM, JenKem Technology) cross-linked with a MMP-degradable peptide (KCGPQG↓IWGQCK, , 3.9 mM, Bachem). The hydrogel precursor solution includes: PEG-N, MMP-degradable peptide cross-linker, a cellular adhesion ligand (CRGDS, , 1mM, American Peptide Inc.), a photoinitiator (Lithium phenyl-2, 4, 6-trimethylbenzoylphosphinate (LAP), , 1.7 mM), phosphate-buffered saline (1 × PBS, 51 vol %, Gibco), sodium hydroxide (0.1 vol %, 15 mM, Thermo Fisher Scientific) and hMSCs Lonza). LAP is a photoinitiator and is chosen for its ability to maintain high cell viability and inert reactivity toward cytokines. LAP is synthesized following previously published protocols.24,28 The final concentration of cells is chosen to minimize cell–cell interactions and provide a single cell in our field of view for data acquisition.26,30
To measure the effect of tethering cytokines into the scaffold either of thiolated transforming growth factor- (TGF-, PeproTech) or of thiolated tumor necrosis factor- (TNF-, PeproTech) are added to the hydrogel precursor solution. The cytokine thiolation procedure is described below. This chosen concentration mimics the concentration in a native wound environment.11 Although this is the initial concentration, the final concentration of cytokines tethered into the hydrogel is not precisely known. Previous work using this thiolation reaction on a similar biomacromolecule measures that 52% of the initial cytokine is tethered into the hydrogel.49 Therefore, the estimated final concentration of cytokine in our hydrogels is .11,49 As a control, we repeat all measurements in hydrogels with no functionalized cytokines.
The hydrogel precursor solution is pipetted into a sample chamber, described below, and exposed to ultraviolet (UV) light (, 365 nm, UVP, LLC) for 3 minutes.50 The scaffold is cross-linked at a thiol:ene ratio of 0.65 and cells are 3D encapsulated in a sample-spanning hydrogel network after UV exposure.
Human Mesenchymal Stem Cell (hMSC) Culture.
Bone marrow-derived human mesenchymal stem cells are obtained from Lonza in passage 2. hMSCs are cultured in a treated tissue culture Petri dish (Sigma-Aldrich). During culture, cells are stored in an incubator (Galaxy 48R, Eppendorf) at 37.9 °C and cell growth media is changed every 3 days. Cell growth media is composed of lowglucose Dulbecco’s Modified Eagle’s Medium (DMEM, Gibco), 10% fetal bovine serum (FBS, Life Technologies), penicillin/streptomycin (Thermo Fisher Scientific), fungizone (Thermo Fisher Scientific) and recombinant human fibroblast growth factor (hFGF, PeproTech). Cells from three different biological donors and passages 2–4 are used in this work.
Once cells grow to 90% confluency, trypsin-ethylenediaminetetraacetic acid (trypsin-EDTA, 0.5×, phenol red, Gibco) is added to detach cells from the plate. hMSCs are removed from the plate and resuspended in 1× PBS. Cell concentration in the suspension is measured on a light microscope (10× air immersion objective, Axial Observer, Zeiss) using a hemocytometer (Neubauer). Cells are added to the hydrogel precursor solution described above at a final concentration of .
Thiolation of Cytokines.
Transforming growth factor- (TGF-, PeproTech) and tumor necrosis factor- (TNF-, PeproTech) are separately obtained, stored and prepared in 5 wt % d-(+)-trehalose solution (Sigma-Aldrich) for long-term stability and are stored at −80 °C. To chemically tether each cytokine into our hydrogel scaffold a thiol group is covalently bound to each molecule. This is done by incubating each cytokine for 1 hour in a 20 molar excess of 2-iminothiolane hydrochloride (Traut’s regent, Sigma-Aldrich).27 Unreacted thiol is removed using a desalting column (7, 000 Da molecular weight cutoff, Zebra spin desalting column, Thermo Fisher Scientific) and centrifuged at 1500 relative centrifugal field (RCF) for 3 minutes (Eppendorf 5424).51 Thiolated cytokine will flow through the desalting column while any unreacted thiol is trapped in the column. Five wt % d-(+)-trehalose solution is then added to ensure long-term stability of the thiolated cytokines and the material is aliquoted and stored in a −80 °C freezer until use.
Modified Indirect Enzyme-Linked Immunosorbent Assay (ELISA).
To detect whether cytokines are tethered into the hydrogel network we use a modified indirect enzyme-linked immunosorbent assay (ELISA). This procedure is modified from previously published protocols and for each cytokine.27,29,49,52–54 ELISAs are repeated on at least three hydrogels without hMSCs that include thiolated cytokine (either TGF- or TNF-) tethered into the network. Each data set includes at least three control hydrogels without cytokines, which follow the exact same procedure as the gels with tethered cytokine.
After photopolymerization, all gels are washed overnight in 3 mL of 1× PBS. The solution is changed three times to ensure any untethered cytokine is removed. Next, gels are incubated in 3 mL of mouse-antihuman primary antibody diluted in ELISA wash. ELISA wash consists of 0.1% bovine serum albumin (BSA, Sigma-Aldrich) and 0.05% Tween-20 (Thermo Fisher Scientific). After incubation, gels are rinsed three times in ELISA wash. Next, gels are incubated in horseradish peroxidase-conjugated goat-antimouse secondary antibody (Jackson Immunoresearch). Gels are rinsed 5× in PBS, incubated again in ELISA wash, washed 3× in ELISA wash and incubated a final time in ELISA wash. Gels are then moved to a sterile 96-well plate with of PBS and of 3,3′,5,5′-tetramethylbenzidine (TMB, Thermo Fisher Scientific) added to each well. After 20 minutes, the reaction is quenched with of 65% sulfuric acid. Absorbance of a hydrogel is quantified at 450 nm, where peak absorbance of TMB is previously reported, using a plate reader (Spectra Max id3).55
There are variations in the specifics of the ELISA procedures between TNF- and TGF-. The variations are in the identity and concentration of the primary antibody used for detection, hydrogel cross-linker molecule and time of washing steps.
For TNF- detection, the primary antibody is mouse-antihuman TNF- (, monoclonal antibody, Peprotech) and it is incubated for 90 minutes. The secondary antibody is incubated for 30 minutes. After the attachment of the secondary antibody, gels are incubated for 60 minutes in ELISA wash to ensure the removal of any unbound secondary antibody.
For TGF- detection, the primary antibody is mouse-antihuman TGF- (, monoclonal antibody, Peprotech). The hydrogel is composed of 4-arm poly(ethylene glycol)-norbornene (, JenKem) cross-linked with poly(ethylene glycol)-dithiol (, JenKem). The 0.65 thiol:ene ratio is maintained. The hydrogel composition is changed because the MMP-degradable peptide cross-linker causes false detection of TGF- in control gels due to nonspecific binding. When a polymeric crosslinker is used the false detection of the antigen due to nonspecific binding is absent. Incubation times during washing are also increased for TGF- to allow sufficient time for unbound antibodies to diffuse out of the network. The primary antibody is incubated for 10 hours and the secondary antibody is incubated for 1 hour to enable attachment. After attaching the secondary antibody, gels are rinsed 5× in PBS and then left overnight in ELISA wash. The next morning gels are rinsed four more times in new ELISA wash prior to absorbance measurements.
MPT Sample Chamber Fabrication.
Sample chambers are made to hold hydrogel scaffolds for MPT measurements limiting particle drift during degradation and enabling hydrogel incubation in cell media to maintain high cell viability. Sample chambers consist of a circular ring of polydimethylsiloxane (PDMS, Sylgard 184, Dow) adhered to the bottom of a glass-bottomed Petri dish (, no. 1.5 glass coverslip, MatTek Corporation).31,56–59 The PDMS ring is made by curing of PDMS (1:10 cross-linker: silicone elastomer base) as a flat sheet in a Petri dish (Nunc Petri Dish, Thermo Fisher Scientific). This flat sheet is degassed and cured in an oven at 65 °C overnight (3618–5, Thermo Fisher Scientific). A ring with 10 mm outer diameter and 8 mm inner diameter is cut out of the flat PDMS sheet using biopsy punches (Integra Lifesciences Prod. Corp.). This ring is adhered to a glass-bottomed Petri dish using uncured PDMS. Then the sample chamber is cured in the oven overnight at 65 °C. The sample chamber is sterilized with 70% ethanol (Decon Laboratories) before of hydrogel precursor solution is pipetted into the chamber and cured with UV light using the procedure described above. The sample is incubated in 3 mL of cell media without hFGF. This allows the hydrogels to swell uniformly. Cell media is changed every 24 hours to ensure encapsulated cells have the proper nutrients. It also enables untethered cytokines to diffuse out of the scaffold and limits their impact on our measurements. MPT measurements are taken while the hydrogel is incubated in cell media.
Multiple Particle Tracking Microrheology in the Pericellular Region.
Multiple particle tracking microrheology (MPT) is a passive microrheological technique that uses video microscopy to measure the Brownian motion of probe particles embedded in a material to characterize rheological properties.43,44,48,60–62 One fluorescently labeled polystyrene particles where is the particle radius, , Polysciences, Inc.) are embedded into our hydrogel scaffold. Before particles are embedded, they are washed three times by centrifugation at 5000 RPM (5425, Eppendorf) and resuspension in to remove unreacted fluorescent dye or debris. Particles are then sonicated (CPX1800, Branson) to break up any aggregates that may have formed during centrifugation.
During cell-mediated degradation, cells secrete matrix metalloproteinases which cleave the MMP-degradable cross-linker and degrade the hydrogel scaffold. During this degradation, probe motion changes from arrested in a gel network to freely diffusing in a polymeric liquid. We capture this probe motion using video microscopy and quantify it using particle tracking algorithms.43,44,61 Video microscopy data are captured using an inverted microscope (Zeiss Observer Z1, Carl Zeiss AG) with a 40× water immersion objective (N.A. 1.3, 1× optovar, Carl Zeiss AG) and a high-speed camera (1024 × 1024 pixels, IL5SM4, Fastech Imaging). Data are acquired at with an exposure time of for 800 frames. These values are chosen to minimize static and dynamic particle tracking errors.63 During data acquisition, samples are incubated in 3 mL of cell media without hFGF and maintained in a controlled environment at 37 °C and 5% CO2 by an incubation chamber attached to the microscope.
After data collection, videos of probe particle movement are tracked using classical particle tracking algorithms.44 Particles are tracked by locating the brightness-weighted centroid in each frame and these positions are linked into trajectories. All particle trajectories are then used to calculate an ensemble-averaged mean-squared displacement (MSD), , as a function of lag time, , which is the time between frames in the video. The MSD is defined in our 2D field of view as
| (2) |
where and are the 2D coordinate system. Material rheology is related to particle motion using the Generalized Stokes–Einstein Relation (GSER), eq 1.48,57,61,62 For our experiments, during material evolution assumptions of the GSER are violated. Due to this, we use the logarithmic slope of the mean-squared displacement, , to analyze cell-mediated degradation and remodeling of the scaffold.
The state of the material is quantified by the logarithmic slope of the mean-squared displacement, . When , probe particles are in a gel and particle motion is fully arrested. When , the material is a either a viscoelastic liquid or viscoelastic solid. measures particles freely diffusing in a liquid. For each measurement, 60–100 particles are tracked to ensure statistical rigor.
For MPT data collection of the pericellular region, a bright-field image of the cell is first taken to identify the position of the cell. Immediately after the bright-field image is taken, the illumination is switched to fluorescence to collect MPT data and the field of view is held constant. Data are collected every 6 minutes for 60 minutes. Data collection for a cell may be stopped prior to 60 minutes if the cell moves out of the field of view. We combine the bright-field image and collected MPT data to measure the spatiotemporal rheological properties around a cell in our hydrogel. If there is uniform drift in a sample, it is corrected using a drift correction algorithm. These measurements quantify how each encapsulated cell degrades and remodels the microenvironment in real-time.
Time-Cure Superposition.
Time-cure superposition (TCS) is the superposition of viscoelastic functions at different extents of reaction. TCS identifies the critical phase transition of dynamically evolving gel materials.64–68 TCS is used to analyze microrheological data to determine material parameters such as the critical degradation time, , and critical relaxation exponent, .30,48,69–74
During TCS analysis, MSDs are shifted using shift factors and to superimpose the shortest lag times ) to create gel and sol master curves. The lag time shift factor, , relates to the longest relaxation time, , to the distance away from the critical extent of degradation, , by the scaling exponent using .48 The MSD shift factor, , relates to the steady state creep compliance, , and the distance away from the critical extent of degradation, , using scaling exponent by .48
To determine the critical values at the phase transition, scaffolds without hMSCs are degraded and data are collected with MPT and analyzed using TCS. This is done to ensure that the addition of tethered cytokines into the hydrogel scaffold does not change the structure and rheology of the material during degradation. For this study 11 gels are degraded without hMSCs: 4 gels with tethered TGF- gels with tethered TNF- and 3 control gels with no cytokine. All gels are degraded in solutions of of collagenase (Type I, Gibco), which degrades the MMP-degradable peptide cross-linker.
Cell Viability.
hMSC viability is quantified using a live/dead cell imaging kit (Thermo Fisher Scientific). hMSCs are encapsulated in gels at a concentration of . We measure cell viability for all three conditions: tethered TGF-, tethered TNF- and no cytokines. Each gel is incubated in 3 mL of cell media without hFGF overnight at 37.9 °C and 5% CO2. The next day, media is removed and viability stain is applied following the manufacturer’s protocol.75 Gels are imaged with an inverted microscope with a 10× objective (DMi8 S with a FDC9000 GT camera, Leica microsystems). Three images are taken at different places in one gel per condition. Images are analyzed to calculate the ratio of live to dead cells using an intensity density function in ImageJ (NIH).
Cell Motility and Morphology Measurements.
3D encapsulated cells are imaged using bright-field imaging. Once a cell is found, a bright-field image is taken, which is used to identify the initial cell position and center of mass. The position and center of mass is measured by loading a bright-field image into MATLAB (Mathworks) and using a custom script that prompts you to trace the edges of the encapsulated cell. After tracing the edges of the cell, the script calculates the cell center, , or the center of mass. This value is used to calculate motility, area and eccentricity.
Encapsulated cell motility is calculated using the formula where the initial center of mass is , the final center of mass is , the initial time is and the final time is . This process is repeated between each image captured of a single cell or minutes.
Cell area is calculated using a built in function in MATLAB “region props”. When a user traces a cell outline, the function returns the number of pixels in the region. We then convert that value into microns using the measured pixel to micron ratio of the equipment.
Eccentricity is calculated from the same outline of a cell. The measurement assumes the shape is a conic and measures the focal length and the major axis length in pixels. This quantity is then converted into microns using the measured pixel to micron ratio of the equipment. Eccentricity is calculated using the formula where is eccentricity, is the length of the foci and is the major axis length. An ellipse with eccentricity is a circle, while an ellipse with is a line segment. In this work, eccentricity is used to quantify how elongated an encapsulated cell is.
Bulk Rheology.
Bulk rheology is used to measure the elastic modulus of PEG-N hydrogels with tethered TGF-, tethered TNF- or control gels without cytokines. Hydrogels are made without hMSCs using the formulations and protocols described above. Hydrogels are swollen overnight in 1× PBS in an 8 mm diameter sample chamber. Hydrogels are removed from the sample chamber and loaded onto a rheometer (AR G2, TA Instruments). Once the hydrogel is loaded a small normal force is applied to the gel approximately equal to 0.05 N. The equilibrium modulus is measured with an 8 mm sand-blasted parallel plate using a frequency sweep at 1% strain between 0.1 and 20 Hz at 37.9 °C.
Data Analysis and Statistics.
Data are collected in quantities to ensure statistically significant conclusions can be drawn. Replicates of MPT measurements of scaffold degradation without cells, bulk rheology and cell viability experiments are detailed above. MPT data of cell-mediated degradation and measurements of cell morphology and motility are collected for at least 3 biological replicates and at least 2 hydrogels per biological replicate. This ensures there is no bias due to the cells used or the specific hydrogel scaffolds. MPT data are collected around a single cell over the course of an hour. This results in 10 videos of a single pericellular region for MPT. Data are collected on days 2, 3, and 4 postencapsulation. Data around at least 30 cells per condition per day postencapsulation are collected.
Data are collected on day 2 postencapsulation around 76 cells (30 cells in hydrogels with tethered TGF-, 31 cells in hydrogels with tethered TNF- and 15 cells in hydrogels with no cytokines). Day 3 postencapsulation data are collected around 77 cells (32 cells in hydrogels with tethered TGF-, 31 cells in hydrogels with tethered TNF- and 14 cells in hydrogels with no cytokines). Day 4 postencapsulation data are collected around 76 cells (32 cells in hydrogels with tethered TGF-, 31 cells in hydrogels with tethered TNF- and 12 cells in hydrogels with no cytokines). The complete data set includes 40 individual hydrogels and 10 different cell passages. Each treatment group includes cells from all 3 biological donors. There is less control data collected during this work because expansive data sets have been previously measured.19,30,31,46,47
For bulk rheology, microrheology and cell morphology measurements, data are compared between hydrogels with tethered TGF-, tethered TNF- and control hydrogels without cytokines for statistical significance using ordinary one-way analysis of variance (ANOVA, Graph Pad, Prism) and Tukey’s multiple comparisons tests. Each group is tested against each other on each day postencapsulation. Significance is denoted by adjusted -values (* p < 0.0032, ** p < 0.0021, *** p < 0.0002 and **** p < 0.0001). Stringent -values are used for statistical rigor to ensure statistically significant changes are reported.
RESULTS AND DISCUSSION
In this work, hMSCs are encapsulated in polymer–peptide hydrogels with either tethered anti-inflammatory cytokines (TGF-), pro-inflammatory cytokines (TNF-) or no cytokines. hMSCs respond to the release of cytokines in wounds and migrate toward the highest concentration.9 This indicates that cytokines can be used to direct cell motility. This work tethers cytokines uniformly into the network to measure changes in cell-mediated degradation and motility in response to these chemical cues. We start by tethering cytokines uniformly, which is a precursor to measuring cell-material interactions in a cytokine concentration gradient. We are interested in these two cytokines because they are naturally expressed during different stages of wound healing.10 When a wound occurs, the body releases a pro-inflammatory cytokine, TNF-, causing the surrounding tissue to inflame usually 24–36 hours after a tissue is wounded.5,76 TGF- is expressed in the later stages of wound healing (72–336 hours), which enables beneficial inflammation, angiogenesis, reepithelialization and connective tissue regeneration.5,76 During wound healing, hMSCs are instrumental in the healing process and are called to the wound by migrating toward the cytokine source.9,41,77,78
We begin this work by functionalizing the two chosen cytokines (TGF- and TNF-) and tethering them separately into our polymer–peptide hydrogel scaffold. These scaffolds without cytokines are designed to mimic the stiffness of adipose tissue. We confirm there is no significant change in material properties using bulk rheology and microrheological characterization. After 3D hMSC encapsulation, we measure a statistically significant change in cell-mediated remodeling of the pericellular region when either cytokine is locally presented. The pericellular region is defined as our field of view and an area of approximately surrounding the cell. Cells encapsulated in hydrogels with tethered TGF- have increased cell speed, area and cell-mediated degradation at later times postencapsulation (days 3 and 4 postencapsulation).hMSCs in scaffolds with tethered TNF- have increased cell speed, area and cell-mediated degradation at early times postencapsulation (2 days postencapsulation). Covalently tethering cytokines provides a method to enhance cell delivery speed without changing either the initial or dynamic scaffold material properties.
Cytokine Functionality and Characterization of Hydrogel Scaffolds with Cytokines.
In this work, we present cytokines in the local hydrogel microenvironment to 3D encapsulated hMSCs. We use the scaffold thiol:ene chemistry to covalently tether each cytokine separately into the network.27,29 An advantage of using LAP and thiol:ene photopolymerization to form the base scaffold is that previous work has verified that no statistically significant decrease in protein bioactivity occurs.27,28 To click the cytokines into the scaffold, we add a functional thiol group onto TGF- and TNF-. The reaction that adds a thiol to the cytokine can be used with any peptide or protein sequence that contains amines. The presence of each cytokine in the hydrogel is measured by a modified indirect ELISA.
Figure 1 is the intensity of the photons absorbed in the sample for all hydrogel samples. We measure double the average absorbance of hydrogels with tethered TGF- or TNF- compared to control hydrogels with no tethered cytokines that follow the same experimental procedure. Using stringent statistical parameters we can say with at least 99.68% certainty there is a difference between our networks with tethered cytokines and control gels. This measured difference in absorbance can only be attributed to the presence of the primary antigen (tethered TGF- or TNF-) in the hydrogel scaffold.
Figure 1.
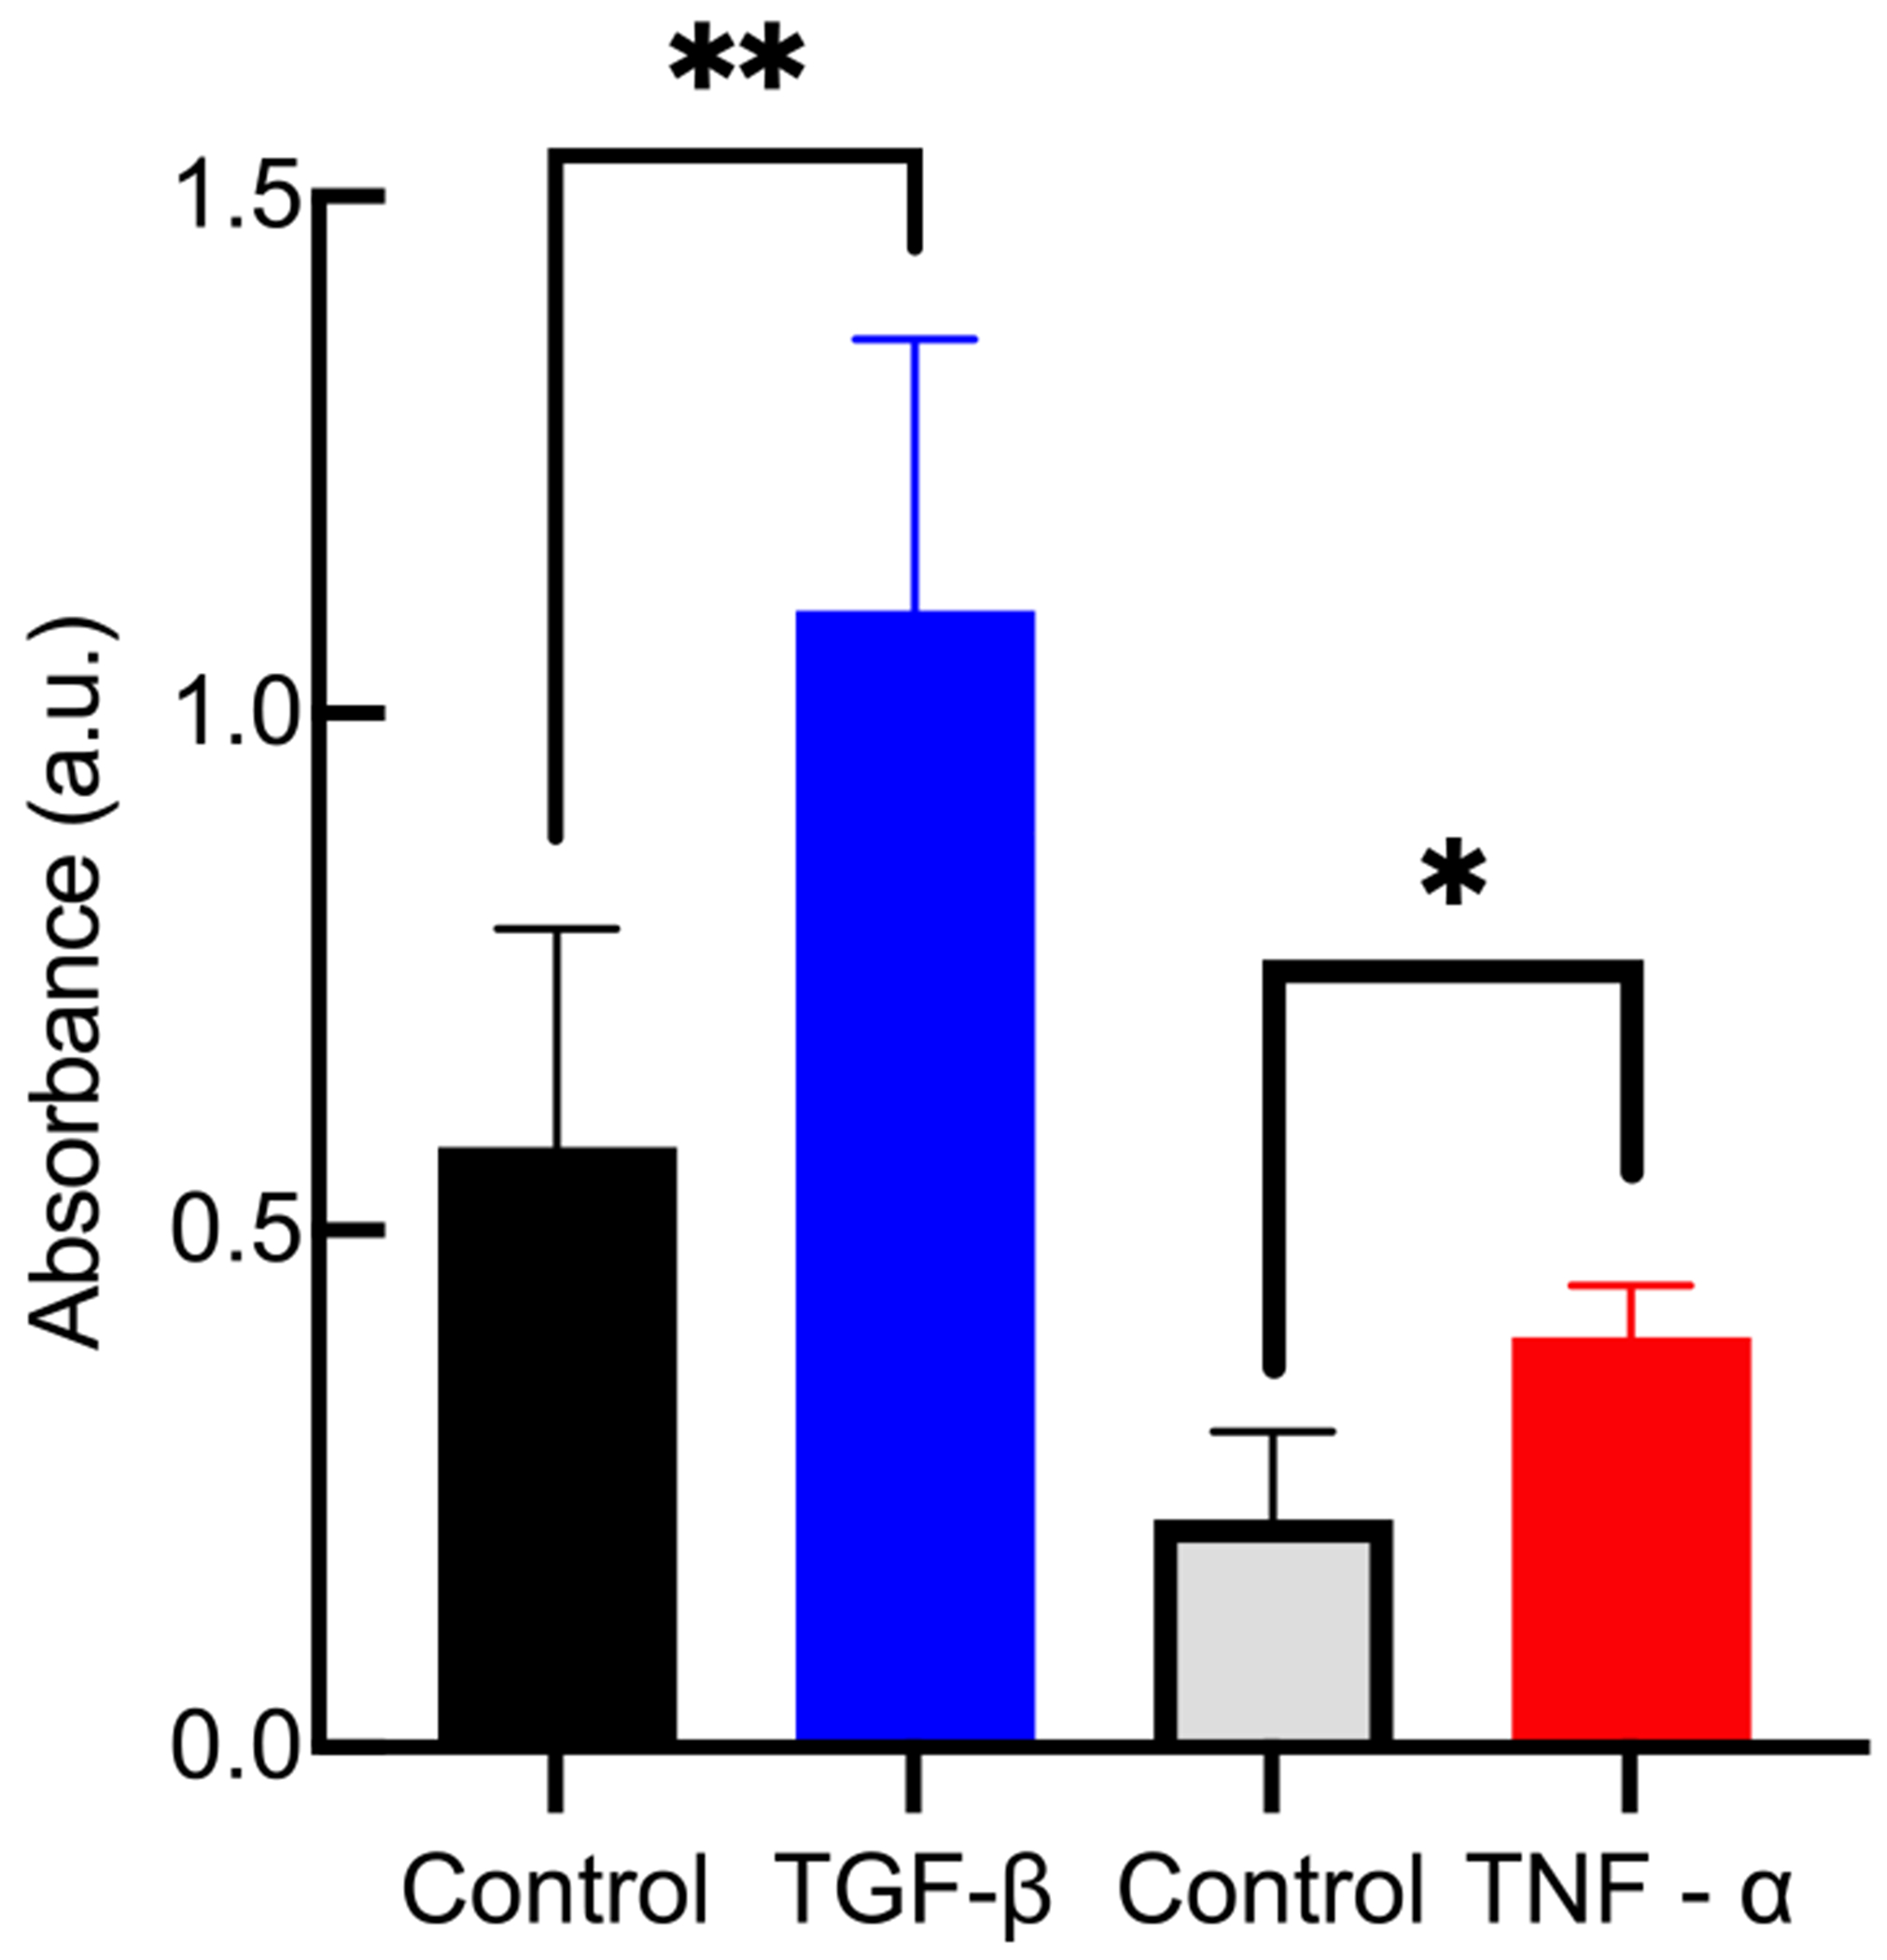
Absorbance measurements after modified indirect ELISA for hydrogels with either tethered TGF- or tethered TNF-. Comparing gels with cytokines with control gels that contain no cytokines, there is a statistically significant increase in absorbance, which measures the presence of the cytokines in the hydrogels. Data are presented as the mean ± the standard deviation (number of replicates i = 3). Significance is denoted by adjusted p-values (*p < 0.0032 and **p < 0.0021).
Control gels do not have any antigen for an antibody to bind to, resulting in a lower measured absorbance. Two control groups are provided in Figure 1 with different average absorbances. This is because the procedures for detecting TGF- and TNF- use different concentrations of primary antibody and incubation times. The control group in the TGF- experiment has a higher concentration of primary antibody. It is likely some of this primary antibody did not diffuse out of the scaffold, leading to higher absorbance measurements in the control gels.
To estimate the spatial availability of cytokines we use the number density of cytokines. Each hydrogel has a volume of 17 and an approximate cytokine concentration of . TNF- has a molar mass of 17, 400 Daltons and TGF- has a molar mass of 25, 000 Daltons. We can determine the spatial availability of cytokines using molecules of cytokine in hydrogel where is the moles of cytokine in the hydrogel and is Avogadro’s number. We estimate a hydrogel with tethered TGF- has and a hydrogel with tethered TNF- has . This gives a cytokine density in a hydrogel of and for TGF- and TNF-, respectively. If we assume a cell has a volume of , this results in at least 1000 cytokines available per cell volume. This indicates there are a large number of cytokines present in our experimental microenvironment to influence hMSC processes.
The results of the ELISA in Figure 1 show cytokines are successfully tethered into the hydrogel scaffold. We also measure that the equilibrium rheological properties of our material does not change with the addition of tethered cytokines. The scaffold is designed with a low storage modulus, similar to adipose tissue, that enables a high percentage of hMSCs to migrate through the network.17,26,31,32,80 To compare the bulk rheological properties of each hydrogel scaffold, we conduct frequency sweeps on each type of gel (control, tethered TGF- or tethered TNF-) to measure the equilibrium elastic modulus, G′, shown in Figure 2a. In Figure 2a, we measure no statistically significant change in storage modulus when either cytokine is tethered into the scaffold when compared to gels without cytokines. Additional frequency and strain sweeps are provided in the Supporting Information in Figures S1 and S2. This is an expected result. The low thiol:ene ratio of the network means that there are ample unreacted norbornene groups that are available to react with tethered cytokines, meaning that the cross-link density would be unchanged.27,79 Cytokines have at least one functional thiol group. We hypothesize they attach to a PEG arm and there is no cross-linking of the material between a cytokine and another PEG functional group. This is supported by our bulk rheology measurements, which measure no statistically significantly change in the storage modulus of the material when cytokines are tethered into the scaffold.
Figure 2.
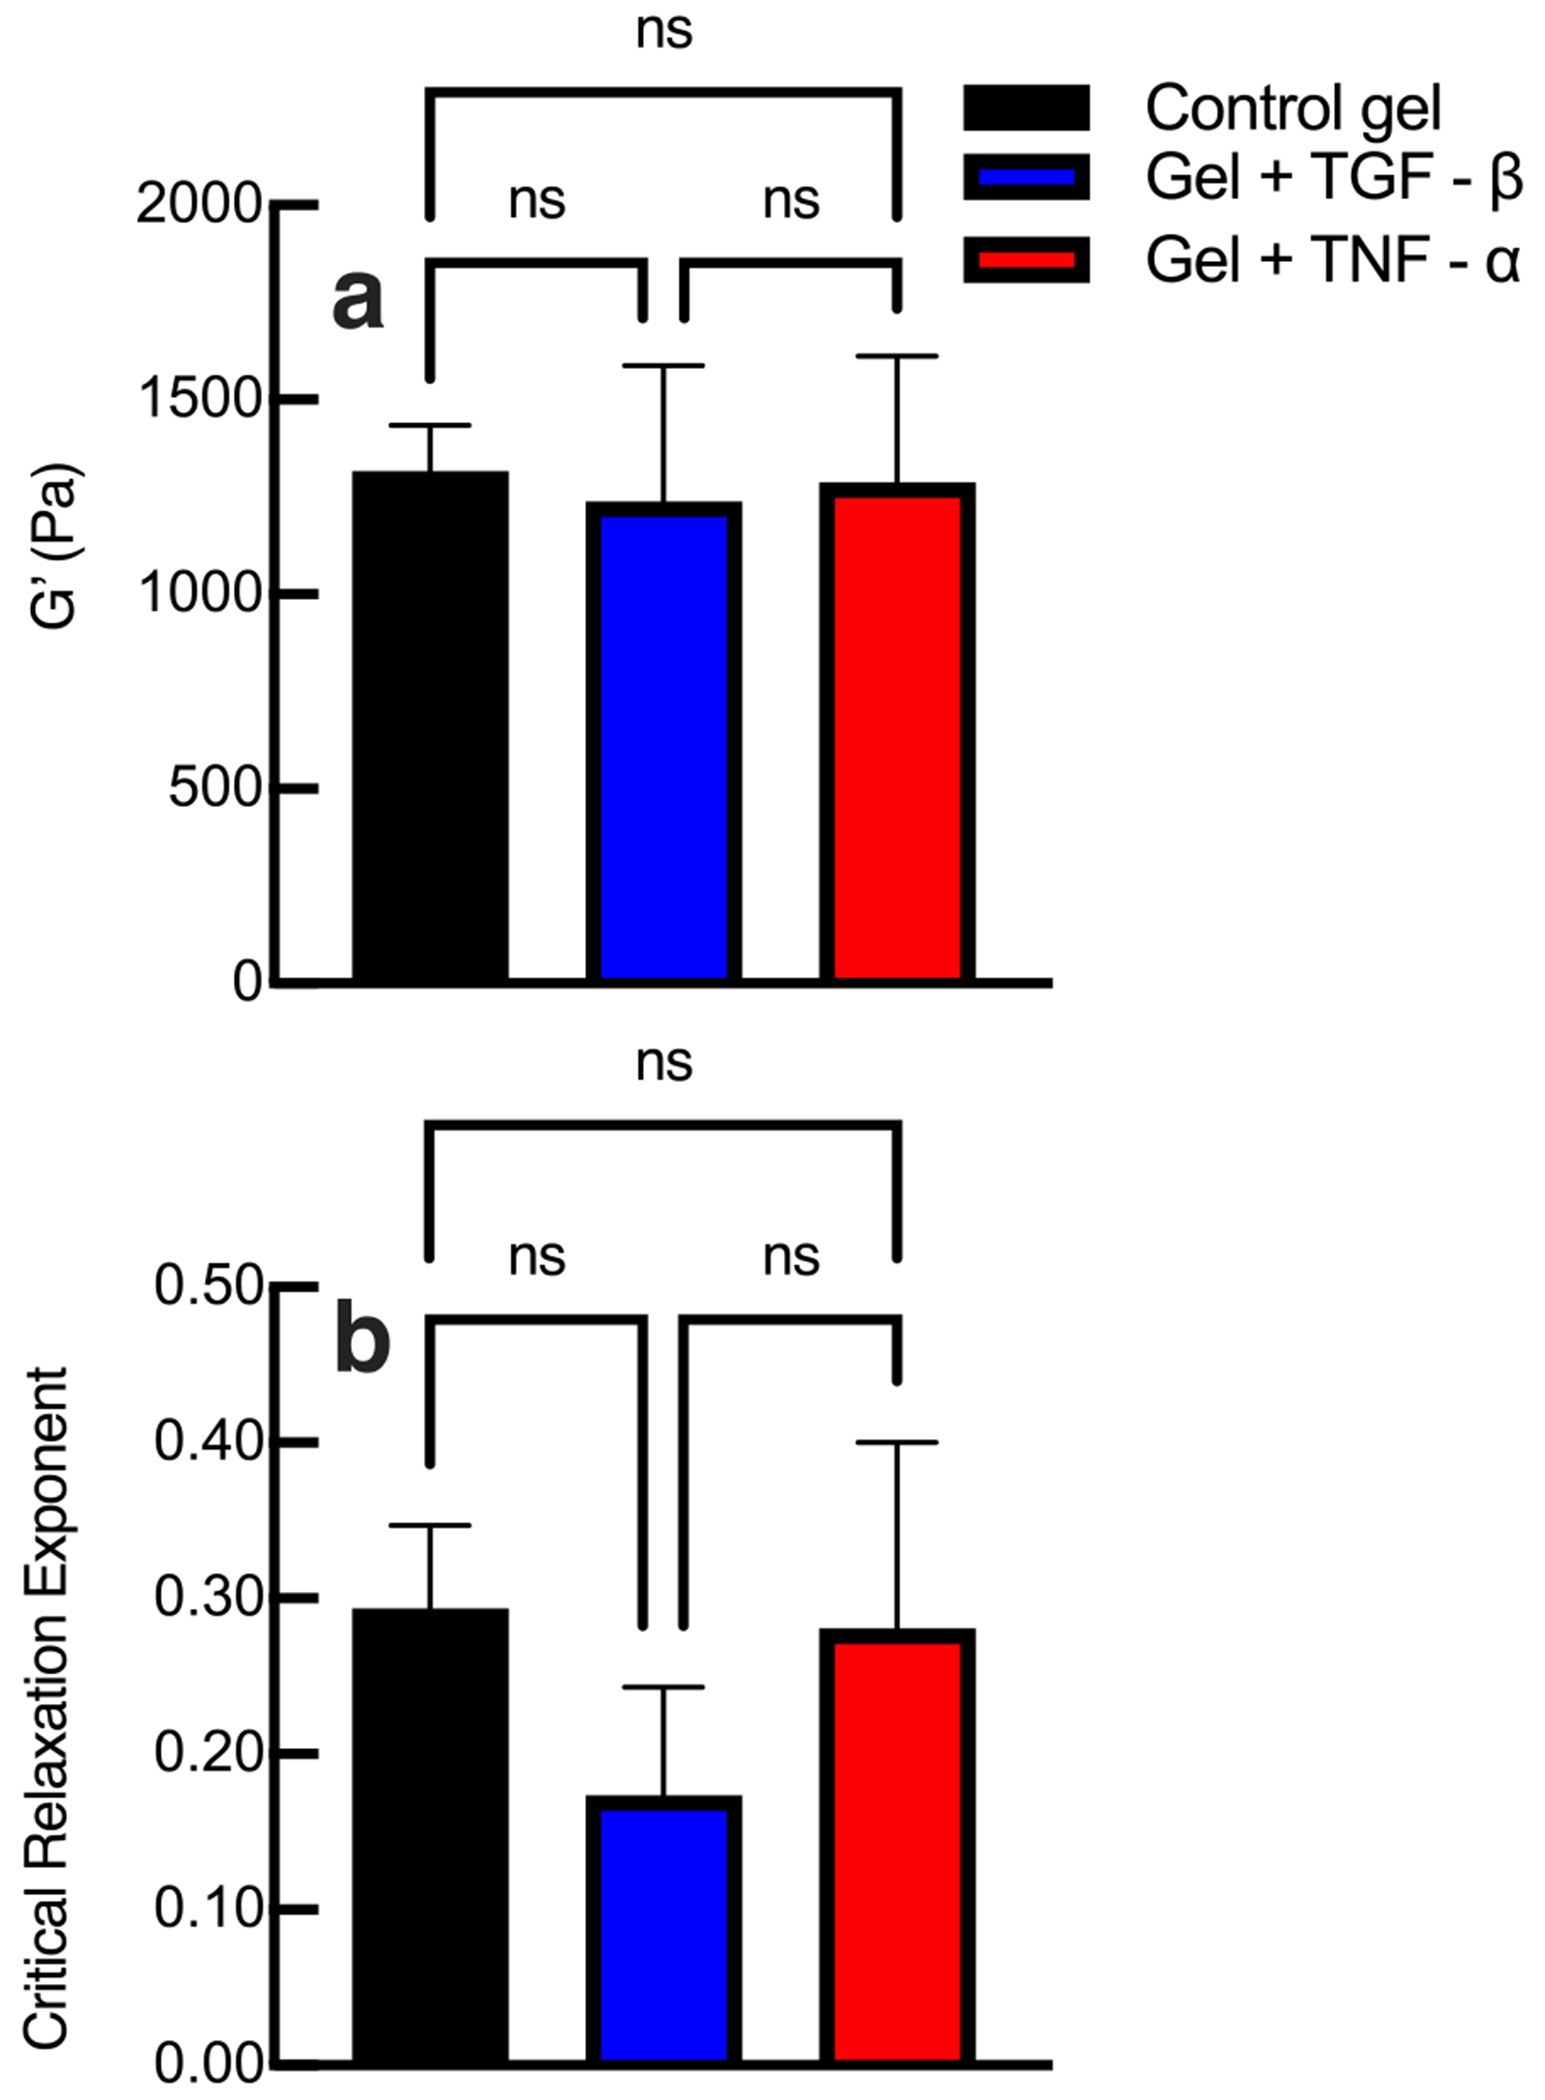
(a) Bulk rheological and (b) microrheological characterization of hydrogels without cytokines (control) and with tethered TGF- or tethered TNF-. Bulk properties and the scaffold microstructure at the phase transition, characterized by the critical relaxation exponent, do not change when cytokines are tethered into the network. Data are presented as the mean ± the standard deviation (number of replicates i = 3 for each condition). Significance is denoted by adjusted p-values (*p < 0.0032, **p < 0.0021, and p > 0.0032 is not significant and denoted as ns).
We also characterize the material microstructure at the phase transition in hydrogels without cytokines (control), hydrogels with tethered TGF- or hydrogels with tethered TNF- with MPT. To determine the structure at the phase transition, MPT data are analyzed with time-cure superposition (TCS).64,65,69,70 The critical relaxation exponent, n, identifies the state of the material and the structure of the material at the gel point. 66,67,72,82,83, The value of the critical relaxation exponent can vary from . The microstructure of the material is implied by the value of describes a network that is densely cross-linked and stores more energy than it dissipates. describes a porous network that dissipates energy.65,82 As an example, previous work modeled flexible clusters at the gel point as using Rouse dynamics.84,85 Also at the critical gel point if , the gel is indistinguishable from a Newtonian fluid.83 The critical relaxation exponent is determined experimentally from MPT measurements of material degradation followed by TCS analysis. Since this is an experimental measurement there is error in the value of . Our previous work reports the average critical relaxation exponent as , where is the standard deviation between measurements and for our network . We consider this experimental error by calculating and reporting and . This range of to is the phase transition region.
Our material has previously been characterized with a critical relaxation exponent of n = 0.25 ± 0.05, and is a tightly crosslinked network that stores energy.56,83 In the Supporting Information, Figures S3–S5, we provide TCS analysis of an untreated hydrogel, a hydrogel with tethered TGF- and a hydrogel with tethered TNF-, respectively. The average values of the critical relaxation exponent, , are shown in Figure 2b. We measure no statistically significant change in the critical relaxation exponent when cytokines are tethered into the hydrogel scaffold. This confirms that cytokines are most likely hanging on “dangling ends” and not participating in cross-linking or changing the structure of the scaffold at the phase transition.81
To determine the state of the material, the critical relaxation exponent is compared to the logarithmic slope of the MSD, .69 The gel–sol transition is when . When the material is a viscoelastic solid, when the material is a viscoelastic fluid and when the material is transitioning between a gel and sol.56
These experiments determine that tethering TGF- or TNF- into these scaffolds does not change the storage modulus or critical relaxation of the scaffold. The overall rheological properties and structure of the material at the phase transition is unchanged. From these measurements, we conclude that tethering cytokines to this widely used scaffold for 3D cell encapsulation will present the same physical microenvironment to encapsulated cells. This will enable conclusions to be drawn from changes in pericellular degradation and cell motility in response to only the addition of a chemical cue, which can be incorporated into this scaffold to enhance cell delivery and, in the future, potentially direct cell migration.3,17,23,32,42,86–88 We have ensured cell viability is not impacted by the incorporation of cytokines in the scaffold. This is shown in the Supporting Information Figure S6. In this work, the purpose of this viability study is to show that tethering cytokines is not cytotoxic to encapsulated hMSCs. Previous work measures cell viability above 90% in the same hydrogel network and our work has similar results, shown in Figure S6.79
Cell-Mediated Degradation in Scaffolds with Tethered Cytokines.
In this work, we use multiple particle tracking microrheology (MPT) measurements of the region around a cell, the pericellular region, to measure spatiotemporal changes in response to tethered cytokines presented in the microenvironment. These data are compared to cell-mediated degradation in control hydrogels without cytokines. There are two main mechanisms cells use to remodel their microenvironment: an irreversible and reversible mechanism. The irreversible mechanism is degradation by cell-secreted matrix metalloproteinases (MMPs), which enzymatically degrade the peptide cross-linker in the scaffold and irreversibly change the microenvironment.30 The reversible remodeling mechanism is by the cell applying force and pulling on the network using cytoskeletal tension.47 Cytoskeletal tension is not strong enough to break a covalent bond, but it will reversibly remodel the network prior to migration. This force could contribute to increased particle motion measured with MPT.47,89
MPT measures degradation around a single encapsulated cell in the field of view. Figure 3 shows representative MPT measurements of cell-mediated degradation in the pericellular region. In Figure 3, the logarithmic slope of MSD, , is on the -axis and time from the initial measurement is on the -axis. Each point is the value of for the entire field of view or pericellular region and each line is data collected in a single pericellular region. The three different types of hydrogels are shown in different colors. The pericellular region is measured for 60 minutes during cell-mediated degradation. The measurements in Figure 3 are randomly selected representative data from a much larger data set. Previous studies report it takes at least 7 and up to 28 days for hMSCs to differentiate in response to covalently tethered TGF- in a PEG-N hydrogel.28,54 For this reason, we restrict our experiments to a much shorter time frame to limit differentiation and only measure cell-mediated degradation for 4 days postencapsulation.
Figure 3.
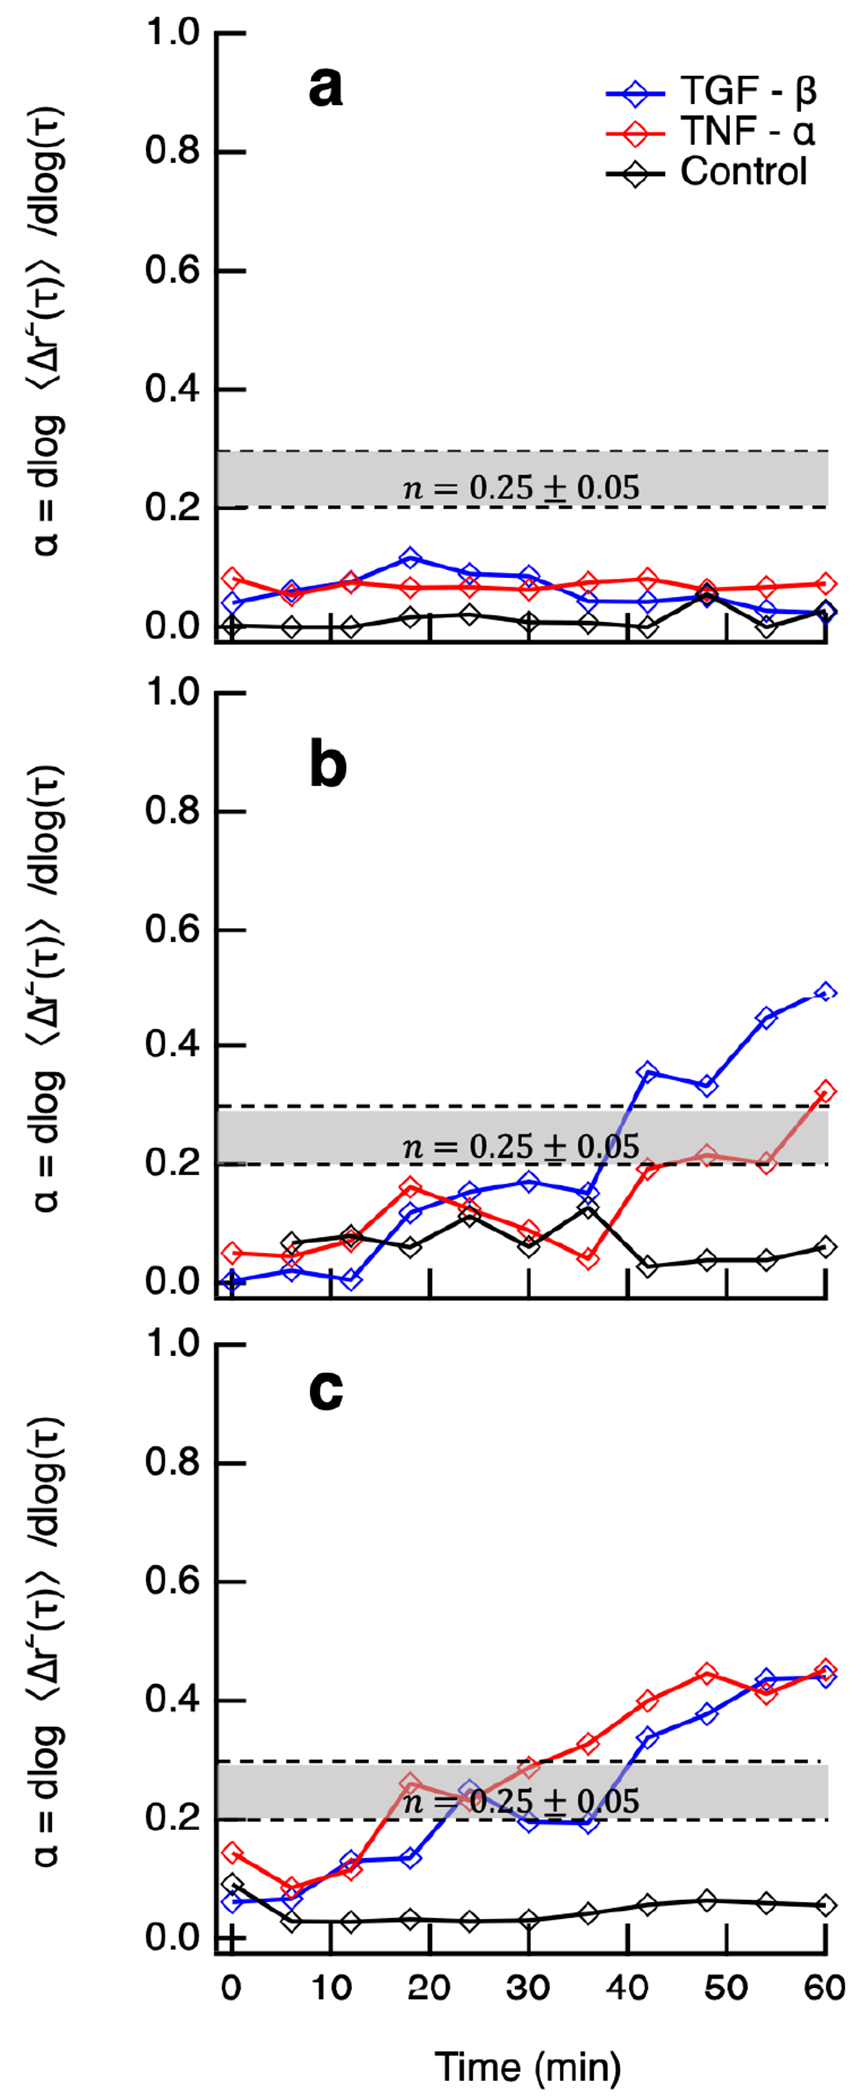
Logarithmic slope of the MSD, , is measured for pericellular regions every 6 min around hMSCs 3D encapsulated in hydrogels with no cytokine (control), tethered TGF- and tethered TNF-. The critical relaxation exponent, , where the gel–sol phase transition occurs is shaded in gray at . Representative data are provided of pericellular rheology days (a) 2, (b) 3, and (c) 4 postencapsulation. Each line is a temporal MPT measurement of a single pericellular region (shown in these graphs is number of cells per condition per day).
On day 2 postencapsulation, Figure 3a, hMSCs encapsulated in all hydrogels have not remodeled their microenvironments. The densely cross-linked network has not been degraded enough for the probe particles () to begin undergoing Brownian motion. This means the cell must continue to secrete MMPs to degrade more cross-links to create space to migrate. In Figure 3b and c, we measure an increase in particle motion in hydrogels with either tethered TGF- or TNF-. On day 3 postencapsulation, the cell in a hydrogel with tethered TGF- degrades the scaffold past the gel–sol phase transition. The cell in a hydrogel with tethered TNF- degrades the material into the phase transition region, Figure 3b. Comparing with the control gel, which has limited scaffold degradation, cell-mediated degradation of the pericellular region increases when cytokines are tethered into the network.
On day 4 postencapsulation, cells encapsulated in hydrogels with either tethered TGF- or TNF- have degraded their pericellular regions past the gel–sol phase transition, shown in Figure 3c. This means at the end of data acquisition the material is a viscoelastic fluid. On days 3 and 4 postencapsulation, we measure nearly fully arrested particle motion in pericellular regions in control gels (without cytokines), which indicates the material remains a viscoelastic solid. For the selected 9 cells, we measure that including either an anti-inflammatory (TGF-) or pro-inflammatory (TNF-) cytokine increases cell-mediated degradation. As mentioned, this is representative data but only measures single pericellular regions at each condition. In these hydrogel scaffolds, there are in the hydrogel and not all of them degrade their microenvironment at the same rate. We measure cells on all days postencapsulation that begin in a gel, meaning they have likely degraded a different part of the gel and migrated into this stiffer gel region. We also measure cells that are in degraded pericellular regions. In the Supporting Information Figure S8, we graph and discuss statistical testing of the entire data set comparing on each day postencapsulation for each condition.
We combine live-cell imaging and MPT to create spatiotemporal maps of the rheology created in the pericellular region by encapsulated hMSCs. Figure 4 shows remodeling by single encapsulated hMSCs over 60 minutes in a control gel (Figure 4a–c), gel with tethered TGF- (Figure 4d–f) and gel with tethered TNF- (Figure 4g–i) 4 days postencapsulation. Each map has a bright-field image of the pericellular region, an area of ~0.015 mm2 around the cell, behind MPT data. We separate the logarithmic slope of the MSD, , into concentric rings surrounding the hMSC. Each ring increases in radius by (150 pixels) and probe particle motion is only counted in one ring based on the initial particle position. This data quantifies cell-mediated remodeling and material rheology with respect to the distance from the cell center. In Figure 4, a color bar is used to show the value of for each ring. Low values of , which measure arrested to restricted particle motion, are shown in warm colors. Cool colors are higher values, which are restricted to freely diffusive particle motion. A ring is colored black when there is not enough probe particle data to accurately report values of . In Figure 4 the gel–sol transition is represented as an orange color, . Data for additional encapsulated cells on days 2 and 3 postencapsulation are provided in the Supporting Information in Figures S8 and S9.
Figure 4.
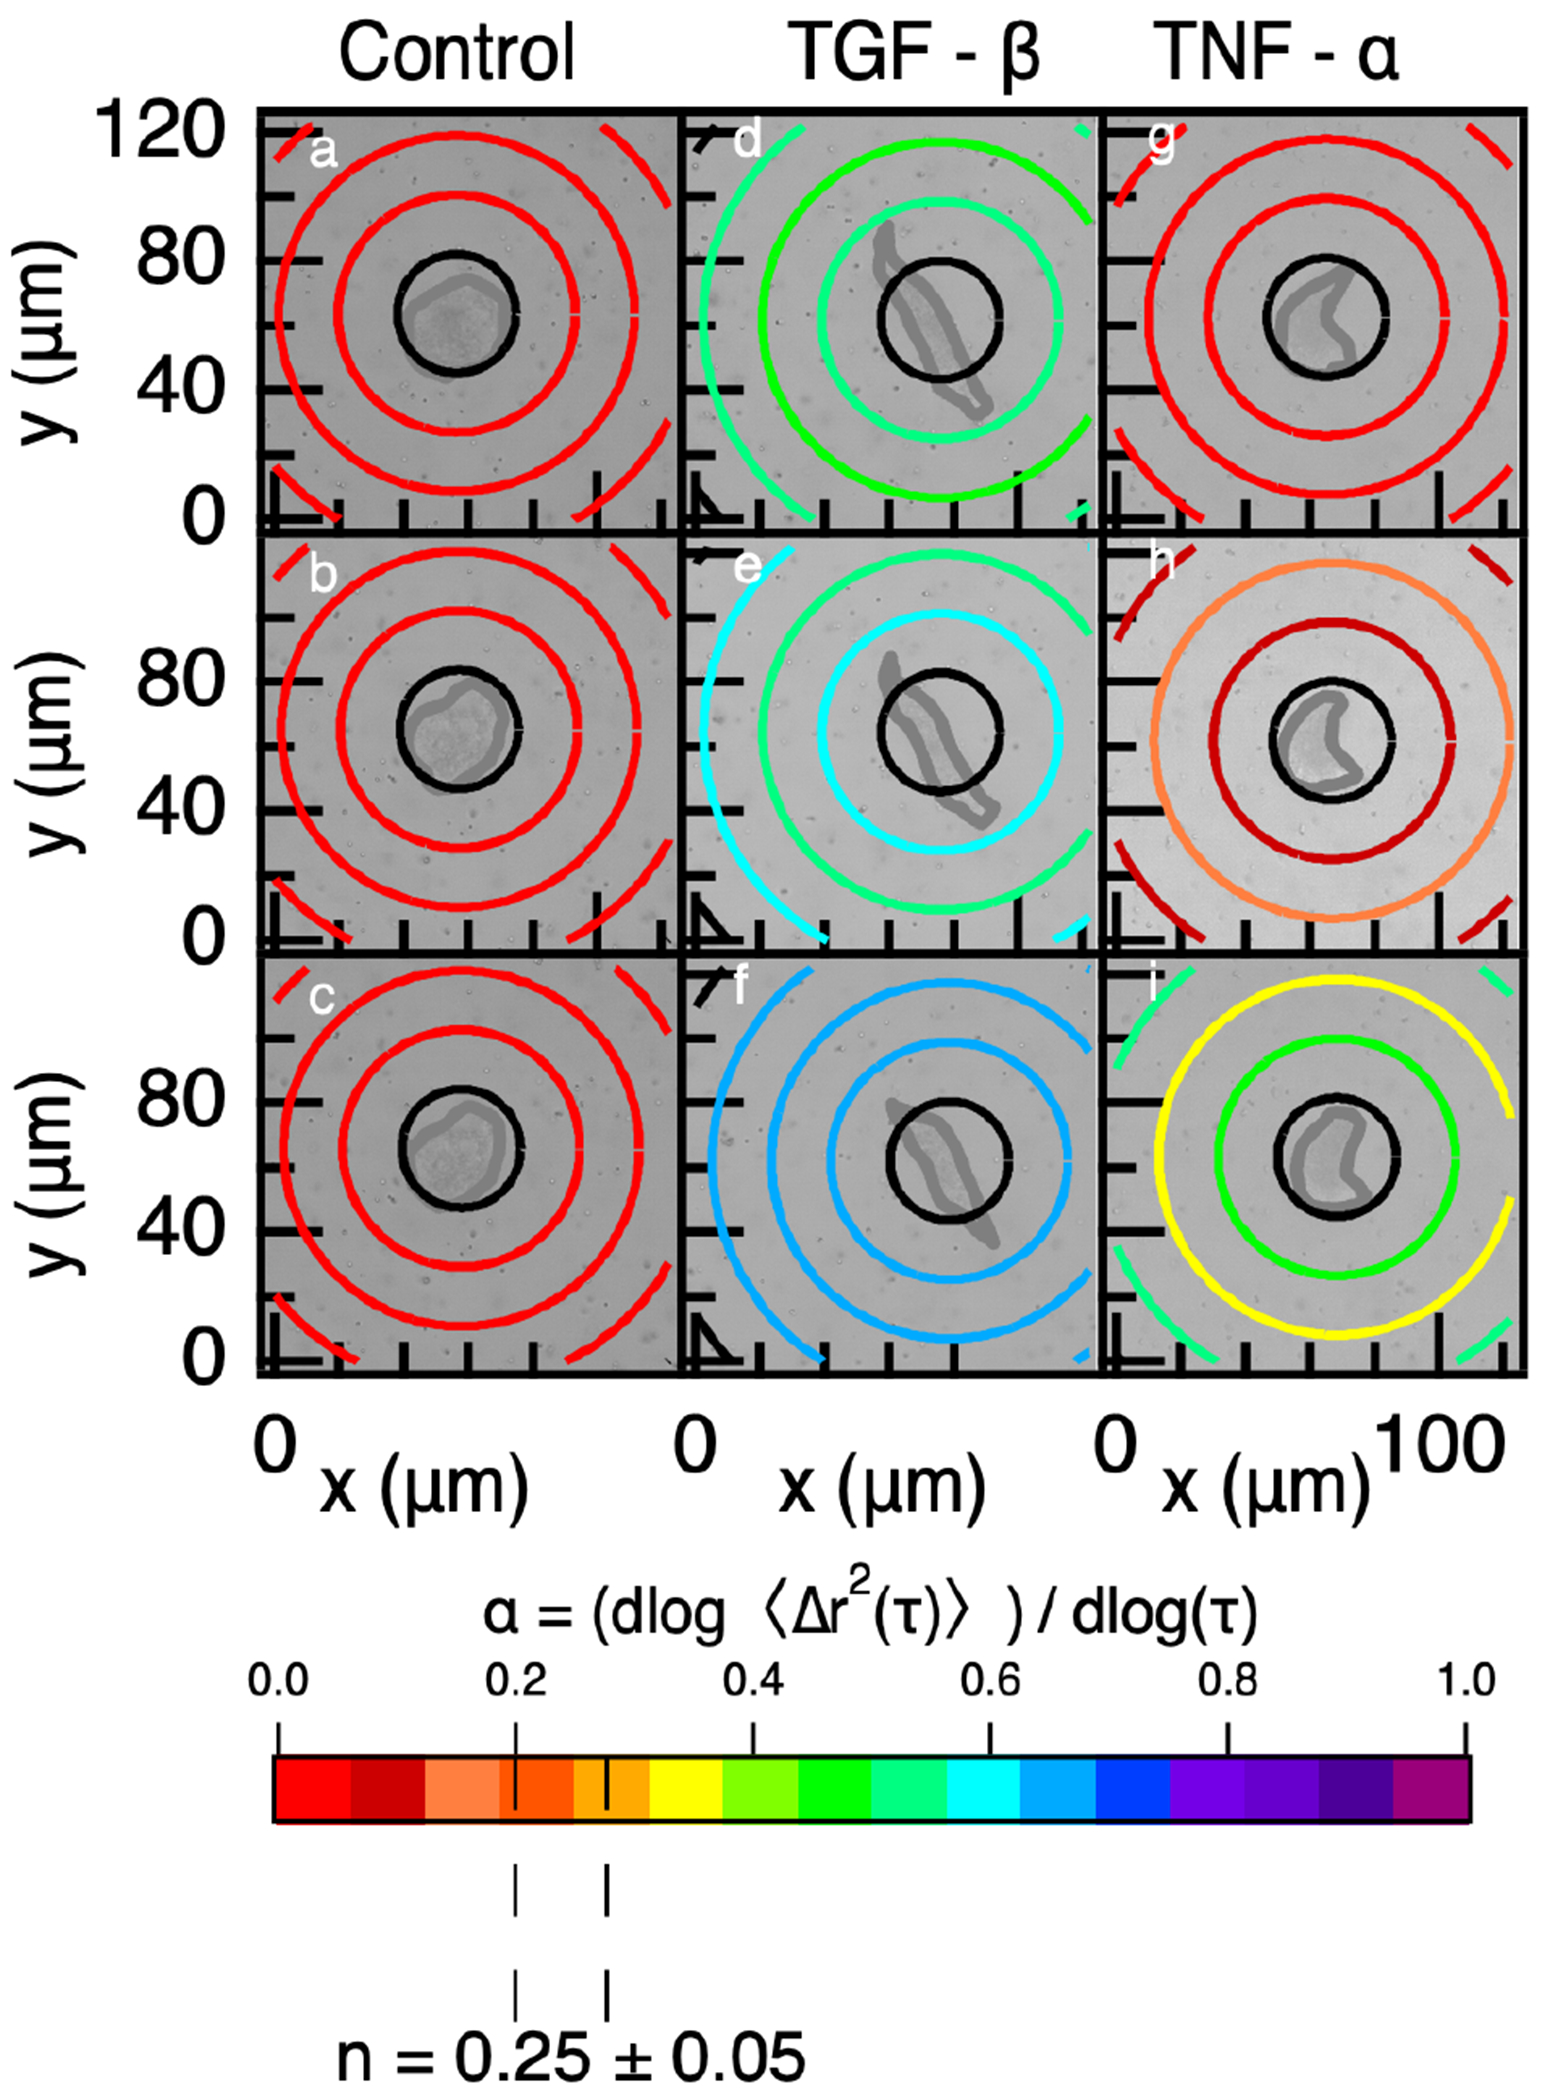
Spatiotemporal MPT measurements in (a–c) a control gel, (d–f) gel with tethered TGF-, and (g–i) gel with tethered TNF- 4 days postencapsulation. The rheology of the material is shown as colored rings with the color representing the value of the logarithmic slope of the MSD, , for particles in that ring. Warm colors are low values of indicating little to no particle motion, and cool colors are high values of indicating restricted to freely diffusive particle motion. The critical relaxation exponent, n, where the gel–sol phase transition occurs is highlighted at n = 0.25 ± 0.05. Data are collected at (a,d,g) 0, (b,e,h) 30, and (c,f,i) 60 minutes (shown in these graphs is number of cells i = 1 per condition).
Figure 4a–c is MPT data around a hMSC in a control gel with no cytokine. Throughout the data acquisition window, 60 minutes, there is no measurable cell-mediated degradation. This is shown in Figure 4a–c by all rings remaining red () as a function of distance from the cell center and time from the beginning of data acquisition.
Cell-mediated degradation in a gel with tethered TGF-, Figure 4d–f, shows increasing degradation in the pericellular region over the data acquisition period. TGF- is known to increase cell migration and decrease MMP secretion, but it does not inhibit all MMP secretions.19,41,76 We measure the most cell-mediated degradation in the tethered TGF- hydrogel. We hypothesize the increase in probe particle motion in hydrogels with tethered TGF- is due to both MMP secretions and increased cell migration. When cells migrate, they exert force on the network. This force can cause an increase in measured particle motion. This increase in measured cell-mediated degradation is also different than what has been previously reported when TGF- is included in the fluid environment. In this work, they measure lower amounts of cell-mediated degradation compared to a control hydrogel.19
Figure 4g–i shows an encapsulated cell in a hydrogel with tethered TNF-. As the pericellular region is measured through time, we measure more pericellular degradation. For this cell, we initially measure that the cell is encapsulated in a gel, Figure 4g. Thirty minutes after data acquisition is begun, Figure 4h, we measure increased degradation from the cell center, which is in the phase transition region. The rings closest and furthest from the cell measure that the material remains a gel. This degradation profile is generally measured when the material is undergoing a phase transition.90 60 minutes after initial data acquisition, we measure that the material in the pericellular region has degraded past the phase transition region and has a profile where the greatest amount of degradation is closest and furthest from the cell with less degradation at from the cell center. This indicates that the material has degraded past the phase transition and the cell is continuing to remodel the microenvironment.
To further analyze these degradation profiles, we analyze the value of , which is a measure of the extent of degradation, as a function of distance from the cell center. Previous work identifies six unique degradation profiles in the pericellular region from MPT measurements: reaction-diffusion, reverse reaction-diffusion, no pattern, uniform, not degraded and degraded.90 Using the same method, we identify the degradation profiles in the pericellular regions shown in Figure 4. This analysis is done by performing a hypothesis test, denoting significance as p < 0.05, on each region in the pericellular region around each encapsulated cell in Figure 4. For example, if all of the outer rings are more degraded and statistically different than the inner rings we conclude the degradation profile is a reverse reaction-diffusion profile. We measure cell-mediated degradation in hydrogels with tethered TGF- or TNF- have uniform degradation profiles. Uniform profiles are described as values that begin close to the gel state then become a viscoelastic liquid by the end of the measurement with no statistically significant difference in measurements with increasing distance from the cell center. The encapsulated cells in the control network are classified as not degraded because all of the measurements are below the gel–sol transition region.
Figure 4 are spatiotemporal maps of pericellular regions around a single cell. Since this is a single piece of data we are unable to draw conclusions about the effect of tethered cytokines on cell-mediated remodeling. Therefore, we calculate the average value of the logarithmic slope of the MSD, , as a function of distance from the cell center for all conditions and days postencapsulation, Figure 5. This analysis enables comparison of cell-mediated remodeling and degradation when cells are in microenvironments with no cytokines (control), tethered TGF- or tethered TNF-. In Figure 5, the y-axis is the average logarithmic slope of the MSD, , which describes the state of the material. The x-axis is the distance from the cell center. The bars are and the error bars are the standard deviation. Statistical significance is denoted on the graph and all conditions are tested against each other. The shaded region bounded by the dashed lines is the phase transition region defined by the critical relaxation exponent.
Figure 5.
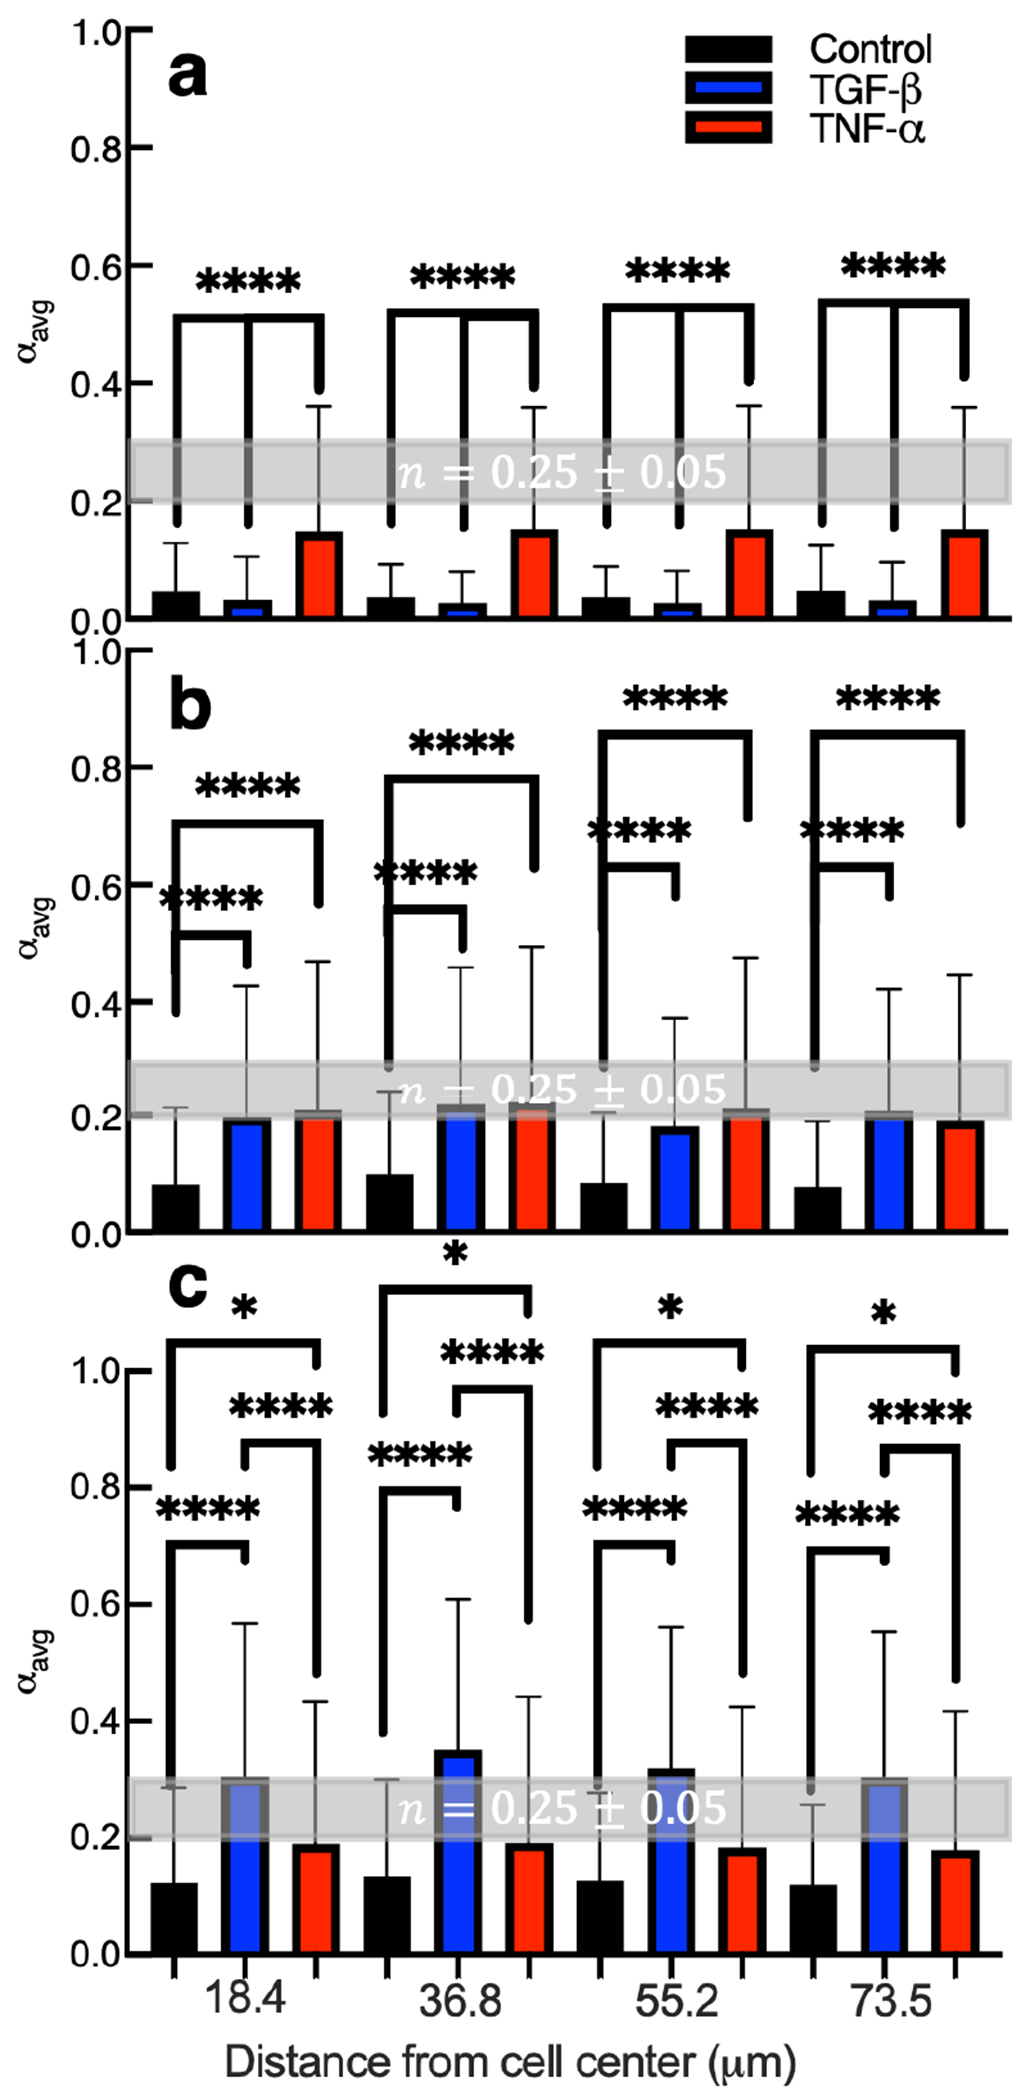
Calculated values of for all measurements in hydrogel pericellular regions (a) 2, (b) 3, and (c) 4 days postencapsulation. The critical relaxation exponent, n, where the gel–sol phase transition occurs is shaded in gray at n = 0.25 ± 0.05. Data are presented as the mean ± the standard deviation as a function of increasing distance from the cell center, and i is the number of data points for each condition. For hydrogels with no cytokines, (a) i = 176, (b) i = 168, and (c) i = 139. For hydrogels with tethered TGF-, (a) i = 322, (b) i = 333, and (c) i = 315. For hydrogels with tethered TNF-, (a) i = 330, (b) i = 322, and (c) i = 345. Significance is denoted by adjusted p-values where *p < 0.0032, **p < 0.0021, ***p < 0.0002, and ****p < 0.0001.
Two days postencapsulation hydrogels with tethered TNF- have increased cell-mediated degradation compared to hydrogels with tethered TGF- or without cytokines, Figure 5a. At all distances from the cell center, the values in hydrogels with tethered TNF- are approaching the gel–sol transition, = n = 0.25 ± 0.05. Scaffolds with tethered TGF- and without cytokines are still in the gel state regardless of distance from the cell center. Therefore, tethering TNF- into the material microenvironment increases cell-mediated degradation at all distances away from the cell center compared to hydrogels with tethered TGF- or without cytokine. Cells are likely responding to TNF- at this early time postencapsulation because in the native wound environment TNF- is present during the early stages of wound healing.5,10 TNF- is also known to increase the secretion of MMPs, which would increase the amount of scaffold cross-links degraded.
Three days postencapsulation, Figure 5b, we measure increased degradation of hydrogels with tethered TGF- and TNF- compared to control hydrogels. The value is either in or approaching the phase transition region in scaffolds with tethered cytokines. There is no statistically significant difference between hydrogels with tethered TNF- and TGF-. As the distance from the cell center increases, remains constant indicating a uniform degradation profile across all test groups. On day 3 postencapsulation, hMSCs have begun responding to the tethered TGF-. Although TGF- is known to decrease secretion of MMPs, which would result in fewer broken scaffold cross-links, we still measure an increase in degradation compared to control gels.76 One explanation for this result is the cells encapsulated in hydrogels with tethered TGF- begin moving faster on day 3 postencapsulation. In order to move the cells must pull on the network, which could increase particle motion and create higher value.
Figure 5c is cell-mediated degradation measured 4 days postencapsulation. Four days postencapsulation, we measure the highest amount of degradation in all hydrogel scaffolds when compared to earlier times. This is because hMSCs have had time to degrade the scaffold and become motile. Comparing the different hydrogels, we measure the greatest degradation in hydrogels with tethered TGF-. Ries et al. reported TGF- is a more potent chemoattractive agent than TNF-,41 meaning in a solution of cells a greater number of the cells will migrate toward TGF- compared to TNF-. In our system, since cytokines are uniformly presented in the microenvironment, this should result in increased random migration in hydrogels with tethered TGF-. This increase in cell migration could translate to an increase in probe particle motion because the cells must elongate and pull on the material to migrate. MPT measurements on day 4 post-encapsulation in hydrogels with thiolated TGF- are likely measuring a combination of particle Brownian motion and directed motion due to cytoskeletal tension on the network. We discuss this further in the cell morphology and motility section.
Four days postencapsulation, there is a statistically significant increase in degradation in materials with tethered TNF- compared to hydrogels with no cytokine. This measurement has a larger p-value compared to day 2 or 3 postencapsulation, indicating there is a smaller difference. In the native wound healing process hMSCs respond to TNF- initially, this is reflected in our data in Figure 5b.5,10,76 hMSCs in hydrogels with tethered TNF- have increased degradation on early days postencapsulation, which could deplete TNF- in the network and release these tethered molecules during scaffold degradation. In comparison, hMSCs have just begun responding to tethered TGF- on day 3 postencapsulation suggesting there is still TGF- in the network to respond to and lower amounts of degradation means that the molecules remain present in the cell microenvironment. Therefore, TGF- is more effective at increasing remodeling on later days postencapsulation mimicking conditions in the wound.5,10,76
Cell Morphology and Motility.
A successful cell delivery vehicle or hydrogel scaffold mimics aspects of the native extracellular matrix and enables cell migration from the hydrogel to the wound site. Migration out of the scaffold is not guaranteed and may require cues from the microenvironment to direct cell motility. Mesenchymal cell migration is a cycle of protrusion, adhesion and contraction.89,91,92 We measure cell area and eccentricity, which correlates to protrusion and adhesion and can be precursors to migration. We measure that tethering cytokines into a network for local presentation to encapsulated cells does increase migration speed and is a potential cue that can instruct cells to migrate. Bright-field images of encapsulated cell morphology and motility are provided in the Supporting Information in Figure S10.
Figure 6a is the average area of encapsulated cells for days 2, 3, and 4 postencapsulation. hMSCs encapsulated in hydrogels with tethered TGF- have statistically significant larger cell areas on all days postencapsulation compared to cells in control hydrogels or hydrogels with tethered TNF-. hMSCs encapsulated in hydrogels with tethered TNF- have significantly larger cell areas on days 2 and 4 postencapsulation compared to control gels. Cell area increases when either cytokine is tethered into the hydrogel scaffold, which is indicative of migration. The greatest increase is cell area on all days postencapsulation is in hydrogels with tethered TGF-. This finding is supported by previous work that showed hMSCs are almost twice as attracted to TGF- than TNF-.41 This increase in area could also be attributed to the fact that both cytokines (TGF- and TNF-) are known to increase cell adhesion.93,94 Cell adhesion to a substrate can be broken down into four steps: attachment by integrins and proteogylcans, flattening, spreading and organization of actin and the formation of focal adhesions.95 Tethering cytokines increases cell area measurements, which we hypothesize could be because of several reasons. Cells are better able to adhere to materials with tethered cytokines compared to scaffolds without tethered cytokines. A second explanation is the cell is spreading in material that is degraded, which provides a larger area that the cell can fill.
Figure 6.
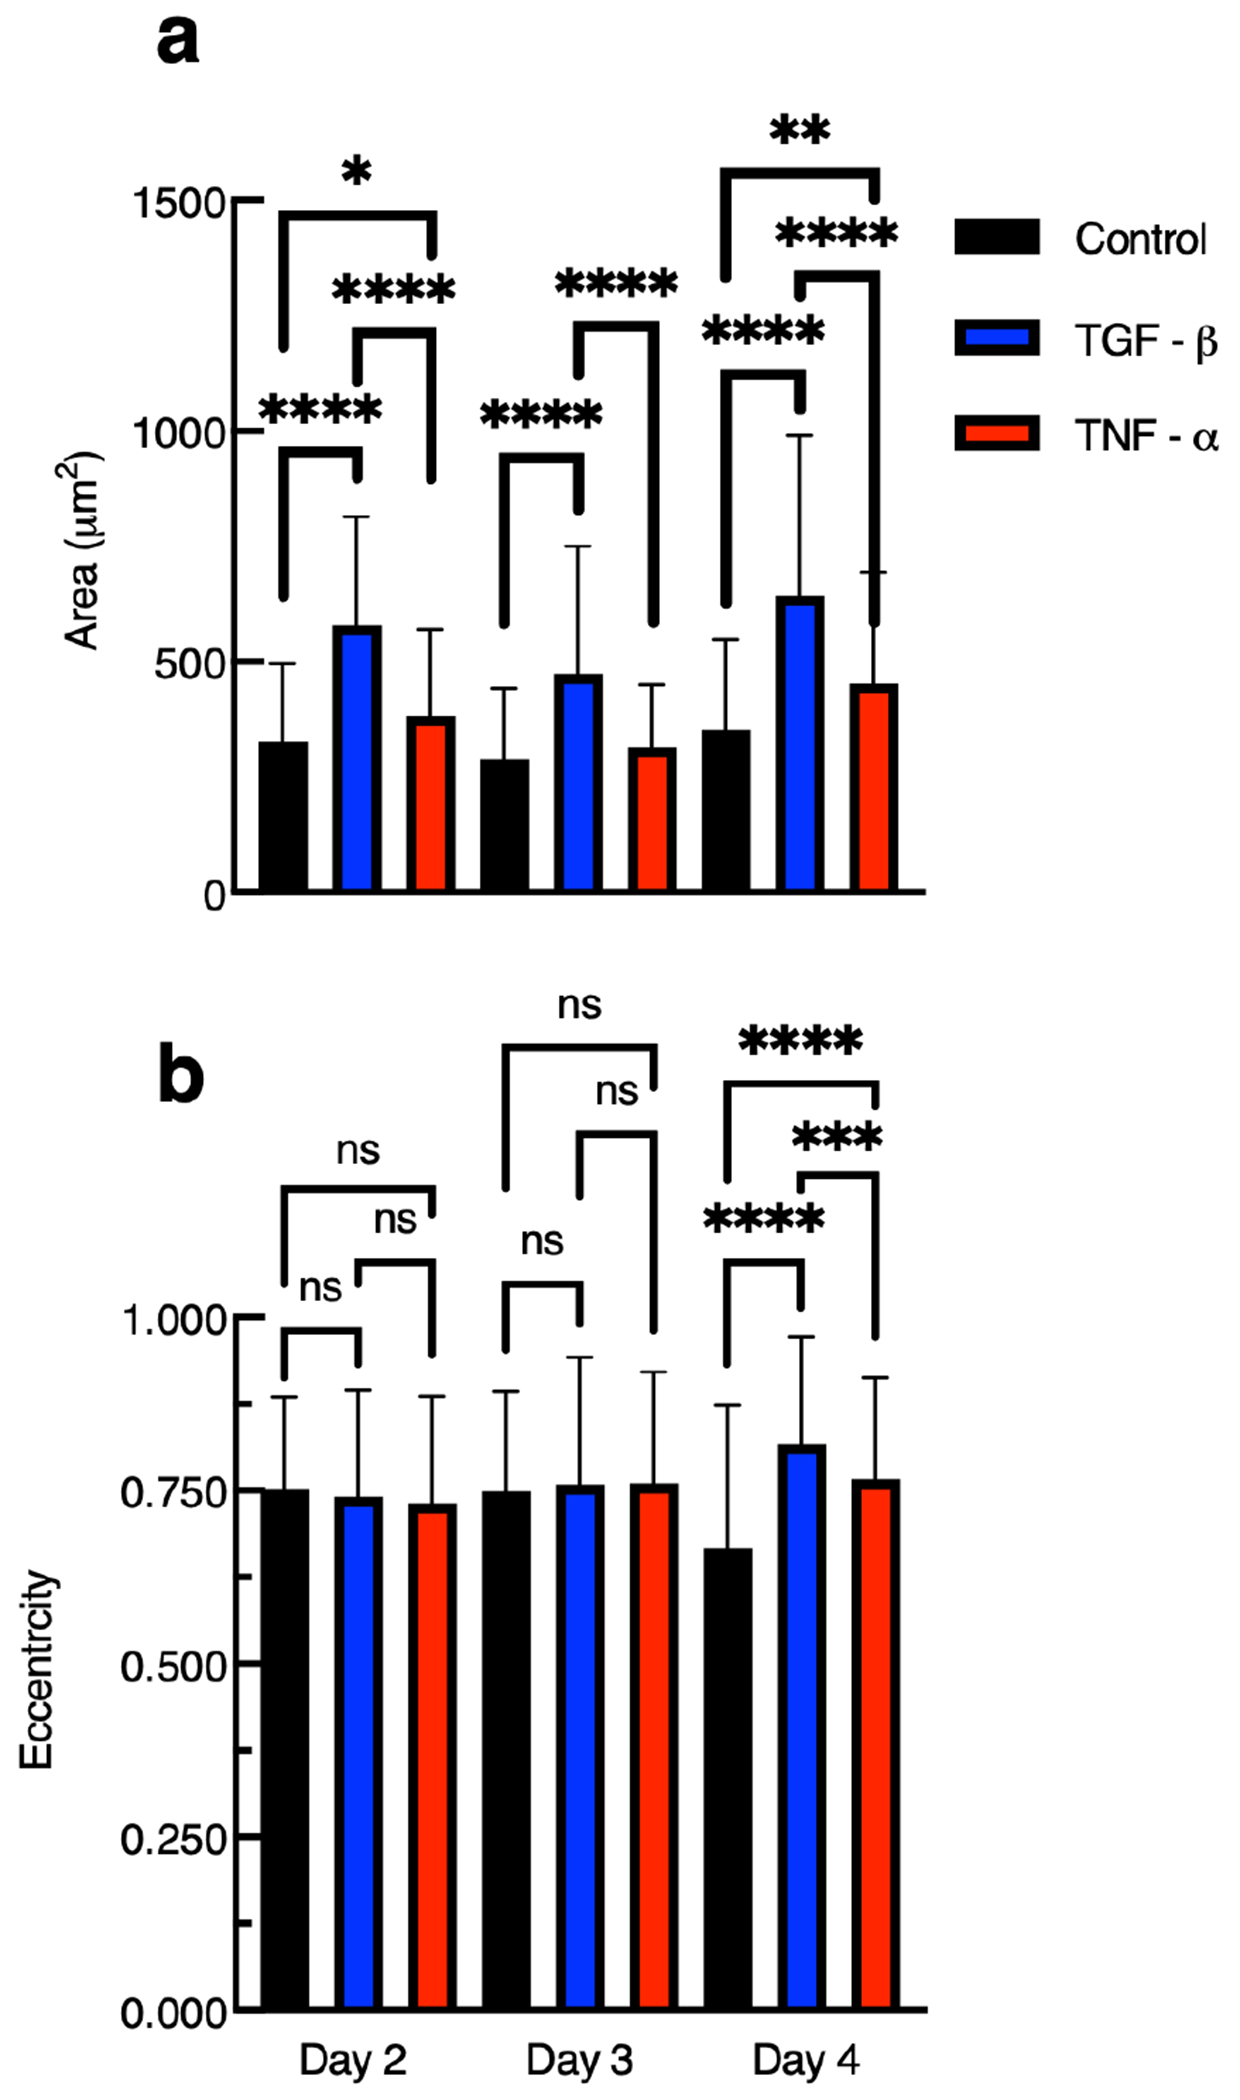
Measurements of 3D encapsulated hMSC (a) area and (b) eccentricity in gels with and without tethered cytokines 2, 3, and 4 days postencapsulation. Data are presented as the mean ± the standard deviation, and i is the number of data points. For measurements of cells in hydrogels with tethered TGF-, on day 2 postencapsulation the number of points are i = 351, day 3 postencapsulation are i = 303, and day 4 postencapsulation are i = 283. For measurements of cells in hydrogels with tethered TNF-, on day 2 postencapsulation are i = 301, day 3 postencapsulation are i = 308, and day postencapsulation are 4 postencapsulation are i = 407. For measurements of cells in control gels, on day 2 postencapsulation i = 122, day 3 postencapsulation are i = 118, and day 4 postencapsulation i = 119. Significance is denoted by adjusted p-values (*p < 0.0032, **p < 0.0021, ***p < 0.0002, ****p < 0.0001, and p > 0.0032 is denoted as ns or not significant).
Figure 6b is the average eccentricity of encapsulated hMSCs on days 2, 3, and 4 postencapsulation. Eccentricity is the ratio of the distance between the ellipse foci and the central axis with values between 0 and 1. An ellipse whose eccentricity is 0 is a circle, while an ellipse with an eccentricity of 1 is a line segment. An adhered and stretched hMSC would have a value of eccentricity close to 1.
On day 2 postencapsulation, we measure an average eccentricity approximately equal to 0.75 ± 0.14 with no difference across the three treatment groups. This value quantifies that cells are stretched and shaped like a semielongated ellipse. On day 3 postencapsulation, we measure very similar results to day 2 postencapsulation with an average eccentricity approximately equal to 0.76 ± 0.16 with no difference across the treatment groups. These results show that on early days postencapsulation tethering chemical cues do not affect the elongation of encapsulated hMSCs but the cells are elongated. This is likely because the average encapsulated cell is confined in a sample-spanning network and the cell is degrading and attaching to the network to begin migration. This is supported by our measurements of pericellular remodeling in Figure 5. In Figure 5, we measure that cells in hydrogels with tethered TGF-, do not increase remodeling immediately after encapsulation but remodeling is increased 3 and 4 days postencapsulation. Together, these measurements suggest hMSCs have secreted enough MMPs to stretch out but not enough to fully elongate into a shape that resembles a line. Regardless of the treatment group, an eccentricity of ≈0.75 indicates encapsulated hMSCs are able to stretch in the networks.
We do measure a difference in cell eccentricity in our different hydrogel scaffolds on day 4 postencapsulation. We measure a statistically significant increase in the eccentricity of encapsulated cells in hydrogels with tethered TGF- and tethered TNF- compared to the control gel. Measurements show hMSCs are more elongated in hydrogels with tethered TGF- than hydrogels with tethered TNF-. This finding is supported by the fact that TGF- is a more potent chemoattractant, resulting in more effective cell elongation.41 Additionally, we hypothesize that there are fewer TNF- molecules remaining in the network on later days postencapsulation due to cell-mediated degradation on early days postencapsulation. Our measurements show that tethering chemical cues does not increase cell elongation until 4 days postencapsulation. We hypothesize hMSCs in gels with tethered cytokines at longer time scales can stretch out more than those without cytokines. A possible reason for this is that the hMSCs are attracted to the tethered cytokines and extend their cytoskeleton toward a molecule in the network.18 Additionally, on day 4 postencapsulation we do measure a statistically significant decrease in cell elongation of our control group when compared to other control groups on earlier days postencapsulation. This decrease may be due to increased scaffold degradation, which results in less material for the hMSC to adhere to. This decrease in elongation in the control group could be the reason we measure a statistically significant increase in elongation when cytokines are tethered into the scaffold. Measurements of cell area and elongation are important because they indicate whether cells are undergoing motility. We also quantify hMSC migration speed, which we will discuss next.
An advantage of our experimental technique is while we are tracking pericellular degradation we also collect cell positions, which can be used to measure motility. We track individual cells migrating every 6 minutes or until the cell moves out of frame. With this data we measure how tethering chemical cues changes encapsulated cell speed. hMSC migration data is provided in Figure 7 using a truncated violin plot, which is similar to a box and whisker plot. The same graph with a larger y-axis range () is provided in the Supporting Information in Figure S11, which includes all outliers in the data set. x – y trajectory maps are also plotted in Supporting Information S12.
Figure 7.
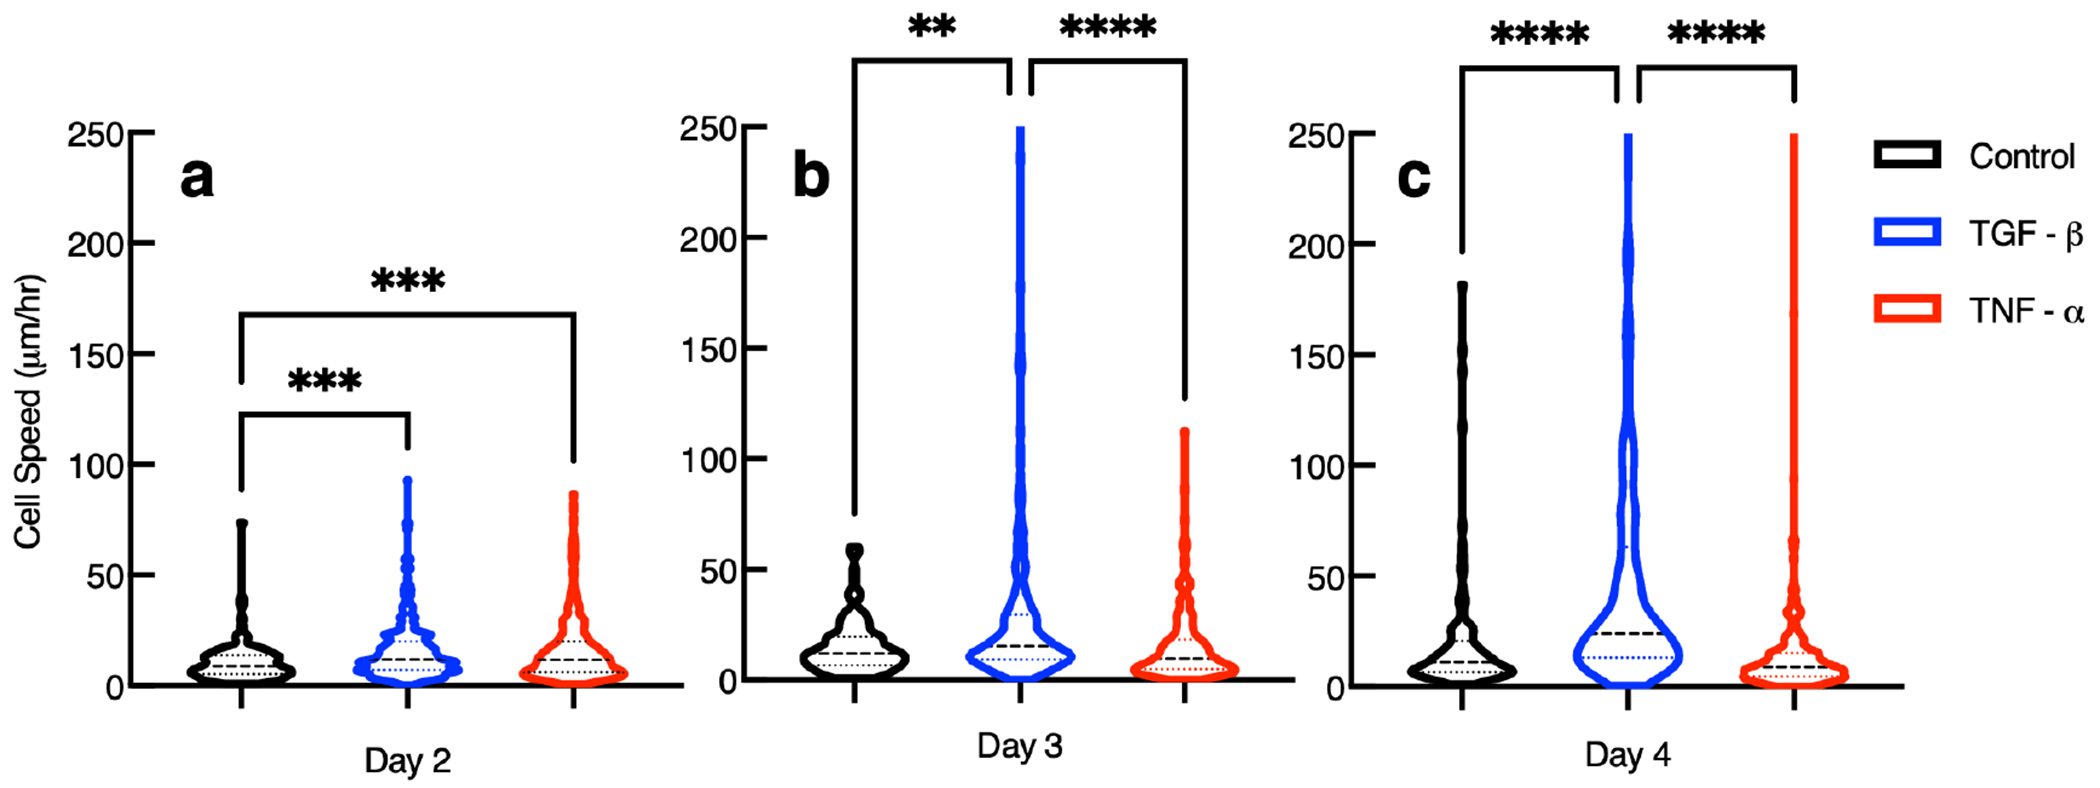
Speed of hMSCs 3D encapsulated in hydrogels without cytokines with tethered TGF- or with tethered TNF- days 2, 3, and 4 postencapsulation. Data are presented as the mean ± the standard deviation, and i is the number of data points for each condition. For measurements of cells in hydrogels with tethered TGF-, (a) i = 351, (b) i = 303, and (c) i = 283. For measurements of cells in hydrogels with tethered TNF-, (a) i = 301, (b) i = 308, and (c) i = 407. For measurements of cells in control hydrogels, (a) i = 122, (b) i = 118, and (c) i = 119. Significance is denoted by adjusted p-values (*p < 0.0032, **p < 0.0021, ***p < 0.0002, and ****p < 0.0001).
This type of graph is used to show the variance in individual cell speed measurements and show the distribution of the entire data set for each condition. The data set is broken into quartiles each with 25% of the measurements. Each violin begins at the lowest measured cell speed. The space between the beginning of the violin and the first dashed line is 25% of the data collected. The first lightly colored dashed line from the x-axis marks the lower quartile, this is the data below the median. The second heavier dashed line represents the median speed. The third and highest light dashed line represents the upper quartile of the total data collected. The space between the third dashed line and the end of the top of the truncated violin is the maximum speed recorded and the upper 25% of the data collected.
On day 2 postencapsulation, we measure increased cell speed in hydrogels with either tethered TGF- or TNF- compared to control gels. In order for cells to migrate they must degrade the pericellular region enough so the cell nucleus can squeeze through the network.89 This means that cells can migrate prior to degrading the material past the gel–sol phase transition, but must break sufficient cross-links to be able to squeeze their nucleus through. Hydrogels with tethered TGF- allow individual cells to move faster compared to a hydrogel with no tethered chemical cues. Presentation of tethered TNF- in the scaffold also increases cell speed when compared to migration in a control gel. These findings are supported by previous studies showing that TGF- and TNF- increase migration in a cell invasion study, where cells are separated from a fluid by an artificial ECM.41 In this work, TGF- causes 6.5× hMSCs to migrate compared to a control, while TNF- increases the amount of hMSCs migrating by 3.5× compared to a control.41 Other work shows TNF- is chemoattractive and increases the amount of MMPs that hMSCs secrete, increasing cell-mediated degradation.41,76 There is no difference between cell speed in hydrogels with tethered TGF- compared to hydrogels with tethered TNF- on day 2 postencapsulation. We hypothesize hMSCs respond more to TNF- compared to TGF- on day 2 postencapsulation because in the native wound healing process TNF- is present at the start of the wound healing process and TGF- is expressed at later times.5,76
On day 3 postencapsulation, we measure 2× the average cell speed for cells in gels with tethered TGF- compared to hMSCs in gels with tethered TNF- or control gels. There are no changes between the other groups. Our measurements show tethering TNF- is not effective in increasing cell migration speed 3 days postencapsulation. One reason for this is the tethered TNF- in the network could be depleted by cells on the first 2 days postencapsulation. Although this is possible, there must still be some TNF- tethered into the scaffold on later days postencapsulation because in Figure 5 we measure increased cell-mediated degradation on days 2, 3, and 4 postencapsulation. Another explanation is that TGF- is more chemoattractive and causes more cell migration than TNF- in a scaffold.9,41
On day 4 postencapsulation, we measure double the average cell speed in hydrogels with tethered TGF- compared to cells in gels with tethered TNF- or control gels. This is the same finding as day 3 postencapsulation. A statistical comparison of our measurements show tethering TNF- into the scaffold is not effective in increasing cell migration speed 4 days postencapsulation compared to control hydrogels or hydrogels with tethered TGF-.
Overall, our work shows that hMSCs increase cell-mediated degradation and motility in response to TGF- tethered into the material microenvironment. Kyburz et al. quantify hMSC migration in the same scaffold and measure an average cell speed of 17.6.26 Our measurements show hydrogels with tethered TGF- have double the previously reported speed 3 days postencapsulation and approximately triple the previously reported speed on day 4 postencapsulation. It is worth noting, that cells have a delayed response to tethered TGF- in the network. Initially tethered TGF- seems to decrease the amount of MMPs secreted.76 We measure less degradation on average on day 2 postencapsulation compared to control gels or gels with tethered TNF-, Figure S5. However, on day 3 postencapsulation we measure a change in the cell response to TGF- tethered in the microenvironment. Figure 5b shows increased degradation and Figure 7 shows a significant increase in cell speed. TGF- is expressed in later stages of wound healing, 36–336 hours after injury.5 Three days postencapsulation is when we start to measure a significant increase in cell motion and degradation in hydrogels with tethered TGF-, which agrees with the response in the body.
Modifying the control hydrogel by tethering chemical cues into the scaffold enables encapsulated cells to better adhere, elongate and degrade the pericellular region. Our measurements show that tethering TGF- increases cell migration on all days postencapsulation. In hydrogels with tethered TNF- average migration speed only increases 2 days postencapsulation compared to the control. On day 3 and 4 postencapsulation there is no difference in average cell speed between control hydrogels and hydrogels with tethered TNF-. This agrees with previous work that shows that TGF- is a more potent chemoattractant and TNF- is approximately half as effective as TGF- in increasing the amount of cells that migrate.41 Our study also measures that tethering TGF- into a scaffold increases cell migration speed for 72 hours, while tethering TNF- into our scaffold increases cell speed for a shorter time frame, for 24 hours immediately after encapsulation.
Comparison of hMSC-Mediated Degradation and Motility in Response to Cytokines in the Fluid Environment and Tethered into the Hydrogel Scaffold.
We use statistical tests to compare our rheological and cell speed measurements from covalently tethering pro- and anti-inflammatory cytokines to measurements that include the same chemical cues in solution.19 Both studies use the same synthetic scaffold and three biological replicates of bone marrow-derived adult human mesenchymal stem cells (Lonza) to quantify cell-material interactions. Previous work uses MPT to characterize encapsulated cell-mediated degradation with cytokines in the environment, mimicking cues in the wound environment. Once the scaffold is implanted it will be exposed to pro- and anti-inflammatory cytokines that will diffuse into the scaffold and change both cell-mediated degradation and cell delivery speed.19 Our work measures whether tethering these cues into the scaffold causes a different response by encapsulated cells and if this strategy can be used to instruct basic cellular processes.
Figure 8 shows the values of , which quantifies cell-mediated degradation in each system, as a function of distance from the cell center. These distances are reported in pixels because the studies use different imaging equipment. We compare tethering either TNF- or TGF- into a scaffold to the same cytokine in the fluid environment using an unpaired, two-tailed t-test.
Figure 8.
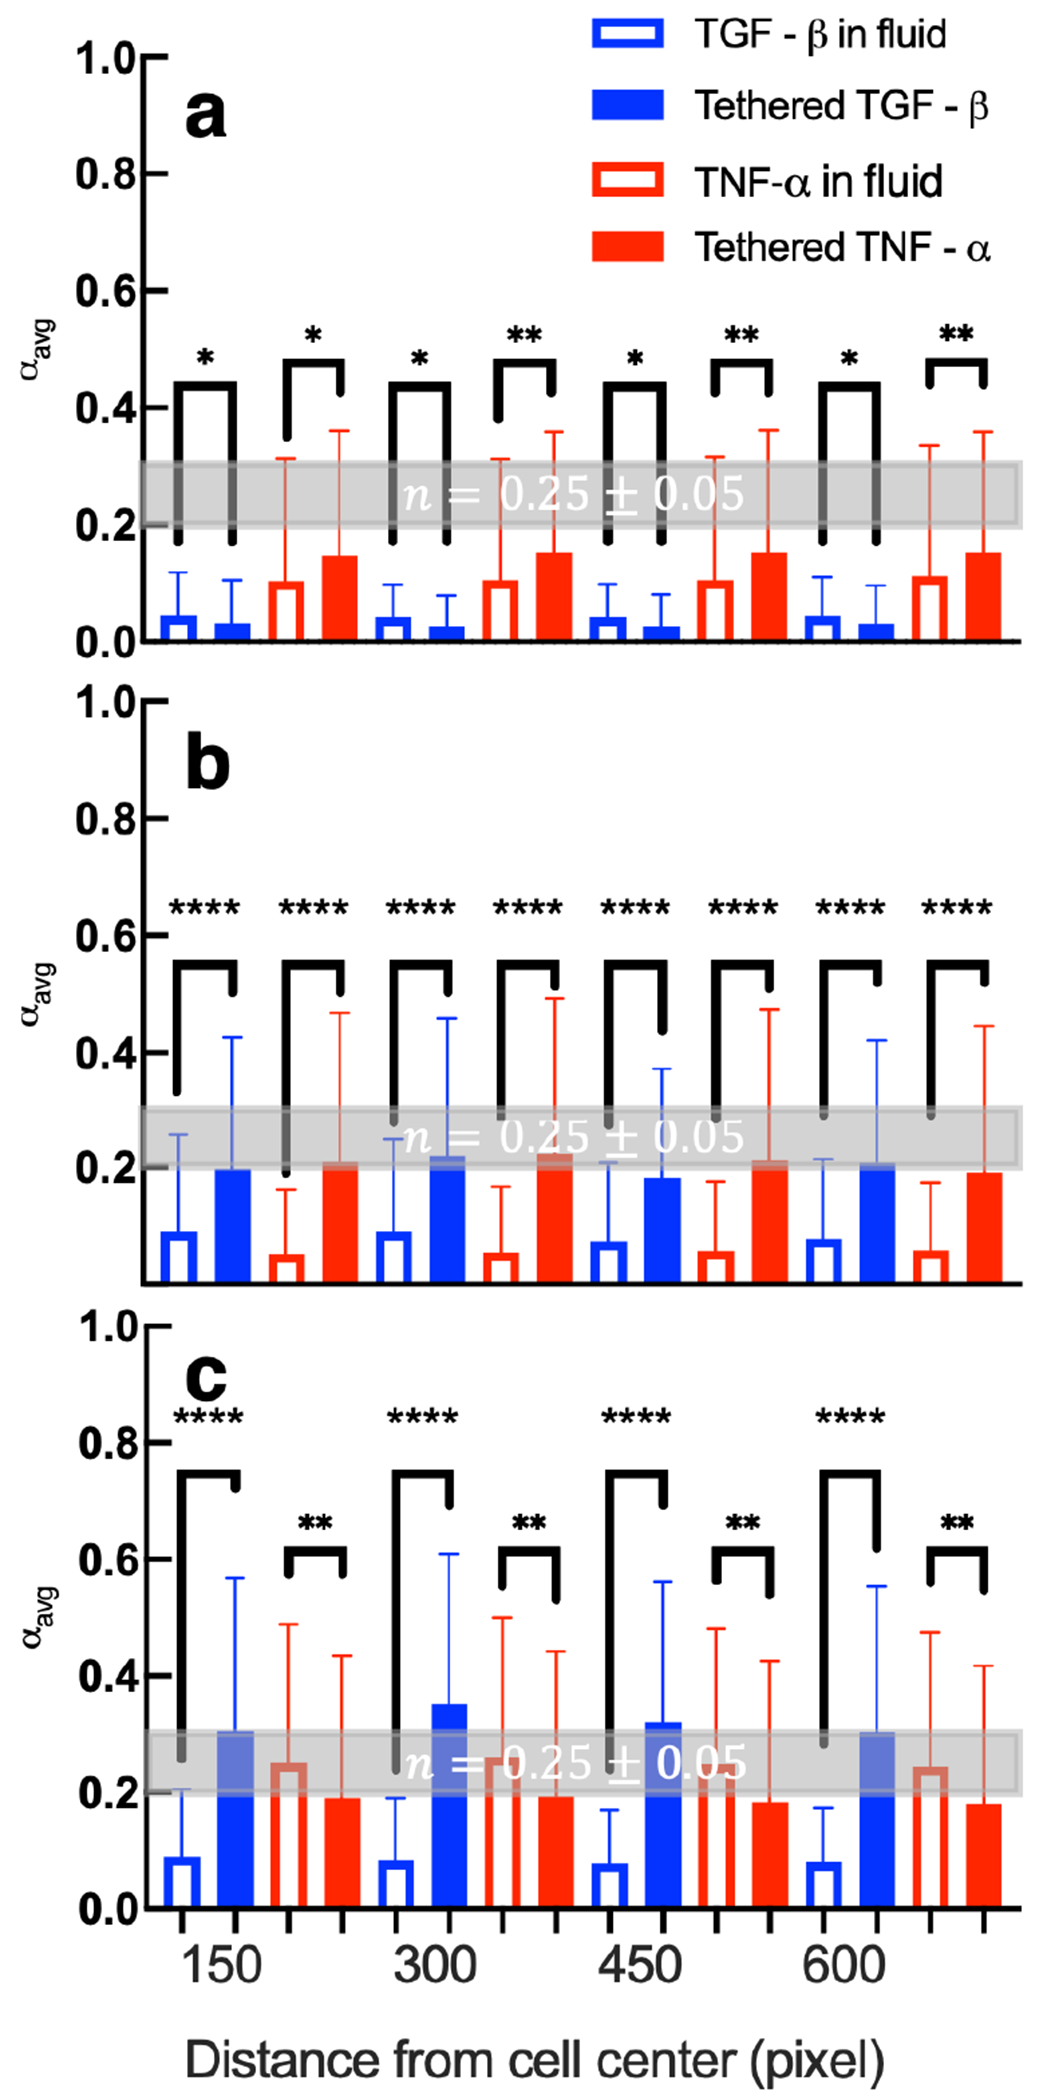
A comparison of calculated values of in hydrogels with pro- or anti-inflammatory cytokines tethered into the network to hydrogels with pro- or anti-inflammatory in the surrounding fluid (a) 2, (b) 3, and (c) 4 days postencapsulation. The critical relaxation exponent, n, where the gel–sol phase transition occurs is shaded in gray at n = 0.25 ± 0.05. Data are presented as the mean ± the standard deviation and the number of data points i ≥ 214 for each condition on each day at each distance. Significance is denoted by p-values (*p < 0.0032, **p < 0.0021, ***p < 0.0002, and ****p < 0.0001). Data collected with cytokines in the fluid environment are reprinted with permission from ref 19. Copyright 2021 American Chemical Society.
In Figure 8a, day 2 postencapsulation, we measure less degradation in networks with tethered TGF- than including TGF- in the surrounding fluid. This may be because hMSCs are interacting with more TGF- molecules when TGF- is tethered to the scaffold rather than relying on the molecules to diffuse into the tightly cross-linked hydrogel network. As described previously, TGF- molecules decrease MMP secretions and increase tissue inhibitors of metalloproteinases (TIMPs) secretions.76 While MMPs degrade our network, TIMPs bind to MMPs and form a MMP-TIMP complex which inhibits degradation of the network.31,96 We also measure statistically significant increases in cell-mediated degradation in networks with tethered TNF- compared to networks with TNF- in the surrounding fluid. When TNF- is tethered into the hydrogel, we hypothesize individual hMSCs are interacting with a large amount of TNF- molecules in their microenvironment while relying on TNF- to diffuse into the scaffold would result in a lower concentration. In response to TNF-, hMSCs produce more MMPs enhancing pericellular degradation.76
On day 3 postencapsulation, Figure 8b, tethering either TNF- or TGF- is more effective in increasing cell-mediated degradation than including it in the fluid environment. We hypothesize this is because encapsulated cells have more readily available cytokines in their microenvironment than when the molecules must diffuse into the network. TGF- increases cell migration, which results in irreversible scaffold degradation and reversible remodeling due to cytoskeletal tension. TNF- increases MMP secretions which degrades more cross-links.
On day 4 postencapsulation, Figure 8c, we measure similar results for cell responses to TGF- as day 3 postencapsulation. Tethered TGF- hydrogels have increased cell-mediated degradation compared to when TGF- is included in the fluid. However, hydrogels with tethered TNF- have less cell-mediated degradation than when TNF- is provided in the media. One hypothesis is hMSCs may have depleted the tethered TNF- by day 4 postencapsulation but hMSCs can still respond to TNF- that is continuously diffusing through the network.
From this comparison, we conclude that tethering the anti-inflammatory cytokine, TGF-, is more effective in increasing cell-mediated degradation than providing this cytokine in the fluid environment on days 3 and 4 postencapsulation. Tethering the pro-inflammatory cytokine, TNF-, is more effective in increasing cell-mediated degradation on days 2 and 3 postencapsulation. These measurements show that depending on the desired response by the encapsulated cells either strategy for presentation of cytokines would be suitable.
Figure 9a–c shows average cell speed in each treatment group 2, 3, and 4 days postencapsulation, respectively. The measurement reported is the average magnitude of approximately 9 speed measurements of the same cell over a 60 minute interval. Each violin plot is the average cell speed of at least 30 different cells. We compare tethering either TGF- or TNF- into the hydrogel scaffold to the same cytokine provided in the fluid environment. We use a Kolmogorov–Smirnov test to compare cumulative distributions, which accounts for outliers in a data set.
Figure 9.
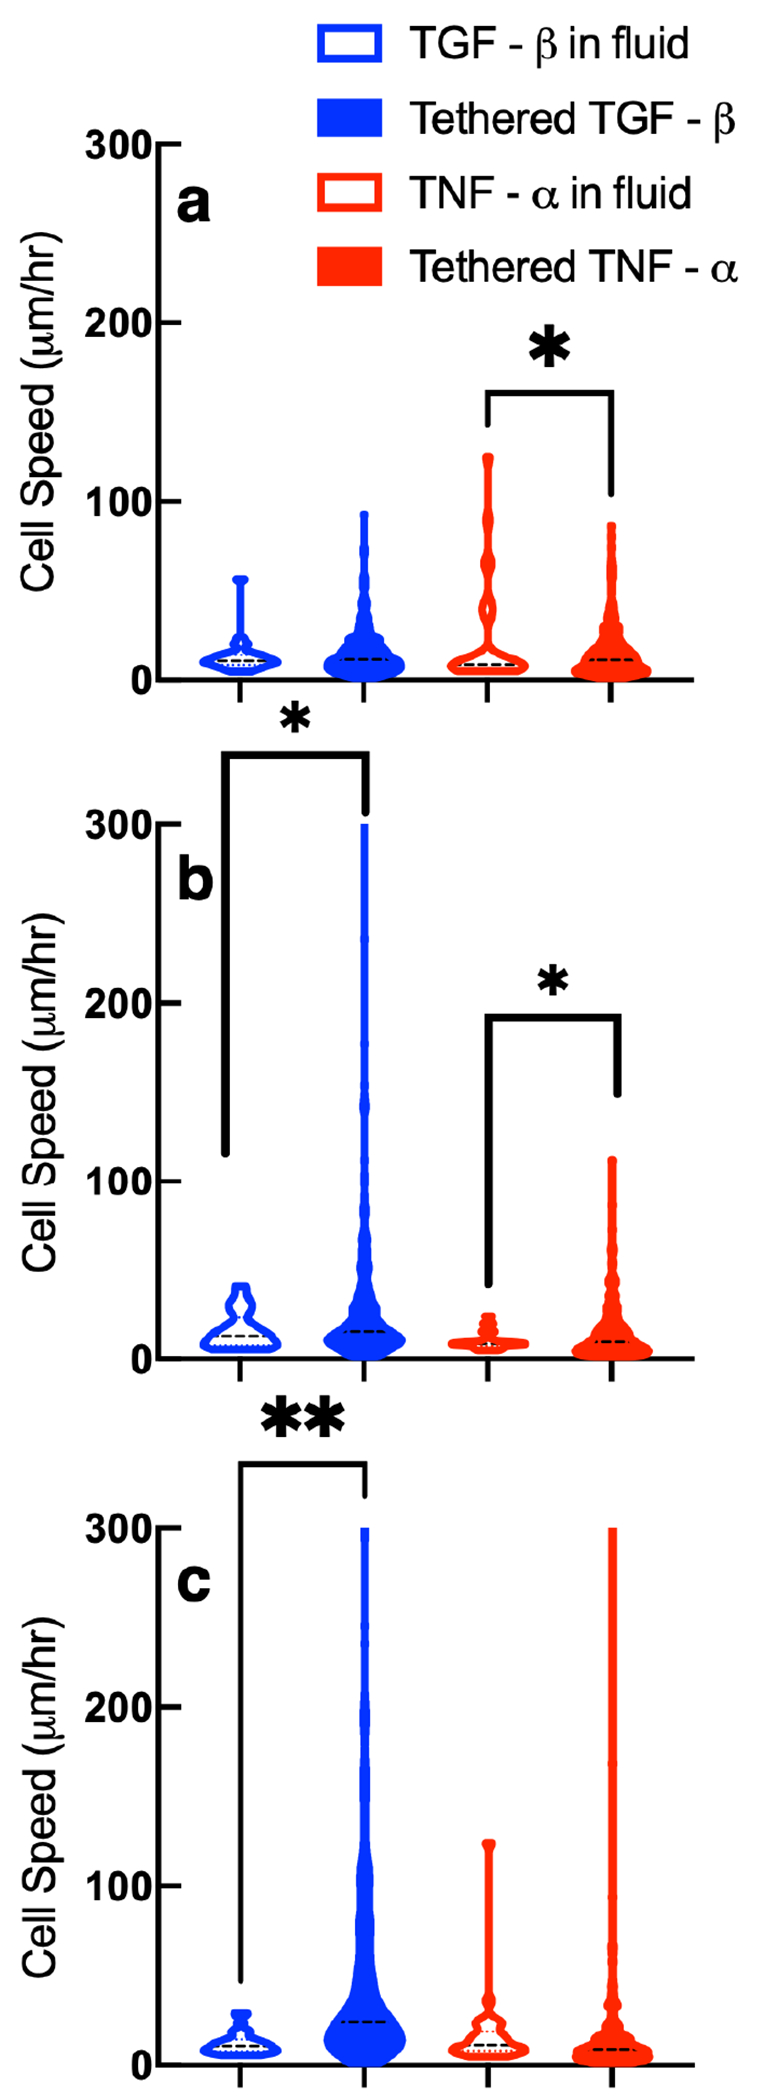
A comparison of calculated values of cell speed in hydrogels with pro- or anti-inflammatory cytokines tethered in the network or with pro- or anti-inflammatory cytokines in the surrounding fluid (a) 2, (b) 3, and (c) 4 days postencapsulation. Significance is denoted by p-values (*p < 0.0032, **p < 0.0021, ***p < 0.0002, and ****p < 0.0001). i is the number of measurements with i ≥ 29 for each condition on each day. Data collected with cytokines in the fluid environment are reprinted with permission from ref 19. Copyright 2021 American Chemical Society.
On day 2 postencapsulation, Figure 9a, we measure no change between tethering TGF- and including it in the media. Including TNF- in the surrounding media increases cell speed on average compared to tethering it into the network. On day 2 postencapsulation regardless of presentation or type of cytokine, cells are encapsulated in a tightly cross-linked network which hinders migration. This is shown in Figure 9a by the overall low values of cell speed. The statistically significant increase in cell speed when TNF- is included in the media may be because including TNF- in the media would create a concentration gradient. There would be a low concentration of TNF- in the hydrogel initially but a higher finite amount in the bulk solution. This concentration gradient would mimic the native wound environment and could cause an increase in motility. Cells are known to respond to cytokines at concentrations on the order of picomolar and have directed migration when provided in a gradient.5,9,12,27
On day 3 postencapsulation, Figure 9b, tethering chemical cues (TGF- or TNF-) into the scaffold is more effective in increasing cell speed compared to including the same cues in the surrounding fluid. The concentration gradient of cytokine between the hydrogel and the fluid is likely absent after 48 hours. Tethering cues into the network could be more effective because these cues are locally available and known to increase cell migration.41
On day 4 postencapsulation, Figure 9c, encapsulated cells in hydrogels with tethered TGF- have higher speeds than hydrogels with TGF- in the fluid. We measure no change in cell speed by including TNF- in the fluid environment compared to tethering it into the network. One reason for this result could be because of the potency of each cytokine, with TGF- being more chemoattractive than TNF-, which would result in more random migration when the cytokine is uniformly tethered into the scaffold.41
The results of this work suggest tethering TNF- is effective in increasing cellular responses on early days postencapsulation and tethering TGF- is effective in increasing cellular responses on later days postencapsulation. A next step could be cotethering both cytokines into the scaffold. We hypothesize cotethering would either create an oversignaling response and limit control over cell function or increase remodeling and motility by encapsulated hMSCs. More experiments would need to be completed to assess the efficacy of cotethering.
CONCLUSIONS
Pro- (TGF-) and anti-inflammatory (TNF-) cytokines are covalently tethered into our hydrogel scaffold. The presence of these tethered molecules is confirmed using a modified indirect ELISA. Using bulk rheology and microrheology, we measure that tethering cytokines into the network does not change our hydrogel structure at the phase transition or the storage modulus. Next, we encapsulate hMSCs and measure spatiotemporal rheology in the pericellular region in our three different scaffolds (control, tethered TGF- and tethered TNF-). We measure that tethering TNF- into the hydrogel increases cellular remodeling on earlier days postencapsulation and tethering TGF- into the scaffold effectively increases cellular remodeling on later days. This finding is echoed in the native wound healing process. TNF- is expressed 24–36 hours after a wound occurs while TGF- is expressed 72–336 hours and causes directed cell migration.5
A successful cell delivery vehicle mimics aspects of the native extracellular matrix and enables cell migration from the hydrogel to the wound site. Prior to migration, cells must stretch and adhere to the surrounding material. We have shown tethering either TNF- or TGF- can enhance cell stretching and migration. This can be used in the future to direct cell migration from a scaffold to the wounded tissue. We have also characterized cell-mediated degradation and remodeling in pericellular rheology in response to either tethered chemical cue. These measurements detail the extent of cell-mediated degradation and indicate how the integrity of the material will change temporally after implantation. This work can be used to guide the design of scaffolds that enhance cell delivery using chemical cues while providing a consistent initial physical microenvironment that is unchanged in crosslink density or storage modulus.
Supplementary Material
ACKNOWLEDGMENTS
The authors thank Dr. E. Thomas Pashuck (Lehigh University) for discussions on statistical testing and Dr. Susan Perry (Lehigh University) for help with the modified indirect enzyme-linked immunosorbent assay. Research reported in this publication was supported by the National Institute of General Medical Sciences of the National Institutes of Health under Award Numbers R35GM147043 and R15GM119065. The content is solely the responsibility of the authors and does not necessarily represent the official views of the National Institutes of Health.
Footnotes
Supporting Information
The Supporting Information is available free of charge at https://pubs.acs.org/doi/10.1021/acs.biomac.4c00508.
Comparison of indirect ELISA to traditional ELISA; Figure S1, frequency sweeps of PEG-N hydrogels with and without tethered cytokines; Figure S2, strain sweep of PEG-N hydrogel; Figure S3, time-cure superposition analysis of degradation of hydrogel without cytokines, Figure S4, time-cure superposition analysis of degradation of hydrogel with tethered TGF-; Figure S5, time-cure superposition analysis of degradation of hydrogel with tethered TNF-; Figure S6, encapsulated cell viability in hydrogels with and without tethered cytokines; Figure S7, values for the entire pericellular region of all data separated into test groups; Figure S8, spatiotemporal MPT measurements 2 days postencapsulation; Figure S9, spatiotemporal MPT measurements 3 days postencapsulation; Figure S10, bright-field images of encapsulated cell morphology; Figure S11, violin plot of 3D encapsulated cells speed with the complete y-axis; and Figure S12, x – y trajectory map of selected encapsulated cells (PDF)
Complete contact information is available at: https://pubs.acs.org/10.1021/acs.biomac.4c00508
The authors declare no competing financial interest.
Contributor Information
Thomas C. O’Shea, Purdue University, Davidson School of Chemical Engineering, West Lafayette, Indiana 47907, United States
Kiera J. Croland, University of Colorado at Boulder, Department of Chemical and Biological Engineering, Boulder, Colorado 80303, United States
Ahmad Salem, Lehigh University, Department of Chemical and Biomolecular Engineering, Bethlehem, Pennsylvania 18015, United States.
Rylie Urbanski, Lehigh University, Department of Chemical and Biomolecular Engineering, Bethlehem, Pennsylvania 18015, United States.
Kelly M. Schultz, Purdue University, Davidson School of Chemical Engineering, West Lafayette, Indiana 47907, United States.
REFERENCES
- (1).Dash BC; Xu Z; Lin L; Koo A; Ndon S; Berthiaume F; Dardik A; Hsia H Stem cells and engineered scaffolds for regenerative wound healing. Bioengineering 2018, 5, 23. [DOI] [PMC free article] [PubMed] [Google Scholar]
- (2).Lee PY; Cobain E; Huard J; Huang L Thermosensitive hydrogel PEG–PLGA–PEG enhances engraftment of muscle-derived stem cells and promotes healing in diabetic wound. Mol. Ther 2007, 15, 1189–1194. [DOI] [PubMed] [Google Scholar]
- (3).Lutolf MP; Lauer-Fields JL; Schmoekel HG; Metters AT; Weber FE; Fields GB; Hubbell JA Synthetic matrix metalloproteinase-sensitive hydrogels for the conduction of tissue regeneration: engineering cell-invasion characteristics. Proc. Natl. Acad. Sci. U.S.A 2003, 100, 5413–5418. [DOI] [PMC free article] [PubMed] [Google Scholar]
- (4).Ennis WJ; Sui A; Bartholomew A Stem cells and healing: impact on inflammation. Adv. Wound Care 2013, 2, 369–378. [DOI] [PMC free article] [PubMed] [Google Scholar]
- (5).Maxson S; Lopez EA; Yoo D; Danilkovitch-Miagkova A; LeRoux MA Concise review: role of mesenchymal stem cells in wound repair. Stem Cells Transl. Med 2012, 1, 142–149. [DOI] [PMC free article] [PubMed] [Google Scholar]
- (6).Yoshikawa T; Mitsuno H; Nonaka I; Sen Y; Kawanishi K; Inada Y; Takakura Y; Okuchi K; Nonomura A Wound therapy by marrow mesenchymal cell transplantation. Plast. Reconstr. Surg 2008, 121, 860–877. [DOI] [PubMed] [Google Scholar]
- (7).Solbu AA; Caballero D; Damigos S; Kundu SC; Reis RL; Halaas Ø; Chahal AS; Strand BL Assessing cell migration in hydrogels: An overview of relevant materials and methods. Mater. Today Bio 2023, 18, 100537. [DOI] [PMC free article] [PubMed] [Google Scholar]
- (8).Kar M; Shih Y-RV; Velez DO; Cabrales P; Varghese S Poly (ethylene glycol) hydrogels with cell cleavable groups for autonomous cell delivery. Biomaterials 2016, 77, 186–197. [DOI] [PMC free article] [PubMed] [Google Scholar]
- (9).Hocking AM The role of chemokines in mesenchymal stem cell homing to wounds. Adv. Wound Care 2015, 4, 623–630. [DOI] [PMC free article] [PubMed] [Google Scholar]
- (10).Piperigkou Z; Götte M; Theocharis AD; Karamanos NK Insights into the key roles of epigenetics in matrix macromolecules-associated wound healing. Adv. Drug Delivery Rev 2018, 129, 16–36. [DOI] [PubMed] [Google Scholar]
- (11).Holzheimer R; Steinmetz W Local and systemic concentrations of pro-and anti-inflammatory cytokines in human wounds. Eur. J. Med.Res 2000, 5, 347–355. [PubMed] [Google Scholar]
- (12).Newman RE; Yoo D; LeRoux MA; Danilkovitch-Miagkova A Treatment of inflammatory diseases with mesenchymal stem cells. Inflammation Allergy: Drug Targets 2009, 8, 110–123. [DOI] [PubMed] [Google Scholar]
- (13).Bradshaw M; Ho D; Fear MW; Gelain F; Wood FM; Iyer KS Designer self-assembling hydrogel scaffolds can impact skin cell proliferation and migration. Sci. Rep 2014, 4, 6903. [DOI] [PMC free article] [PubMed] [Google Scholar]
- (14).Wagner W; Sakiyama-Elbert S Biomaterial Science: An Introduction to Materials in Medicine; Elsevier, 2020. [Google Scholar]
- (15).Slaughter BV; Khurshid SS; Fisher OZ; Khademhosseini A; Peppas NA Hydrogels in regenerative medicine. Adv. Mater 2009, 21, 3307–3329. [DOI] [PMC free article] [PubMed] [Google Scholar]
- (16).Tibbitt MW; Anseth KS Hydrogels as extracellular matrix mimics for 3D cell culture. Biotechnol. Bioeng 2009, 103, 655–663. [DOI] [PMC free article] [PubMed] [Google Scholar]
- (17).Schwartz MP; Fairbanks BD; Rogers RE; Rangarajan R; Zaman MH; Anseth KS A synthetic strategy for mimicking the extracellular matrix provides new insight about tumor cell migration. Integr. Biol 2010, 2, 32–40. [DOI] [PMC free article] [PubMed] [Google Scholar]
- (18).DeLong SA; Moon JJ; West JL Covalently immobilized gradients of bFGF on hydrogel scaffolds for directed cell migration. Biomaterials 2005, 26, 3227–3234. [DOI] [PubMed] [Google Scholar]
- (19).Daviran M; McGlynn JA; Catalano JA; Knudsen HE; Druggan KJ; Croland KJ; Stratton A; Schultz KM Measuring the Effects of Cytokines on the Modification of Pericellular Rheology by Human Mesenchymal Stem Cells. ACS Biomater. Sci. Eng 2021, 7, 5762–5774. [DOI] [PMC free article] [PubMed] [Google Scholar]
- (20).McGlynn JA; Schultz KM Measuring human mesenchymal stem cell remodeling in hydrogels with a step-change in elastic modulus. Soft Matter 2022, 18, 6340–6352. [DOI] [PubMed] [Google Scholar]
- (21).García JR; Quirós M; Han WM; O’Leary MN; Cox GN; Nusrat A; García AJ IFN- -tethered hydrogels enhance mesenchymal stem cell-based immunomodulation and promote tissue repair. Biomaterials 2019, 220, 119403. [DOI] [PMC free article] [PubMed] [Google Scholar]
- (22).Hadden WJ; Young JL; Holle AW; McFetridge ML; Kim DY; Wijesinghe P; Taylor-Weiner H; Wen JH; Lee AR; Bieback K; et al. Stem cell migration and mechanotransduction on linear stiffness gradient hydrogels. Proc. Natl. Acad. Sci. U.S.A 2017, 114, 5647–5652. [DOI] [PMC free article] [PubMed] [Google Scholar]
- (23).Lutolf MP; Weber FE; Schmoekel HG; Schense JC; Kohler T; Müller R; Hubbell JA. Repair of bone defects using synthetic mimetics of collagenous extracellular matrices. Nat. Biotechnol 2003, 21, 513–518. [DOI] [PubMed] [Google Scholar]
- (24).Fairbanks BD; Schwartz MP; Bowman CN; Anseth KS Photoinitiated polymerization of PEG-diacrylate with lithium phenyl-2, 4, 6-trimethylbenzoylphosphinate: polymerization rate and cytocompatibility. Biomaterials 2009, 30, 6702–6707. [DOI] [PMC free article] [PubMed] [Google Scholar]
- (25).Kloxin AM; Kasko AM; Salinas CN; Anseth KS Photodegradable hydrogels for dynamic tuning of physical and chemical properties. Science 2009, 324, 59–63. [DOI] [PMC free article] [PubMed] [Google Scholar]
- (26).Kyburz KA; Anseth KS Three-dimensional hMSC motility within peptide-functionalized PEG-based hydrogels of varying adhesivity and crosslinking density. Acta Biomater. 2013, 9, 6381–6392. [DOI] [PMC free article] [PubMed] [Google Scholar]
- (27).McCall JD; Luoma JE; Anseth KS Covalently tethered transforming growth factor beta in PEG hydrogels promotes chondrogenic differentiation of encapsulated human mesenchymal stem cells. Drug Delivery Transl. Res 2012, 2, 305–312. [DOI] [PMC free article] [PubMed] [Google Scholar]
- (28).McCall JD; Anseth KS Thiol–ene photopolymerizations provide a facile method to encapsulate proteins and maintain their bioactivity. Biomacromolecules 2012, 13, 2410–2417. [DOI] [PMC free article] [PubMed] [Google Scholar]
- (29).Hume PS; He J; Haskins K; Anseth KS Strategies to reduce dendritic cell activation through functional biomaterial design. Biomaterials 2012, 33, 3615–3625. [DOI] [PMC free article] [PubMed] [Google Scholar]
- (30).Schultz KM; Kyburz KA; Anseth KS Measuring dynamic cell–material interactions and remodeling during 3D human mesenchymal stem cell migration in hydrogels. Proc. Natl. Acad. Sci. U.S.A 2015, 112, E3757–E3764. [DOI] [PMC free article] [PubMed] [Google Scholar]
- (31).Daviran M; Longwill SM; Casella JF; Schultz KM Rheological characterization of dynamic remodeling of the pericellular region by human mesenchymal stem cell-secreted enzymes in well-defined synthetic hydrogel scaffolds. Soft Matter 2018, 14, 3078–3089. [DOI] [PMC free article] [PubMed] [Google Scholar]
- (32).Fairbanks BD; Schwartz MP; Halevi AE; Nuttelman CR; Bowman CN; Anseth KS A versatile synthetic extracellular matrix mimic via thiol-norbornene photopolymerization. Adv. Mater 2009, 21, 5005. [DOI] [PMC free article] [PubMed] [Google Scholar]
- (33).Lauffenburger D; Aris R; Keller K Effects of cell motility and chemotaxis on microbial population growth. Biophys. J 1982, 40, 209–219. [DOI] [PMC free article] [PubMed] [Google Scholar]
- (34).Jabbarzadeh E; Abrams CF Chemotaxis and random motility in unsteady chemoattractant fields: a computational study. J. Theor. Biol 2005, 235, 221–232. [DOI] [PubMed] [Google Scholar]
- (35).Jabbarzadeh E; Abrams CF Simulations of chemotaxis and random motility in 2D random porous domains. Bull. Math. Biol 2007, 69, 747–764. [DOI] [PubMed] [Google Scholar]
- (36).Zhao Z; Watt C; Karystinou A; Roelofs AJ; McCaig CD; Gibson IR; De Bari C Directed migration of human bone marrow mesenchymal stem cells in a physiological direct current electric field. Eur. Cells Mater 2011, 22, 344–358. [DOI] [PubMed] [Google Scholar]
- (37).Tai G; Tai M; Zhao M Electrically stimulated cell migration and its contribution to wound healing. Int. J. Burns Trauma 2018, 6. DOI: 10.1186/s41038-018-0123-2 [DOI] [PMC free article] [PubMed] [Google Scholar]
- (38).Hong SH; Lee MH; Koo M-A; Seon GM; Park YJ; Kim D; Park J-C Stem cell passage affects directional migration of stem cells in electrotaxis. Stem Cell Res. 2019, 38, 101475. [DOI] [PubMed] [Google Scholar]
- (39).Sundararaghavan HG; Saunders RL; Hammer DA; Burdick JA Fiber alignment directs cell motility over chemotactic gradients. Biotechnol. Bioeng 2013, 110, 1249–1254. [DOI] [PubMed] [Google Scholar]
- (40).Cheng S-Y; Heilman S; Wasserman M; Archer S; Shuler ML; Wu M A hydrogel-based microfluidic device for the studies of directed cell migration. Lab Chip 2007, 7, 763–769. [DOI] [PubMed] [Google Scholar]
- (41).Ries C; Egea V; Karow M; Kolb H; Jochum M; Neth P MMP-2, MT1-MMP, and TIMP-2 are essential for the invasive capacity of human mesenchymal stem cells: differential regulation by inflammatory cytokines. Blood 2007, 109, 4055–4063. [DOI] [PubMed] [Google Scholar]
- (42).Raeber G; Lutolf M; Hubbell J Mechanisms of 3-D migration and matrix remodeling of fibroblasts within artificial ECMs. Acta Biomater. 2007, 3, 615–629. [DOI] [PubMed] [Google Scholar]
- (43).Mason TG; Ganesan K; van Zanten JH; Wirtz D; Kuo SC Particle tracking microrheology of complex fluids. Phys. Rev. Lett 1997, 79, 3282. [Google Scholar]
- (44).Crocker JC; Grier DG Methods of digital video microscopy for colloidal studies. J. Colloid Interface Sci 1996, 179, 298–310. [Google Scholar]
- (45).Crocker JC; Hoffman BD Multiple-particle tracking and two-point microrheology in cells. Methods Cell Biol. 2007, 83, 141–178. [DOI] [PubMed] [Google Scholar]
- (46).Daviran M; Caram HS; Schultz KM Role of cell-mediated enzymatic degradation and cytoskeletal tension on dynamic changes in the rheology of the pericellular region prior to human mesenchymal stem cell motility. ACS Biomater. Sci. Eng 2018, 4, 468–472. [DOI] [PMC free article] [PubMed] [Google Scholar]
- (47).McGlynn JA; Druggan KJ; Croland KJ; Schultz KM Human mesenchymal stem cell-engineered length scale dependent rheology of the pericellular region measured with bi-disperse multiple particle tracking microrheology. Acta Biomater. 2021, 121, 405–417. [DOI] [PMC free article] [PubMed] [Google Scholar]
- (48).Furst EM; Squires TM Microrheology; Oxford University Press, 2017. [Google Scholar]
- (49).Schoonraad SA; Trombold ML; Bryant SJ The effects of stably tethered BMP-2 on MC3T3-E1 preosteoblasts encapsulated in a PEG hydrogel. Biomacromolecules 2021, 22, 1065–1079. [DOI] [PMC free article] [PubMed] [Google Scholar]
- (50).Bowman CN; Kloxin CJ Toward an enhanced understanding and implementation of photopolymerization reactions. AIChE J. 2008, 54, 2775–2795. [Google Scholar]
- (51).Traut’s Reagent; Manual No 2610; ThermoScientific: Waltham, MA, 2012. https://www.thermofisher.com/document-connect/document-connect.html?url=https://assets.thermofisher.com/TFS-Assets%2FLSG%2Fmanuals%2FMAN0011238_Trauts_Reag_UG.pdf, Access date: January 17, 2024. [Google Scholar]
- (52).Schneider MC; Chu S; Randolph MA; Bryant SJ An in vitro and in vivo comparison of cartilage growth in chondrocyte-laden matrix metalloproteinase-sensitive poly (ethylene glycol) hydrogels with localized transforming growth factor 3. Acta Biomater. 2019, 93, 97–110. [DOI] [PMC free article] [PubMed] [Google Scholar]
- (53).Schoonraad SA; Jaimes AA; Singh AJ; Croland KJ; Bryant SJ Osteogenic effects of covalently tethered rhBMP-2 and rhBMP-9 in an MMP-sensitive PEG hydrogel nanocomposite. Acta Biomater. 2023, 170, 53–67. [DOI] [PMC free article] [PubMed] [Google Scholar]
- (54).Sridhar BV; Doyle NR; Randolph MA; Anseth KS Covalently tethered TGF- 1 with encapsulated chondrocytes in a PEG hydrogel system enhances extracellular matrix production. J. Biomed. Mater. Res., Part A 2014, 102, 4464–4472. [DOI] [PMC free article] [PubMed] [Google Scholar]
- (55).Madersbacher S; Berger P Double wavelength measurement of 3, 3′, 5, 5′-tetramethylbenzidine (TMB) provides a three-fold enhancement of the ELISA measuring range. J. Immunol. Methods 1991, 138, 121–124. [DOI] [PubMed] [Google Scholar]
- (56).Schultz KM; Anseth KS Monitoring degradation of matrix metalloproteinases-cleavable PEG hydrogels via multiple particle tracking microrheology. Soft Matter 2013, 9, 1570–1579. [Google Scholar]
- (57).McGlynn JA; Wu N; Schultz KM Multiple particle tracking microrheological characterization: Fundamentals, emerging techniques and applications. J. Appl. Phys 2020, 127, 201101. [Google Scholar]
- (58).Ramirez A; Merwitz B; Lee H; Vaughan E; Maisel K Multiple particle tracking (MPT) using PEGylated nanoparticles reveals heterogeneity within murine lymph nodes and between lymph nodes at different locations. Biomater. Sci 2022, 10, 6992–7003. [DOI] [PMC free article] [PubMed] [Google Scholar]
- (59).Joyner K; Yang S; Duncan GA Microrheology for biomaterial design. APL Bioeng. 2020, 4, 041508. [DOI] [PMC free article] [PubMed] [Google Scholar]
- (60).Mason TG; Weitz DA Optical measurements of frequency-dependent linear viscoelastic moduli of complex fluids. Phys. Rev. Lett 1995, 74, 1250. [DOI] [PubMed] [Google Scholar]
- (61).Waigh TA Microrheology of complex fluids. Rep. Prog. Phys 2005, 68, 685. [DOI] [PubMed] [Google Scholar]
- (62).Squires TM; Mason TG Fluid mechanics of microrheology. Annu. Rev. Fluid Mech 2010, 42, 413–438. [Google Scholar]
- (63).Savin T; Doyle PS Static and dynamic errors in particle tracking microrheology. Biophys. J 2005, 88, 623–638. [DOI] [PMC free article] [PubMed] [Google Scholar]
- (64).Adolf D; Martin JE Time-cure superposition during crosslinking. Macromolecules 1990, 23, 3700–3704. [Google Scholar]
- (65).Winter HH; Chambon F Analysis of linear viscoelasticity of a crosslinking polymer at the gel point. J. Rheol 1986, 30, 367–382. [Google Scholar]
- (66).Chambon F; Winter HH Linear viscoelasticity at the gel point of a crosslinking PDMS with imbalanced stoichiometry. J. Rheol 1987, 31, 683–697. [Google Scholar]
- (67).Mours M; Winter HH Relaxation patterns of nearly critical gels. Macromolecules 1996, 29, 7221–7229. [Google Scholar]
- (68).Winter H Permanent and Transient Networks; Springer, 1987; pp 104–110. [Google Scholar]
- (69).Larsen TH; Furst EM Microrheology of the liquid-solid transition during gelation. Phys. Rev. Lett 2008, 100, 146001. [DOI] [PubMed] [Google Scholar]
- (70).Larsen T; Schultz K; Furst EM Hydrogel microrheology near the liquid-solid transition. Korea-Aust. Rheol. J 2008, 20, 165–173. [Google Scholar]
- (71).Corrigan A; Donald A Particle tracking microrheology of gel-forming amyloid fibril networks. Eur. Phys. J. E: Soft Matter Biol. Phys 2009, 28, 457–462. [DOI] [PubMed] [Google Scholar]
- (72).Corrigan AM; Donald AM Passive microrheology of solvent-induced fibrillar protein networks. Langmuir 2009, 25, 8599–8605. [DOI] [PubMed] [Google Scholar]
- (73).Schultz KM; Furst EM Microrheology of biomaterial hydrogelators. Soft Matter 2012, 8, 6198–6205. [Google Scholar]
- (74).Desai S; Carberry BJ; Anseth KS; Schultz KM Characterizing rheological properties and microstructure of thioester networks during degradation. Soft Matter 2023, 19, 7429–7442. [DOI] [PMC free article] [PubMed] [Google Scholar]
- (75).Live/Dead Fixable Dead Cell Stain Kits. Invitrogen, 2016, Rev. 0. [Google Scholar]
- (76).Barrientos S; Stojadinovic O; Golinko MS; Brem H; Tomic-Canic M Growth factors and cytokines in wound healing. Wound Repair Regen. 2008, 16, 585–601. [DOI] [PubMed] [Google Scholar]
- (77).Fu X; Liu G; Halim A; Ju Y; Luo Q; Song G Mesenchymal stem cell migration and tissue repair. Cells 2019, 8, 784. [DOI] [PMC free article] [PubMed] [Google Scholar]
- (78).Sohni A; Verfaillie CM Mesenchymal stem cells migration homing and tracking. Stem Cells Int. 2013, 2013, 130763. [DOI] [PMC free article] [PubMed] [Google Scholar]
- (79).Mazzeo MS; Chai T; Daviran M; Schultz KM Characterization of the kinetics and mechanism of degradation of human mesenchymal stem cell-laden poly (ethylene glycol) hydrogels. ACS Appl. Bio Mater 2019, 2, 81–92. [DOI] [PMC free article] [PubMed] [Google Scholar]
- (80).Alkhouli N; Mansfield J; Green E; Bell J; Knight B; Liversedge N; Tham JC; Welbourn R; Shore AC; Kos K; et al. The mechanical properties of human adipose tissues and their relationships to the structure and composition of the extracellular matrix. American Journal of Physiology-Endocrinology and Metabolism 2013, 305, E1427–E1435. [DOI] [PubMed] [Google Scholar]
- (81).Larson RG The Structure and Rheology of Complex Fluids; OUP USA, 1999. [Google Scholar]
- (82).Winter HH Can the gel point of a cross-linking polymer be detected by the G′–G′ crossover? Polym. Eng. Sci 1987, 27, 1698–1702. [Google Scholar]
- (83).Scanlan JC; Winter HH Composition dependence of the viscoelasticity of end-linked poly (dimethylsiloxane) at the gel point. Macromolecules 1991, 24, 47–54. [Google Scholar]
- (84).Hess W; Vilgis TA; Winter HH Dynamical critical behavior during chemical gelation and vulcanization. Macromolecules 1988, 21, 2536–2542. [Google Scholar]
- (85).Muthukumar M Screening effect on viscoelasticity near the gel point. Macromolecules 1989, 22, 4656–4658. [Google Scholar]
- (86).West JL; Hubbell JA Polymeric biomaterials with degradation sites for proteases involved in cell migration. Macromolecules 1999, 32, 241–244. [Google Scholar]
- (87).Raeber G; Lutolf M; Hubbell J Molecularly engineered PEG hydrogels: a novel model system for proteolytically mediated cell migration. Biophys. J 2005, 89, 1374–1388. [DOI] [PMC free article] [PubMed] [Google Scholar]
- (88).Benton JA; Fairbanks BD; Anseth KS Characterization of valvular interstitial cell function in three dimensional matrix metalloproteinase degradable PEG hydrogels. Biomaterials 2009, 30, 6593–6603. [DOI] [PMC free article] [PubMed] [Google Scholar]
- (89).Yamada KM; Sixt M Mechanisms of 3D cell migration. Nat. Rev. Mol. Cell Biol 2019, 20, 738–752. [DOI] [PubMed] [Google Scholar]
- (90).Daviran M; Catalano J; Schultz KM Determining how human mesenchymal stem cells change their degradation strategy in response to microenvironmental stiffness. Biomacromolecules 2020, 21, 3056–3068. [DOI] [PMC free article] [PubMed] [Google Scholar]
- (91).Friedl P; Wolf K Proteolytic interstitial cell migration: a five-step process. Cancer Metastasis Rev. 2009, 28, 129–135. [DOI] [PubMed] [Google Scholar]
- (92).Abercrombie M; Heaysman JE; Pegrum SM The locomotion of fibroblasts in culture: III. Movements of particles on the dorsal surface of the leading lamella. Exp. Cell Res 1970, 62, 389–398. [DOI] [PubMed] [Google Scholar]
- (93).Barks JL; McQuillan JJ; Iademarco MF TNF-alpha and IL-4 synergistically increase vascular cell adhesion molecule-1 expression in cultured vascular smooth muscle cells. J. Immunol 1997, 159, 4532–4538. [PubMed] [Google Scholar]
- (94).Ignotz RA; Massagué J Cell adhesion protein receptors as targets for transforming growth factor-β action. Cell 1987, 51, 189–197. [DOI] [PubMed] [Google Scholar]
- (95).Huang W; Anvari B; Torres JH; LeBaron RG; Athanasiou KA Temporal effects of cell adhesion on mechanical characteristics of the single chondrocyte. J. Orthop. Res 2003, 21, 88–95. [DOI] [PubMed] [Google Scholar]
- (96).Daviran M; Schultz KM Characterizing the dynamic rheology in the pericellular region by human mesenchymal stem cell re-engineering in PEG-peptide hydrogel scaffolds. Rheol. Acta 2019, 58, 421–437. [DOI] [PMC free article] [PubMed] [Google Scholar]
Associated Data
This section collects any data citations, data availability statements, or supplementary materials included in this article.