

Abstract
Despite optimal cognitive function being essential for performance, there is a lack of research on the effectiveness of combined cooling interventions on team sport athlete's cognitive function when exercising in the heat. In a randomised, crossover design, 12 unacclimatised men (age: 22.3 ± 3.0 years, body mass: 73.4 ± 5.1 kg, height: 181.0 ± 5.3 cm and max: 51.2 ± 9.5 mL/kg/min) participated in a control (CON) and combined cooling trial (ice slurry and ice collar; COOL). A battery of cognitive tests were completed prior to, during (at half‐time) and following a 90‐min intermittent running protocol in the heat (33°C, 50% relative humidity (RH)). Perceptual and physiological measures were taken throughout the protocol. In CON, response times were quicker on the Stroop task complex level (p = 0.002) and the visual search test complex level at full‐time (p = 0.014) compared to COOL. During COOL, response times were quicker at half‐time on the Stroop task complex level (p = 0.024) compared to CON. Lower rectal temperatures were seen during COOL (CON: 37.44 ± 0.65°C and COOL: 37.28 ± 0.68°C) as well as lower skin, neck and forehead temperatures (main effect of trial, all p < 0.05). Lower ratings of thermal sensation and perceived exertion and enhanced thermal comfort were recorded during COOL (main effect of trial, all p < 0.05). Whilst minimal differences in cognitive function were found when using the combined cooling intervention, the findings highlight a practical and effective strategy to improving many physiological and perceptual responses to intermittent exercise in the heat.
Keywords: football, ice slurry, neck cooling, soccer, team sports
Highlights
Many studies have investigated the use of a combined cooling strategy on endurance exercise in the heat and found positive benefits on physiological, perceptual and cognitive responses to the intervention; however, there is a lack of research on intermittent exercise.
The combined cooling intervention, consisting of an ice slurry and ice collar, was successful at lowering rectal, neck, forehead and skin temperatures as well as perceptual ratings of thermal sensation, comfort and perceived exertion.
However, the combined cooling strategy did not elicit any consistent findings regarding cognitive function.
1. INTRODUCTION
Team sports can be characterised by intense acceleration and deceleration actions (Harper et al., 2019) as well as its intermittent nature due to the intensity of the activity differing from standing still to sprinting at any given time during a match (Bangsbo, 2000). Additionally, aerobic fitness and speed are pivotal to team sports as previous research has highlighted that an elite, outfield football player covers between 10 and 13 km during a match and sprint speeds can reach peak values of 32 km.h−1 (Bangsbo & Mohr, 2005; Bangsbo et al., 2006). However, a commonality present in football, for example, is that individuals experience temporary fatigue whilst playing, which results in lower amounts of sprinting, high intensity running and distance covered, particularly in the second half (Bangsbo et al., 1991; Mohr et al., 2003; Reilly & Thomas, 1979). These implications for performance are also coupled with increases in heart rate (HR), core temperature and rate of oxygen uptake (Ekblom, 1986; Krustrup, Mohr & Bangsbo, 2005; Reilly & Thomas, 1979). Whilst it is important to recognise the physiological responses and physical demands of team sport, the cognitive demands must be understood also and how these may be related.
Cognitive function can be defined as brain‐mediated processes that allow individuals to perceive, evaluate, store and utilise information from both external (i.e., environment) and internal sources (i.e., memory) (Schmitt et al., 2005). There are six main domains, which are executive function, memory, attention, perception, psychomotor function and language (Schmitt et al., 2005). These play a vital role in sport and are essential for optimal performance, particularly in an intermittent, team sport where perceptual–cognitive demands are high (Casanova et al., 2013; Sarmento et al., 2018). Furthermore, executive functions (i.e., working memory) have been shown to be associated with football‐specific motor skills (i.e., dribbling and ball control; Scharfen & Memmert, 2019). Differences have also been found between elite and non‐elite players (Huijgen et al., 2015), which underpins the importance of these cognitive abilities for success and the need to understand the factors that affect cognitive function in team sport athletes.
Many major sporting competitions have taken place in hot environments, for example, the 2021 Tokyo Olympics, which pose a variety of challenges and risks for athletes. These include the potential negative effects of hot environmental conditions on cognitive function and subsequently, decision‐making skills that are critical in sport (Helper, 2015). When exercising in the heat, increased perceived exertion as well as elevated skin and core temperatures, which is accompanied by augmented skin blood flow, are prominent for athletes (Périard et al., 2011). Consequently, at these higher core temperatures, it has been suggested that the heat strain experienced overloads the ability to deal with both the heat and the cognitive task due to heat‐strain induced depletion of attentional resources (Hancock, 1986; Schmit et al., 2017). More specifically, complex cognitive tasks (i.e., working memory and executive function) are impaired when core temperatures of ∼38.7°C reached, as they are more vulnerable to heat stress and require greater neural resources in comparison to simple tasks (i.e., match to sample visual search test) (Gaoua et al., 2011; Racinais et al., 2008; Taylor et al., 2016). This highlights a problem for team sport athletes in the heat as these sports, for example, football, involve not only high physical demands but also high levels of cognitive functioning for optimal performance including working memory, attention and perception (Furley & Memmert, 2010). Therefore, it is imperative that not only are the effects of performing these sports in the heat on athlete's cognitive function investigated but also practical strategies to maintain cognitive performance under heat strain.
In the limited existing research to date, Donnan et al. (2021) explored the effects of heat exposure on cognitive performance during prolonged (80‐min) intermittent cycling in the heat. No differences were seen on the numerical vigilance task (simple) regardless of the environmental conditions (32°C, 50% relative humidity (RH) vs. 18°C. 50% RH), whilst incongruent Stroop task accuracy (used as an indicator of executive function, complex) was impaired when exercising irrespective of the heat. However, participants' core temperatures (38.40°C) did not reach the same level that would typically be seen by athletes exercising in the heat (∼39°C; Girard et al., 2015). Therefore, an intermittent running protocol may be more beneficial to reflect the demands on team sport (i.e., football) and produce similar levels of metabolic heat production to that seen during competition (Donnan et al., 2021). Despite the limited research using intermittent running protocols, MacLeod et al. (2018) implemented a shorter 50‐min intermittent running protocol to explore the effects of heat (33.3°C, 59% RH) on cognitive performance in hockey players. They found enhanced response times and accuracy on the visual search test (complex level) and Sternberg paradigm (simple and complex levels). This is in line with previous research that has found improvements in cognitive function, including working memory tasks and psychomotor vigilance performances, following initial elevations in core temperature to ∼38.2°C (Lee et al., 2014; Simmons et al., 2008). Whilst the findings and mechanisms responsible for the effect of heat strain during exercise on cognition remain somewhat intertwined and unclear in the literature (Schmit et al., 2017), the duration of exercise is a factor that has been shown to influence the cognitive response. Prolonged activity (>60‐min) has been shown to be detrimental to information processing and memory function (Tomporowski, 2003); therefore, it is important that exercise protocols reflect the length of exercise that competitive athletes will participate in (e.g., 90 min for footballers).
The potential negative impacts of prolonged exercise in hot conditions for cognitive performance have led researchers to investigate strategies to help maintain performance in such conditions. Cooling is used to slow the accumulation of heat and in turn, attempts to limit any increases in core temperature (Schmit et al., 2017), which is known to lead to cognitive performance decrements (Périard et al., 2011). Cooling interventions involve both external strategies (e.g., neck collars) and internal strategies (e.g., ice slurry ingestion). Neck collars, which are effective likely because of the high allethesial thermosensitivity of the neck region (Cotter & Taylor, 2005), have been successful at increasing time to volitional exhaustion, whilst running in the heat and enhance cognitive performance in tasks of higher complexity such as working memory (Lee et al., 2014; Tyler & Sunderland, 2011). Additionally, using ice slurries during exercise has been shown to lower head temperature, which helps prevent the deterioration of cognitive function in the heat (Onitsuka et al., 2020), and reduce pre‐exercise core and forehead temperature, which led to improved decision‐making following 90 min of continuous running at 65% of peak in the heat (35°C, 53.1% RH; Saldaris et al., 2019). This further highlights the potential benefit ice slurry ingestion may have on cognitive function when exercising in the heat due to its ability to lower brain temperature.
A small number of studies have explored combined cooling strategies to determine if they may synergistically enhance cognitive function and performance compared to a single cooling intervention. For instance, Mazalan et al. (2022) combined head cooling and an ice slurry whilst in a hot environment (35°C, 68.2% RH), which saw improvements in working memory on the serial seven test during 60 min of running compared to head cooling alone and a control. This finding was attributed to lower core and forehead temperatures as well as a reduced thermal sensation. Additionally, the close proximity of the head to the thermoregulatory centre located in the preoptic and anterior regions of the hypothalamus (Haymaker, 1969) as well as thermoreceptors located in the stomach and gastrointestinal region (Morris et al., 2014) may have potentially played a role in these findings. Moreover, during a 15 km cycling time trial in the heat (30°C, 50% RH), Levels et al. (2013) implemented a combined cooling strategy involving scalp cooling and an ice slurry and found lower skin and rectal temperatures as well as a lowered thermal sensation. These studies highlight the benefits of a combined cooling strategy on cognitive function during endurance exercise in the heat. However, no research to date has been conducted to examine the effects of combined cooling interventions on cognitive function during intermittent exercise, which will be beneficial for team sport players in the heat.
Therefore, the aim of the current study was to investigate if a combined cooling intervention affects cognitive function in game players during an intermittent‐simulated football match in the heat. It was hypothesised that the combined cooling intervention implemented would attenuate the negative effects of intermittent exercise in the heat on cognitive function, specifically complex tasks such as executive function. Additionally, it was hypothesised that physiological and perceptual responses to exercising in the heat would be improved when the combined cooling intervention was implemented.
2. MATERIALS AND METHODS
2.1. Participants
Twelve unacclimatised, male team‐sport players (age: 22.3 ± 3.0 years, body mass: 73.4 ± 5.1 kg, height: 181.0 ± 5.3 cm and max: 51.2 ± 9.5 mL/kg/min) who participated in a range of team sports, with the most common being football, voluntarily participated in the study after providing informed consent and completing a health screen questionnaire to ensure no health conditions were present that may be exacerbated by participating. Prior to taking part, participants received written and verbal information and were able to ask questions regarding the study. The current study was granted ethical approval from Nottingham Trent University's ethical advisory committee.
2.2. Study design
The current study followed a randomised, within‐subject design with all participants completing a preliminary visit involving a speed lactate and max test, a familiarisation session, which preceded the first experimental trial by ∼7‐day, followed by a combined cooling intervention trial and a control trial. The familiarisation session and two fully counter‐balanced experimental trials were performed in a hot environment (33°C, 50% RH), informed by recent major sporting events (i.e., Tokyo Olympics). Experimental trials were separated by 7‐day and completed at the same time of the day (9 a.m. to 1 p.m.) to eliminate the effect of circadian rhythm (Van Dongen & Dinges, 2005). Prior to arriving at the laboratory, participants were asked to arrive 2‐h post‐prandial, consume 500 mL of water and refrain from drinking caffeine the morning of the main trials. Strenuous exercise and alcohol were also avoided 24‐h prior to each main trial. Diet was replicated in the 24‐h prior to each main trial.
2.3. Speed lactate and max test
To calculate the running speeds for the intermittent running protocol, the participants completed a speed lactate incremental running test (modified from Weltman et al., 1990). Participant's lactate threshold was indicated when blood lactate increased by 1 mmol/L from the previous measurement or reached 4 mmol/L. When this occurred, the test was terminated and the speed at which this was seen was used for the constant speed for the max test. Following a 10‐min rest, the participants completed a running test until exhaustion at the previously determined constant speed. The gradient started at 1% and subsequently increased by 1% every minute. When the participant could only continue for 1 more minute, expired air was collected via a Douglas bag as well as blood lactate, HR and rating of perceived exertion (RPE) collected at the end of the test. The expired air samples from both the speed lactate stages and max test were analysed to calculate O2 during each stage of the first phase of testing and max from the second phase of testing. With regards to max values, to ensure a maximum was achieved, the following criteria were used; a max lactate of 8 mmol/L or higher, age predicted max HR and an RPE of 18 or above.
2.4. Familiarisation
The familiarisation included the same protocol as the main trials (Figure 1) (including the ice collar and ice slurry ingestion) up until the half‐time period (130 min total); however, participants completed a final full battery of cognitive tests instead of a short battery to minimise learning effects (Cooper, Bandelow, Morris & Nevill, 2015b).
FIGURE 1.
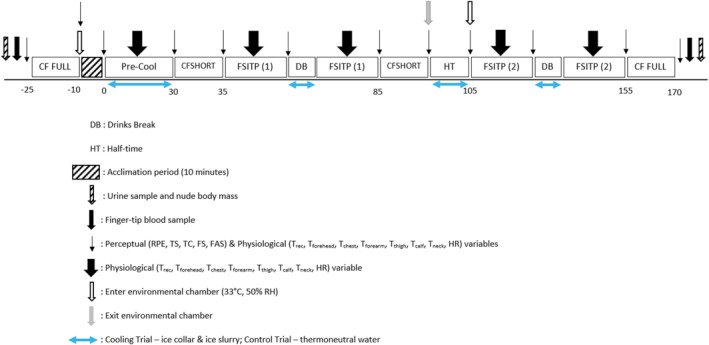
Schematic of the main trial protocol. Key: CF Full, full battery of cognitive function tests; CF Short–short battery of cognitive function tests; FSITP, intermittent running protocol; DB–drink break; HT, half‐time; RPE, rate of perceived exertion; TS, thermal sensation; TC, thermal comfort; FS, feeling scale; FAS, felt arousal scale; Trec, rectal temperature; Tforehead, forehead temperature; Tchest, chest temperature; Tforearm, forearm temperature; Tthigh, thigh temperature; Tcalf, calf temperature; Tneck, neck temperature and HR, heart rate.
2.5. Main trials
Upon arrival, participant's nude body mass was recorded (WLK 150 Warrior Washdown Scales, Adam Equipment), a urine sample was provided to measure urine osmolality and a rectal probe for core temperature measurements was self‐inserted. Blood glucose and lactate concentrations were also measured via a capillary blood sample. Baseline physiological and perceptual measures and a full battery of cognitive tests were completed in the laboratory (CON: 16.9 ± 2.1°C, 47.7 ± 6.6%; COOL: 18.0 ± 2.4°C, 45.7 ± 6.6%) prior to an acclimation period (10‐min) and a pre‐cool period (30‐min) completed in the Environmental Chamber (33°C, 50% RH). Physiological and perceptual measures as well as short and full batteries of cognitive function tests were carried out at various points during the main trials (Figure 1). The participants were required to complete an intermittent running protocol (adapted from Greig et al., 2006), which induced similar physiological strain to a 90‐min football match. At the end of the main trials, participant's nude body mass was firstly recorded, then a urine sample was given and finally, blood glucose and lactate concentrations were measured.
2.6. Intermittent running protocol
An intermittent running protocol informed by a 90‐min football match was implemented, which consisted of four periods of intermittent activity lasting 22.5‐min each. Participants completed a 15‐min half‐time period outside of the environmental chamber, which preceded a short battery of cognitive tests participants completed seated in the chamber. Participants also completed a seated drink break in the chamber halfway through each half of exercise lasting 4‐min (Figure 1). The intermittent running protocol consisted of standing, walking (4.0 km/h), jogging (8 km/h), low‐speed running (85% of max), high‐speed running (100% of max), fast running (21 km/h) and sprinting (25 km/h), based on the variable speeds calculated from the speed lactate and max test, to emulate the physical demands of a football match. The protocol was adapted from Greig et al. (2006) as low‐ and high‐speed running was calculated from participants' max, whereas Greig et al. (2006) used absolute speeds.
2.7. Combined cooling method
The combined cooling trial involved ice slurry ingestion and an ice collar as positive benefits have been shown individually (Lee et al., 2014; Saldaris et al., 2019; Tyler & Sunderland, 2011). The ice slurry consisted of 50% ice and 50% water weighing 7.5 g per kilogramme of body mass during the pre‐cool period, 3.75 g per kilogramme of body mass during half‐time and 1 g per kilogramme of body mass during the drink breaks. During the pre‐cool period, the overall weight of the ice slurry was divided into thirds and given in 10‐min intervals. The participants were given an ice collar, which consisted of three cups of crushed ice being placed in a cotton sheet and secured with cable ties, during pre‐cool, half‐time and drink breaks. In the control trial, participants were not given a neck collar and received thermoneutral (37°C) water equalling the amounts discussed above instead of the ice slurry during the pre‐cool, half‐time and drink breaks.
2.8. Measurements
2.8.1. Cognitive function tests
The full battery of cognitive function tests involved all cognitive tests explained below completed in the same order which took place prior to the acclimation period and following the intermittent running protocol (Figure 1). Whereas, the short battery of cognitive function tests consisted of the complex level of the visual search test, complex level of the Stroop task and 3‐min of the Rapid visual information processing (RVIP) test. Similar to the full battery, all tests were completed in the same order and took place following the pre‐cool session and prior to the half‐time break. All tests were administered on a laptop computer (Lenovo ThinkPad, Lenovo PC HK Limited) using a custom‐made software and participants wore ear defenders to minimise external distractions. Prior to each test, the participants were presented with three to six practice stimuli to re‐familiarise them with the test and negate potential learning effects (Malcolm et al., 2018). Feedback was provided on the accuracy of the response for the practice stimuli; and data for these stimuli were discarded. No feedback was provided once the test started. The variables of interest for each of the cognitive function tests were response times of correct responses, calculated as the time between stimuli presentation and the response, and the percentage of correct responses (response accuracy). The minimum and maximum cut offs for response time for each test were as follows: visual search min: 100‐ms; visual search max: 1500‐ms (simple) and 3000‐ms (complex); Stroop min: 100‐ms; Stroop max: 1500‐ms (simple) and 3000‐ms (complex); Sternberg min: 100 ms; Sternberg max: 2000‐ms (one‐item level), 3000‐ms (three‐item level) and 4000‐ms (five‐item level); RVIP min: 200 ms and RVIP max: 1500 ms. These were based on excluding unreasonably fast (anticipatory) responses and undue slow responses (Malcolm et al., 2018).
2.8.2. Visual search
The visual search test measured participant's perception and visual processing, which has been used in previous research (Cooper et al., 2015a). The test consisted of a simple and complex level, both containing 21 stimuli. During the simple level, participants were required to respond as quickly as possible when a green, bold outlined triangle appeared on the black screen by pressing the space bar. The complex level involved participants responding as quickly as possible to a triangle shape comprised of a number of dots once it appeared on the screen. The screen was covered with green dots, which made up the background, and were redrawn every 250‐ms to induce a flickering effect.
2.8.3. Stroop task
To measure participant's executive function and ability to suppress automated responses (Stroop, 1935), the second cognitive test completed was the Stroop task, involving a congruent and an incongruent level (Malcolm et al., 2018). Throughout the congruent level, which involved 20 stimuli, a word written in white ink appeared in the centre of a black screen and the participants were instructed to choose the word on the left or right of the screen, using the arrow keys, which matched the central word. Throughout the incongruent level, which involved 40 stimuli, the participants were instructed to choose the word on the left or right of the screen that matched the ink colour the central word was written in rather than the word itself.
2.8.4. Sternberg paradigm
The Sternberg paradigm was used to measure participant's working memory (Sternberg, 1966) and involved three levels–one item with 16 stimuli, three items with 32 stimuli and five items with 32 stimuli. During each level, a number/letter was presented on the screen and participants were required to decide if the letter was a target or a distractor from the initial number/letters they were shown at the beginning of each level. If the letter was a target, they pressed the right arrow, and if the letter was a distractor, they pressed the left arrow. On the number level (one item), the target was always ‘3’; whereas, on the three and five item levels, the letters were randomly generated.
2.8.5. Rapid visual information processing
The RVIP test measured the participant's sustained attention (Hilti et al., 2010). At baseline and post‐exercise, the test lasted 5‐min and consisted of numbers from two to nine appearing on the screen, one at a time at 600‐ms intervals with eight target sequences per minute totalling 40 stimuli. At post pre‐cool and half‐time, a shortened version of RVIP was used and lasted 3‐min with a total of 24 stimuli. The participants were instructed to press the spacebar when a sequence of three odd or even consecutive numbers appeared on the screen (e.g., 2–8–4 and 3–9–5). Correct responses could be registered, whilst the final digit of a target sequence was presented and the subsequent 1500‐ms.
2.8.6. Physiological measures
All physiological measures were taken at various timepoints throughout the main trials (taken a total of 17 times), which are outlined in Figure 1. Core temperature was recorded using a self‐inserted rectal probe (MEAS 4400 Series Temperature Probe, Measurement Specialities Inc), placed 10 cm past the anal sphincter. To measure core temperature, a core temperature logger was used (4600 Thermometer, Measurement Specialities Inc). Forehead and neck temperatures were measured from the mid‐point of the forehead and the neck (RS 51 Digital Thermometer, RS Pro, RS Components LTD). Mean weighted skin temperature was recorded using thermistors (Squirrel Data Logger, Grant 2020 Series, Grant Instruments, Cambridgeshire, UK) placed at four sites around the body (chest, forearm, thigh and calf) and calculated using the formula of Ramanathan (1964). HR was measured using a watch (Forerunner 945) and chest‐worn HR belt (HRM‐Pro). Blood glucose and lactate concentrations were taken at the beginning and end of the trials via a finger prick blood sample and analysed using a Biosen blood analyser (EKF Diagnostics). A urine sample was collected at the beginning and end of the trials and analysed using a pocket refractometer (Atago CO LTD) to identify differences in urine specific gravity.
2.8.7. Perceptual measures
All perceptual measures were taken at various timepoints throughout the main trials (taken a total of 12 times), which are outlined in Figure 1. Ratings of feeling (FS) were measured on a scale of −5 (very bad) to +5 (very good) (Hardy & Rejeski, 1989). Felt arousal (FAS) was measured using a scale from 1 (low activation) to 6 (high activation) (Svebak & Murgatroyd, 1985). Validity of both of these scales has been proven (Brito et al., 2022; Hardy & Rejeski, 1989). Thermal sensation (TS), which has been shown to be a valid measure of perceived heat stress (Casa et al., 2007), was measured on a scale from 0 (unbearably cold) to 8 (unbearably hot) (Toner et al., 1986) and ratings of thermal comfort (TC) were measured on a previously validated scale from −3 (much too cool) to +3 (much too warm) (Bedford, 1936, 1950). RPE, which has been shown to be valid for intermittent exercise (Pereira et al., 2011), was measured on a scale from 6 (very, very light) to 20 (very, very hard) (Morgan & Borg, 1976).
2.9. Statistical analyses
All physiological and perceptual data were analysed using the Statistical Packages for Social Sciences (SPSS, version 26.0) using a two‐way repeated measures ANOVA (trial × time). Effect size (Cohen's d) was calculated for all physiological and perceptual measures, as well as cognitive function variables, using trial pairings. The following ranges were used to interpret the effect size: <0.2 = trivial effect, 0.2–<0.5 = small effect, 0.5–<0.8 = medium effect and ≥0.8 = large effect (Cohen, 1992). All cognitive data from the full and short batteries were analysed using the software R (www.R‐project.org) using mixed effect models. Separate analyses were performed for each test and test level, due to the differing levels of cognitive processing required (Cooper et al., 2016). All analyses were performed using repeated measures (trial × time interactions). Response time analyses were conducted using the lme package, whilst accuracy analyses were conducted using the glmer package (with a binomial outcome due to the binomial nature of data). To allow for direct comparisons, the first 3 min of the full version of RVIP from baseline and post‐exercise have been included and analyses has been conducted with the shortened version of RVIP at post pre‐cool and half‐time. For all analyses, significance was accepted at the p < 0.05 level. All data are presented as mean ± standard deviation.
3. RESULTS
3.1. Cognitive function
3.1.1. Visual search
Following a 2 (trial) × 2 (timepoints; baseline and post‐exercise) repeated measures ANOVA, no changes were seen in response times on the simple level of the visual search test between the control and cooling trials (main effect of trial, t (1025) = −0.011 and p = 0.992; Table 1) nor did the pattern of change differ (trial × time interaction, t (1025) = 0.663 and p = 0.508).
TABLE 1.
Response times (ms) and accuracy (%) for the levels of the cognitive function tests used at baseline and post‐exercise (full battery of the cognitive function tests).
| Test | Variable | Test level | Control trial | Cooling trial | Trial effect | Interaction effect | Effect size | ||
|---|---|---|---|---|---|---|---|---|---|
| Baseline | Post‐Exercise | Baseline | Post‐Exercise | ||||||
| Visual search | Response time (ms) | Simple | 360 ± 32 | 364 ± 41 | 359 ± 38 | 356 ± 44 | p = 0.992 | p = 0.508 | 0.08 trivial |
| Accuracy (%) | 98.6 ± 2.1 | 99.2 ± 1.8 | 98.7 ± 2.1 | 98.9 ± 2.1 | p = 0.944 | p = 0.695 | 0.05 trivial | ||
| Stroop task | Response time (ms) | Simple | 692 ± 105 | 712 ± 154 | 691 ± 70 | 718 ± 197 | p = 0.968 | p = 0.894 | 0.02 trivial |
| Accuracy (%) | 97.0 ± 3.7 | 96.4 ± 5.7 | 97.6 ± 3.5 | 97.0 ± 4.8 | p = 0.733 | p = 0.965 | 0.14 trivial | ||
| Sternberg paradigm | Response time (ms) | 1‐Item level | 440 ± 51 | 428 ± 97 | 461 ± 111 | 419 ± 68 | p = 0.147 | p = 0.190 | 0.07 trivial |
| 3‐Item level | 534 ± 91 | 564 ± 111 | 551 ± 89 | 561 ± 154 | p = 0.074 | p = 0.062 | 0.06 trivial | ||
| 5‐Item level | 662 ± 129 | 711 ± 180 | 680 ± 121 | 706 ± 202 | p = 0.239 | p = 0.195 | 0.04 trivial | ||
| Accuracy (%) | 1‐Item level | 100 ± 0 | 98.4 ± 2.8 | 97.9 ± 3.1 | 97.4 ± 4.2 | p = 0.997 | p = 0.997 | 0.54 medium | |
| 3‐Item level | 98.7 ± 2.1 | 96.4 ± 4.2 | 97.1 ± 2.5 | 95.3 ± 3.7 | p = 0.137 | p = 0.405 | 0.44 small | ||
| 5‐Item level | 98.7 ± 2.5 | 96.9 ± 3.3 | 97.9 ± 3.4 | 94.0 ± 8.3 | p = 0.389 | p = 0.741 | 0.39 small | ||
| RVIP (full version–5 min) | Response time (ms) | 511 ± 80 | 509 ± 76 | 552 ± 100 | 509 ± 81 | p = 0.207 | p = 0.347 | 0.25 small | |
| Accuracy (%) | 57.0 ± 20.3 | 58.0 ± 21.6 | 51.8 ± 18.7 | 51.4 ± 19.6 | p = 0.654 | p = 0.209 | 0.29 small | ||
Note: All data reported as mean ± SD.
Additionally, on the complex level of the visual search test, a 2 (trial) × 4 (timepoints; baseline, post pre‐cool, half‐time and post‐exercise) repeated measures ANOVA revealed that response times were not different between the trials (main effect of trial, t (2005) = 0.546 and p = 0.585) and the pattern of change in response times was unaffected following the pre‐cool and at half‐time (trial × time interactions, t (2005) = 0.846 and p = 0.398; t (2005) = −0.659 and p = 0.510, respectively; Table 2). However, when compared to baseline, response times were quicker post‐exercise on the control trial, whereas they remained similar in the cooling trial (trial × time interaction, t (2005) = −2.472 and p = 0.014).
TABLE 2.
Response times (ms) and accuracy (%) for the levels of cognitive function tests used at baseline, post‐pre‐cool, half‐time and post exercise.
| Test | Variable | Test level | Control trial | Cooling trial | Trial effect | Interaction effect | Effect size | ||||||
|---|---|---|---|---|---|---|---|---|---|---|---|---|---|
| Baseline | Post Pre‐Cool | Half‐Time | Post‐Exercise | Baseline | Post Pre‐Cool | Half‐Time | Post‐Exercise | ||||||
| Visual search | Response time (ms) | Complex | 1234 ± 208 | 1228 ± 295 | 1230 ± 199 | 1131 ± 204 | 1245 ± 255 | 1147 ± 151 | 1235 ± 183 | 1241 ± 216 | p = 0.585 | Post pre‐cool: p = 0.398 | 0.05 trivial |
| Half‐time: p = 0.510 | |||||||||||||
| Post‐exercise: p = 0.014* | |||||||||||||
| Accuracy (%) | 99.2 ± 1.8 | 99.2 ± 1.8 | 98.9 ± 2.7 | 97.2 ± 4.8 | 99.2 ± 1.8 | 100 ± 0 | 98.9 ± 2.1 | 98.5 ± 2.2 | p = 0.936 | Post pre‐cool: p = 0.857 | 0.27 small | ||
| Half‐time: p = 0.951 | |||||||||||||
| Post‐exercise: p = 0.603 | |||||||||||||
| Stroop task | Response time (ms) | Complex | 873 ± 176 | 902 ± 252 | 877 ± 180 | 867 ± 220 | 939 ± 221 | 959 ± 314 | 885 ± 232 | 924 ± 312 | p = 0.002* | Post pre‐cool: p = 0.318 | 0.09 trivial |
| Half‐time: p = 0.024* | |||||||||||||
| Post‐exercise: p = 0.461 | |||||||||||||
| Accuracy (%) | 98.3 ± 2.5 | 96.7 ± 4.9 | 95.0 ± 6.4 | 93.8 ± 6.4 | 96.7 ± 3.9 | 97.9 ± 2.6 | 96.3 ± 6.1 | 95.0 ± 6.4 | p = 0.240 | Post pre‐cool: p = 0.149 | 0.12 trivial | ||
| Half‐time: p = 0.176 | |||||||||||||
| Post‐exercise: p = 0.188 | |||||||||||||
| RVIP (shortened version–3 min) | Response time (ms) | 492 ± 69 | 556 ± 107 | 479 ± 95 | 519 ± 75 | 555 ± 97 | 556 ± 124 | 505 ± 69 | 514 ± 67 | p = 0.207 | Post pre‐cool: p = 0.955 | 0.24 small | |
| Half‐time: p = 0.609 | |||||||||||||
| Post‐exercise: p = 0.347 | |||||||||||||
| Accuracy (%) | 0.58 ± 0.19 | 0.64 ± 0.20 | 0.59 ± 0.20 | 0.61 ± 0.20 | 0.52 ± 0.22 | 0.58 ± 0.17 | 0.56 ± 0.21 | 0.53 ± 0.21 | p = 0.654 | Post pre‐cool: p = 0.276 | 0.29 small | ||
| Half‐time: p = 0.631 | |||||||||||||
| Post‐exercise: p = 0.209 | |||||||||||||
Note: The shortened version of RVIP completed at post pre‐cool and half‐time consisted of 3 min and the RVIP data for baseline and post exercise has been calculated from the first 3 min of the full version of RVIP. All data reported as mean ± SD. Significant P‐values in bold.
Abbreviation: RVIP, rapid visual information processing.
For both the simple and complex level of the visual search test, accuracy did not differ between trials (main effect of trial, simple: z (1054) = −0.070 and p = 0.944; complex: z (2061) = −0.080 and p = 0.936) and the pattern of change in accuracy was not different across the simple level (trial × time interaction, z (1054) = 0.393 and p = 0.695) or following the pre‐cool, at half‐time and post‐exercise (trial × time interactions, z (2061) = −0.180 and p = 0.857, z (2061) = 0.062 and p = 0.951 and z (2061) = −0.520 and p = 0.603, respectively).
3.1.2. Stroop task
On the simple level of the Stroop task, a 2 (trial) × 2 (timepoints; baseline and post‐exercise) repeated measures ANOVA highlighted that response times were not different between the control and cooling trials (main effect of trial, t (637) = −0.041, p = 0.968; Table 1) nor was the pattern of change affected (trial × time interaction, t (637) = −0.134 and p = 0.894).
However, a 2 (trial) × 4 (timepoints; baseline, post pre‐cool, half‐time and post‐exercise) repeated measures ANOVA revealed that on the complex level of the Stroop task; overall, response times were quicker in the control trial in comparison to the cooling trial (main effect of trial, t (1816) = −3.083 and p = 0.002; Table 2). Furthermore, response times at half‐time were improved on the cooling trial in comparison to baseline whereas remained similar on the control trial (trial × time interaction, t (1816) = 2.256 and p = 0.024). Despite this, following the pre‐cool and post‐exercise, the pattern of change in response times did not differ between trials (trial × time interaction, pre‐cool: t (1816) = 0.999 and p = 0.318 and post‐exercise: t (1816) = 0.737 and p = 0.461).
No changes were seen in accuracy on either the simple or complex level of the Stroop task between the control and cooling trials (main effect of trial, simple: z (672) = −0.341 and p = 0.733 and complex: z (1920) = 1.174 and p = 0.240). Additionally, the pattern of change in accuracy across the trials on the simple level of the Stroop task was not different (trial × time interaction, z (672) = 0.044 and p = 0.965) nor did they differ following the pre‐cool, at half‐time or post‐exercise on the complex level (trial × time interactions, z (1920) = −1.443 and p = 0.149; z (1920) = −1.353 and p = 0.176; z (1920) = −1.317 and p = 0.188, respectively).
3.1.3. Sternberg paradigm
A 2 (trial) × 2 (timepoints; baseline and full‐time) repeated measures ANOVA found on the one‐item, three‐item and five‐item level of the Sternberg paradigm; response times were not different between the control and cooling trials (main effects of trial, t (739) = −1.452 and p = 0.147; t (1472) = −1.787 and p = 0.074 and t (1471) = −1.178 and p = 0.239, respectively) nor was the pattern of change in response times different across the trials (trial × time interaction, one‐item, t (739) = 1.313 and p = 0.190; three‐item, t (1472) = 1.869 and p = 0.062; five‐item, t (1471) = 1.297 and p = 0.195; Table 1). Accuracy was also not different between trials on the one‐item, three‐item or five‐item level (main effects of trial, z (767) = 0.004 and p = 0.997; z (1536) = 1.488 and p = 0.137; z (1536) = 0.862 and p = 0.389, respectively) and the pattern of change in accuracy did not differ on all levels between the control and cooling trials (trial × time interactions, one‐item, z (767) = −0.003 and p = 0.997; three‐item, z (1536) = −0.832 and p = 0.405 and five‐item, z (1536) = 0.331 and p = 0.741).
3.1.4. RVIP
A 2 (trial) × 2 (timepoints; baseline, post‐exercise) repeated measures ANOVA found that, response times and accuracy on the full version of RVIP were not different between the control and cooling trials (main effect of trial, response time: t (1781) = −1.217 and p = 0.207; accuracy: z (3426) = 0.449 and p = 0.654), nor was the pattern of change in response time and accuracy different across the trials (trial × time interactions, t (1781) = 0.940 and p = 0.347; z (3426) = 1.258 and p = 0.209, respectively; Table 1).
A 2 (trial) × 4 (timepoints; baseline, post pre‐cool, half‐time and post‐exercise) repeated measures ANOVA on the shortened version of RVIP, which was analysed with the first 3‐min of the full version from baseline and post‐exercise, found that, response times and accuracy were not different between the trials (main effect of trial, response time: t (653) = −1.059 and p = 0.290; accuracy: z (1187) = 1.742 and p = 0.082). Moreover, the pattern of change in response times and accuracy on the shortened version of RVIP were unaffected across both trials (trial × time interaction, response time: t (653) = −0.517 and p = 0.605; accuracy: z (1187) = −0.639 and p = 0.523).
3.2. Thermoregulatory responses
3.2.1. Rectal temperature
Rectal temperature was lower during the cooling trial (main effect of trial, F (1, 9) = 6.533, p = 0.031 and d = 0.24) and the pattern of change differed across the trials (trial × time interaction, F (16, 144) = 1.717 and p = 0.049). More specifically, rectal temperature was lower during the cooling trial from the end of the pre‐cool until after the first drinks break as well as at the end of half‐time (Figure 2). Despite this, a paired samples t‐test revealed that there was no significant difference in peak rectal temperature between the control and cooling trials (t (−1.133) = 9 and p = 0.143).
FIGURE 2.
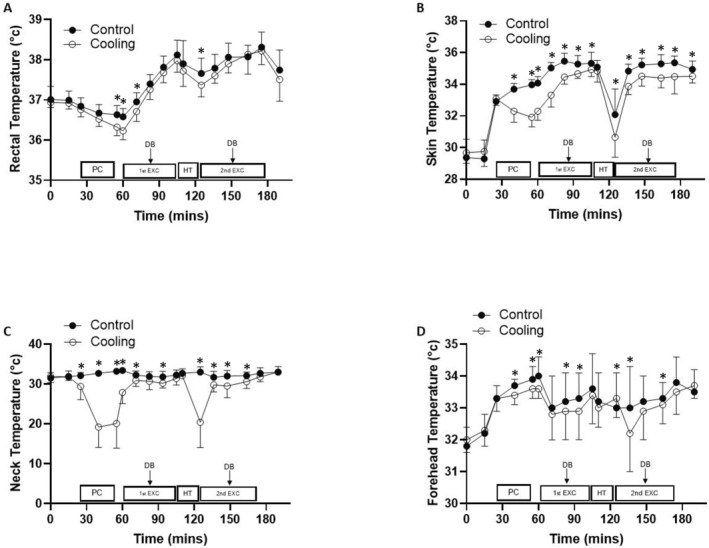
Rectal (A), skin (B), neck (C) and forehead (D) temperature during the control and cooling trials (mean ± SD). Rectal temperature, main effect of trial: p = 0.031 and d = 0.24; trial × time interaction: p = 0.049; skin temperature, main effect of trial: p < 0.001 and d = 0.31; trial × time interaction: p < 0.001; neck temperature main, effect of trial: p < 0.001 and d = 0.97; trial × time interaction: p < 0.001; forehead temperature, main effect of trial: p = 0.042 and d = 0.19; trial × time interaction: p = 0.204. Key: PC, pre‐cool; 1st EXC, first half of exercise; HT, half‐time; 2nd EXC, second half of exercise and DB, drinks break. Significant pairwise comparisons are denoted by *.
3.2.2. Skin temperature
Lower skin temperature was recorded during the cooling trial in comparison to the control trial (main effect of trial, F (1, 11) = 50.017, p < 0.001 and d = 0.41; Figure 2). Skin temperature differed across the trials (trial × time interaction, F (16, 176) = 13.329 and p < 0.001), with it being lower during the cooling trial from the midpoint of the pre‐cool until the end of the first period of exercise as well as from the end of half‐time until the end of the fourth period of exercise.
3.2.3. Neck temperature
The combined cooling intervention led to lower neck temperatures (main effect of trial, F (1, 10) = 81.722, p < 0.001 and d = 0.97) and differences in the pattern of change between the trials (trial × time interaction, F (16, 160) = 33.869, p < 0.001; Figure 2). Neck temperature was lower during the cooling trial from the start of the pre‐cool until the first drinks break as well as at the end of half‐time until the second drinks break.
3.2.4. Forehead temperature
Whilst lower forehead temperatures were recorded during the cooling trial (main effect of trial, F (1, 10) = 5.445, p = 0.042 and d = 0.19), the pattern of change did not differ across the trials (trial × time interaction, F (16, 160) = 1.298, p = 0.204; Figure 2).
3.3. Perceptual responses
3.3.1. Thermal sensation
Ratings of thermal sensation were lower during the cooling trial (main effect of trial, F (1, 11) = 10.737, p = 0.007 and d = 0.39) and the pattern of change differed across the trials as ratings of thermal sensation were lower in the cooling trial from the end of the pre‐cool until the end of the first half of exercise as well as at the end of the half‐time break and the end of the second half of exercise (trial × time interaction, F (3.464, 38.107) = 5.656, p = 0.002; Figure 3).
FIGURE 3.
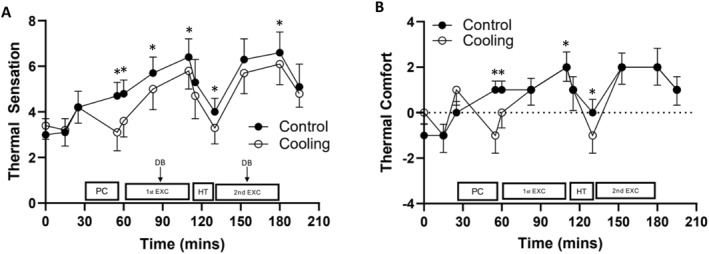
Ratings of thermal sensation (A) and thermal comfort (B) during the control and cooling trials (mean ± SD). Thermal sensation, main effect of trial: p = 0.007 and d = 0.39; trial × time interaction: p = 0.002; thermal comfort, main effect of trial: p = 0.002 and d = 0.37; trial × time interaction: p < 0.001. Key: PC, pre‐cool; 1st EXC, first half of exercise; HT, half‐time; 2nd EXC, second half of exercise and DB–drinks break. Significant pairwise comparisons are denoted by *.
3.3.2. Thermal comfort
During the cooling trial, ratings of thermal comfort were lower (main effect of trial, F (1, 11) = 17.499, p = 0.002 and d = 0.37) and a trial × time interaction was seen as ratings of thermal comfort were lower in the cooling trial from the end of the pre‐cool until the start of the first period of exercise, at the end of the first half as well as at the end of half‐time (F (11, 121) = 6.434, p < 0.001; Figure 3).
3.3.3. Ratings of perceived exertion
Participants rated lower levels of perceived exertion during the cooling trial (main effect of trial, F (1, 11) = 6.636, p = 0.026 and d = 0.15, Figure 4); however, the pattern of change in ratings of perceived exertion did not differ across the trials (trial × time interaction, F (3.873, 42.604 = 1.833, p = 0.142; Table S1).
FIGURE 4.
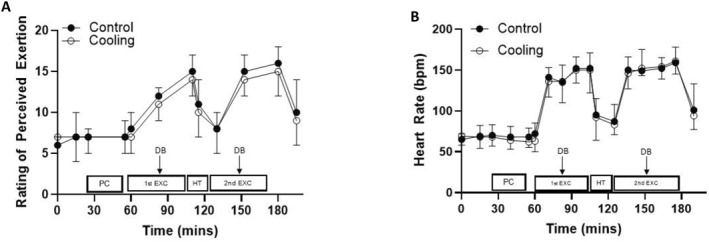
Ratings of perceived exertion (A) and heart rate (B) during the control and cooling trials (mean ± SD). Rating of perceived exertion, main effect of trial: p = 0.026 and d = 0.15; trial × time interaction: p = 0.142; Heart rate, main effect of trial: p = 0.558 and d = 0.02; trial × time interaction: p = 0.835. Key: PC, pre‐cool; 1st EXC, first half of exercise; HT, half‐time; 2nd EXC, second half of exercise and DB, drinks break.
3.3.4. Felt arousal scale and feeling scale
There were no differences seen in ratings of arousal or ratings on the feeling scale between the control and cooling trials (main effect of trial, FAS: F (1, 11) = 0.945, p = 0.352 and d = 0.15; FS: F (1, 11) = 0.646, p = 0.439 and d = 0.11 and Table S1). The pattern of change in these perceptual variables also did not differ across the trials (trial × time interaction, FAS: F (4.084, 44.922) = 0.913 and p = 0.466 and FS: F (2.751, 30.258) = 1.801 and p = 0.172).
3.4. Heart Rate, blood glucose and lactate concentrations
HR, blood glucose or lactate concentrations were not different between the control and cooling trials (main effect of trial, HR: F (1, 10) = 0.366, p = 0.558 and d = 0.02, Figure 4; blood glucose: F (1, 11) = 0.650, p = 0.437 and d = 0.20 and blood lactate: F (1, 11) = 0.235, p = 0.637 and d = 0.06) nor was the pattern of change different across the trials (trial × time interaction, HR: F (16, 160) = 0.654 and p = 0.835; blood glucose: F (1, 11) = 0.129 and p = 0.727 and blood lactate: F (1, 11) = 0.299 and p = 0.595).
4. DISCUSSION
The aim of the current study was to investigate if a combined cooling intervention had an effect on cognitive function in team sport athletes during a prolonged intermittent treadmill protocol designed to replicate the demands of a football match in the heat. Lower ratings of thermal sensation, thermal comfort and perceived exertion as well as lower rectal, skin, neck and forehead temperatures were recorded during the cooling trial. In addition to this, response times on the complex level of the Stroop task were quicker at half‐time in the cooling trial. In contrast, during the control trial, response times were quicker overall on the complex level of the Stroop task as well as on the complex level of the visual search test at full‐time. However, these findings were present in the absence of accuracy changes.
The combined cooling intervention was successful at lowering neck and forehead temperatures, which has been associated with improvements in cognitive function, particularly in tasks of high complexity, when exercising in the heat (Lee et al., 2014). Research conducted by Saldaris et al. (2019) found, when compared to a control, fewer errors in working memory and decision‐making tasks coupled with decreases in pre‐exercise forehead temperature when ingesting crushed ice. However, no differences in response time or accuracy were seen on the Sternberg paradigm or RVIP in the current study, which is consistent with literature that investigated the use of head cooling on working memory (Mazalan et al., 2021) and sustained attention (Gaoua et al., 2011). A potential explanation for this is due to the participant's rectal temperature not reaching a level where cognitive declines occur. It has been established that individuals who reach a core temperature of 39°C or higher will experience cognitive declines (Gaoua et al., 2011). However, rectal temperature in the current study only reached a maximum of 38.22°C and 38.31°C in the cooling and control trials, respectively, and were not statistically different. Due to the fixed paced nature of the protocol and participants exercising in a non‐competitive situation, the demands of the intermittent treadmill protocol may have been lower than that typically seen when exercising in the heat. This was evidenced by participant's RPE and HR not reaching the same levels that has been previously found when playing football in hot conditions (Mohr et al., 2010; figure 4). This demonstrates that the demands of the protocol were not high enough to increase participant's rectal temperature to a level where cognitive declines occur, thus the cooling was ineffective.
On the contrary, at half‐time, response times were quicker, in the absence of accuracy changes, on the complex level of the Stroop task during the cooling trial, which is in line with previous work conducted on the effects of a combined cooling strategy on executive function (Wen et al., 2022). Elevated core temperatures following exercise have been found to lead to detrimental effects on response times (Bandelow et al., 2010) as well as lower neck temperatures being associated with improvements in cognitive function during tasks of high complexity (Lee et al., 2014). At half‐time, rectal temperatures were 37.98°C and 38.12°C and neck temperatures were 31.40°C and 32.30°C in the cooling and control trials, respectively. This highlights that due to the differing levels of physiological strain experienced, participants may have been able to provide more neural resources to the Stroop task at half‐time during the cooling trial and cope better with the combination of heat strain and the cognitive task. It may also be linked to the perceptual responses experienced as a result of the combined cooling intervention as participant's rated lower levels of thermal sensation and comfort in the cooling trial up until half‐time (Figure 3). This coincides with the quickened response times, highlighting that they may have felt cooler and better at this time point compared to full‐time, where no differences were seen. Despite this, during the control trial, response times were quicker overall on the complex level of the Stroop task and on the complex level of the visual search test at full‐time compared to after the pre‐cool and half‐time. Previous research has found that cognitive improvements occur following moderate‐intensity exercise due to increases in arousal (Johnson & Kobrick, 2001; McMorris, Tomporowski & Audiffren, 2009), which may explain why response times were quicker. However, due to a lack of consistent results throughout the cooling and control trials as well as at different time points, it is difficult to determine the exact mechanisms causing these differences found in response times during the control trial. Consequently, more research is needed to explore the effects of a combined cooling intervention on cognitive function during intermittent exercise in the heat.
In line with previous research (Levels et al., 2013; Mazalan et al., 2022), the combined cooling intervention was successful at lowering rectal and mean skin temperatures (Figure 1). This finding may be associated with both the location of the ice slurry ingestion as well as the mixing of cooled cutaneous blood whilst returning back to the core due to neck cooling (Price et al., 2009). Benefits of lower rectal temperatures include reductions in thermoregulatory responses, for example, sweating that can increase the risk of dehydration (Schmitt et al., 2017), and increases in time to exhaustion during exercise (Tyler & Sunderland, 2011). Lower skin temperature as a result of cooling was also found and was consistent with previous research (Price et al., 2009), where following the pre‐cool, skin temperature values were significantly lower during the cooling trial. However, skin temperature returned to similar levels of the control trial throughout the exercise protocol, specifically following the first half of exercise. This highlights the need for a combined cooling intervention as cooling the skin alone, particularly via pre‐cooling, does not have lasting beneficial effects when exercising commences.
The current study highlights the effectiveness of using a combined cooling intervention to lower ratings of thermal sensations, thermal comfort and perceived exertion during exercise. These findings are consistent with previous research on ice slurry ingestion alone and in combination with external cooling methods (i.e., ice packs) (Aldous et al., 2019; Naito et al., 2020). Due to the high allethesial thermosensitivity of the neck (Cotter & Taylor, 2005), the effectiveness of the combined cooling strategy could be associated with initial differences seen in mean skin temperatures. Even though the cooling strategy's ability to reduce the rise in skin temperature lessened as exercise continued (Figure 2), an extended perception of cooling likely occurred when actual cooling was not taking place (Galpin et al., 2016). This was evident through lower ratings of thermal sensation, thermal comfort and perceived exertion throughout the cooling trial. Additionally, due to the location of the thermoreceptors in the gastrointestinal region and thermoregulatory centre in close proximity to the neck (Haymaker, 1969; Morris et al., 2014), the combined cooling strategy may have directly or indirectly influenced the afferent signals and masked the extent of thermal strain experienced, subsequently making the participants feel cooler and less exerted at times (Morris et al., 2014; Tyler & Sunderland, 2011).
From a practical applications standpoint, due to the simplicity of the implementation of the ice slurry and ice collar, it can easily be introduced before and during a football match, specifically at half‐time and throughout drink breaks. Physiologically and perceptually, it is evident that the combined cooling strategy was beneficial, however, the participant's rectal temperature did not reach a level where cognitive declines have occurred previously (Gaoua et al., 2011). Therefore, participants may not have experienced the same level of physiological strain as they would during match play. The potential reasons for this are linked to the exercise protocol. Whilst informed by a football match, the protocol was fixed paced and conducted in a non‐competitive environment, which does not best reflect the settings and physical demands that would transpire in a real‐life scenario. Additionally, whilst difficult to implement, the cognitive tasks included in the current study were not sport specific and thus, may not wholly represent the cognitive demands of intermittent, team sports. Therefore, future research should investigate the effect of a combined cooling intervention on games player's cognitive function utilising self‐paced exercise and sport specific cognitive tasks.
In conclusion, the combined cooling method employed in the current study was successful at lowering ratings of thermal sensation, thermal comfort and perceived exertion potentially due to a continual perception of cooling as well as the locality of the intervention. Despite lower neck and forehead temperatures, no consistent differences were seen in cognitive function between the trials as rectal temperatures did not reach a critical level where declines in cognition normally occur. The present study has practical applications for intermittent sports in the heat, in particular football; however, attention should be given to the environmental conditions used in future research.
CONFLICT OF INTEREST STATEMENT
The authors declare that they have no conflicts of interest.
Supporting information
Table S1
ACKNOWLEDGEMENTS
The authors would like to acknowledge all the participants for their commitment to the study and researchers who assisted with data collection.
REFERENCES
- Aldous, Jeffrey William Frederick , Chrismas Bryna Catherine Rose, Akubat Ibrahim, Stringer Charlotte Anne, Abt Grant, and Taylor Lee. 2019. “Mixed‐methods Pre‐match Cooling Improves Simulated Soccer Performance in the Heat.” European Journal of Sport Science 19(2): 156–165. 10.1080/17461391.2018.1498542. [DOI] [PubMed] [Google Scholar]
- Bandelow, S. , Maughan R., Shirreffs S., Ozgünen K., Kurdak S., Ersöz G., Binnet M., and Dvorak J.. 2010. “The Effects of Exercise, Heat, Cooling and Rehydration Strategies on Cognitive Function in Football Players.” Scandinavian Journal of Medicine & Science in Sports 20(s3): 148–160. 10.1111/j.1600-0838.2010.01220.x. [DOI] [PubMed] [Google Scholar]
- Bangsbo, J. 2000. “Team Sports.” Nutrition in Sport: 574. [Google Scholar]
- Bangsbo, Jens , and Mohr Magni. 2005. “Variations in Running Speeds and Recovery Time after a Sprint during Top‐Class Soccer Matches.” Medicine & Science in Sports & Exercise 37(5): S87. 10.1097/00005768-200505001-00471. [DOI] [Google Scholar]
- Bangsbo, Jens , Mohr Magni, and Krustrup Peter. 2006. “Physical and Metabolic Demands of Training and Match‐Play in the Elite Football Player.” Journal of Sports Sciences 24(07): 665–674. 10.1080/02640410500482529. [DOI] [PubMed] [Google Scholar]
- Bangsbo, J. , Nørregaard L., and Thorsø F.. 1991. “Activity Profile of Competition Soccer.” Canadian journal of sport sciences= Journal canadien des sciences du sport 16(2): 110–116. [PubMed] [Google Scholar]
- Bedford, T. 1936. The Warmth Factor in Comfort at Work: A Physiological Study of Heating and Ventilation. London: Industrial Health Research Board, HMSO. [Google Scholar]
- Bedford, T. 1950. “Environmental Warmth and Human Comfort.” British Journal of Applied Physics 1(2): 33–38. 10.1088/0508-3443/1/2/301. [DOI] [Google Scholar]
- Brito, H. , Teixeira D., and Araújo D.. 2022. Translation and Construct Validity of the Feeling Scale and the Felt Arousal Scale in Portuguese Recreational Exercisers.
- Casa, D. J. , Becker S. M., Ganio M. S., Brown C. M., Yeargin S. W., Roti M. W., et al. 2007. “Validity of Devices that Assess Body Temperature during Outdoor Exercise in the Heat.” Journal of Athletic Training 42(3): 333. [PMC free article] [PubMed] [Google Scholar]
- Casanova, Filipe , Garganta Júlio, Silva Gustavo, Alves Alberto, Oliveira J. O. S. E., and Williams Andrew Mark. 2013. “Effects of Prolonged Intermittent Exercise on Perceptual‐Cognitive Processes.” Medicine & Science in Sports & Exercise 45(8): 1610–1617. 10.1249/mss.0b013e31828b2ce9. [DOI] [PubMed] [Google Scholar]
- Cohen, Jacob . 1992. “A Power Primer.” Psychological Bulletin 112(1): 155–159. 10.1037/0033-2909.112.1.155. [DOI] [PubMed] [Google Scholar]
- Cooper, S. B. , Bandelow S., Morris J. G., and Nevill M.. 2015b. “Reliability of a Battery of Cognitive Function Tests in an Adolescent Population.” Journal of Sports Sciences 33(Suppl. 1): 41–43. [Google Scholar]
- Cooper, Simon B. , Bandelow Stephan, Nute Maria L., Dring Karah J., Stannard Rebecca L., Morris John G., and Nevill Mary E.. 2016. “Sprint‐based Exercise and Cognitive Function in Adolescents.” Preventive Medicine Reports 4: 155–161. 10.1016/j.pmedr.2016.06.004. [DOI] [PMC free article] [PubMed] [Google Scholar]
- Cooper, Simon B. , Bandelow Stephan, Nute Maria L., Morris John G., and Nevill Mary E.. 2015a. “Breakfast Glycaemic Index and Exercise: Combined Effects on Adolescents' Cognition.” Physiology & Behavior 139: 104–111. 10.1016/j.physbeh.2014.11.024. [DOI] [PubMed] [Google Scholar]
- Cotter, James D. , and Taylor Nigel A. S.. 2005. “The Distribution of Cutaneous Sudomotor and Alliesthesial Thermosensitivity in Mildly Heat‐stressed Humans: an Open‐loop Approach.” The Journal of Physiology 565(1): 335–345. 10.1113/jphysiol.2004.081562. [DOI] [PMC free article] [PubMed] [Google Scholar]
- Donnan, Kate , Williams Emily L., and Stanger Nicholas. 2021. “The Effects of Heat Exposure during Intermittent Exercise on Physical and Cognitive Performance Among Team Sport Athletes.” Perceptual and Motor Skills 128(1): 439–466. 10.1177/0031512520966522. [DOI] [PMC free article] [PubMed] [Google Scholar]
- Ekblom, Björn . 1986. “Applied Physiology of Soccer.” Sports Medicine 3(1): 50–60. 10.2165/00007256-198603010-00005. [DOI] [PubMed] [Google Scholar]
- Furley, Philip Alexander , and Memmert Daniel. 2010. “The Role of Working Memory in Sport.” International Review of Sport and Exercise Psychology 3(2): 171–194. 10.1080/1750984x.2010.526238. [DOI] [Google Scholar]
- Galpin, Andrew , Bagley James, Whitcomb Blake, Wiersma Leonard, Rosengarten Jakob, Coburn Jared, and Judelson Daniel. 2016. “Effects of Intermittent Neck Cooling during Repeated Bouts of High‐Intensity Exercise.” Sports 4(3): 38. 10.3390/sports4030038. [DOI] [PMC free article] [PubMed] [Google Scholar]
- Gaoua, Nadia , Racinais Sebastien, Grantham Justin, and El Massioui Farid. 2011. “Alterations in Cognitive Performance during Passive Hyperthermia Are Task Dependent.” International Journal of Hyperthermia 27(1): 1–9. 10.3109/02656736.2010.516305. [DOI] [PMC free article] [PubMed] [Google Scholar]
- Girard, O. , Brocherie F., and Bishop D. J.. 2015. “Sprint Performance under Heat Stress: a Review.” Scandinavian Journal of Medicine & Science in Sports 25(S1): 79–89. 10.1111/sms.12437. [DOI] [PubMed] [Google Scholar]
- Greig, Matt P. , Mc Naughton Lars R., and Lovell Ric J.. 2006. “Physiological and Mechanical Response to Soccer‐specific Intermittent Activity and Steady‐State Activity.” Research in Sports Medicine 14(1): 29–52. 10.1080/15438620500528257. [DOI] [PubMed] [Google Scholar]
- Hancock, P. A. 1986. “Sustained Attention under Thermal Stress.” Psychological Bulletin 99(2): 263–281. 10.1037//0033-2909.99.2.263. [DOI] [PubMed] [Google Scholar]
- Hardy, Charles J. , and Rejeski W. Jack. 1989. “Not What, but How One Feels: the Measurement of Affect during Exercise.” Journal of Sport & Exercise Psychology 11(3): 304–317. 10.1123/jsep.11.3.304. [DOI] [Google Scholar]
- Harper, Damian J. , Carling Christopher, and Kiely John. 2019. “High‐intensity Acceleration and Deceleration Demands in Elite Team Sports Competitive Match Play: a Systematic Review and Meta‐Analysis of Observational Studies.” Sports Medicine 49(12): 1923–1947. 10.1007/s40279-019-01170-1. [DOI] [PMC free article] [PubMed] [Google Scholar]
- Haymaker, W. 1969. “Blood Supply of the Human Hypothalamus.” In The Hypothalamus, edited by Haymaker W., Anderson E. and Nauta W. J., 210–218. Springfield, IL: Charles C Thomas. [Google Scholar]
- Hepler, T. J. 2015. “Decision‐making in Sport under Mental and Physical Stress.” International Journal of Kinesiology & Sports Science 3(4): 79–83. [Google Scholar]
- Hilti, Caroline Claudia , Hilti Leonie Maria, Heinemann Doerthe, Robbins Trevor, Seifritz Erich, and Cattapan‐Ludewig Katja. 2010. “Impaired Performance on the Rapid Visual Information Processing Task (RVIP) Could Be an Endophenotype of Schizophrenia.” Psychiatry Research 177(1–2): 60–64. 10.1016/j.psychres.2009.12.012. [DOI] [PubMed] [Google Scholar]
- Huijgen, Barbara C. H. , Leemhuis Sander, Kok Niels M., Verburgh Lot, Oosterlaan Jaap, Elferink‐Gemser Marije T., and Visscher Chris. 2015. “Cognitive Functions in Elite and Sub‐elite Youth Soccer Players Aged 13 to 17 Years.” PLoS One 10(12): e0144580. 10.1371/journal.pone.0144580. [DOI] [PMC free article] [PubMed] [Google Scholar]
- Johnson, R. F. , and Kobrick J. L.. 2001. “Psychological Aspects of Military Performance in Hot Environments.” Medical Aspects of Harsh Environments 1: 135–159. [Google Scholar]
- Krustrup, Peter , Mohr Magni, Ellingsgaard H. E. L. G. A., and Bangsbo Jens. 2005. “Physical Demands during an Elite Female Soccer Game: Importance of Training Status.” Medicine & Science in Sports & Exercise 37(7): 1242–1248. 10.1249/01.mss.0000170062.73981.94. [DOI] [PubMed] [Google Scholar]
- Lee, Jason K. W. , Koh Aldrich C. H., Koh Serene X. T., Liu Glen J. X., Nio Amanda Q. X., and Fan Priscilla W. P.. 2014. “Neck Cooling and Cognitive Performance Following Exercise‐Induced Hyperthermia.” European Journal of Applied Physiology 114(2): 375–384. 10.1007/s00421-013-2774-9. [DOI] [PubMed] [Google Scholar]
- Levels, Koen , Teunissen Lennart P. J., de Haan Arnold, de Koning Jos J., van Os Bernadet, and Daanen Hein A. M.. 2013. “Effect of Warm‐Up and Precooling on Pacing during a 15‐km Cycling Time Trial in the Heat.” International Journal of Sports Physiology and Performance 8(3): 307–311. 10.1123/ijspp.8.3.307. [DOI] [PubMed] [Google Scholar]
- MacLeod, Hannah , Cooper Simon, Bandelow Stephan, Malcolm Rachel, and Sunderland Caroline. 2018. “Effects of Heat Stress and Dehydration on Cognitive Function in Elite Female Field Hockey Players.” BMC Sports Science, Medicine and Rehabilitation 10(1): 1–13. 10.1186/s13102-018-0101-9. [DOI] [PMC free article] [PubMed] [Google Scholar]
- Malcolm, Rachel A. , Cooper Simon, Folland Jonathan P., Tyler Christopher J., and Sunderland Caroline. 2018. “Passive Heat Exposure Alters Perception and Executive Function.” Frontiers in Physiology 9: 585. 10.3389/fphys.2018.00585. [DOI] [PMC free article] [PubMed] [Google Scholar]
- Mazalan, Nur Shakila , Landers Grant Justin, Wallman Karen Elizabeth, and Ecker Ullrich. 2021. “Head Cooling Prior to Exercise in the Heat Does Not Improve Cognitive Performance.” Journal of Sports Science and Medicine 20(1): 69–76. 10.52082/jssm.2021.69. [DOI] [PMC free article] [PubMed] [Google Scholar]
- Mazalan, Nur Shakila , Landers Grant Justin, Wallman Karen Elizabeth, and Ecker Ullrich. 2022. “A Combination of Ice Ingestion and Head Cooling Enhances Cognitive Performance during Endurance Exercise in the Heat.” Journal of Sports Science and Medicine 21(1): 23–32. 10.52082/jssm.2022.23. [DOI] [PMC free article] [PubMed] [Google Scholar]
- McMorris, T. , Tomporowski P. and Audiffren M.. 2009. Exercise and Cognitive Function. John Wiley & Sons. [Google Scholar]
- Mohr, Magni , Krustrup Peter, and Bangsbo Jens. 2003. “Match Performance of High‐Standard Soccer Players with Special Reference to Development of Fatigue.” Journal of Sports Science 21(7): 439–449. 10.1080/0264041031000071182. [DOI] [PubMed] [Google Scholar]
- Mohr, M. , Mujika I., Santisteban J., Randers M. B., Bischoff R., Solano R., Hewitt A., et al. 2010. “Examination of Fatigue Development in Elite Soccer in a Hot Environment: a Multi‐experimental Approach.” Scandinavian Journal of Medicine & Science in Sports 20(s3): 125–132. 10.1111/j.1600-0838.2010.01217.x. [DOI] [PubMed] [Google Scholar]
- Morgan, W. , and Borg G.. 1976. “Perception of Effort in the Prescription of Physical Activity.” In Mental Health and Emotional Aspects of Sports, edited by Nelson T., 126–129. Chicago: American Medical Association. [Google Scholar]
- Morris, Nathan B. , Bain Anthony R., Cramer Matthew N., and Jay Ollie. 2014. “Evidence that Transient Changes in Sudomotor Output with Cold and Warm Fluid Ingestion Are Independently Modulated by Abdominal, but Not Oral Thermoreceptors.” Journal of Applied Physiology 116(8): 1088–1095. 10.1152/japplphysiol.01059.2013. [DOI] [PMC free article] [PubMed] [Google Scholar]
- Naito, Takashi , Haramura Miki, Muraishi Koji, Yamazaki Misa, and Takahashi Hideyuki. 2020. “Impact of Ice Slurry Ingestion during Break‐Times on Repeated‐Sprint Exercise in the Heat.” Sports Medicine International Open 4(02): E45–E52. 10.1055/a-1139-1761. [DOI] [PMC free article] [PubMed] [Google Scholar]
- Onitsuka, Sumire , Zheng Xinyan, and Hasegawa Hiroshi. 2020. “Ice Slurry Ingestion before and during Exercise Inhibit the Increase in Core and Deep‐Forehead Temperatures in the Second Half of the Exercise in a Hot Environment.” Journal of Thermal Biology 94: 102760. 10.1016/j.jtherbio.2020.102760. [DOI] [PubMed] [Google Scholar]
- Pereira, Gleber , Correia Ricardo, Ugrinowitsch Carlos, Nakamura Fábio, Rodacki André, Fowler Neil, and Kokubun Eduardo. 2011. “The Rating of Perceived Exertion Predicts Intermittent Vertical Jump Demand and Performance.” Journal of Sports Sciences 29(9): 927–932. 10.1080/02640414.2011.571272. [DOI] [PubMed] [Google Scholar]
- Périard, Julien D. , Cramer Matthew N., Chapman Phillip G., Caillaud Corinne, and Thompson Martin W.. 2011. “Cardiovascular Strain Impairs Prolonged Self‐paced Exercise in the Heat.” Experimental Physiology 96(2): 134–144. 10.1113/expphysiol.2010.054213. [DOI] [PubMed] [Google Scholar]
- Price, Michael J. , Boyd Craig, and Goosey‐Tolfrey Victoria L.. 2009. “The Physiological Effects of Pre‐event and Midevent Cooling during Intermittent Running in the Heat in Elite Female Soccer Players.” Applied Physiology Nutrition and Metabolism 34(5): 942–949. 10.1139/h09-078. [DOI] [PubMed] [Google Scholar]
- Racinais, S. , Gaoua N., and Grantham J.. 2008. “Hyperthermia Impairs Short‐term Memory and Peripheral Motor Drive Transmission.” The Journal of Physiology 586(19): 4751–4762. 10.1113/jphysiol.2008.157420. [DOI] [PMC free article] [PubMed] [Google Scholar]
- Reilly, Thomas , and Thomas Vaughan. 1979. “Estimated Daily Energy Expenditures of Professional Association Footballers.” Ergonomics 22(5): 541–548. 10.1080/00140137908924638. [DOI] [PubMed] [Google Scholar]
- Saldaris, Jacinta M. , Landers Grant J., and Lay Brendan S.. 2019. “Enhanced Decision Making and Working Memory during Exercise in the Heat with Crushed Ice Ingestion.” International Journal of Sports Physiology and Performance 15(4): 503–510. 10.1123/ijspp.2019-0234. [DOI] [PubMed] [Google Scholar]
- Sarmento, Hugo , Anguera M. Teresa, Pereira Antonino, and Araújo Duarte. 2018. “Talent Identification and Development in Male Football: A Systematic Review.” Sports Medicine 48(4): 907–931. 10.1007/s40279-017-0851-7. [DOI] [PubMed] [Google Scholar]
- Scharfen, H.‐Erik , and Memmert Daniel. 2019. “The Relationship between Cognitive Functions and Sport‐specific Motor Skills in Elite Youth Soccer Players.” Frontiers in Psychology 10: 817. 10.3389/fpsyg.2019.00817. [DOI] [PMC free article] [PubMed] [Google Scholar]
- Schmit, Cyril , Hausswirth Christophe, Le Meur Yann, and Duffield Rob. 2017. “Cognitive Functioning and Heat Strain: Performance Responses and Protective Strategies.” Sports Medicine 47(7): 1289–1302. 10.1007/s40279-016-0657-z. [DOI] [PubMed] [Google Scholar]
- Schmitt, Jeroen A. J. , Benton David, and Kallus K. Wolfgang. 2005. “General Methodological Considerations for the Assessment of Nutritional Influences on Human Cognitive Functions.” European Journal of Nutrition 44(8): 459–464. 10.1007/s00394-005-0585-4. [DOI] [PubMed] [Google Scholar]
- Simmons, Shona E. , Mündel Toby, and Jones David A.. 2008. “The Effects of Passive Heating and Head‐Cooling on Perception of Exercise in the Heat.” European Journal of Applied Physiology 104(2): 281–288. 10.1007/s00421-007-0652-z. [DOI] [PubMed] [Google Scholar]
- Sternberg, Saul . 1966. “High‐speed Scanning in Human Memory.” Science 153(3736): 652–654. 10.1126/science.153.3736.652. [DOI] [PubMed] [Google Scholar]
- Stroop, J. R. 1935. “Studies of Interference in Serial Verbal Reactions.” Journal of Experimental Psychology 18(6): 643–662. 10.1037/h0054651. [DOI] [Google Scholar]
- Svebak, Sven , and Murgatroyd Stephen. 1985. “Metamotivational Dominance: a Multimethod Validation of Reversal Theory Constructs.” Journal of Personality and Social Psychology 48(1): 107–116. 10.1037//0022-3514.48.1.107. [DOI] [Google Scholar]
- Taylor, Lee , Watkins Samuel L., Marshall Hannah, Dascombe Ben J., and Foster Josh. 2016. “The Impact of Different Environmental Conditions on Cognitive Function: a Focused Review.” Frontiers in Physiology 6: 372. 10.3389/fphys.2015.00372. [DOI] [PMC free article] [PubMed] [Google Scholar]
- Tomporowski, Phillip D. 2003. “Effects of Acute Bouts of Exercise on Cognition.” Acta Psychologica 112(3): 297–324. 10.1016/s0001-6918(02)00134-8. [DOI] [PubMed] [Google Scholar]
- Toner, Michael M. , Drolet Lawrence L., and Pandolf Kent B.. 1986. “Perceptual and Physiological Responses during Exercise in Cool and Cold Water.” Perceptual & Motor Skills 62(1): 211–220. 10.2466/pms.1986.62.1.211. [DOI] [PubMed] [Google Scholar]
- Tyler, Christopher James , and Sunderland Caroline. 2011. “Cooling the Neck Region during Exercise in the Heat.” Journal of Athletic Training 46(1): 61–68. 10.4085/1062-6050-46.1.61. [DOI] [PMC free article] [PubMed] [Google Scholar]
- Van Dongen, Hans P. A. , and Dinges David F.. 2005. “Sleep, Circadian Rhythms, and Psychomotor Vigilance.” Clinics in Sports Medicine 24(2): 237–249. 10.1016/j.csm.2004.12.007. [DOI] [PubMed] [Google Scholar]
- Weltman, A. , Snead D., Stein P., Seip R., Schurrer R., Rutt R., and Weltman J.. 1990. “Reliability and Validity of a Continuous Incremental Treadmill Protocol for the Determination of Lactate Threshold, Fixed Blood Lactate Concentrations, and VO2max.” International Journal of Sports Medicine 11(01): 26–32. 10.1055/s-2007-1024757. [DOI] [PubMed] [Google Scholar]
- Wen, Minglang , Liu Guozheng, Li Wencan, Xie Tao, Zhang Yukun, Qin Fei, and Zhao Jiexiu. 2022. “Effects of Mixed‐Cooling Strategies on Executive Functions in Simulated Tennis in Hot and Humid Conditions.” Frontiers in Physiology 2308. 10.3389/fphys.2022.1008710. [DOI] [PMC free article] [PubMed] [Google Scholar]
Associated Data
This section collects any data citations, data availability statements, or supplementary materials included in this article.
Supplementary Materials
Table S1