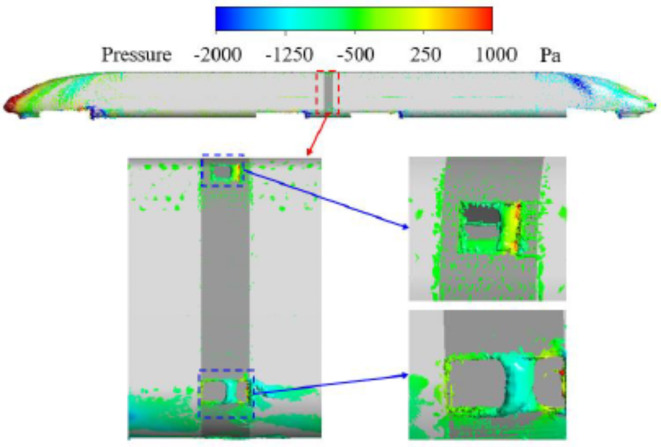
Abstract
The noise level of a high-speed train is a crucial indicator of its operational quality. A significant low-frequency interior noise, referred to as ‘38 Hz’ in this context, has been detected during the operation of high-speed trains. This notable noise primarily occurs in the train attendant’s cabin near the windshield area. In this study, we conducted a comprehensive full-scale test to investigate the preliminary cause behind this significant ‘38 Hz’ noise. Our investigation reveals that it is associated with aerodynamic noise originating from the windshield area. To identify the root cause of this ‘38 Hz’ noise in the windshield area, we established a computational fluid dynamics (CFD) based model for aerodynamic noise analysis. The causes were found to be related to both the size and opening of the windshield cavity. Simulation results demonstrate that closing the upper opening significantly reduces the volume of ‘38 Hz’ noise compared to the original outer windshield structure design. We verified and validated these findings through an extensive full-scale test, which showed that by implementing our proposed modified windshield structure, there was approximately 7 dB reduction in significant ‘38 Hz’ noise observed within the train attendant’s cabin near the windshield area.
Supplementary Information
The online version contains supplementary material available at 10.1038/s41598-024-75355-8.
Keywords: High-speed train, Aerodynamic noise, Coherent analysis, Windshield, Full-scale test, CFD
Subject terms: Mechanical engineering, Software
Introduction
High-speed railway is widely used around the world, but there is no denying that the problem of noise is becoming increasingly prominent, as operating speed increases, and car bodies become lighter. As a high-speed train exceeds 300 km/h, aerodynamic noise becomes the main noise source1–5, and has been an important factor, restricting further increases in speed. The irregular structure of the train surface can easily induce aerodynamic noise. Consequently, a lot of measures have been taken, to improve the smoothness of many train surfaces, such as the windshield, the bogie, and the pantograph, which are the main sources of aerodynamic noise. In particular, the airflow through the windshield can flow directly into the car, resulting in a significant increase in aerodynamic noise, so that special attention needs to be paid. Some subsidiary devices, of different structural forms, such as spoilers, are designed to improve the flow field around the windshield, thereby reducing aerodynamic noise.
With ongoing requirements for comfort and efficiency of travel, train aerodynamic noise and its control has become an interesting and popular research topic, and different research methods, including full-scale testing, wind tunnel experiments, and numerical simulation have been adopted. Mostly through experiments on high-speed trains6–8, the most important areas of the train body that cause aerodynamic noise have been determined, namely, bogies, pantographs, air conditioners, and windshields. A lot of analyses on the sources and characteristics of aerodynamic noise and the mechanisms of noise generation, have been carried out in relation to the windshield, and have shown that flow separation occurs here, forming periodic vortex shedding. As the vortex shedding frequency approaches an acoustic resonance frequency, a strong peak noise is generated9. Research shows that applying a rounded edge to the windshield can effectively reduce the shedding intensity of vortices10, and that fitting fairings around the windshield can also be effective in reducing the noise in the cavity.
There have been a lot of studies on achieving a reduction in aerodynamic noise by fitting an outer windshield. In the literature11–14, the authors found that the fluctuation of the pressure and drag around the car-connection region was successfully reduced by applying an outer windshield, with different types of outer windshields,. Research also showed that upper and lower closed windshields have better aerodynamic performance15. It was found that the effect of the outer windshield gap on a high-speed train improves performance, as can a well-designed outer windshield space16,17. To study the effect of the size of the outer windshield on the aerodynamic noise characteristics, Li et al.18 suggested that the windshield gaps should be set at 10 mm. Choi et al.19 found that low-frequency noise is heavily dependent on the size of the gap. Li et al.20 found that noise from the car-connection parts is reduced by fitting an outer windshield, and that rounding the edge of the outer windshield can further reduce aerodynamic noise. In addition, fully enclosing the outer windshield has a better noise reduction effect, an approximately 15 dB reduction of sound pressure level on both sides of the near field21.
In a study22, it was found that the significant noise was mainly caused by the volume of a 40 Hz noise energy, though no thorough investigation of the source and formation mechanism of the 40 Hz excitation was carried out. In this study, A full-scale test is carried out on a high-speed railway, using a new type of train running at a speed of 350 km/h. A significant low-frequency noise phenomenon is observed in the cabin, close to the windshields. The causes of a significant low-frequency noise at around 38 Hz, are investigated, and the effect of the opening form of the outer windshield on the low-frequency aerodynamic noise inside the high-speed train is discussed, using a combination of field tests and numerical simulation. On this basis, a control method for the significant low-frequency noise, referred to here as the ‘38 Hz’ noise, is proposed. Some findings may provide an engineering foundation for the low-frequency aerodynamic noise reduction of high-speed trains. The overall structure of this paper is as follows: A brief introduction and analysis of the results of the full-scale test are given in Sect. 2. In Sect. 3, the numerical details and mechanism analysis are presented. The control methods and conclusions are given in Sects. 4 and 5, respectively.
Full-scale test
Problem description
When the high-speed train (being studied, here) is running at 350 km/h, the train attendant’s cabin near the windshield area is uncomfortable, due to low-frequency noise. Therefore, a series of experimental investigations are carried out, to analyze the characteristics and possible causes of this significant low-frequency noise.
Introduction to the test
The high-speed train consists of 8 units. The test was conducted in the train attendant’s cabin and windshield area, of the fifth and sixth cars. As shown in Fig. 1(a), a microphone (circular red mark, named S1), was placed at a height of 1.2 m above the floor in the middle of the train attendant’s cabin, to obtain the interior noise characteristics. Three surface microphones (triangular green marks, named N1, N2, and N3), were arranged on the outside of the carriage, one in the windshield cavity, and the other two on the roof and side wall, upstream of the windshield, to determine the characteristics of the aerodynamic excitation near the windshield. One accelerometer (rhomboid saffron yellow mark, named A1), was mounted on the exterior floor, above the bogie, to record the structural excitation characteristics. As shown in Fig. 1(b), four accelerometers (square blue marks, named V1, V2, V3, and V4), were mounted at the middle of the end wall, side wall, roof, and floor, to record the normal vibration acceleration characteristics. The test site photos are given in Fig. 1(c). Repeated tests were carried out, to ensure the repeatability of the test data. More information on the test equipment and settings can be found in Table 1. The layout of the experiment is consistent with the CFD calculation conditions, below.
Fig. 1.
Layout of measuring points on the full-scale train: (a) microphone measurement points; (b) acceleration measurement points; (c) test site photos.
Table 1.
Test equipment and settings.
| No. | Name | Type | Dyn. range | Freq. range |
|---|---|---|---|---|
| 1 | Data acquisition system | 3053-12/0 | – | 0–25.6 kHz |
| 2 | Free-field microphone | 4189-A-021 | 14.6–146 dB | 20–20 kHz |
| 3 | Surface microphone | 4948 | 55–160 dB | 5–20 kHz |
| 4 | Sound calibrator | 4231 | 94 and 114 dB | 1000 Hz |
| 5 | Accelerometer | 4507-002 | 7 g | 0.4–6000 Hz |
| 6 | Accelerometer | 4520 | 500 g | 2–7000 Hz |
Test results and analysis
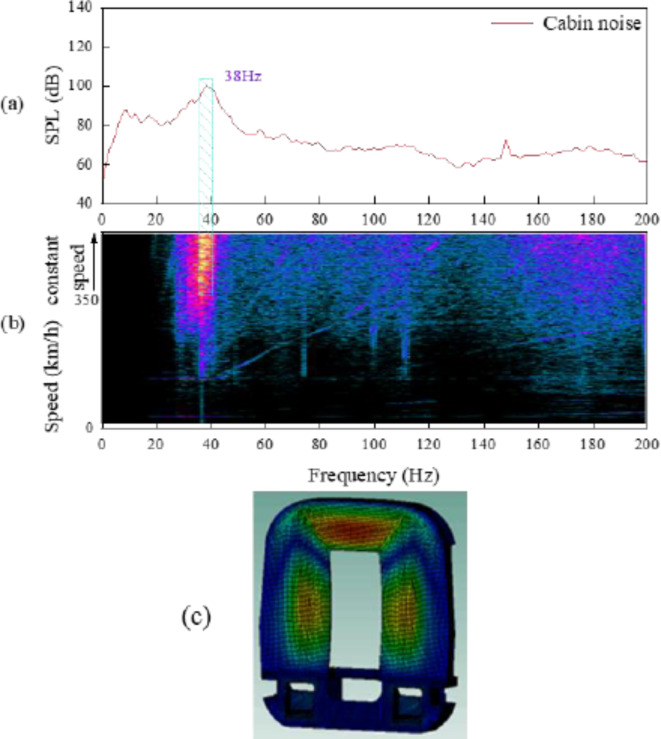
To facilitate the description of the indoor noise-distribution characteristics, a narrowband spectrogram of the interior noise of the train attendant’s cabin when running at a speed of 350 km/h, in the frequency range of 0–200 Hz, together with a noise time–frequency diagram of the train accelerating from 0 to 350 km/h, is presented in Fig. 2(a),(b), respectively. The reference pressure is 2 × 10− 5 Pa. (The reference pressure for all sound pressure level analyses below is 2 × 10− 5 Pa). Figure 2(a) shows that the interior noise of the train attendant’s cabin has a significant noise peak at 38 Hz, with a value that can be up to 100 dB. Figure 2(b) shows that speed-related frequency components can be observed. The slanted bright band in the diagram indicates that frequency components are affected by rotational speed, and are associated with rotating parts. The vertical bright band indicates the presence of natural frequency or forced excitation. Figure 2(b) also shows that while the train is accelerating, the interior noise gradually appears as a vertical bright band, near the frequency of 38 Hz. The closer the speed is to 350 km/h, the more obvious the vertical bright band near the frequency of 38 Hz, and the more prominent the noise energy. The vertical bright band at 38 Hz is not always present during acceleration, however. Therefore, we conclude that the significant low-frequency noise is caused by the forced excitation near 38 Hz.
Fig. 2.
Narrowband spectrum and time–frequency diagram of train attendant’s cabin. (a) Narrowband spectrogram of the interior noise; (b) Time–frequency diagram of the interior noise during the acceleration of the train from 0 to 350 km/h, where color represents noise amplitude (in dB); (c) The mode shape of the end wall at 38 Hz.
Also, It can be seen from Fig. 2(c), that there is no resonance in addition to forced vibration.
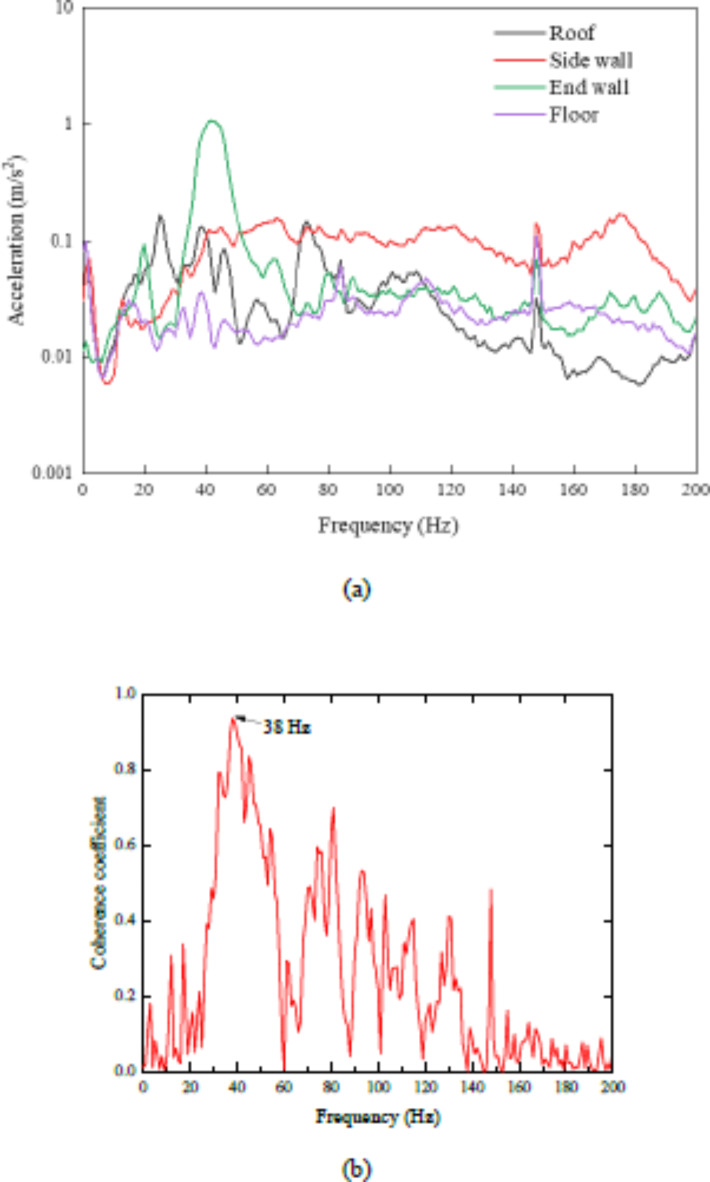
To investigate the source of the forced excitation at 38 Hz in the train attendant’s cabin, it was necessary to analyze the vibration characteristics of the train attendant’s cabin. As shown in Fig. 3, for the end wall of the room, there is a significant vibration near the frequency of 38 Hz, which corresponds to the interior noise shown in Fig. 2(a). Figure 3 also shows that the vibration frequency spectrum of the roof and floor also has a peak near 38 Hz, but the peak is not obvious, and the vibration amplitude is far less than that of the end wall. In addition, the side-wall vibration has no peak near the 38 Hz. Based on the above, we speculate that the significant interior noise, called ‘38 Hz’, is related to the end-wall vibration, depending on the train structure. The exact relationship between end-wall vibration and interior noise of the train attendant’s cabin cannot be determined only from the end-wall vibration spectrum, so the correlation between end-wall vibration and interior noise is determined by means of the constant coherence function. For a multi-input, single-output system, the constant coherence function between the ith input xi(t), and output y(t) can be obtained by formula (1) :
 |
1 |
Fig. 3.
(a) The vibration narrowband spectrogram of the cabin plate of the train running at 350 km/h, in the frequency range of 0–200 Hz. (b) Coherence coefficient between interior noise and end-wall acceleration.
where  is the cross-power spectrum of xi(t) and y(t),
  and
and  are the self-power spectra of the input xi(t) and output y(t), respectively.
Figure 3 shows the constant coherence function between interior noise and end-wall acceleration. It can be seen from the Fig. 3, that the coherence coefficient between interior noise and end-wall acceleration reaches 0.93 at 38 Hz. Therefore, there is a close correlation between interior noise of, and end-wall vibration of, the train attendant’s cabin, and the direct excitation source corresponding to the end-wall is the aerodynamic excitation in the windshield area. Therefore, it is necessary to carry out a coherence analysis of the excitation source of aerodynamic noise, and the interior noise of the train attendant’s cabin.
To further analyze the contribution of aerodynamic noise excitation in the windshield area, bogie area, and car body surface, to the noise in the interior of the train attendant’s cabin, it is first necessary to calculate the partial coherence function of each excitation signal, (excluding interference from other excitation signals), and the response signal. The partial coherence function can be calculated, according to Eq. (2). Then, the coherent output spectrum of each excitation signal and response signal can be calculated based on the partial coherence function, and the coherent output spectrum can be obtained, according to Eq. (3)23–25.
 |
2 |
 |
3 |
where  is the partial coherence coefficient between excitation signal xi(t) and response signal y(t), after removing the influence of the coherent part of x1(t), x2(t), ··· xi−1(t).
  is the cross-power spectrum of xi(t) and response signal y(t), after removing the influence of the coherent part of x1(t), x2(t), ··· xi−1(t) in xi(t).
  is the self-power spectrum in xi(t) that removes the influence of the coherent part of x1(t), x2(t), ··· xi−1(t).
  is the self-power spectrum of response signal y(t).
  is the coherent output spectrum of the excitation signal after removing other interference relative to the response signal y(t), and
  is the complex spectrum of the response signal y(t).
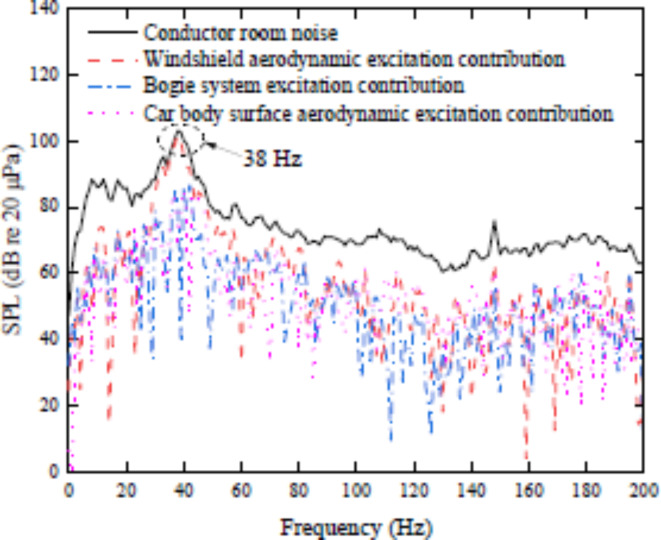
Figure 4 shows the coherent output spectrum of aerodynamic excitation in the windshield area, bogie area, and car body surface, relating to the interior noise of the train attendant’s cabin. It can be seen from Fig. 4, that the contribution of aerodynamic excitation in the windshield area of the train attendant’s cabin is far greater than that of the bogie area and car body surface, at 38 Hz. So, the ‘38 Hz’ significant interior noise of the train attendant’s cabin is mainly caused by aerodynamic excitation in the windshield area.
Fig. 4.
Coherent output spectrum of aerodynamic excitation to interior noise of train attendant’s cabin.
Numerical simulation
Model introduction and computational domain specification
To investigate the mechanism of the low-frequency aerodynamic excitation of 38 Hz in the windshield area, the numerical calculation model, illustrated in Fig. 5(a), was applied to the high-speed train. To reduce the use of computation resources, a train model with two cars and one car-connection part (windshield area), with the original outer windshield, shown in Fig. 5(b), was adopted under the premise that these simplifications do not affect the object being studied. As shown in Fig. 5(a), the width (W) and height (H) of the full-scale train model are 3.36 m and 4.05 m, respectively. The total length of the train is approximately 55 m, and the width of the car-connection part is 0.65 m. Since this study mainly focuses on the flow around the windshield area, some minor structures on the car body surface, and other unimportant parts, were omitted. As shown in Fig. 5(b), the outer windshield of the train has upper and lower openings, where the opening lengths in the flow direction are 0.39 m and 0.65 m, respectively. The positions of the fluctuating pressure measuring points in the train windshield region are shown in Fig. 5(c). The points are arranged in the opening area of the outer windshield, and in the internal area of the windshield cavity. As shown in Fig. 5(c), P1 represents the region upstream of the upper opening of the train outer windshield, P2 represents the interior of the train windshield cavity, corresponding to the N3 measuring point of the field test, and P3 represents the region upstream of the lower opening of the train outer windshield.
Fig. 5.
Computational model and layout of monitoring points: (a) Train model, (b) Outer windshield, (c) Schematic diagram of pressure monitoring points.
As shown in Fig. 6, a computational domain of length 45 H, width 16 H, and height 8 H, was created. The distances between the inlet and outlet boundaries of the computational domain and the train model are 8 H and 23.25 H, respectively, which meets the requirements of CEN European Standard 14067-426. The space between the train and the ground is approximately 0.08 H. To simulate the train running at a speed of 350 km/h, the inlet and outlet of the computational domain are defined as velocity in, with a speed of 350 km/h, and pressure out, with reference pressure of 0 Pa. The side and top of the computational domain are given symmetric boundary conditions. To model the relative movement between the train and the ground, the lower surface of the computational domain is set as a stationary wall with a slip speed of 350 km/h.
Fig. 6.
Computational domain and boundary conditions: (a) top, and (b) front views.
Mesh strategy
Mesh setting
FLUENT MESHING was used to create polyhedral cells, which were used to discretize the computational domain. To capture the turbulence information on the surface of the train more accurately, the region was encrypted, and ten prism layers were set on the surface of the train. The thickness of the first layer was 0.01 mm, and the growth ratio between layers was set to 1.2, so that the outermost prism layer would be well matched to the size of the outer hexahedral mesh in the polyhedral transition layer between the two main mesh structures. The boundary prism cells were designed such that the y + of the train was maintained at close to unity. In addition, an important point in the grid generation process is the local refinement of the windshield region, ensuring acceptable numerical accuracy of the results, at reduced computational cost. The total number of cells used exceeded 40 million. Figure 7 shows the grid structure around the car body and the windshield region.
Fig. 7.
Grid structure around the train and outer windshield.
Mesh sensitivity analysis
In order to verify that the current grid meets the requirement of grid independence, two sets of grids were further divided. The specific information is shown in Table 2.
Table 2.
Mesh sensitivity analysis.
| No. | First layer thickness/mm | Prismatic layer | Ratio | Total number of grids | Amplitude of sound pressure level of P1/dB |
|---|---|---|---|---|---|
| 1 | 0.01 | 8 | 1.2 | 3.6 × 10⁷ | 137.5 |
| 2 | 0.01 | 10 | 1.2 | 4.0 × 10⁷ | 139.2 |
| 3 | 0.005 | 16 | 1.1 | 5.1 × 10⁷ | 139.8 |
It can be seen from Table 2 that the second set of grids can meet the requirements of grid independence, such that the grids used in this paper can be used for subsequent computational analysis.
Numerical method and settings
To save computing resources and shorten computing time, both steady and unsteady calculations were used to solve the flow field around the train. The steady flow field was simulated by using the steady Reynolds averaged Navier–Stokes formulation with the SST k-ω turbulence model, the solution to which was regarded as the initial flow field of the unsteady calculation, which was then solved using a large eddy simulation (LES). For the unsteady calculation, the physical time step was 1.0 × 10− 5 s, using a minimum of 20 iterations per time step. Simulations were run until the residuals of each equation were less than 10− 4. The total physical time was 3.0 s, and the last 2.5 s of data were used for sampling. The main modeling schemes adopted for the computational fluid dynamic (CFD) simulations are summarized in Table 3.
Table 3.
Main modeling schemes adopted for the CFD simulations.
| Time dependency | Steady | Unsteady |
|---|---|---|
| Turbulence model | SST k-ω | LES |
| Solver | Pressure based | Pressure based |
| Pressure-velocity coupling | SIMPLEC | PISO |
| Pressure discretization | Standard | PRESTO! |
| Momentum discretization | Second-order upwind | Bounded central differencing |
| Turbulent kinetic energy dispersion | Second-order upwind | Second-order upwind |
| Turbulent dissipation rate dispersion | Second-order upwind | Second-order upwind |
Numerical results and discussion
Flow around the train is mainly turbulent, especially at the car-connection parts, where a large number of separate vortices are being shed27–31. To avoid this phenomenon, a windshield was used to deal with the transition between two adjacent cars. As the train is running, many periodic vortices will be shed from the edges of the openings of the original outer windshield. The shedding frequency can be calculated using Eq. (4)32. If the two opening lengths are 0.39 m and 0.65 m, the calculated shedding frequencies are 61.7 Hz and 37.0 Hz, respectively.
 |
4 |
where U∞ and L are the velocity of the incoming flow and the length of the opening in the flow direction, respectively. n is the mode number.
In addition, the car-connection cavity, surrounded by the inner and outer windshields, can be approximated as a Helmholtz resonant cavity (multiple necks), and the Helmholtz resonant frequency can be given by Eq. (5)33. Therefore, the natural frequency of the car-connection cavity in this study is approximately 40.3 Hz.
 |
5 |
where c is the speed of sound, An is the cross-sectional area of the nth opening, V0 is the static volume in the cavity, Lneq is the final modified equivalent neck length of the nth opening, LN is the actual neck length of the opening, and D is the hydraulic diameter of the opening.
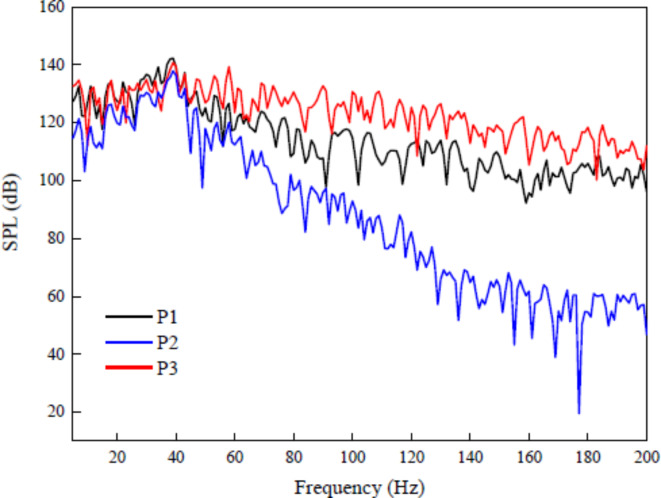
To find the low-frequency noise in the car-connection part, Fig. 8 shows the sound pressure level (SPL) monitoring points of P1, P2, and P3. (The locations of the monitoring points are defined in Fig. 5), within the frequency range of 0–200 Hz. The calculated SPL has significant noise peaks near 38 Hz and 62 Hz, which is in good agreement with one of the field tests, and the data predicted by Eq. (4). Figure 8 also shows that the noise value of the flow field around the lower opening (P3) is larger than that of upper opening (P1), in the high-frequency range. Combined with Fig. 9, it can be found that the cause of this phenomenon may be that vortex shedding from the bogie cabin, upstream of the lower opening, is disrupted by the trailing edge of the bogie cabin, resulting in a series of small vortices around the lower opening, which is the main contribution to the higher frequency noise. By using Eq. (4), the frequencies of shed vortices at the leading edges of the upper and lower openings were calculated to be approximately 61.7 Hz and 37.0 Hz, respectively. This phenomenon is also mostly consistent with the peak frequency shown in Fig. 8. Figure 9 also shows that vortices shed from the leading edges of the openings move downstream and hit the trailing edge of the openings, before breaking into two parts, which then flow into the car-connection cavity through both upper and lower openings, and interact with each other in the cavity, to generate strong aerodynamic excitation. This excitation then stimulates the Helmholtz resonance effect of the cavity, to generate the ‘38 Hz’ significant noise.
Fig. 8.
Narrowband spectrum of the pressure monitoring points in the windshield region.
Fig. 9.
Iso-surface of Q-criterion (Q = 10,000), colored by pressure, around the car-connection part (The graphics are generated by Fluent 2022 R1 post-processing software (https://www.ansys.com/products/fluids/ansys-fluent)).
Control method of ‘38 hz’ significant noise
Based on the above analysis, it was found that the ‘38 Hz’ significant interior noise is related to the shedding of vortices at the opening of the outer windshield, and the Helmholtz resonance effect of the windshield cavity. Accordingly, a control method for the ‘38 Hz’ significant interior noise is proposed, by changing the frequency of the vortex shedding from the opening, and hence the Helmholtz resonance frequency of the windshield cavity. In this section, two kinds of openings in the outer windshield were designed, to explore their effectiveness in suppressing the ‘38 Hz’ significant noise.
Model introduction and computational domain specification
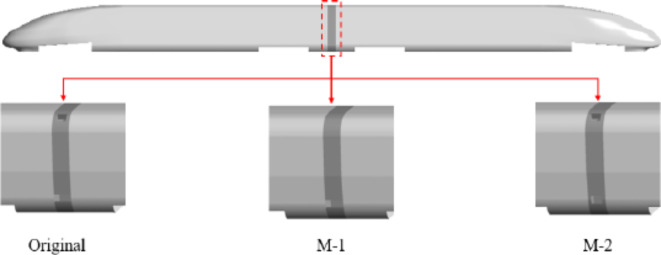
Considering that the frequency of vortex shedding from the openings on the outer windshields is determined by the length of the opening in the flow direction, the Helmholtz resonance frequency of the windshield cavity is also affected by the length in the flow direction, of the opening on the outer windshield. As shown in Fig. 10, the parameters of the opening on the original outer windshield are modified, to obtain two forms of outer windshield, named M-1 and M-2. More information, including key dimensions, is listed in Table 4. The effect of the outer windshield type on the low-frequency aerodynamic noise characteristics of the flow field in the car-connection region is compared and analyzed in the following part of this section.
Fig. 10.
Model components of the train and windshield.
Table 4.
Comparison table of three outer windshield parameters.
| Windshield type | Opening length in flow direction (m) | Helmholtz resonance frequency (Hz) | |
|---|---|---|---|
| Upper | Lower | ||
| Original | 0.39 | 0.65 | 40.3 |
| M1 | – | 0.65 | 30.3 |
| M2 | 0.39 | 0.39 | 35.2 |
As shown in Fig. 11, the main noise frequencies of the modified outer windshield (M-1 and M-2) are reduced to 30 Hz and 35 Hz, respectively, and the corresponding noise values are reduced by approximately 8 dB and 12 dB, respectively. Table 4 shows that the frequency of vortex shedding from the lower opening on the outer windshield M-1 is still approximately 37 Hz. Although M-1 has no upper opening, the corresponding Helmholtz resonance frequency is 30.3 Hz, which means that M-1 effectively impairs the vortex shedding and the resonance effect of the windshield cavity, so the amplitude is successfully reduced. For the outer windshield M-2, with an upper opening and small lower opening, the 37 Hz frequency of vortex shedding from the openings on the outer windshield disappears, and the Helmholtz resonance frequency of the M-2 windshield cavity is 35.2 Hz.
Fig. 11.
Comparison of narrowband spectrum of the pressure monitoring point (P2) located in the windshield cavity for the three forms of outer windshields.
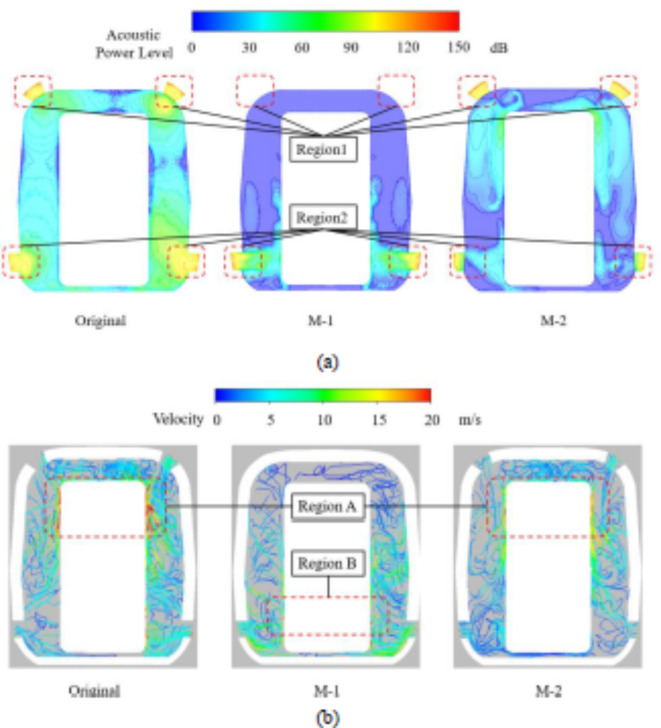
To further analyze the characteristics of sound pressure and flow field inside the three forms of outer windshield cavities, a cloud diagram of sound pressure distribution, and a flow diagram of the windshield cavity are presented in Fig. 12. Figure 12(a) shows that the main sound source is concentrated at both the upper and lower openings (corresponding to regions 1 and 2), on the original outer windshield. It can be seen from the left-hand side picture of Fig. 12(b), that the airflow enters the original windshield cavity from both the upper and lower openings, the airflow through the upper opening is directed onto the upper surface of the inner windshield at a fixed angle, and the velocity of the reflected airflow in region A reaches a maximum. The middle picture of Fig. 12(a) shows that the main sound source is concentrated at the lower opening (region 2) on the modified outer windshield M-1, and its sound pressure distribution at the lower opening is similar to that of the original outer windshield, probably because the length of the lower opening on M-1 is the same as that of the original outer windshield. The velocity of airflow around the lower opening on the outer windshield is reduced, which is mainly because of the restricted flow in the windshield cavity without an upper opening, where the airflow through the lower opening is still directed onto the lower surface of the inner windshield at a fixed angle, and the velocity of the reflected airflow in region B reaches a maximum. The right-hand side picture of Fig. 12(a) shows that the sound pressure distribution in the car-connection region for the M-2 outer windshield is similar to that of the original outer windshield. The main difference between them is the sound pressure level, especially in the lower opening (region 2). So, decreasing the length of the lower opening in the flow direction reduces the sound pressure level at region 2. As shown in the right-hand side picture of Fig. 12(b), the velocity of the airflow entering the windshield cavity from the upper opening is similar to that of the original outer windshield, but the airflow velocity around the lower opening on the outer windshield M-2 is significantly reduced, where the velocity of airflow still reaches the maximum at region A, but its value decreases. Based on the above analysis, it can be found that the upper opening is the main determinant of how the airflow can enter the windshield cavity. The effect of decreasing the length of the lower opening in the flow direction, is to reduce the airflow into the windshield cavity, reduce the sound pressure level, and reduce the velocity of airflow at the lower opening. The results show that both the M-1 and the M-2 outer windshields have good noise reduction effects, especially M-2, whose effect is greater.
Fig. 12.
Comparison of pressure distribution and streamlines: (a) sound pressure distribution diagram, (b) streamline diagram.
Test verification of the effect of the noise control method
An accurate numerical calculation was difficult to carry out for real operations. Therefore, a full-scale online test was still necessary. Although, based on the simulation prediction, the M-2 scheme has better noise reduction effect, it was not selected. This was because the actual use of the vehicle requires maintenance inspection of the car-connected shock absorber, such that the lower opening cannot be blocked. Instead, the M-1 scheme was chosen, as shown in Fig. 13. Then, the field test was carried out under the same test conditions as the original outer windshield, to verify the noise reduction effect of the M-1 scheme.
Fig. 13.
Photo of the full-scale train with the M-1 outer windshield scheme.
Figure 14 shows that the noise of the windshield cavity is significantly different in the frequency range 35–200 Hz, between the original scheme and the M-1 scheme. (detailed location indicated by N3 (N3 and P2 are consistent, N3 is the test measurement position, P2 is the numerical simulation position) in Fig. 1(a)) in Fig. 1(a)) Windshield cavity noise is reduced after modification, such that the dominant frequency decreases from 38 Hz to 36 Hz, and the corresponding noise value is reduced by approximately 7 dB, which is consistent with that predicted by the simulation. (detailed location indicated by S1 in Fig. 1(a)) Overall, the experimental results show that the M-1 outer windshield can effectively solve the problem of the ‘38 Hz’ significant low-frequency noise in the train attendant’s cabin, on a high-speed train.
Fig. 14.
The test results of noise with original and M-1 schemes.
Conclusions
In this study, the characteristics of a significant low-frequency interior noise (referred to as ‘38 Hz’), were investigated through field tests. A full-scale high-speed train numerical calculation model was established, to investigate the mechanism of the ‘38 Hz’ significant noise, and the influence of three kinds of outer windshield on the characteristics of this noise. Based on the numerical calculation results, a full-scale vehicle optimization scheme was proposed. Finally, the effectiveness of the optimization scheme was verified in a field test. The summary of the main results of this study are shown below:
The ‘38 Hz’ significant interior noise phenomenon is caused by excitation from the the aerodynamic noise in the windshield region. The ‘38 Hz’ aerodynamic excitation in the windshield region is related to the vortex shedding frequency at the lower opening of the outer windshield, and the Helmholtz resonance frequency of the windshield cavity. Changes in the opening parameters of the outer windshield will significantly affect the pressure distribution in the windshield region.
The simulation results show that the ‘38 Hz’ noise can be significantly reduced, relative to that of the original windshield structure, by closing the upper opening. The effectiveness of the above noise reduction windshield structure was verified by a full-scale test, the results of which show that the significant ‘38 Hz’ noise in the train attendant’s cabin near the windshield area, can be reduced by about 7 dB.
Electronic supplementary material
Below is the link to the electronic supplementary material.
Acknowledgements
This work is funded by the National Natural Science Foundation of China (U1934203).
Author contributions
Xinbiao Xiao was in charge of the whole trial; Jian Han, Jiqiang Niu and Zongfa Zhang assisted with simulation analysis; Xinbiao Xiao and Laixian Peng collected the test data; All authors read and approved the final manuscript.
Data availability
All data generated or analyzed during this study are included in this published article.
Declarations
Competing interests
The authors declare no competing interests.
Conflict of interest
We, the authors of this paper, certify that we have no affiliation with, or involvement in, any organization or entity with any financial interest, or nonfinancial interest in the subject matter or materials discussed in this manuscript.
Footnotes
Publisher’s note
Springer Nature remains neutral with regard to jurisdictional claims in published maps and institutional affiliations.
References
- 1.Talotte, C. Aerodynamic noise: a critical survey. J. Sound Vib. 231(3), 549–562 (2000). [Google Scholar]
- 2.Zhang, J., Xiao, X., Sheng, X. & Li, Z. Sound source localisation for a high-speed train and its transfer path to interior noise. Chin. J. Mech. Eng. 32(1), 1–16 (2019). [Google Scholar]
- 3.Li, T., Dai, Z., Yu, M. & Zhang, W. Numerical investigation on the aerodynamic resistances of double-unit trains with different gap lengths. Eng. Appl. Comput. Fluid Mech. 15(1), 549–560 (2021). [Google Scholar]
- 4.Thompson, D. J., Latorre Iglesias, E., Liu, X., Zhu, J. & Hu, Z. Recent developments in the prediction and control of aerodynamic noise from high-speed trains. Int. J. Rail Transp. 3(3), 119–150 (2015). [Google Scholar]
- 5.Zhang, J. et al. Characteristics of interior noise of a Chinese high-speed train under a variety of conditions. J. Zhejiang University-SCIENCE A. 18(8), 617–630 (2017). [Google Scholar]
- 6.Kitagawa, T. & Nagakura, K. Aerodynamic noise generated by Shinkansen cars. J. Sound Vib. 231(3), 913–924 (2000). [Google Scholar]
- 7.Noh, H. M., Choi, S., Hong, S. & Kim, S. W. Investigation of noise sources in high-speed trains. Proc. Institution Mech. Eng. Part. F-Journal Rail Rapid Transit. 228(3), 307–322 (2014). [Google Scholar]
- 8.Lauterbach, A., Ehrenfried, K., Loose, S. & Wagner, C. Microphone array wind tunnel measurements of Reynolds number effects in high-speed train aeroacoustics. Int. J. Aeroacoustics. 11(3–4), 411–446 (2012). [Google Scholar]
- 9.Mizushima, F., Takakura, H., Kurita, T., Kato, C. & Iida, A. Experimental investigation of aerodynamic noise generated by a train-car gap. J. Fluid Sci. Technol. 2(2), 464–479 (2007). [Google Scholar]
- 10.Yamazaki, N. & Takaishi, T. Wind tunnel tests on reduction of aeroacoustic noise from car gaps and bogie sections. Q. Rep. RTRI. 48(4), 229–235 (2007). [Google Scholar]
- 11.Suzuki, M., Nakade, K. & Ido, A. Countermeasures for reducing unsteady aerodynamic force acting on high-speed train in tunnel by use of modifications of train shapes. J. Mech. Syst. Transp. Logistics. 2(1), 1–12 (2009). [Google Scholar]
- 12.Huang, Z., Chen, L. & Jiang, K. Influence of length of train formation and vestibule diaphragm structure on aerodynamic drag of high speed train model. J. Experiments Fluid Mech. 26(5), 36–41 (2012). [Google Scholar]
- 13.Liang, X. & Shu, X. Numerical simulation research on train aerodynamic drag affected by the train windshield. J. China Railway Soc. 25(1), 34–37 (2003). [Google Scholar]
- 14.Niu, J., Wang, Y. & Zhou, D. Effect of the outer windshield schemes on aerodynamic characteristics around the car-connecting parts and train aerodynamic performance. Mech. Syst. Signal Process. 130, 1–16 (2019). [Google Scholar]
- 15.Yang, J. et al. Influence of inter-car wind-shield schemes on aerodynamic performance of high-speed trains. J. China Railway Soc. 34(11), 29–35 (2012). [Google Scholar]
- 16.Xia, Y. et al. Aerodynamic effects of the gap spacing between adjacent vehicles on wind tunnel train models. Eng. Appl. Comput. Fluid Mech. 14(1), 835–852 (2020). [Google Scholar]
- 17.Tang, M., Xiong, X. & Zhong, M. Influence of installation spacing of external vestibule diaphragm of high-speed train on aerodynamic characteristics of the vestibule diaphragm. J. Railway Sci. Eng. 16(4), 850–859 (2019). [Google Scholar]
- 18.Li, X. et al. Dynamic analysis of the flow fields around single-and double-unit trains. J. Wind Eng. Ind. Aerodyn. 188, 136–150 (2019). [Google Scholar]
- 19.Choi, S. H., Park, C. S., Park, J. H. & Kim, S. S. Experimental investigation of noise generation from the inter-coach spacing of a high-speed train. J. Korean Soc. Railway. 10(6), 786–791 (2007). [Google Scholar]
- 20.Li, H., Xiao, X., Zhu, M. & Jin, X. Analysis on aerodynamic noise in inter-coach space of high-speed train. J. Vib. Shock. 35(6), 109–114 (2016). [Google Scholar]
- 21.Dai, W. et al. Aerodynamic noise radiating from the inter-coach windshield region of a high-speed train. J. Low Freq. Noise Vib. Act. Control. 37(3), 590–610 (2018). [Google Scholar]
- 22.Qian, K. et al. Evaluation and optimization of sound quality in high-speed trains. Appl. Acoust. 174, 107830 (2021). [Google Scholar]
- 23.Wang, D., Guo, J., Xiao, X. & Sheng, X. CSA-based acoustic beamforming for the contribution analysis of air-borne tyre noise. Mech. Syst. Signal Process. 166, 108409 (2022). [Google Scholar]
- 24.Chu, Z. & Yang, Y. Comparison of deconvolution methods for the visualization of acoustic sources based on cross-spectral imaging function beamforming. Mech. Syst. Signal Process. 48, 404–422 (2014). [Google Scholar]
- 25.Kompella, M. S., Davies, P., Bernhard, R. J. & Ufford, D. A. A technique to determine the number of incoherent sources contributing to the response of a system. Mech. Syst. Signal Process. 8(4), 363–380 (1994). [Google Scholar]
- 26.CEN European Standard 14067-4. C. E. S., Railway applications-aerodynamics, Part 4: Requirements and test procedures for aerodynamics on open track, (2010).
- 27.Niu, J., Zhou, D., Liu, T. & Liang, X. Numerical simulation of aerodynamic performance of a couple multiple units high-speed train. Veh. Syst. Dyn. 55(5), 681–703 (2017). [Google Scholar]
- 28.Niu, J., Zhou, D. & Liang, X. Numerical simulation of the effects of obstacle deflectors on the aerodynamic performance of stationary high-speed trains at two yaw angles. Proc. Institution Mech. Eng. Part. F-Journal Rail Rapid Transit. 232(3), 913–927 (2018). [Google Scholar]
- 29.Zhu, J. & Hu, Z. Flow between the train underbody and trackbed around the bogie area and its impact on ballast flight. J. Wind Eng. Ind. Aerodyn. 166, 20–28 (2017). [Google Scholar]
- 30.Xia, C., Wang, H., Bao, D. & Yang, Z. Unsteady flow structures in the wake of a high-speed train. Exp. Thermal Fluid Sci. 98, 381–396 (2018). [Google Scholar]
- 31.Bell, J. R., Burton, D., Thompson, M. C., Herbst, A. H. & Sheridan, J. The effect of tail geometry on the slipstream and unsteady wake structure of high-speed trains. Exp. Thermal Fluid Sci. 83, 215–230 (2017). [Google Scholar]
- 32.Blevins, R. D. Flow-induced vibration, New York, (1977).
- 33.Cabral, D. F. A. & Thesis, M. S. Helmholtz Resonator with Multi-Perforated Plate. Doctoral dissertation, Instituto Superior Tecnico, Universidade Tecnica de Lisboa, Portugal, (2016).
Associated Data
This section collects any data citations, data availability statements, or supplementary materials included in this article.
Supplementary Materials
Data Availability Statement
All data generated or analyzed during this study are included in this published article.


