

Abstract
Purpose
In the context of precision medicine, radiomics has become a key technology in solving medical problems. For adenocarcinoma of esophagogastric junction (AEG), developing a preoperative CT-based prediction model for AEG invasion and lymph node metastasis is crucial.
Methods
We retrospectively collected 256 patients with AEG from two centres. The radiomics features were extracted from the preoperative diagnostic CT images, and the feature selection method and machine learning method were applied to reduce the feature size and establish the predictive imaging features. By comparing the three machine learning methods, the best radiomics nomogram was selected, and the average AUC was obtained by 20 repeats of fivefold cross-validation for comparison. The fusion model was constructed by logistic regression combined with clinical factors. On this basis, ROC curve, calibration curve and decision curve of the fusion model are constructed.
Results
The predictive efficacy of fusion model for tumour invasion depth was higher than that of radiomics nomogram, with an AUC of 0.764 vs. 0.706 in the test set, P < 0.001, internal validation set 0.752 vs. 0.697, P < 0.001, and external validation set 0.756 vs. 0.687, P < 0.001, respectively. The predictive efficacy of the lymph node metastasis fusion model was higher than that of the radiomics nomogram, with an AUC of 0.809 vs. 0.732 in the test set, P < 0.001, internal validation set 0.841 vs. 0.718, P < 0.001, and external validation set 0.801 vs. 0.680, P < 0.001, respectively.
Conclusion
We have developed a fusion model combining radiomics and clinical risk factors, which is crucial for the accurate preoperative diagnosis and treatment of AEG, advancing precision medicine. It may also spark discussions on the imaging feature differences between AEG and GC (Gastric cancer).
Supplementary Information
The online version contains supplementary material available at 10.1186/s12880-025-01777-z.
Keywords: Adenocarcinoma of esophagogastric junction (AEG), Fusion model, Radiomics nomogram, Serous invasion, Lymph node metastasis, Prediction
Introduction
Adenocarcinoma of esophagogastric junction (AEG) has been increasing obviously in recent years [1, 2]. AEG has been defined as an independent disease located at the esophagogastric junction within the range of 5 cm in both directions [3]. Due to its unique pathogenesis and biological characteristics, the 5-year overall survival (OS) of advanced AEG is less than 30% [4]. In the diagnosis of AEG, the tumour node metastasis (TNM) staging system remains the most widely accepted risk stratification system and is used for subsequent treatment planning and prognostic assessment [5, 6]. Among its components, tumour invasion depth (T staging) is closely associated with the prognosis and biological characteristics of AEG, as it represents the depth of tumour invasion [7], while lymph node metastasis (N staging) is a key factor in treatment decision-making [8]. Studies had shown that treatment strategies vary for AEG patients at different stages [8, 9]. Therefore, accurately assessing tumour invasion depth and lymph node metastasis in AEG patients is very important for treatment and prognosis.
Currently, computed tomography (CT), endoscopic ultrasound (EUS), magnetic resonance imaging (MRI), and positron emission tomography (PET-CT) are used to assess the clinical TNM stage of AEG patients [10, 11]. However, these imaging techniques have inevitable limitations in evaluating TNM staging. Previous studies have shown that there is a difference between preoperative TNM staging inferred solely from image scanning and postoperative pathological staging, which may affect treatment decisions [12]. Another study noted that it was difficult for the naked eye to distinguish between involved and uninvolved lymph nodes on CT images alone [13]. MRI had poor judgement ability for N stage [14].
Recently, radiomics has emerged as an emerging approach to tumour analysis and prediction that shows great promise in oncology practice [15, 16]. A retrospective study had demonstrated the great potential of radiomics in predicting lymph node metastasis in gastric cancer (GC) [17]. Another study had developed models for assessing the risk of lymph node metastasis in GC by extracting radiomics from tumour regions [18]. Machine learning methods such as Logistic Regression (LR), Support Vector Machines (SVM), and eXtreme Gradient Boosting (XGBoost) have been shown to play a crucial role in feature extraction and selection. By incorporating regression analysis and survival analysis, the quantitative relationship between predictive models and clinical outcomes can be further clarified. Model fusion is a technique that enhances overall performance by integrating parameters or predictive outcomes from multiple models. Its core principle lies in leveraging the strengths of different models to compensate for the limitations of a single model. In the study by Yang et al. [19] a fusion model was employed to integrate multi-source information, including radiomics features, deep learning features, and clinical characteristics. This integration not only improved model stability and reliability but also enabled precise prediction of postoperative recurrence in gastric cancer patients undergoing radical resection. However, to our knowledge, no previous study of radiomics for predicting the preoperative stage of AEG has been reported.
The aim of this study was to develop and validate CT-based fusion model that combines radiomics and clinical characteristic risk factors for individual preoperative prediction of tumour invasion depth (T stage) and lymph node metastasis (N stage) in AEG patients.
Methods
Patients
We retrospectively analysed 202 AEG patients who underwent radical gastrectomy at a medical centre from January 2016 to December 2020. A random allocation of the training set and the test set (ratio 3:1) was used to divide 152 patients into the training cohort and 50 patients into the internal validation cohort. In addition, 54 AEG patients who meeting the criteria at another medical centre during the same period were collected as the external validation group. The inclusion criteria of the patients in this study included (1) radical surgery; (2) primary AEG confirmed by postoperative pathological examination; (3) D2 dissection of lymph nodes and above; (4) complete CT image data and clinicopathologic data; (5) patients without preoperative treatment before surgery; (6) CT with abdominal contrast was performed one week before surgery. The exclusion criteria of the patients in this study included the following: (1) incomplete palliative surgery or surgical dissection; (2) postoperative pathological findings of squamous cell carcinoma; (3) the centre of the tumour lesion was more than 5 cm away from the dentate line; (4) clinicopathologic or preoperative imaging data were missing (As shown in Fig. S1).
Baseline clinicopathological data were collected, including age, sex, weight, height, nerve invasion, vascular tumour thrombus, maximum diameter, differentiation degree, and levels of pretreatment tumour markers (CEA, CA199, CA125, AFP, CA242, and CA724). According to the AJCC/UICC 8th Edition TNM staging criteria, the TNM stage was confirmed via pathological evaluation. T3/T4 were defined as serous infiltration; N1/N2/N3 were defined as lymph node metastases. All patients gave informed consent. The study was approved by the ethics committees of all participating centres (IRB-2022-371). The study was conducted in accordance with the principles of the Declaration of Helsinki.
Tumour segmentation
All patients underwent enhanced CT examination within one week before surgery. Tumour segmentation was performed by two experienced radiologists using ITK-SNAP software (version 3.8, http://www.itksnap.org) (Fig. S2). Both radiologists have more than ten years of clinical image reading and diagnostic experience, and have interpreted over 3,000 standardized GC imaging cases, meeting the diagnostic qualification standards for gastrointestinal tumour outlined in international guidelines. Because AEG can be distinguished from normal gastric tissue in portal venous phase CT images, three sections were delineated along the boundary of the tumour in portal venous phase CT images, including the largest 2D section of the tumour and its two nearest sections along the z-axis. To ensure the stability of the delineation, 20 cases were randomly selected through a “random number table method” and then drawn regions of interest (ROIs) by two radiologists. Features were then extracted from these ROIs, the intraclass correlation coefficient ICC (inter-rater agreement, with a threshold of 0.8) was calculated to evaluate the consistency of measurement results of the same data by different observers to select stable radiomics features. For the rest of the images, two radiologists were responsible for reading each half of the images; when there was a dispute about the division of the ROI, further discussion was conducted to reach a consensus.
Image feature extraction and data collection
The flow chart of radiomics analysis in this study is shown in Fig. 1, including delineation and segmentation of the ROI region, feature extraction and screening, and model construction and evaluation. All medical images underwent standardized preprocessing prior to radiomic feature extraction. The preprocessing pipeline consisted of the following key steps: First, in-plane image resolution was standardized to 1.0 × 1.0 mm² isotropic voxels (resampledPixelSpacing: [1.0, 1.0, 0]) using cubic B-spline interpolation (sitkBSpline). For tumour characterization, we systematically identified and analyzed the axial 2D slice containing the maximal tumour cross-sectional area, ensuring both clinical relevance and optimal feature stability. All subsequent analyses were strictly constrained to two-dimensional planes (force2D: True) to eliminate potential biases arising from interslice resolution variations. This study used the Deepwise multimodal scientific research platform (https://keyan.deepwise.com) for radiomics feature extraction, including shape features, first-order features, and texture features (GLCM, GLRLM, GLSZM, GLDM, NGTDM). Logarithm, Gradient, Square, SquareRoot and Wavelet were applied to the original features. A total of 1,288 features are extracted. Due to the large differences in the order of magnitude between different radiomics features, the z score [Z = (X − mean)/SD] method was used to standardize the features. A consistency test was conducted on the extracted radiomics features to further construct the model to retain robust radiomics features, and 879 features were obtained with ICC > 0.8.
Fig. 1.

Flow chart of image radiomics analysis. The intraclass correlation coefficient ICC (inter-rater agreement) was calculated to evaluate the consistency of measurement results to select stable radiomics features
Model construction and evaluation
We employed a nested fivefold cross-validation strategy, randomly partitioning the data into five subsets - four combined folds for training and one reserved fold for testing. Feature selection was performed independently in each iteration. First, features were screened using ICC analysis, followed by Spearman correlation and mutual information methods on the training set to identify the top 50 features for modeling. For hyperparameter optimization, fivefold cross-validation and grid search was applied within the training set. To ensure robust evaluation, the entire outer cross-validation process was repeated 20 times. We compared three machine learning models—LR, SVM and XGBoost—selecting the optimal model and hyperparameters based on performance. Model evaluation was conducted on the test set, with metrics including AUC, sensitivity, specificity, and accuracy. After completing all folds of each cross-validation round, every data point had been used exactly once for performance evaluation, thereby providing comprehensive assessment coverage across the entire dataset. The mean values across 20 repetitions served as the model’s performance metrics. From the candidate machine learning algorithms, we selected the optimal radiomics classifier demonstrating maximal AUC performance.
This construction and evaluation strategy was applied to predict both T and N stages. In each fivefold cross-validation iteration, we selected the optimal model from the five sub-models based on its validation fold performance (evaluated by AUC). This selected model was then evaluated on both internal and external validation datasets. After 20 iterations, we calculated mean performance metrics and generated ROC curves based on the mean AUC.
Furthermore, we developed the fusion model development with three key steps: (a) selection of significant clinical variables through univariate/multivariate analyses, (b) integration with radiomics probability scores, and (c) logistic regression modeling. Performance comparison against the radiomics model was based on 20-repetition averaged results.
To further guide clinical application, we selected the optimal result from one iteration of the fivefold cross-validation in the fusion model to construct the nomogram. The nomogram can visually display different parameters and their corresponding scores, with the total risk score calculated by summing individual parameter scores. In addition, a calibration curve was used to evaluate the calibration degree of the model, and decision curve analysis was used to compare the net benefits of the fusion model and radiomics model under different threshold probabilities to evaluate its clinical application value. The model construction and evaluation were performed using R software (version 4.2.2).
Statistical analysis
Statistical tests were conducted using R language (version 4.2.2), continuous variables are expressed as the mean ± standard deviation or median ± quartile, and categorical variables are expressed as the frequency and percentage. For clinical characteristics between the two groups of patients, univariate analysis was used for comparison. For continuous variables, the Kolmogorov‒Smirnov test was first used. The independent sample t-test was used with a normal distribution, and the Mann‒Whitney U test was used with a non-normal distribution. The Chi-square test or Fisher’s exact probability test was used to categorical variables. Univariate analysis and logistic regression with were applied for clinic characters. For the AUC, sensitivity, specificity and accuracy of the radiomics nomogram and fusion model, the Mann‒Whitney U test was used to compare the differences. R language was used to draw ROC curves, calibration curves, decision curves and nomogram. The ‘pROC’ package was used for ROC curves, the ‘RMS’ package was used for calibration curves and nomogram, and the ‘rmda’ package was used for decision curves. A bilateral test was used in all the comparisons, and P < 0.05 was considered to be statistically significant.
Results
Clinical characteristics
A total of 202 AEG patients from a medical centre were randomly divided into a training cohort (n = 152) and an internal validation cohort (n = 50), and 54 AEG patients from another medical centre were used as the external validation cohort. The demographic data and clinical data of the 3 groups are shown in Table S1. A rigorous enrolling screening process was performed to ensure that the baseline of enrolled patients was consistent. In training cohort, univariate and multivariate methods were selected to evaluate the independent clinical predictors of tumour invasion depth and lymph node metastasis, respectively.
Univariate and multivariate analyses of clinicopathological variables
Univariate analysis showed that nerve invasion, differentiation degree, tumour length, tumour secondary length, tumour short diameter were clinical risk factors for tumour invasion depth (Table 1). Further multivariate analysis showed that tumour length and nerve invasion were independent predictors of AEG invasion depth (Table 1).
Table 1.
Univariate and multivariate analysis of tumour invasion depth
| Variables | T1/T2 | T3/T4 | Univariate | Multivariate | ||
|---|---|---|---|---|---|---|
| N = 55 | N = 97 | P | OR | 95%CI | P | |
| Sex (%) | ||||||
| Male | 47 (85.5) | 82 (84.5) | 1 | |||
| Female | 8 (14.5) | 15 (15.5) | ||||
| Vascular tumour thrombus (%) | ||||||
| Negative | 50 (90.9) | 75 (77.3) | 0.059 | |||
| Positive | 5 (9.1) | 22 (22.7) | ||||
| Nerve invasion (%) | ||||||
| Negative | 49 (89.1) | 66 (68.0) | 0.007 | 3.238 | 1.298–9.282 | 0.017 |
| Positive | 6 (10.9) | 31 (32.0) | ||||
| Differentiation (%) | ||||||
| Low | 8 (14.6) | 31 (32.0) | 0.030 | |||
| Low-Medium | 29 (52.7) | 44 (45.4) | ||||
| Medium | 18 (32.7) | 18 (18.6) | ||||
| Medium-High | 0 (0.0) | 4 (4.1) | ||||
| Height (cm), median [IQR] | 165.00 [162.00, 170.00] | 165.00 [160.00, 170.00] | 0.471 | |||
| Weight (kg), (mean ± SD) | 62.60 (10.62) | 61.64 (10.08) | 0.581 | |||
| Age (year), median [IQR] | 66.00 [60.00, 70.00] | 66.00 [58.00, 70.00] | 0.698 | |||
| Tumour length (cm), median [IQR] | 4.80 [2.75, 5.50] | 5.25 [4.00, 7.00] | 0.005 | 1.231 | 1.048–1.474 | 0.016 |
| Tumour secondary length (cm), median [IQR] | 3.50 [2.00, 4.90] | 4.00 [3.00, 5.50] | 0.023 | |||
| Tumour short diameter (cm), median [IQR] | 1.00 [0.80, 1.50] | 1.30 [1.00, 1.50] | 0.011 | |||
| CEA, median [IQR] | 2.74 [1.69, 5.06] | 3.25 [1.83, 10.24] | 0.243 | |||
| CA19-9, median [IQR] | 13.87 [7.59, 34.24] | 20.18 [8.78, 114.31] | 0.186 | |||
| CA125, median [IQR] | 12.90 [8.55, 17.25] | 12.80 [9.00, 16.60] | 0.878 | |||
| AFP, median [IQR] | 2.50 [1.76, 3.80] | 2.65 [2.07, 6.44] | 0.175 | |||
| CA242, median [IQR] | 4.55 [2.80, 9.30] | 5.05 [3.06, 16.31] | 0.542 | |||
| CA72-4, median [IQR] | 2.72 [1.32, 4.20] | 2.77 [1.42, 10.82] | 0.182 | |||
Using the same method, univariate analysis showed that tumour vascular thrombus, nerve invasion, tumour length, tumour secondary length, tumour short diameter, CEA were clinical risk factors for lymph node metastasis (Table 2). Meanwhile, multivariate analysis showed that tumour length and tumour vascular thrombus were independent predictors of AEG lymph node metastasis (Table 2).
Table 2.
Univariate and multivariate analysis of lymph node metastasis
| Variables | N0 | N1/N2/N3 | Univariate | Multivariate | ||
|---|---|---|---|---|---|---|
| N = 48 | N = 104 | P | OR | 95%CI | P | |
| Sex (%) | ||||||
| Male | 41 (85.4) | 88 (84.6) | 1 | |||
| Female | 7 (14.6) | 16 (15.4) | ||||
| Vascular tumour thrombus (%) | ||||||
| Negative | 47 (97.9) | 78 (75.0) | < 0.001 | 11.291 | 2.188-207.284 | 0.021 |
| Positive | 1 (2.1) | 26 (25.0) | ||||
| Nerve invasion (%) | ||||||
| Negative | 43 (89.6) | 72 (69.2) | 0.012 | |||
| Positive | 5 (10.4) | 32 (30.8) | ||||
| Differentiation (%) | ||||||
| Low | 8 (16.7) | 31 (29.8) | 0.150 | |||
| Low-Medium | 23 (47.9) | 50 (48.1) | ||||
| Medium | 15 (31.2) | 21 (20.2) | ||||
| Medium-High | 2 (4.2) | 2 (1.9) | ||||
| Height (cm), median [IQR] | 165.00 [160.00, 170.00] | 166.00 [160.75, 170.00] | 0.608 | |||
| Weight (kg), (mean ± SD) | 64.02 (11.70) | 61.05 (9.43) | 0.097 | |||
| Age (year), median [IQR] | 65.50 [57.75, 70.00] | 66.00 [59.00, 70.00] | 0.975 | |||
| Tumour length (cm), median [IQR] | 4.00 [2.50, 5.00] | 5.50 [4.00, 7.00] | < 0.001 | 1.446 | 1.186–1.816 | 0.001 |
| Tumour secondary length (cm), median [IQR] | 3.00 [2.00, 4.73] | 4.02 [3.00, 5.12] | < 0.001 | |||
| Tumour short diameter (cm), median [IQR] | 1.00 [0.80, 1.50] | 1.30 [1.00, 1.50] | 0.011 | |||
| CEA, median [IQR] | 0.00 [0.00, 0.00] | 4.00 [2.00, 8.00] | < 0.001 | |||
| CA19-9, median [IQR] | 3.02 [1.92, 9.50] | 2.94 [1.71, 8.51] | 0.891 | |||
| CA125, median [IQR] | 14.06 [7.60, 33.34] | 20.30 [8.62, 129.22] | 0.129 | |||
| AFP, median [IQR] | 12.25 [8.40, 16.38] | 12.85 [9.17, 17.67] | 0.377 | |||
| CA242, median [IQR] | 2.30 [1.80, 3.10] | 2.70 [2.07, 5.61] | 0.080 | |||
| CA72-4, median [IQR] | 4.54 [2.71, 8.08] | 5.12 [2.94, 15.45] | 0.371 | |||
Radiomics nomogram Building and evaluation
To ensure the stability of the radiomics features, a consistency test was conducted on the extracted radiomics features, the features with ICC > 0.8 were retained, and 879 characteristics were preliminarily obtained. The nested fivefold cross-validation method was used to further screen features in each cycle, and Spearman correlation analysis and mutual information algorithm were adopted on the training data set to obtain the most important 50 features for subsequent modelling. In this study, three machine learning methods, including LR, SVM and XGB, were established using a fivefold cross-validation strategy, and their performance in predicting the depth of tumour invasion and lymph node metastasis was evaluated on the test set.
According to the fivefold cross-validation results of the training folds (Figs. S3A and S3B) and the test folds (Figs. S3C and S3D) in the data set, LR was selected as the algorithm of the T staging prediction model, with AUCs: LR 0.706 (95% CI, 0.698–0.715), SVM 0.643 (95% CI, 0.583–0.680) and XGB 0.656 (95% CI, 0.5933-0.710) (Table S2). In addition, SVM was selected as the algorithm for the N staging prediction model, with AUCs: LR 0.698 (95% CI, 0.665–0.724), SVM 0.732 (95% CI, 0.669–0.785) and XGB 0.702 (95% CI, 0.639–0.752) (Table S3). The final model was verified with internal and external cohorts, and the results showed satisfactory consistency. Their corresponding performance results and comparisons were summarized in Table S4, Figs. S3E and S3F.
Construction and validation of a fusion model to predict T stage
Independent predictors of the depth of tumour invasion (T stage) were combined with the radiomics nomogram. A fusion model was developed to predict T stage, which included radiological score, tumour length and nerve invasion as independent predictors (Fig. 2A).
Fig. 2.

Development and validation of fusion model for predicting T stage. Fusion model of T stage prediction based on radiomics features and clinical factors (A). Calibration curve for predicting the depth of tumour invasion in training folds (B) and test folds (C), internal validation cohort (D) and external validation cohort (E). The diagonal line represents the performance of ideal model, and the red line represents the consistency between the built model and the actual model
The calibration curve of the fusion model, which predicted T stage, showed strong agreement between the model in the training folds (Fig. 2B), the test folds (Fig. 2C), the internal validation cohort (Fig. 2D) and the external validation cohort (Fig. 2E). Figure 3 shows the ROC curve comparing the performance of the radiomics nomogram and fusion model at depth of tumour invasion in four cohorts. In the training folds (Fig. 3A), the AUC of the radiomics nomogram was 0.761 (95% CI: 0.748–0.788) and that of the fusion model was 0.816 (95% CI: 0.807–0.836). In the test folds (Fig. 3B), the AUC of the radiomics nomogram was 0.706 (95% CI: 0.698–0.715). The AUC of the fusion model was 0.764 (95% CI: 0.739–0.786). In the internal validation cohort (Fig. 3C), the AUC of the radiomics nomogram was 0.697 (95% CI: 0.675–0.710), that of fusion model was 0.752 (95% CI: 0.730–0.764). In the external validation cohort (Fig. 3D), the AUC of the radiomics nomogram was 0.687 (95% CI: 0.678–0.699), the AUC of fusion model was 0.756 (95% CI: 0.747–0.769). The efficacy of the fusion model was significantly greater than that of the radiomics nomogram (P < 0.001), as observed in the results in four cohorts (Table S5).
Fig. 3.

Comparison of ROC curves analysis of the model for predicting T stage in four cohorts. ROC curves of radiomics nomogram, clinic model and fusion model in training folds (A), test folds (B), internal validation cohort (C) and external validation cohort (D)
Construction and validation of a fusion model to predict N stage
Independent predictors of the lymph node metastasis (N stage) were combined with the radiomics nomogram. A fusion model was developed to predict the N stage, which included radiological score, tumour length, and vascular cancer thrombus as independent predictors (Fig. 4A).
Fig. 4.

Development and validation of fusion model for predicting N stage. Fusion model of N stage prediction based on radiomics features and clinical factors (A). Calibration curve for predicting the lymph node metastasis in training folds (B), test folds (C), internal validation cohort (D) and external validation cohort (E). The diagonal line represents the performance of ideal model, and the red line represents the consistency between the built model and the actual model
The calibration curves of the fusion model for predicting N stage in the training folds (Fig. 4B), the test folds (Fig. 4C), the internal validation cohort (Fig. 4D) and the external validation cohort (Fig. 4E) show strong consistency. Figure 5 shows the ROC curve comparing the performance of the radiomics nomogram and the fusion model at lymph node metastasis in the four cohorts. In the training folds (Fig. 5A), the AUC of the radiomics nomogram was 0.867 (95% CI: 0.710–0.932) and that of the fusion model was 0.914 (95% CI: 0.900-0.939). In the test folds (Fig. 5B), the AUC of the radiomics nomogram was 0.732 (95% CI: 0.669–0.785) and that of the fusion model was 0.809 (95% CI: 0.785–0.828). In the internal validation cohort (Fig. 5C), the AUC was 0.718 (95% CI: 0.644–0.752) for radiomics nomogram and 0.841 (95% CI: 0.810–0.857) for fusion model. In the external validation cohort (Fig. 5D), the AUC was 0.680 (95% CI: 0.601–0.722) for radiomics nomogram and 0.801 (95% CI: 0.777–0.861) for fusion model. In all four cohorts, there was a significant difference in the efficacy of the fusion model and that of the radiomics nomogram (P < 0.001) (Table S6).
Fig. 5.

Comparison of ROC curves analysis of the model for predicting N stage in four cohorts. ROC curves of radiomics nomogram, clinic model and fusion model in training folds (A), test folds (B), internal validation cohort (C) and external validation cohort (D)
Correlation analysis and clinical utility analysis of fusion models
Figure S4 shows the correlation analysis between radiomics and clinical variables in the fusion model. The results showed that the correlations were all lower than 0.3, so there was no need to worry about collinearity (Tables S7 and S8). Additionally, we conducted a correlation analysis on the three most important radiomics features and clinical features in the model and found that they have low correlation. Therefore, the predictive performance of radiomics features and clinical features is complementary. The clinical decision curves show that the fusion model for predicting T stage (Fig. 6A) and the fusion model for predicting N stage (Fig. 6B) will all provide a net benefit over the “treat all” or “treat none” options. The fusion model showed a higher net benefit than the radiomics nomogram.
Fig. 6.
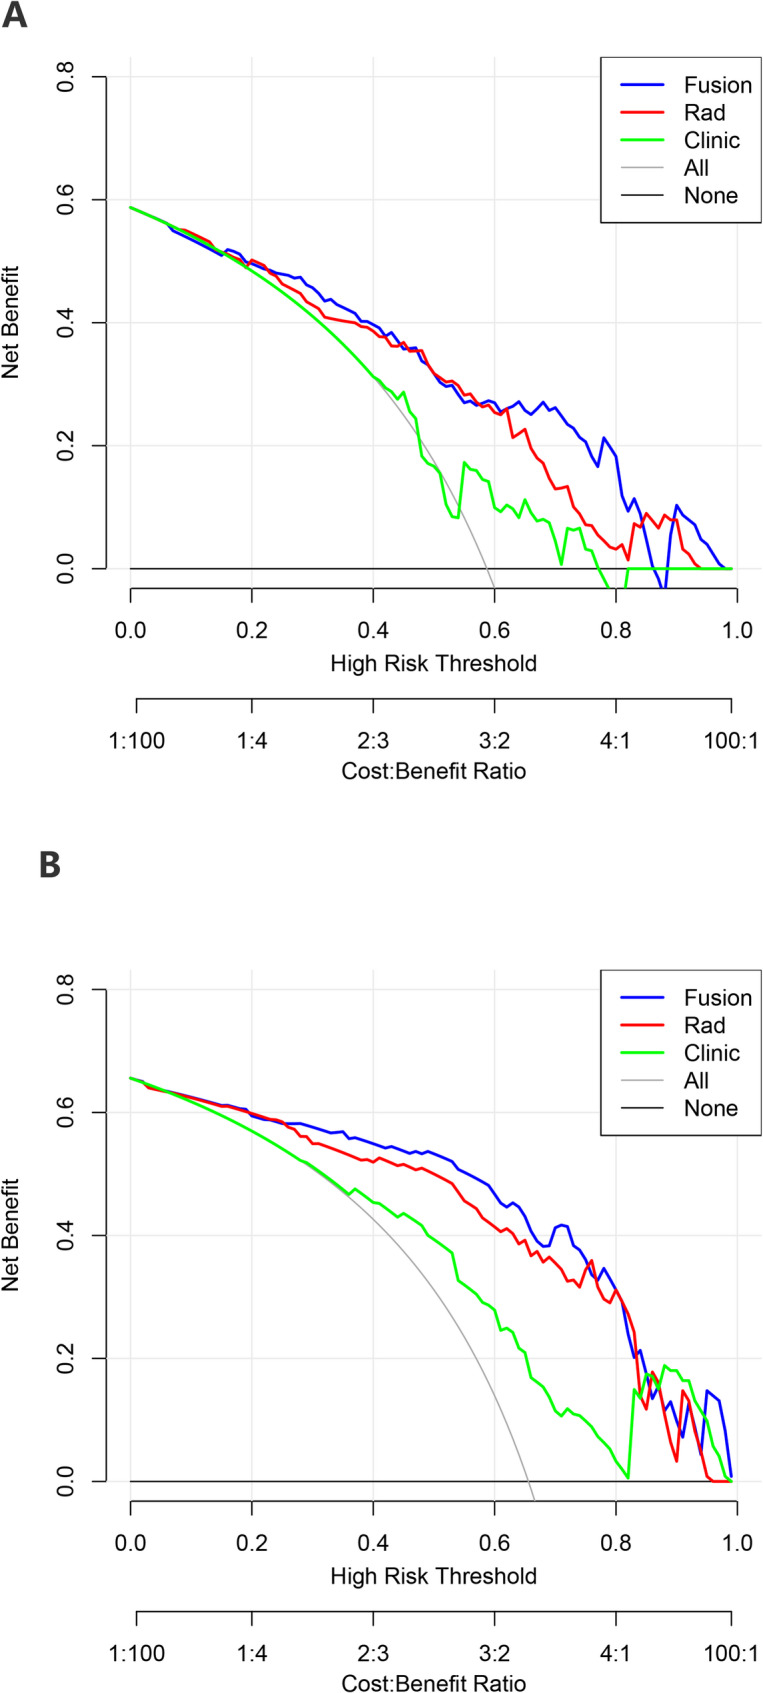
Decision curve analysis (DCA) of radiomics nomogram, clinic model and fusion model. DCA for predicting T stage (A) and N stage (B). The black line represents the net benefit of none of the patients receiving general treatment interventions; the gray line represents the net benefit of patients receiving general treatment intervention; the blue line represents the net benefit of patients receiving the fusion model intervention; the red line represents the net benefit for patients receiving the radiomics nomogram intervention. The blue line is above the red line, indicating that the fusion model has higher clinical efficacy
Discussion
Accurate diagnosis is the basis of accurate treatment, so it is crucial to determine the preoperative TNM staging for the individualized treatment of AEG patients. At present, the preoperative diagnosis of AEG patients mainly relies on imaging examination [11]. Among them, CT has become the most commonly used technique for preoperative staging of AEG and GC, but the overall accuracy is only 60–80% [20]. At present, there is a lack of studies on accurate preoperative diagnosis of AEG, and there is urgent to develop reliable predictive tools. In this study, we used machine learning method and proposed and validated a CT-based fusion model for preoperative prediction of tumour invasion depth and lymph node metastasis, which has the potential to promote preoperative noninvasive accurate identification of tumour invasion and lymph node metastasis risk in AEG patients.
Radiomics is a new and effective technology that can extract a large amount of imaging data with high throughput, convert images into quantitative and objective data that can be mined, and reflect the heterogeneity of tumour intrinsic characteristics (such as size, texture, and grey level) through extracted characteristic parameters [21]. Moreover, it has been widely used in clinical practice. At present, radiomics based on CT images is an independent predictor of lymph node metastasis in rectal cancer and can be used to construct a prediction model for preoperative lymph node metastasis [22, 23]. In addition, radiomics has shown better diagnostic efficacy in predicting the prognosis of GC patients. Sun et al. [24] extracted the radiological features of anterior portal vein CT images of 106 patients with GC and established an efficacy prediction model of NCT by using a random forest algorithm, which showed excellent prediction performance in the validation cohort, with an AUC of 0.82. Another study showed that the apparent diffusion coefficient histogram based on the whole lesion was valuable in the identification of lymph node metastasis, with the highest accuracy of 82.3% [25]. Obviously, radiomics is an important prognostic tool for cancer diagnosis, evaluation and prognosis prediction.
In this study, a variety of machine learning methods were used to select the optimal classifier for the extracted radiomics features. In addition, considering that the results of a single random partition may have instability, we aim to better evaluate the performance of the model, this study repeated fivefold cross-validation 20 times and used the mean of AUCs to evaluate the model performance to ensure the stability and reliability of the results. In addition, most previous studies had only one internal validation [18, 26, 27]. In this study, we had independent external validation cohort from another centre, and the results of the model tests in these cohorts showed well predictive performance, which indicates that our fusion prediction model can be applied to a wider range.
We developed the fusion model for predicting the depth of invasion and lymph node metastasis of AEG. Their predicted performance is satisfactory in both the training cohort and the validation cohort. Through multivariate analysis, we found that tumour size and nerve invasion were independent risk factors for tumour invasion depth. Previous studies have confirmed that tumour size is related to the invasive ability of AEG. A retrospective study included 106 AEG patients and analysed the factors influencing the depth of invasion. The results showed that when the tumour length was larger than 1.5 cm, the tumour could penetrate to a deeper level [7]. Previously, some scholars have demonstrated that the lymph node metastasis status in AEG is a key predictor of patient survival [28, 29]. The study of Sisic et al. [30] suggested that as many lymph nodes as possible should be removed to improve survival. Our study showed that tumour size and vascular tumour thrombus were predictors of AEG lymph node metastasis, and patients had more lymph node metastases when the tumour was larger or when vascular tumour thrombus was present. Feng et al. [31] developed a nomogram for predicting AEG lymph node metastasis, which showed that the risk of lymph node metastasis was greatly increased when the tumour size was greater than 4 cm. Another study suggested that the only prognostic factor of AEG was lymph node metastasis, which was closely related to tumour size, and suggested that tumour larger than 4 cm might need intensive multimodal therapy, including perioperative adjuvant chemotherapy [32].
The study also had several limitations. First, as a retrospective and multicenter study, there may have been selection bias and inherent bias. Second, the extracted imaging features are closely related to the ROI. Although the ROI delineation was jointly performed by two experienced radiologists, subjective bias may still influence the results. Future studies should consider incorporating advanced technologies, such as artificial intelligence-assisted segmentation tools, to more precisely capture complex boundaries and details in medical images, thereby providing more reliable data support for radiomics research. Third, the relatively small sample size in this study may affect the stability and reproducibility of the findings, potentially limiting the model’s generalizability and leading to suboptimal performance on new datasets. Future studies should consider increasing the sample size to enhance the generalisability and statistical power of the results, and include survival data to explore more associations with imaging features, and ultimately provide stronger support for clinical decision-making.
Conclusion
In conclusion, the CT-based fusion model developed in this study has potential value in predicting the T stage and N stage of AEG patients. It not only promotes the precision treatment of patients, but also provides a new means of examination for clinicians to select appropriate treatment methods for patients before surgery.
Electronic supplementary material
Below is the link to the electronic supplementary material.
Acknowledgements
We appreciate the great technical support from the Center of Zhejiang Cancer Hospital for their follow-up of patients.
Abbreviations
- AEG
Adenocarcinoma Of Esophagogastric Junction
- GC
Gastric Cancer
- TNM
Tumour Node Metastasis
- OS
Overall Survival
- ROI
Region Of Interest
- CT
Computed Tomography
- MRI
Magnetic Resonance Imaging
- ROC
Receiver Operating Characteristic
- AUC
Area Under Curve
- OR
Odd Radio
- HR
Hazard Ratio
- RMS
Recession Modeling Strategy
- EUS
Endoscopic Ultrasound
- PET-CT
Positron Emission Tomography
- LR
Logistic Regression
- SVM
Support Vector Machines
- XGBoost
eXtreme Gradient Boosting
Author contributions
L Zhang, XD Cheng and RX Xu designed the study; MX Cao, PC Yu, Y Wang and RL Zhang collected the data; RX Xu and YQ Zhang verified the data; WJ Chen and YH Tong drew ROI; MX Cao, RX Xu, Y You and CC Huang performed the analysis; MX Cao and RX Xu edited the manuscript; L Zhang and XD Cheng reviewed the manuscript.
Funding
Not applicable.
Data availability
Due to the privacy of patients, the data related to patients cannot be available for public access but can be obtained from the corresponding author on reasonable request approved by the institutional review board of all enrolled centers.
Declarations
Ethics approval and consent to participate
This study was undertaken in accordance with the World Medical Association. Declaration of Helsinki- ethical principles for medical research, and the study was approved by research ethics committee of the Zhejiang Cancer Hospital (IRB-2022-371). All patients gave their informed consent.
Consent for publication
Not applicable.
Competing interests
The authors declare no competing interests.
Footnotes
Publisher’s note
Springer Nature remains neutral with regard to jurisdictional claims in published maps and institutional affiliations.
Mengxuan Cao, Ruixin Xu and Yi You contributed equally to this work.
Contributor Information
Wujie Chen, Email: cwj_1993@126.com.
Xiangdong Cheng, Email: chengxd@zjcc.org.cn.
Lei Zhang, Email: 15968146990@163.com.
References
- 1.Ajani JA, Barthel JS, Bentrem DJ, D’Amico TA, Das P, Denlinger CS, Fuchs CS, Gerdes H, Glasgow RE, Hayman JA, et al. Esophageal and esophagogastric junction cancers. J Natl Compr Cancer Network: JNCCN. 2011;9(8):830–87. [DOI] [PubMed] [Google Scholar]
- 2.Pera M. Epidemiology of esophageal cancer, especially adenocarcinoma of the esophagus and esophagogastric junction. Recent results in cancer research fortschritte der krebsforschung progres Dans Les recherches Sur Le cancer 2000, 155:1–14. [DOI] [PubMed]
- 3.[Chinese expert consensus on the surgical treatment for adenocarcinoma. Of esophagogastric junction (Edition 2024)]. Zhonghua Wei Chang Wai Ke Za zhi = chinese journal of Gastrointestinal surgery 2024, 27(2):109–26. [DOI] [PubMed]
- 4.Siewert JR, Feith M, Stein HJ. Biologic and clinical variations of adenocarcinoma at the esophago-gastric junction: relevance of a topographic-anatomic subclassification. J Surg Oncol. 2005;90(3):139–46. discussion 146. [DOI] [PubMed] [Google Scholar]
- 5.Daiko H, Kato K. Updates in the 8th edition of the TNM staging system for esophagus and esophagogastric junction cancer. Jpn J Clin Oncol. 2020;50(8):847–51. [DOI] [PubMed] [Google Scholar]
- 6.Rice TW, Ishwaran H, Ferguson MK, Blackstone EH, Goldstraw P. Cancer of the esophagus and esophagogastric junction: an eighth edition staging primer. J Thorac Oncology: Official Publication Int Association Study Lung Cancer. 2017;12(1):36–42. [DOI] [PMC free article] [PubMed] [Google Scholar]
- 7.Takada K, Yabuuchi Y, Yamamoto Y, Yoshida M, Kawata N, Takizawa K, Kishida Y, Ito S, Imai K, Hotta K, et al. Predicting the depth of superficial adenocarcinoma of the esophagogastric junction. J Gastroenterol Hepatol. 2022;37(2):363–70. [DOI] [PubMed] [Google Scholar]
- 8.Zhang X, Watson DI, Jamieson GG. Lymph node metastases of adenocarcinoma of the esophagus and esophagogastric junction. Chin Med J. 2007;120(24):2268–70. [PubMed] [Google Scholar]
- 9.Nagami Y, Ominami M, Otani K, Hosomi S, Tanaka F, Taira K, Kamata N, Yamagami H, Tanigawa T, Shiba M, et al. Endoscopic submucosal dissection for adenocarcinomas of the esophagogastric junction. Digestion. 2018;97(1):38–44. [DOI] [PubMed] [Google Scholar]
- 10.Klamt AL, Neyeloff JL, Santos LM, Mazzini GDS, Campos VJ, Gurski RR. Echoendoscopy in preoperative evaluation of esophageal adenocarcinoma and gastroesophageal junction: systematic review and Meta-analysis. Ultrasound Med Biol. 2021;47(7):1657–69. [DOI] [PubMed] [Google Scholar]
- 11.Chevallay M, Bollschweiler E, Chandramohan SM, Schmidt T, Koch O, Demanzoni G, Monig S, Allum W. Cancer of the gastroesophageal junction: a diagnosis, classification, and management review. Ann N Y Acad Sci. 2018;1434(1):132–8. [DOI] [PubMed] [Google Scholar]
- 12.Seevaratnam R, Cardoso R, McGregor C, Lourenco L, Mahar A, Sutradhar R, Law C, Paszat L, Coburn N. How useful is preoperative imaging for tumour, node, metastasis (TNM) staging of gastric cancer? A meta-analysis. Gastric Cancer. 2012;15(Suppl 1):S3–18. [DOI] [PubMed] [Google Scholar]
- 13.Cidón EU, Cuenca IJ. Gastric adenocarcinoma: is computed tomography (CT) useful in preoperative staging?? Clin Med Oncol. 2009;3:91–7. [DOI] [PMC free article] [PubMed] [Google Scholar]
- 14.Huang Z, Xie DH, Guo L, Hu CH, Fang X, Meng Q, Ping XX, Lu ZW. The utility of MRI for pre-operative T and N staging of gastric carcinoma: a systematic review and meta-analysis. Br J Radiol 2015, 88(1050). [DOI] [PMC free article] [PubMed]
- 15.Jiang Y, Jin C, Yu H, Wu J, Chen C, Yuan Q, Huang W, Hu Y, Xu Y, Zhou Z, et al. Development and validation of a deep learning CT signature to predict survival and chemotherapy benefit in gastric Cancer. Ann Surg. 2021;274(6):e1153–61. [DOI] [PubMed] [Google Scholar]
- 16.Wang R, Dai W, Gong J, Huang M, Hu T, Li H, Lin K, Tan C, Hu H, Tong T, et al. Development of a novel combined nomogram model integrating deep learning-pathomics, radiomics and immunoscore to predict postoperative outcome of colorectal cancer lung metastasis patients. J Hematol Oncol. 2022;15(1):11. [DOI] [PMC free article] [PubMed] [Google Scholar]
- 17.Gao X, Ma T, Bai S, Liu Y, Zhang Y, Wu Y, Li H, Ye Z. A CT-based radiomics signature for evaluating tumour infiltrating Treg cells and outcome prediction of gastric cancer. Ann Transl Med. 2020;8(7):469. [DOI] [PMC free article] [PubMed] [Google Scholar]
- 18.Wang Y, Liu W, Yu Y, Liu JJ, Xue HD, Qi YF, Lei J, Yu JC, Jin ZY. CT radiomics nomogram for the preoperative prediction of lymph node metastasis in gastric cancer. Eur Radiol. 2020;30(2):976–86. [DOI] [PubMed] [Google Scholar]
- 19.Yang J, Wu Q, Xu L, Wang Z, Su K, Liu R, Yen EA, Liu S, Qin J, Rong Y, et al. Integrating tumor and nodal radiomics to predict lymph node metastasis in gastric cancer. Radiotherapy Oncology: J Eur Soc Therapeutic Radiol Oncol. 2020;150:89–96. [DOI] [PubMed] [Google Scholar]
- 20.Giganti F, Orsenigo E, Arcidiacono PG, Nicoletti R, Albarello L, Ambrosi A, Salerno A, Esposito A, Petrone MC, Chiari D, et al. Preoperative locoregional staging of gastric cancer: is there a place for magnetic resonance imaging? Prospective comparison with EUS and multidetector computed tomography. Gastric Cancer. 2016;19(1):216–25. [DOI] [PubMed] [Google Scholar]
- 21.Mayerhoefer ME, Materka A, Langs G, Häggström I, Szczypiński P, Gibbs P, Cook G. Introduction to radiomics. Journal of nuclear medicine: official publication. Soc Nuclear Med. 2020;61(4):488–95. [DOI] [PMC free article] [PubMed] [Google Scholar]
- 22.Bedrikovetski S, Dudi-Venkata NN, Kroon HM, Seow W, Vather R, Carneiro G, Moore JW, Sammour T. Artificial intelligence for pre-operative lymph node staging in colorectal cancer: a systematic review and meta-analysis. BMC Cancer. 2021;21(1):1058. [DOI] [PMC free article] [PubMed] [Google Scholar]
- 23.Huang YQ, Liang CH, He L, Tian J, Liang CS, Chen X, Ma ZL, Liu ZY. Development and validation of a radiomics nomogram for preoperative prediction of lymph node metastasis in colorectal Cancer. J Clin Oncology: Official J Am Soc Clin Oncol. 2016;34(18):2157–64. [DOI] [PubMed] [Google Scholar]
- 24.Sun KY, Hu HT, Chen SL, Ye JN, Li GH, Chen LD, Peng JJ, Feng ST, Yuan YJ, Hou X, et al. CT-based radiomics scores predict response to neoadjuvant chemotherapy and survival in patients with gastric cancer. BMC Cancer. 2020;20(1):468. [DOI] [PMC free article] [PubMed] [Google Scholar]
- 25.Liu S, Zhang Y, Xia J, Chen L, Guan W, Guan Y, Ge Y, He J, Zhou Z. Predicting the nodal status in gastric cancers: the role of apparent diffusion coefficient histogram characteristic analysis. Magn Reson Imaging. 2017;42:144–51. [DOI] [PubMed] [Google Scholar]
- 26.Mao M, Zhang A, He Y, Zhang L, Liu W, Song Y, Chen S, Jiang G, Wang X. Development and validation of a novel nomogram to predict overall survival in gastric cancer with lymph node metastasis. Int J Biol Sci. 2020;16(7):1230–7. [DOI] [PMC free article] [PubMed] [Google Scholar]
- 27.Zhang D, He W, Wu C, Tan Y, He Y, Xu B, Chen L, Li Q, Jiang J. Scoring system for Tumour-Infiltrating lymphocytes and its prognostic value for gastric Cancer. Front Immunol. 2019;10:71. [DOI] [PMC free article] [PubMed] [Google Scholar]
- 28.Gu Y, Swisher SG, Ajani JA, Correa AM, Hofstetter WL, Liao Z, Komaki RR, Rashid A, Hamilton SR, Wu TT. The number of lymph nodes with metastasis predicts survival in patients with esophageal or esophagogastric junction adenocarcinoma who receive preoperative chemoradiation. Cancer. 2006;106(5):1017–25. [DOI] [PubMed] [Google Scholar]
- 29.Ding B, Yong J, Zhang L, Luo P, Song E, Rankine AN, Wei Z, Wang X, Xu A. Impact of examined lymph node number on accurate nodal staging and long-term survival of resected Siewert type II-III adenocarcinoma of the esophagogastric junction: A large population-based study. Front Oncol. 2022;12:979338. [DOI] [PMC free article] [PubMed] [Google Scholar]
- 30.Sisic L, Blank S, Weichert W, Jager D, Springfeld C, Hochreiter M, Buchler M, Ott K. Prognostic impact of lymph node involvement and the extent of lymphadenectomy (LAD) in adenocarcinoma of the esophagogastric junction (AEG). Langenbecks Arch Surg. 2013;398(7):973–81. [DOI] [PubMed] [Google Scholar]
- 31.Feng H, Zheng J, Zheng C, Deng Z, Liao Q, Wang J, Li Y. The probability of lymph node metastasis with a tumour size larger than and smaller than 4 cm is different in stages T1-T3 of Siewert type II adenocarcinoma of esophagogastric junction: A Population-Based study. J Cancer. 2021;12(22):6873–82. [DOI] [PMC free article] [PubMed] [Google Scholar]
- 32.Urakawa N, Kanaji S, Suzuki S, Sawada R, Harada H, Goto H, Hasegawa H, Yamashita K, Matsuda T, Oshikiri T, et al. Prognostic and clinicopathological significance of lymph node metastasis in the esophagogastric junction adenocarcinoma. Anticancer Res. 2022;42(2):1051–7. [DOI] [PubMed] [Google Scholar]
Associated Data
This section collects any data citations, data availability statements, or supplementary materials included in this article.
Supplementary Materials
Data Availability Statement
Due to the privacy of patients, the data related to patients cannot be available for public access but can be obtained from the corresponding author on reasonable request approved by the institutional review board of all enrolled centers.