

Summary
Sea urchins are emblematic models in developmental biology and display several characteristics that set them apart from other deuterostomes. To uncover the genomic cues that may underlie these specificities, we generated a chromosome-scale genome assembly for the sea urchin Paracentrotus lividus and an extensive gene expression and epigenetic profiles of its embryonic development. We found that, unlike vertebrates, sea urchins retained ancestral chromosomal linkages but underwent very fast intrachromosomal gene order mixing. We identified a burst of gene duplication in the echinoid lineage and showed that some of these expanded genes have been recruited in novel structures (water vascular system, Aristotle’s lantern, and skeletogenic micromere lineage). Finally, we identified gene-regulatory modules conserved between sea urchins and chordates. Our results suggest that gene-regulatory networks controlling development can be conserved despite extensive gene order rearrangement.
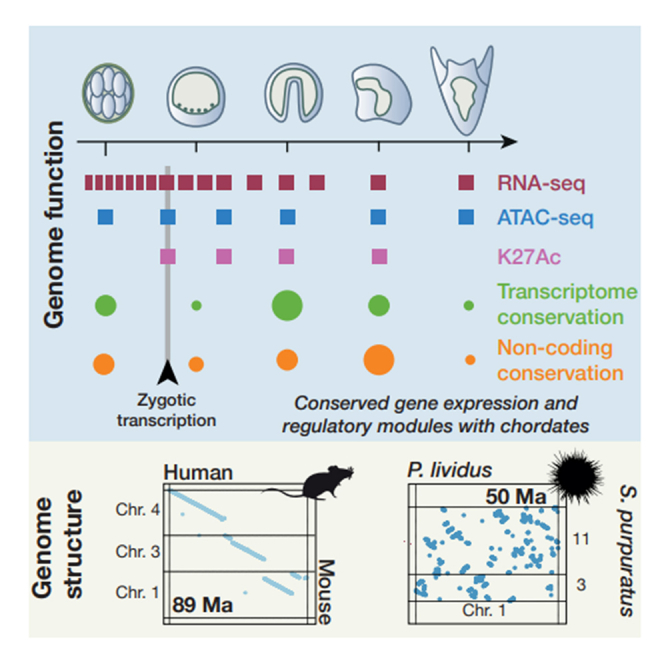
Graphical abstract
Highlights
-
•
Ancestral linkages are retained in sea urchins, but local gene order is evolving rapidly
-
•
Genes duplicated in sea urchins are expressed in novel structures
-
•
A new family of Pmar1-related genes is involved in specifying the micromere lineage
-
•
Gene-regulatory modules are conserved between sea urchin and chordates
The chromosome-scale genome and characterization of the genomic elements that control gene expression in development reveal distinct trends of genome evolution in sea urchins and vertebrates as well as conserved gene-regulatory modules in deuterostomes.
Introduction
Sea urchins are benthic marine animals that have attracted the curiosity of scientists since antiquity.1 They are one of the most amenable model systems in developmental biology because they produce abundant gametes and transparent embryos, and they have enabled major discoveries, such as the chromosomal nature of heredity, regulators of the cell cycle, and gene-regulatory networks controlling development.2,3
Sea urchins belong to the clade of echinoderms, whose body plan displays an intriguing pentaradial symmetry, acquired secondarily during metamorphosis of their bilaterally symmetrical larvae.4,5 In the tree of animals, echinoderms together with hemichordates form the Ambulacraria clade, the sister group to chordates.6 Beyond their original symmetry, echinoderms possess intriguing novelties, such as their calcium carbonate endoskeleton and their water vascular system running through five canals and associated tube feet.7 Among echinoderms, sea urchins also stand out with some remarkable embryological and adult morphological characteristics. During embryogenesis, they proceed with early specification of a micromere cell lineage that gives rise to the embryonic skeleton, a mechanism absent in other echinoderms.8,9 As adults, they also possess an intricate calcified masticatory organ: Aristotle’s lantern.
The first sequenced sea urchin genome, that of the Pacific sea urchin Strongylocentrotus purpuratus, revealed the extensive conservation of its gene repertoire with that of the human genome10 and served as a support for the elucidation of gene-regulatory networks at play during development.11,12 However, while comparative genomics has helped us understand functional differences across different vertebrate model species, the genomic differences between distinct echinoderms have not been thoroughly examined.13 A possible clue could come from the Hox genes, a classic locus linking genomes and body plan establishment.14 Because Hox genes are expressed during metamorphosis of echinoderm larvae, the pentaradial body plan of echinoderms has been classically related to the original observation of a rearranged Hox cluster in S. purpuratus, while this unique locus has been kept intact in most bilaterian animals.15,16,17 The subsequent discovery of an intact Hox cluster in the sea star18 and sea cucumber19 suggested, however, that this rearrangement is not the primary reason for the novel body plan of echinoderms.20 The sea urchin Lytechinus variegatus has revealed the same rearranged Hox cluster in this species as in S. purpuratus,21,22 which could indicate that sea urchins are more prone to genomic rearrangements than other echinoderms.
Major evolutionary transitions have been linked to radical genomic events, such as the whole-genome duplications in vertebrates, which affected gene complement and regulation.23,24,25 Ancestral linkage groups (ALGs) also appear to have been reshuffled after whole-genome duplication at the origin of vertebrates that underwent extensive chromosomal rearrangements.26 Other deuterostomes, such as tunicates, underwent very fast genomic evolution,27 while others, such as hemichordates, retained more ancestral traits.28 Particularly, ALGs corresponding to maintained chromosomal units over time appeared at the origin of animals and were conserved at long evolutionary distances in lineages such as cnidarians, molluscs, or other spiralians with very limited fusions or rearrangements.29,30 Little is known, however, about the genomic rearrangements that took place in the sea urchin lineage and might underlie the evolution of sea urchin-specific novelties in embryogenesis and body plan.
Here, we report the generation and analysis of a chromosome-scale assembly of Paracentrotus lividus, one of the main sea urchin species in the Mediterranean and North-East Atlantic coast and a reference species in embryology of the sea urchin. This species has been used since the 19th century in marine stations of France and Italy by prominent scientists, such as Hörstadius, Hertwig, Boveri, and Driesch, whose work has led to the foundation of key concepts in embryology and cell biology.31,32 For instance, Theodor Boveri demonstrated the requirement for a complete chromosome set in each blastomere for development,33 and Hans Driesch discovered the astonishing capacity of isolated blastomeres from P. lividus to develop into smaller but harmoniously patterned larvae.34 This species is also widely consumed around the Mediterranean as a delicacy since antiquity, as testified by archaeological work conducted in Pompei.35 P. lividus is also a keystone species in benthic communities because its grazing activity can control the development of algal populations.36 This genomic resource will thus promote population genomics studies on this species, which will improve the management of this ecologically and economically important species.37
In this study, we investigated how conserved the genomic and regulatory architecture is between P. lividus, other sea urchins, and chordates. We compared the gene order and chromosome organization of P. lividus with that of S. purpuratus and L. variegatus, which diverged ∼60 mya.38 We profiled genome-wide chromatin accessibility throughout embryonic development. We investigated the expression and regulation of genes that originated at the origin of the echinoids clade. We identified a novel family of Pmar1-related transcriptional regulators specific to euechinoids, expressed in the micromere lineage and capable of converting any cell of the embryo into skeletogenic precursors. By integrating genomic and regulatory datasets, we demonstrated how regulatory changes could be associated with the origin of the novel body plan of urchins and other echinoderms.
Results
The genome and developmental regulatory landscape of P. lividus
We sequenced the genome of a single male individual of P. lividus using 230× Illumina sequencing (Table S1). The genome was initially assembled using stringent parameters, and haploid copies were filtered out because the 2.9% polymorphism caused both haplotypes to be present in the initial contigs (Figure S1A). The assembly was then improved using long-read PacBio sequencing for gap closing, followed by scaffolding using proximity ligation (Chicago and Hi-C). The draft assembly of P. lividus amounts to 927.4 Mb with 5% of gaps and only 1.7% missing and 0.7% duplicated BUSCO genes (STAR Methods). Half of the assembly is comprised of 8 scaffolds larger than 41 Mb (N50), and there are 18 main scaffolds (>2 Mb) that represent 88.3% of the assembly (Figure 1A; Table S2). These 18 scaffolds correspond to the chromosome number observed in cytogenetic studies39 (Figure 1B). Other sea urchin model species possess 21 chromosomes per haploid genome (S. purpuratus)40 and 19 (L. variegatus).21 While most of the repetitive fraction of vertebrate genomes is usually made of retrotransposons, DNA transposons are dominant in the sea urchin, similar to other deuterostomes, such as amphioxi24,25 (Figure S1B).
Figure 1.

Genome organization and regulatory landscape of the sea urchin P. lividus
(A) HiC contact map of the P. lividus assembly, with the 18 longest scaffolds of higher contact density corresponding to putative chromosomes highlighted.
(B) Density of annotated genes (color scale) and repeated elements (ridge plot on the right) with a picture of an adult P. lividus (C.G.).
(C) Classification and number of OCRs for the different stages.
(D) Number of OCRs located at the transcription start site (TSS), in the proximal region (<5 kb upstream of the TSS), in the gene body, and/or in the distal region (>5 kb of the TSS) in three deuterostome species.
(E) Cumulative distance to TSSs of OCRs in the same three species.
(F) RNA-seq (red) and ATAC-seq (blue) signals in the region of the nodal gene, showing two well-characterized CREs in the proximal and intronic regions of this gene.
In addition, transcriptomes for 17 embryonic stages, from the fertilized egg to the pluteus stage, and 5 adult tissues were generated (Table S3). We annotated 32,041 genes, of which 80.1% have similarity to other species, and 92.1% are expressed (TPM > 1). We also annotated 5,087 high-confidence long non-coding RNAs (lncRNAs). By using gene expression clustering, we determined that 4,965 lncRNAs show stage-specific expression and, hence, play a potential role in the regulation of development (Figures S2C and S2D).
To gain further insight into their developmental regulatory program, we applied assay for transposase-accessible chromatin sequencing (ATAC-seq) to 6 stages from the 16-cell stage to the pluteus larva stage (Figure S3A; Table S4). Genomic regions with higher-than-background chromatin accessibility were labeled as open chromatin regions (OCRs) and classified depending on their location (Figure 1D) and their activity profile during development (Figure 1C). Among 64,701 OCRs distinct from transcription start sites, we found 40% “dynamic” regions (peaks) that were specific to one or two successive developmental stages and 57% constitutive regions present in three or more stages (Figures 1C and 1G). To further elucidate the regulatory activity in these regions, we applied Cut&Tag targeting the H3K27ac histone modification that is associated with active enhancers41,42 (Figures S3D, S3E, and S3G). Many OCRs also exhibit a level of transcription consistent with regulatory activity (Figure S3D).43 Our data efficiently recovered the activity of previously well-characterized regulatory elements (Table S5), such as, for example, the proximal and intronic enhancers of the nodal gene44 (Figure 1F). We compared the distribution of OCR locations with that of amphioxi and zebrafish, for which developmental ATAC-seq is available25 (Figures 1D and 1E). It has been proposed that OCRs that play an important regulatory role usually lie either in the vicinity of the promoter (proximal, <5 kb) or within introns (gene body).45 In vertebrates, a large fraction of these elements is located more distally than in amphioxi, which has been associated with more complex gene-regulatory processes (Figure 1D).25 P. lividus shows a higher proportion of distal OCRs compared with the cephalochordate amphioxi and a lower proportion compared with zebrafish (Figures 1C and 1D).
We noticed that 16-cell-stage embryos (27,501 peaks) as well as pluteus-stage larvae (39,623 peaks) exhibit fewer OCRs than the other sampled stages. The blastula (137,938 peaks) and gastrula (147,188 peaks) stages show many stage-specific active elements, which are likely involved in the extensive gene-regulatory events that control embryo patterning and cell fate specification at these stages (Figure 1C; Table S5). In early 16-cell-stage and pluteus larva, the lower number of peaks could be interpreted either as a generally more relaxed chromatin state, potentially related to the absence of transcription before zygotic genome activation, or a more condensed state (Figure S3C). We hypothesize that the 16-cell stage possesses large open chromatin domains, as seen in other species,46 while the larval stage (pluteus) likely undergoes a reduction of open chromatin domains, as seen in other lineages, such as annelids47 (Figure 1C). Similar patterns are also recovered with an H3K27ac enrichment signal (Figure S3G). The sea urchin regulatory landscape therefore generally resembles the architecture observed in vertebrates or amphioxi in terms of enhancer location and developmental dynamics.48
Opposite trends of genomic architectural changes in sea urchins and vertebrates
Many animal genomes retain chromosomal linkage over time as sets of genes stay localized on homologous chromosomes, even in distantly related species.49 Particularly, comparison of high-quality genomes of vertebrates, cephalochordates, and molluscs has revealed the existence of 17 ALGs ancestral to chordates.26 However, the occurrence of chromosomal fusions in some lineages suggests that more genomes and lineages should be taken into account to infer the ancestral bilaterian complement of ALGs. We examined the distribution of these ALGs in P. lividus as well as two other available sea urchin genomes (Figures 2A and 2B).21,26 Such representations pinpoint pairs of chromosomes or scaffolds that exhibit significant mutual ortholog enrichment (Fisher’s exact test, p < 0.05). Our comparisons indicate that some of the ALGs actually fused in the vertebrate and amphioxus lineages and suggest the existence of 23 ALGs for bilaterians, in agreement with recent studies29 (Figures S4A and S4B). Our comparisons of the sea urchin chromosomes further support the validity of these 23 ALGs as independent genomic units and reveal a missing linkage group that was not detected previously (dubbed “ALG R”), likely dispersed across multiple chromosomes in chordates, which indicates 24 ALGs (Figure 2). This ALG R is merged with ALG Q on P. lividus chromosome 4 (chr4) but remained intact in S. purpuratus and L. variegatus (Figures S4C and S4D). We found that 13 of 18 chromosomes of P. lividus descend from a single ALG, four are derived from the fusion of two ALGs, and one (chr2) receives contributions from three more (Figure 2).
Figure 2.

Evolution of sea urchin chromosomal architecture
(A and B) Oxford plots visualizing the respective positions of orthologs inferred by reciprocal best blast in the sea urchin P. lividus; the cephalochordate Branchiostoma floridae, where ALG A1 and A2 fused (A); and the mollusc Pecten maximus, where several other ALGs fused (B).
(B) Dots located in pairs of chromosomes showing a significant mutual enrichment of orthologs (Fisher’s exact test, p < 0.05) are colored by ALG assignment, while others are colored in gray. Axis values represent gene indexes.
(C) Synteny between chromosomes of all three available echinoid genomes (P. lividus, L. variegatus, and S. purpuratus), colored by ALG.
Despite the conservation of ancestral linkages in P. lividus, the distribution of ALGs in the chromosomes of L. variegatus and S. purpuratus indicates some species-specific chromosomal fusions10,21 (Figure 2B). The fusions observed in P. lividus are absent in the two other species, but, conversely, some independent fusions took place, particularly in L. variegatus, where the two largest chromosomes (chr1 and chr2) derived from a mixture of distinct ALGs. Uniquely, ALG A1 and A2 are fused in P. lividus but not in the other sea urchin species, a fusion event that also took place in amphioxi.26,50 The higher number of chromosomes of S. purpuratus reflects the occurrence of only two fusions, the rest of the ALGs being represented as a single chromosome. In contrast, some chromosomal fusions are more ancient; two fusions are shared by all three urchin species: fusion of the three ALGs C1, B2, and E and fusion of ALGs B3 and J1.
Unlike vertebrates, sea urchins did not undergo a sizable rearrangement of units derived from ancestral linkages in most of their chromosomes, even when secondary fusions are observed (Figures 2C, S4C, and S4D). Incidentally, the distinct sea urchin lineages under scrutiny here have diverged since 48–68 mya, less than for human and mouse.38 In contrast to this echinoid chromosomal stability, we observed an extensive reshuffling of the microsyntenic intrachromosomal gene order, which results in the absence of an observable “colinear” gene order visible as linear segments across pairs of homologous chromosomes, as seen when comparing human and mouse genomes (Figures 3B and 3C). To quantify the rate at which gene collinearity is eroded, we compared the retention of microsynteny with the divergence time for selected sea urchin and vertebrate species (Figure 3A)51 and showed in this way that intrachromosomal gene order appears to evolve at a much slower pace in vertebrates than in sea urchins (Figure 3A).
Figure 3.

Intrachromosomal gene order rearrangement in sea urchins and vertebrates
(A) The relationship between divergence time and gene order collinearity. Hsap, Homo sapiens; Ggal, Gallus gallus (chicken); Locu, Lepisosteus oculatus (spotted gar); Pliv, P. lividus; Spur, S. purpuratus; Lvar, L. variegatus.
(B) Oxford plot between human and mouse, showing interchromosomal rearrangement but long colinear segments between the two species.
(C) Oxford plot between the two sea urchin species, showing similar chromosomal architecture but reshuffled gene orders within chromosomes.
Consequently, the gene order in the genomes of sea urchin appears to evolve following a trend distinct from that of vertebrates: the rate of interchromosomal rearrangement appears to be very low, while the rate of intrachromosomal gene order change appears to occur much faster. This distinct trend could be due to a relaxation of functional regulatory constraints on gene order compared with vertebrates.
The expression of recently evolved sea urchin genes
Exploration of gene content and gene expression can inform on how gene gains and duplications can play a role in organismal novelty.52 To this end, we performed gene family reconstruction (Table S6) and applied phylogenetic reconciliation to detect duplication events (Figure 4A). Sea urchins, like other echinoderms, do not show a particularly increased occurrence of gene losses in their genomes, such as that observed in the tunicate lineage53 (Figure 4A). Some losses, however, are shared by all three sea urchin species (Table S7); for instance, some members of the transforming growth factor β (TGF-β) signaling pathway, like BAMBI or BMP9, present in other echinoderms, like the sea cucumber.54
Figure 4.

Gene and organismal novelties in sea urchins
(A) Gene family gains (green), losses (blue), and duplications (orange) on a phylogenetic tree of deuterostomes.
(B) Enrichment of genes originated (top) and duplicated (bottom) at different phylogenetic nodes in WGCNA clusters of syn-expressed genes using a hypergeometric test.
(C) GO terms enriched in genes duplicated at the echinoid nodes for Biological Process (BP) and Molecular Function (MF) categories.
(D–F) For genes duplicated at distinct nodes, we evaluated (D) gene expression tissue/stage specificity (tau), (E) distance to the TSS, and (F) Phastcons conservation score in OCRs associated with the corresponding genes.
Interestingly, we noticed a burst of gene duplication events in the echinoid ancestor with the second-highest number of duplicated gene families in deuterostomes after the origin of vertebrates and its whole-genome duplications.55 However, in the sea urchin, these duplicates are located in close genomic proximity, present on the same chromosomes (49%) and at close distances (36% closer to 100 kb), indicating a common origin by tandem duplication rather than by large-scale genomic duplications, as reported recently for cephalochordates.56 The gene duplicates show enrichment of Gene Ontology (GO) terms associated with membrane transport and the circulatory system, with, for instance, multiple ABC transporters and solute carriers encoding genes (Figure 4C), which possibly suggests that these genes could play a role in the functioning of the water vascular system (Figure 4C). In the most extreme cases, some gene families underwent large expansions in the sea urchin lineages, as detected by hypergeometric tests (p < 0.01; Table S8): the glycoprotein Kirrel, which plays a role in sea urchin skeletogenesis;57 the SLC16 transporter family, which is enriched in pigment cells;58 a class of GPCRs (GPCR135) that acts as a putative neuropeptide receptor;59 and the muscarinic acetylcholine (ACM) receptors. Some of these duplicates seem to have acquired specific expression profiles or domains during development (Figures S5C and S5D).
To further evaluate the expression of genes gained and duplicated in the echinoid lineages, we classified genes according to their expression profiles using network-based clustering60 (Figure S5A). We used gene family reconstruction to determine whether genes that originated and duplicated at different phylogenetic nodes showed a particular enrichment in some of these expression clusters (Figure 4B). Novel echinoid genes are particularly enriched during early embryonic stages or in adult structures, such as tube feet or the body wall (comprising the water vascular system and skeleton). We also found such increased expression of novel genes in Aristotle’s lantern, a calcified buccal apparatus specific to echinoids. We similarly observed preferred expression of genes duplicated in the echinoid lineage during the earliest embryonic stages and among the maternally expressed genes, suggesting that some of them could be involved in cell lineage specification (see below the example of pmar1) (Figure 4B). We then examined the putative regulatory elements (OCRs) that are associated with genes duplicated in echinoids; we identified 3.45 elements per gene (on average) for echinoid duplicates in contrast with 4.13 elements for genes arising in older duplications (Figure 4E). These elements are closer to promoters and less conserved in sequence than the elements associated with older duplicates or even the single-copy genes (Figure 4F). At the gene expression level, very recent duplicates show a higher organ specificity than other genes according to the tau estimate (Figure 4D), indicating that novel, fast-evolving regulatory elements are driving their expression in new organs and stages.61 We assessed whether some transcription factor binding sites (TFBSs) are enriched in the OCRs associated with sea urchin gene duplicates and recovered significant enrichments for 22 TFBSs (hypergeometric test, p < 0.01; Table S9). This list comprises five nuclear receptors, including homologs of HNF4, thyroid receptor, and COUP-TF, as well as other factors known for controlling organogenesis (AP2, ELK, and ATF1), findings compatible with the organ-specific expression pattern recovered for a number of these duplicates (Figure 4D).
By studying the evolution, expression, and regulation of the sea urchin genes, we showed that newly evolved and newly duplicated genes are preferentially expressed in specific embryonic stages and anatomical structures. Some of these structures, such as Aristotle’s lantern or tube feet, are novelties of echinoids and echinoderms, respectively. This observation parallels similar findings regarding the younger transcriptome age of early developmental stages62 or gene expression in the mollusc shell and radula,63 but further studies will be necessary to explore their functional significance.
The origin of pmar/hbox12 genes
To understand how tandem gene duplications underlie the emergence of novelties, we investigated the origin of the pmar1 genes that play a critical role in specifying micromeres and their skeletogenic primary mesenchyme cell (PMC) derivatives, a specific character of euechinoids.64 We identified 12 copies of genes related to the original pmar1/hbox12 sequence clustered within a 350-kb region in P. lividus (Figure 5A).65 In L. variegatus, a similar number of pmar-related genes has recently been described in two distinct genome locations of chr2.21 Moreover, eight copies of a pmar1-related gene have also been identified in the cidaroid Eucidaris tribuloides, the sister group of euechinoids.66 pmar1 genes do not have clear orthologs in other echinoderms, but the identification of phb as a pmar1-related gene in brittle stars (Ophiuroidea) suggested that pmar1 genes are divergent copies of an ancient class of paired-type homeobox genes in this clade.8,66 To clarify their respective relationships, we cataloged the multiple pmar copies found in sea urchins and copies of other pmar-related echinoderm genes, including the Pplx gene from brittle stars and the Phb gene from sea stars.8 We reconstructed a phylogenetic tree that confirms the relationship of pmar and phb genes but, surprisingly, also shows that the aprd genes found in amphioxi and spiralians are related to these genes.8,67 Our phylogeny suggests an independent expansion of pmar genes in multiple sea urchin lineages because the different pmar genes group into species-specific clades. Intriguingly, we identified a novel family of pmar-related genes that group in a distinct clade, showing a particularly fast rate of evolution, and dubbed them parent of pmar (pop) genes to reflect that they are sister genes of pmar (Figure S6E). The architecture of pmar/pop clusters appears distinct in all four sea urchins: in L. variegatus, pops and pmars are in distant loci, while in S. purpuratus, one locus contains 3 pmars and another 2 pmars and 2 pops. In E. tribuloides, eight pmar1-related genes are present in two different scaffolds, while all of these genes are closely located in P. lividus (Figure 5A). In the cidaroid E. tribuloides, only one set of pmar/pop-related genes is found, which could indicate that the duplication that gave rise to the ancestors of pop and pmar genes took place within the Euechinoidea lineage, followed by an independent expansion of pmar genes in the lineages leading to each sea urchin species.
Figure 5.

The evolution of pmar/hbox12 genes in echinoids
(A) Genomic organization of the pmar and pop loci in all three echinoid genomes.
(B) Regulatory landscape with RNA-seq (red) and ATAC-seq signal (blue) and OCRs in P. lividus.
(C) Phylogeny of pmar-related paired homeobox genes using the homeobox residues (IQTREE LG4X+R model).
(D) Expression of pmar and pop genes.
(E) In situ expression of pmar and pop genes. pop1 is expressed maternally and ubiquitously, while pop2 and pop3 are expressed in the PMC precursors. Scale bar. 30 μm.
(F) Phenotypes caused by overexpression of pmar or pop genes. Overexpression of pmar1, pop1, pop2, pop3, or pop2 fused to the repressor domain of Engrailed causes massive production of PMC-like mesenchymal cells and ectopic expression of PMC marker genes such as Delta and alx1. Inset: ventral view. vv, vegetal pole view; DIC, differential interference contrast.
Because pop genes seem to constitute a distinct clade of pmar1-related genes, we sought to determine whether their expression and function are the same as other pmar1 genes. In P. lividus, the pop1 gene is expressed maternally and ubiquitously, while the two other pop genes show an expression spatially restricted to the micromere lineage in the late cleavage and early blastula stage, consistent with these genes being, like pmar1, involved in specification of the micromeres and PMC lineage (Figures 5D and 5E). Indeed, overexpression of these pop genes caused massive delamination of PMC-like mesenchymal cells that popped up from the vegetal pole at the onset of gastrulation and that was accompanied by ectopic expression of the PMC-specific marker genes delta and alx1 (Figure 5F). This phenotype is identical to the phenotype caused by overexpression of pmar1, reinforcing the idea that pop genes also act to specify the PMC lineage.64 These observations illustrate how pervasive gene duplication and rearranged gene order between the three sea urchin models are associated with novel cell lineage specification mechanisms.
Conservation and divergence of gene expression modules across deuterostomes
The dynamic gene order across sea urchin species contrasts with their highly conserved embryonic development and corresponding gene expression.68 To understand how the gene-regulatory program is affected by these gene order changes, we assessed the extent of the evolutionary conservation of sea urchin regulatory programs by comparing clusters of genes with similar temporal expression profiles in P. lividus, S. purpuratus, and the cephalochordate Branchiostoma lanceolatum.69 We found significant pairwise enrichment of genes belonging to identical gene families in clusters of co-expressed genes, either between sea urchins or when comparing sea urchins (Figure 6A) and chordates (Figure 6B). This enrichment indicates conservation of genes involved in temporal gene expression modules, as observed previously within chordates25 and insects.70 Interestingly, the patterns of conservation at short and long divergence times (Figures 6A and 6B) show remarkable similarities, with most highly conserved modules being the stage-specific ones and the ones active during mid- to late development. We noticed that evolutionarily conserved modules can involve gene expression at the same developmental stage (homochronic) or shifted in their expression timing (heterochronic) at short and long evolutionary distances (Figures 6A and 6B). Despite the difference between the pluteus larva and the amphioxus larva, we observed several clusters that share a significant homologous gene set. For instance, the cluster (Pliv18) that shares the highest number of homologous genes appears to be enriched in GO terms associated with sensory perception and neuronal function (ion and amino acid transport) (Figure 6C).71 An examination of TFBSs enriched in OCRs related to genes belonging to these clusters revealed multiple factors associated with circadian regulation of gene expression, such as ARNT (BMAL) and CLOCK, which constitute the “core clock;” associated regulators such as USF; downstream circadian effectors such as ATF and CREB; plus genes such as SREB, which is related to nutrient-related circadian adjustments (Figure 6D). These results suggest an evolutionarily conserved mechanism of circadian-based activation of neural activity at the end of embryonic development and the onset of larval life.72
Figure 6.

Conservation of gene expression modules in deuterostomes
(A and B) Gene content conservation between cluster syn-expressed genes (mfuzz) during the development of P. lividus and the sea urchin S. purpuratus (A) or the cephalochordate B. lanceolatum (B), estimated using a hypergeometric test. The arrowheads underneath indicate whether the pair of clusters is homochronic (black filled) or heterochronic (white filled). The side heatmaps indicate average expression for each mfuzz cluster as normalized Z score.
(C) GO terms overrepresented in cluster 18, which shows the highest conservation of ortholog content.
(D) TF motif enrichment in peaks associated with genes belonging to each cluster in P. lividus, computed using a hypergeometric test (p < 0.01). Only clusters with at least one significant TF motif (p < 0.05) are shown.
Beyond gene expression, we focused on the dynamics of the OCRs during development in sea urchins to determine the key regulatory steps and how evolutionarily conserved they are. We identified conserved non-coding regions in P. lividus by performing an alignment of all three available sea urchin genomes and applying a statistical model to infer non-coding conservation (Phastcons). We found that 39% of OCRs with a putative regulatory role (non-repetitive, non-transcription start site [TSS]) overlapped with the 81,142 evolutionarily conserved regions that otherwise represent 1.94% of the genome (17.9 Mb) (Fisher’s exact test, p < 1e−9). We further assessed the sequence conservation of putative regulatory elements across development by assessing the evolutionary conservation of OCRs active at specific stages (Figure 1C).73 We identified the OCRs specific to the blastula, gastrula, and prism stages as the most conserved in sequence (Figure 7A).
Figure 7.

cis-Regulatory landscape conservation during sea urchin development
(A) Sequence conservation scores in OCRs showing stage-specific activation (distinct from the TSS and consecutively expressed). Arrowheads indicate the stages’ highest non-coding conservation. Const., constitutive. Dev1 and Dev2 correspond to populations of OCRs that show broad activation domains.
(B) Minimal Jensen-Shannon distance between staged transcriptomes of P. lividus, S. purpuratus, and B. lanceolatum. For each P. lividus stage, stages with minimal distance are highlighted by an arrowhead.
(C) Endomesoderm GRN recovered by regulatory network analysis at the late blastula stage.
(D) Enrichment scores in ATAC-seq footprints across the developmental stages of P. lividus. TFs playing a putative role in zygotic genome activation are highlighted (MZT TFs), with arrowheads pointing to Ets4 and SoxB1.
(E) Regulatory activity around the He2 gene with RNA-seq (red) and ATAC-seq signals (blue), where regulatory elements located at the 5′ end of the gene include several TFBS footprints for MZT TFs, including Ets4 and SoxB1.
We also compared the transcriptomic distance (Jensen-Shannon) between embryonic stages in sea urchin and deuterostome species to determine which embryonic stages exhibit the closest transcriptomic proximity25 (Figures 7B and S6A). The early blastula, gastrula, and prism stages that show the highest sequence conservation are also the ones that have the lowest transcriptomic divergence in the comparison of the two sea urchins (P. lividus and S. purpuratus) and the comparison with the cephalochordate amphioxus (Figure 7A).25,47,74 However, sea urchins appear to show a higher level of conservation at earlier stages (Figures 7B and S7A). This conservation can be explained by an earlier onset of major cell lineage specification at the early blastula stage.12
Regulatory landmarks during sea urchin development
To determine which TFs control successive phases of sea urchin development, we employed a footprinting approach to detect the most likely occurrences of TF binding events in the ATAC-seq signal at successive stages75 (Figure 7). Then, by using reconstructed gene families, we identified 815 TFs in P. lividus and assigned 568 of them to TFBSs derived from the JASPAR database, which were later employed to analyze the footprint of the ATAC-seq signal (Figure 7D; Table S10) that we compared with their gene expression across developmental stages (Figure S7A). To ascertain the validity of the regulatory interactions deduced from our chromatin profiling data, we also reconstructed, for each stage, the global gene-regulatory network (GRN) by leveraging chromatin accessibility in OCRs, the assignment of OCRs to genes, and gene expression.76 The resulting networks represent genes as vertices and regulatory interactions as edges and can be interrogated to highlight a specific subnetwork. This analysis recovered, for instance, the endomesoderm specification GRN (Figure 7C)11 and the skeletogenic GRN (Figure S7E)12 described previously for S. purpuratus, validating the idea that the OCRs we identified are indeed cis-regulatory modules that bind key TFs of these GRNs. While a small number of loci appear to be transcribed during cleavage stages (Figure S7A), we found that the onset of large-scale zygotic genome activation is taking place at the end of cleavage, in the early blastula stage, as pointed out previously77 (Figures 7D and S8B). Gene expression clustering (WGCNA) identifies small sets of genes specifically expressed in each of the cleavage stages, such as G-protein receptors (Oprx1, 16-cell), ionic channels (Sc5a2, 60-cell), Toll-like receptors (2-cell), or homeodomain genes (Figure S6D). However, zygotic expression of TFs appears to only start at the 60-cell to late cleavage stages and gradually increases to mid-blastula stage (Figure S6E). Transcripts encoding TFs are present as maternal messages and remain detectable in later stages. At the 16-cell stage, most OCRs correspond to constitutively active and not stage-specific elements (Figure 1C), with a limited ATAC signal at TSS, confirming that zygotic expression is not yet taking place (Figure S3C). Accordingly, the TFBSs enriched at the 16-cell stage (Figures 7D and 7E) are also enriched in the early blastula stage, with few of corresponding TFs showing detectable expression at these stages (Figure S7A), which could indicate that some chromatin regions are present in a relatively open configuration before zygotic genome activation.
Conversely, the early blastula stage is characterized by the enrichment in TFBSs for maternally expressed TFs such as Ets4 and SoxB1 (Figures 7D and S7B). Interestingly, SoxB1 and Ets4 have been implicated as major determinants in regulation of the expression of early-expressed genes, such as those encoding the Hatching enzyme (He) and the SpAN/BP10 protease, whose transcripts start to accumulate in the ectoderm of the embryo at the 8- to 16-cell stages.78,79,80 Consistent with this, we detected Ets4 binding motifs in an OCR located in the vicinity of the He2 gene (Figure 7E). These factors are therefore excellent candidates for regulators involved in triggering onset of zygotic transcription. Additional factors of the homeobox family (OTX2, PITX2, and MIX-1), nuclear receptor family (HNF4), and bZIP family (CREB1 and Myc) also have their binding sites enriched at the 16-cell and early blastula stages and may likely participate in activation of the zygotic genome (Figure 1D).
Later developmental stages showed increased TF motifs for developmental regulators expected to be active by mid-development, such as Sox, Otx, or Gsc factors. For instance, ATAC-seq footprints of SOXE, expressed in the left coelomic pouch that gives rise to the rudiment, and PITX2, expressed in the right coelomic pouch, are also enriched at the prism stage, consistent with establishment of the left-right asymmetry of the larva at this stage.81 Accessibility to FOX binding sites is restricted to the gastrula stage and subsequent stages. At the prism and then pluteus larva stage, we detected binding motifs for a set of circadian-controlled factors, such as CLOCK and ARNT (see above), HNF factor and bZIP factor, as well as CEBP-related factors. The pluteus larva stage similarly shows fewer OCRs (Figure 1) and limited enrichment of TFBSs. The most characteristic larva-specific factors are Ari5b, which plays a role in organ growth in vertebrates, and Fuk-1, which bears similarity to NFATC2, which a putative role in immune system activation in vertebrates. The role of TFs at the successive developmental stages is confirmed by analysis of their influence in the GRNs reconstructed at each stage, as estimated by their prominence in the network architecture or centrality (Figure 7D).
Our examination of chromatin occupancy and TF binding informs on the mechanism of zygotic genome activation as well as on the subsequent sequence of regulatory events coordinating development, such as establishment of cell lineages, segregation of germ layers, and activation of circadian gene expression, and ultimately should help to reconstruct GRNs controlling developmental processes.11
Discussion
Sea urchins, as echinoderms, exhibit a unique and derived body plan with pentaradial symmetry, which has originally been related to a reshuffling of GRNs caused by an extensive gene order change. This reshuffling was exemplified by the original description of a rearranged Hox cluster in S. purpuratus.15,16 Here, we performed gene order comparison between the available sea urchin models and between sea urchin and amphioxi and demonstrated that the chromosomal architecture of sea urchins retained the ALGs inherited from a bilaterian ancestor.26,29 These linkage groups were extensively reshuffled after whole-genome duplication in vertebrates or completely lost in tunicates and nematodes. Interestingly, while chromosomal architecture is very conserved, the local intrachromosomal gene order appears to evolve much faster in sea urchins than in vertebrates (Figure 3). While it could be tempting to link this observation with a faster evolution of gene regulation in sea urchins, most developmental and transcriptomics studies suggest conservation of GRNs and developmental mechanisms between sea urchin models, such as S. purpuratus, L. variegatus, and P. lividus.68,82 The relatively limited number of high-quality echinoderm and invertebrate genomes available at distinct evolutionary distances makes it difficult to determine whether the evolution gene order in sea urchins or in vertebrates constitutes the exception or the norm among bilaterians. This observation also suggests, more practically, that many loci will have a different organization and gene order between models such as P. lividus and S. purpuratus; for instance, the pmar1 gene locus (Figure 5A).
We also identified extensive echinoid-specific gene duplications and expansions and pinpointed that some novel echinoderm and echinoid structures, such as tube feet and Aristotle’s lantern, captured the expression of many of these recently evolved genes. A similar enrichment of new genes has, for instance, been witnessed with the mollusc radula63 or mollusc shell.83 Specialization of gene expression after duplication is similar to that observed for WGD duplicates in vertebrates or other lineage-specific duplicates in chordates.25,50 We also explored the origin of the pmar1 class of homeobox genes involved in cell lineage determination in an echinoid-specific fashion64 and identified a novel family of pmar1-like homeobox genes, the pop genes, that arose in euechinoids and that share with pmar1 the ability to promote formation of the skeletogenic mesoderm. Remarkably, homeodomain genes acting at early cleavage stages, such as Paired or TALE genes, have shown the propensity to undergo lineage-specific duplication in other animal lineages, such as mammals84 or spiralians,85 suggesting a recurrent phenomenon during animal evolution.
Interestingly, by using RNA sequencing (RNA-seq) to monitor gene expression and ATAC-seq to explore the open chromatin domains, we were able to perform evolutionary comparisons of gene expression profiles and gene-regulatory modules across species. Our data suggest possible long-range conservation of regulatory logic between sea urchins and chordates (Figure 6), which is consistent with the idea of deeply conserved regulatory mechanisms controlling animal development, although experimental testing of these regulatory mechanisms will be required to validate this idea.86,87 We showed that early development (cleavage) was the most divergent stage at the gene expression level, even between two sea urchin species that split 75 mya, possibly suggesting that the dynamics of zygotic genome activation might vary across species (Figure 7).38 Finally, we confirmed that tightly regulated and large-scale transcription of the zygotic genome did not occur before the early blastula stage in P. lividus (Figure 7).
In sum, we identified conserved principles of gene regulation across deuterostomes in terms of genomic location and of activity of regulatory elements during development. We showed that these gene-regulatory modules are maintained despite the fast intrachromosomal gene order change in sea urchin genomes. The detected conservation of cis-regulatory modules complements previous observations comparing vertebrates and classic model systems like Drosophila or C. elegans and suggests that, despite their derived body plan, the presence of a larval stage and of mechanisms of early determination of embryonic cell lineages, echinoderms preserved such principles.88
Limitations of the study
Our analysis of gene order in sea urchins is limited by the extent of available genomes. With more echinoderm and invertebrate genomes, we could generalize observed trends of intrachromosomal and interchromosomal gene order changes and determine which, of sea urchins or vertebrates, is representative of the ancestral state. We also think that functional work targeting some of the candidate genes proposed in this study to be expressed preferentially in urchin novelties would be important to appreciate their role; for instance, in the water vascular system or Aristotle’s lantern. Moreover, our characterization of the accessible and active genomic region is limited to the “bulk” whole embryo and could be expanded across germ layers and cell lineages using approaches such as single-cell RNA-seq and ATAC-seq.
STAR★Methods
Key resources table
| REAGENT or RESOURCE | SOURCE | IDENTIFIER |
|---|---|---|
| Crtical commercial assays | ||
| TruSeq DNA library | Illumina | FC-121-2001 |
| Nextera Mate-pair Kit | Illumina | FC-132-1001 |
| TruSeq RNA Library | Illumina | RS-122-2001 |
| TRIzol reagent | Invitrogen | 15596026 |
| pGEM-T Easy | Promega | A1360 |
| DIG RNA Labeling Kit (SP6/T7) | Roche | 11175025910 |
| NBT/BCIP | Roche | 11681451001 |
| Anti-Digoxigenin-AP, Fab fragments | Roche | 11093274910 |
| mMessage mMachine kit | Invitrogen | AM1344 |
| Nextera DNA Library prep | Illumina | FC-121-1030 |
| Digitonin | Promega | G9441 |
| NEBNext Ultra II Q5 Master Mix | NEB | M0544S |
| DNA Clean & Concentrator Kit-5 | Zymo | D4004 |
| CUT&Tag-IT™ Assay Kit | Activemotif | 53160 |
| Histone H3K27ac antibody (pAb) | Activemotif | 39134 |
| SPRIselect | Beckman Coulter | B23318 |
| Experimental models: organisms/strains | ||
| Paracentrotus lividus adult wild-type | Collected from the wild, bay of Naples | N/A |
| Paracentrotus lividus embryos and larvae wild-type | Spawn in the lab from adults collected in the wild bay of Villefranche-sur-Mer | N/A |
| Software and algorithms | ||
| Meraculous (v2.2.2.2) | Chapman et al.89 | https://jgi.doe.gov/data-and-tools/software-tools/meraculous/ |
| Haplomerger (v2, 20151124 build) | Huang et al.90 | https://github.com/mapleforest/HaploMerger2 |
| PBJelly (v15.8.24) | English et al.91 | https://sourceforge.net/projects/pb-jelly/ |
| HiRise | Putnam et al.92 | https://github.com/DovetailGenomics/HiRise_July2015_GR |
| Busco (v5.1.3) | Simão et al.93 | https://busco.ezlab.org/ |
| Trinity (2.11.0) | Grabherr et al.94 | https://github.com/trinityrnaseq/trinityrnaseq |
| GMAP | Wu et al.95 | http://research-pub.gene.com/gmap/ |
| Portcullis | Mapleson et al.96 | https://github.com/EI-CoreBioinformatics/portcullis |
| Mikado (v1.2.1) | Venturini et al.97 | https://github.com/EI-CoreBioinformatics/mikado |
| Augustus (v3.3.3) | Stanke et al.98 | https://github.com/Gaius-Augustus/Augustus |
| FEELnc | Wucher et al.99 | https://github.com/tderrien/FEELnc |
| MMSeqs2 (12-113e3) | Steinegger et al.100 | https://github.com/soedinglab/MMseqs |
| Broccoli (v1.2) | Derelle et al.101 | https://github.com/broccolijs/broccoli |
| ete3 | Huerta-Cepas et al.102 | http://etetoolkit.org/ |
| Msaprobs (v0.9.7) | Liu et al.103 | https://msaprobs.sourceforge.net/homepage.htm |
| IQTREE (v2.1.1) | Nguyen et al.104 | http://www.iqtree.org/ |
| Generax (v1.2.2) | Morel et al.105 | https://github.com/BenoitMorel/GeneRax |
| Bedtools/pybedtools | Dale et al.106 | https://daler.github.io/pybedtools/ |
| STAR (v2.5.2b) | Dobin et al.107 | https://github.com/alexdobin/STAR |
| Stringtie (v1.3.3b) | Pertea et al.108 | https://ccb.jhu.edu/software/stringtie/ |
| Taco (v0.7.3) | Niknafs et al.109 | https://tacorna.github.io/ |
| Trinity (v2.5.1) | Grabherr et al.94 | https://github.com/trinityrnaseq/trinityrnaseq/ |
| Subread package (v1.6.3) | Liao et al.110 | https://subread.sourceforge.net/ |
| WGCNA (v1.7.0) | Langfelder et al.60 | https://cran.r-project.org/web/packages/WGCNA/ |
| mfuzz (v2.54.0) | Futschik et al.69 | https://doi.org/10.18129/B9.bioc.Mfuzz |
| Generich (v0.6) | N/A | https://github.com/jsh58/Genrich |
| Phastcons | Siepel et al.111 | http://compgen.cshl.edu/phast/ |
| Lastz | N/A | https://github.com/lastz/lastz |
| TOBIAS (v0.12.10) | Bentsen et al.75 | https://github.com/loosolab/TOBIAS |
| ANANSE | Xu et al.76 | https://github.com/vanheeringen-lab/ANANSE |
| Deposited data | ||
| pop1, pop2 and pop3 transcripts | This paper | ON325581, ON325582, ON325583. |
| P. lividus genome | This paper | PRJEB25800 |
| P. lividus RNA-seq and ATAC-seq | This paper | GEO: GSE202034 |
| Other | ||
| S. purpuratus transcriptome | Tu et al.112 | PRJNA81157 |
| B. lanceolatum transcriptome | Marlétaz et al.25 | PRJNA416866/GEO: GSE106430 |
| S. pupuratus genome | Sea Urchin Genome Sequencing Consortium et al.10 | PRJNA10736 |
| L. variegatus genome | Davidson et al.21 | PRJNA657258 |
Resource availability
Lead contact
Further information and requests for resources and reagents should be directed to the lead contact, Ferdinand Marlétaz (f.marletaz@ucl.ac.uk).
Materials availability
Requests for clones and constructs of pmar and pop genes should be adressed to Thierry Lepage (Thierry.Lepage@unice.fr)
Method details
DNA extraction and sequencing
DNA was extracted from sperm from a single male individual collected in Naples (Italy). Sperm cells were concentrated by centrifugation, washed repeatedly, and subsequently embedded in 2% low melting agarose. Sperm cells were lysed in a solution of 1% SDS, 10mM Tris (pH 8) and 100mM EDTA and then resuspended in a solution of 0.2% N-laurylsarcosine, 2mM Tris (pH 9) and 0.13 mM EDTA. DNA was released from the agarose blocks using agarase.
Illumina sequencing libraries were prepared at Genoscope (Evry, France) using TruSeq kit for fragment library and Nextera Mate-pair Kit for mate-pair libraries. These libraries were sequenced on MiSeq, HiSeq2500 and HiSeq2000 instruments at Genoscope (see Table S1) and reads were quality trimmed using a custom script derived from the fastx toolkit. Long-insert Pacific bioscience libraries were prepared and 20 SMRT cells were sequenced on an RSII instrument at the Genotoul plateforme (INRA, Toulouse, France) with the P6C4 chemistry. Sequencing data was submitted to ENA under the master PRJEB25800 accession.
Genome assembly
Genome size was evaluated using the k-mer spectrum approach as described in.113 All occurences of 31-mer were counted in the fragment data using Jellyfish.114 The haploid genome size was estimated at ∼845Mb. The presence of two well defined coverage peaks, with the main one at half coverage was indicative of high levels of polymorphism (3%).
The Illumina data was assembled using Meraculous (v2.2.2.2) and using a k-mer of 91 and ‘diploid_mode = 2’ to enable the split assembly of both haplotypes in stringent conditions.115 Briefly, Meraculous performs a de Brujin graph contig assembly after excluding erroneous low frequency k-mers followed by subsequent greedy scaffolding rounds using mate-pair libraries and a minimum of 2 or 3 links to create a link between contigs. Finally, gaps in the assembly were closed using contig extension and paired-end information. We obtained a 1394Mb diploid assembly with a large fraction of residual gaps (20.7%) (Table S2).
To fill the gaps, and improve the Illumina assembly, we performed gap-filling and local reassembly using the PBJelly tool91 (v15.8.24). PBJelly aligns the Pacbio reads to the assembly using the Blasr aligner designed to account for underlying read error profile, then collects reads surrounding and spanning gaps and scaffold extremity regions and assemble them with the ALLORA assembler relying on a OLC (overlap-layout-consens) design. Resulting error-prone assembled sequences are used to fill gaps and extend scaffolds. We used the parameters ‘-minMatch 8 -sdpTupleSize 8 -minPctIdentity 75 -bestn 1 -nCandidates 10 -maxScore −500’ for blasr alignment. The resulting patched assembly has a reduced fraction of gaps (4.9%) and incorporates 1,475Mb of assembled DNA for a 1,551Mb total size (Table S2).
To generate a haploid reference genome from our diploid assembly, we employed the Haplomerger (v2, 20151124 build), which relies on a graph of reciprocal LASTZ alignments to extract the best path across haplotype scaffolds.116 Before reciprocal alignments, we masked repetitive regions in the diploid assembly with RepeatMasker using a custom repeat library (see below) and a custom scoring matrix obtained with the script lastz_D_Wrapper.pl. We then applied module A aimed at detecting and splitting misassembled scaffolds, and module B aimed at performing haplotype reconciliation. Finally, residual haplotype sequences smaller to be processed by module A (<5000bp) were screened using module G relying on residual similarity to resolved haplotigs.
To further extend the contiguity of our haploid reference, we used long-range contact information from Chicago and HiC library prepared by Dovetail Genomics (Santa Cruz, USA). The Chicago method relies on the reconstitution of synthetic chromatin in controlled condition followed by chromatin conformation capture and evenly distributed contact information in the 150 kb range. Library preparation is described in detail in.92 Alternatively, HiC chromatin conformation capture provides contact information at a broader range, and particularly helps reconstruct chromosomes which usually do not present much interactions in trans. Tissue was crosslinked in 1% PFA, and chromatin subsequently extracted, immobilised on SPRI beads, washed and digested with DpnII.117 After end-labelling, proximity ligation was carried out using T4 DNA ligase and cross-linking reversed using Proteinase K, removed from the beads and the DNA fragments were purified again on SPRI beads. Sequencing library was constructed using the NEB Ultra library preparation kit (New England Biolabs, Ipswitch). Chicago and HiC libraries were sequenced for 476M and 210M paired-end reads in 2 × 150bp mode on a HiSeq4000 instrument. Chicago and HiC data were processed through two distinct runs of the HiRise scaffolder. The final assembly shows the following BUSCO statistics (v5.1.3) when using the Metazoa gene set: C:94.7%[S:94.0%,D:0.7%],F:3.6%,M:1.7%,n:954.
Annotation
Transcripts assembled with Trinity (see below) were aligned to the genome using GMAP (version of 2018-03-25).118 These alignments and the merged stringtie assemblies were leveraged using Mikado (v1.2.1) to generate a high-quality reference transcriptome.97 A set of curated splice-junctions generated from RNA-seq alignments using Portcullis (v1.0.2) was also provided to Mikado.96 Putative fusion transcripts were detected by Blast comparison against Swissprot and ORFs were annotated using Trans-decoder (Haas et al. 2008). Transcripts derived from the reference transcriptome were selected to train the Augustus de novo gene prediction tool (Stanke et al. 2006). Exon and intron positions derived from the mikado consensus transcriptome were converted into hints for Augustus gene prediction.
We annotated repetitive regions in the genome by constructing a repeat library using RepeatModeler (v1.0.11) that was subsequently used for masking with RepeatMasker (v4.0.7). Repeat landscape was subsequently inferred by computing Kimura 2-parameters distances with the consensus for each repeat category. Gene models with half or more of their exons overlapping at 50% with repeats were discarded, yielding 41717 filtered gene models. Alternative transcripts and UTRs were subsequently incorporated using the PASA pipeline (Haas et al. 2008). These gene models contain a total number of 4915 distinct PFAM domains.
Long non-coding RNAs
For lncRNA annotation, we used all RNA-seq data from P. lividus available in SRA archive (accessions: PRJEB10269, PRJNA392084, PRJNA376650, PRJNA288758, PRJNA264358, 4787.4 M reads in total, 14.7 M reads per sample). After quality control with FastQC v0.11.6119 and trimming with Trimmomatic v0.39 (LEADING:20 TRAILING:20 MINLEN:25 ILLUMINACLIP:adapters.fa:2:30:10 SLIDINGWINDOW:10:20),120 we mapped the reads to the reference genome using HISAT2 v2.2.1121 and obtained a transcriptome assembly for each sample using StringTie v2.1.4122 by providing our gene models as a reference annotation file. We obtained 175 GTF files corresponding to the individual assemblies which were merged to obtain a reference GTF using the merge option from StringTie. The merged GTF was used to identify the candidate lncRNAs using FEELnc software99 in a three steps pipeline: i) filter out transcripts shorter than 200ncl, monoexonic and overlapping protein-coding exons, ii) discard transcripts with coding-potential and iii) classify the candidate lncRNAs according to their relative position in the genome. Given that there is no previous knowledge of lncRNAs in P. lividus, we used two different strategies to compute the coding-potential: i) we took a set of mRNAs and shuffled them while preserving 7-mer frequencies (shuffle approach), and ii) we provided as training set lncRNAs from a closely related species (S. purpuratus, reference approach). The number of candidate lncRNA transcripts obtained was 32,147 and 32,107 genes for the shuffle and reference approaches, respectively, with more than 99% overlap. After filtering the transcripts uniquely annotated by a single approach, we obtained a list of 32,001 candidate lncRNAs genes (56,259 transcripts). Subsequently, we estimated the abundance of the candidate lncRNAs in each SRA sample using the feature Counts function of the Rsubread package from Bioconductor110 and we classified genes according to their expression range using the filter ByExpr function from EdgeR package123 for R by setting the min.count parameter to 10. This allowed us to identify a high confidence lncRNAs set that includes genes that are expressed in most of the samples, consisting of 5,087 lncRNA genes.
Synteny and gene family reconstruction
To compute pairwise synteny comparisons, we used mutual-best-hits based on MMSeqs2 (MMSeqs2/12-113e3) comparisons between proteomes after selecting for the longest protein for each locus. After reindexing of gene coordinates, we used Fisher’s exact test to determine mutual enrichment of orthologues between chromosomes or scaffolds. To estimate the relationship between gene order and divergence time, we estimated as the fraction of orthologues located in blocks of 2 or more consecutive genes in the same order with no more than one interspersed gene (Figure 3). Corresponding python and R codes upload to https://github.com/paracentrotus/urchinpaper.
We used Broccoli (v1.2) for gene family comparisons using the species specified in Table S5101 and inferred clade specific gains and losses by comparing the content of each family with that of a reference species tree using the ete3 library.102 To assess duplication within gene families, families with less than 500 genes and at least 5 genes in 3 species were subjected to phylogenetic reconstruction: after alignment with Msaprobs (v0.9.7)103 and alignment trimming using clipkit (v0.1, option -m gappy),124 a tree was reconstructed using IQTREE (v2.1.1) assuming a LG4X + R model. Then, Generax (v1.2.2) was used to perform genes and species tree reconciliation and to detect duplication events in a maximum likelihood framework.105
Gene expression analyses
We extracted RNA for successive embryonic stages and several organs (Table S3) using Trizol reagent (Invitrogen). Strand-specific RNA-seq libraries were prepared using the TruSeq RNA Library (Illumina) and sequenced in a 2x150bp layout with an average of 64.6M reads per sample. Reads were aligned to the genome using STAR (v2.5.2b) at an average rate of 65.64% of unique mapping.107 A transcriptome was assembled for each sample using Stringtie (v1.3.3b)108 and sample-specific transcriptome assemblies were merged using Taco.109 The reads from all the samples were also assembled de novo using Trinity.94
Gene expression was quantified from reads aligned using STAR (v2.5.2b) and using featureCounts from the Subread package (v1.6.3)110 and counts converted in FPKM. We also evaluate the coverage of OCRs for both strands using featureCounts to evaluation their level of transcription on both strands.
We used WGCNA (v1.7.0) clustering for the full set of embryonic stages and organs. After filtering out genes with limited variance and counts, then, the ‘softpower’ parameters were estimated and set at 13, and clustering was run with a ‘signed’ network type.60 For all clustering analyses, FPKM were calculated and replicates if available were merged to obtain a single gene expression value. Then, we used mfuzz (v2.54.0) clustering to compare subsets of 8 embryonic stages in sea urchin, amphioxus and zebrafish using datasets for the two later as described in.25 After filtering genes with low expression or limited variability, expression values were normalised, the fuzzifier parameters (m) was estimated and the optimal number of clusters was determined by computing with minimal distance between cluster centroids (Dmin) for various numbers of clusters. To compare the evolutionary conservation of gene expression modules, a hypergeometric test was performed on the number of genes belonging to distinct gene families shared between each pair of alternate gene expression modules (accounting for possible many-to-many paralogy relationships between individual genes). Gene ontology enrichments were computed using the topGO package using terms transferring from PFAM annotation and Swissprot best hits (evalue 1e-10).125 Comparisons of transcriptomic distances across embryonic stages and were computing as Jensen-Shannon divergence and single-copy orthologues inferred using Broccoli as performed in.25 S. purpuratus data analyzed corresponds to PRJNA81157 and Branchiostoma floridae to PRJNA416866.
ATAC-seq
ATAC-seq was performed following the Omni-ATAC protocol using Digitonin (Promega) in addition to NP40 and Tween in the cell lysis buffer (Corces et al., 2017). Sea urchin eggs were fertilised in filtered sea water with 2 mM of Paraminobenzoic acid (Sigma) to prevent hardening of the fertilisation envelope. The fertilization envelope was then removed by repeated filtration on a nylon net (70 μM). Embryos at the appropriate stage were collected and washed in NaCl 0.55M twice then dissociated in Calcium-Magnesium artificial sea water by energetic pipetting. For each time point, different numbers of nuclei were tested, typically 50,000, 150,000 and 250,000 and at least two biological replicates generated Table S3). The integrity of the nuclei was checked on a microscope after staining the nuclei with Hoechst. After tagmentation the libraries were purified with a Zymo DNA clean up kit then a QPCR was performed on an aliquot of the eluted libraries using the Ad1 and Ad2.x primers and the corresponding Ct was determined for each sample.126 The libraries were then amplified at Ct+ 2 cycles. The quality of the libraries was checked on a 2% agarose gel to verify the size of the fragments and the nucleosome phasing.
Reads obtained for each library were mapped using Bowtie2 (v2.4.1) with the parameters `--very-sensitive` and `-k 10`127 and peak calling for open chromatin region was performed using Generich (v0.6) available at https://github.com/jsh58/Genrich using ATAC model (-j), keeping unpaired alignments (-y), removing PCR duplicates (-r) and excluding reads mapped to mitochondria (-e MT). At this step, we pooled biological and technical replicates together as Generich analyses each replicate separately and then combined them by summarising p values using Fisher’s method.
We then used pybed tools to generate a set of unified peaks from the peaks called at each stage, classify peaks according to the activity during development and perform intersection with masked repetitive regions and conserved regions, as well as assigning peaks to genes (see jupyter notebook). Unified OCRs were then classified as open at a given stage based on the intersection with peaks called at each stage (Figure 1C). For comparative coverage analyses (ATAC-seq, Cut&Tag, eRNA, Figure S3D), a randomised set of genome intervals of the same size distribution as the predicted OCRs was generated using bedtools shuffle.128
Conserved regions were calculated using Phastcons with the parameters `--target-coverage 0.25 --expected-length 12 --rho 0.4′ from a multi-alignment of 3 echinoid genomes performed with Roast (ref) that started with Lastz alignment to P. lividus species using parameters `--inner = 2000 --ydrop = 3400 --gapped thresh = 6000 --hspthresh = 2200′ and the ‘HoxD55’ substitution matrix.
Footprinting analysis was performed using TOBIAS (v0.12.10) and the JASPAR binding motifs using the `--time-series` parameter on the scored footprint bigwig files at successive stages, after correction yielding pairwise (Figure S8D) and overall (Figure 5D) enrichment scores. We associated JASPAR motifs with sea urchin transcription factors by identifying the sea urchin genes present in the same gene families as the human genes for which the TFBS were characterised. When multiple P. lividus genes were present in a given gene family, we determine orthology relationships by selecting the urchin gene that had the most recent last common ancestor with the motif-associated gene in the phylogenetic trees reconstructed for each gene family (Table S10). For enrichment analysis, the number of TFBS in the population of peaks associated with the gene of interest (<150kb of the TSS) was contrasted with the population of peaks associated with other genes in a hypergeometric test for all TFBS and subjected to BH correction for multiple testing (e.g. Table S8).
Network reconstruction was performed using ANANSE76 from ATAC-seq aligned BAM and the ‘gimme.vertebrate.v5.0’ binding motif database assigned to P. lividus TFs using gimme motif2factor script. Resulting network was reconstructed using the igraph package in R retaining edges with probably above 90% quantile. were for plotting and computation of centrality (degree index).
Cut&Tag
The assay was performed using the CUT&Tag-IT™ Kit and H3K27ac antibody (Active Motif Ref 39135)). Dissociated cells were lysed in a hypotonic buffer in the presence of NP40, Tween20 and Digitonin each at 0.1 % and nuclei were washed in Resuspension Buffer (RSB) (RSB:10mM Tris pH: 7,4, 10 mM NaCl, 3 mM MgCl2 and stored at -80°C in RSB containing 20 % glycerol. For stages swimming blastula, gastrula, prism and pluteus, 105 nuclei were used while for stage early blastula 15000 nuclei were used. Nuclei were thawed and washed once in wash buffer (20 mM Hepes pH: 7.5, 150 mM NaCl, 0.5 mM spermidine, 1x EDTA free Protease inhibitor cocktail and mixed with activated Concanavalin A beads and magnetized to remove liquid. Nuclei were then incubated with the primary antibody in Wash buffer containing digitonin at 0.05% for 2h at room temperature, washed in Wash buffer and incubated for 1h with secondary antibody (guinea pig anti-rabbit) diluted in Wash buffer supplemented with digitonin at 0.05%. The beads were then washed and resuspended in assembled proteinA-Tn5 transposomes diluted in wash buffer+ 300 mM NaCl for 1h. At the end of the incubation, beads were washed with wash buffer supplemented with 300 mM NaCl. After the wash, tagmentation was performed by adding 125 μl of tagmentation buffer supplemented with 10 mM MgCl2 and continued for 1h at 37°C. Following tagmentation, beads were magnetized, washed, and incubated for 1h at 37°C with proteinase K and SDS to digest the chromatin and release DNA fragments. At the end of the incubation, beads were magnetized and DNA was purified using 625 μl DNA binding buffer. Following purification, libraries were amplified by using 25 μl of DNA sample and 2.5 μl of a uniquely barcoded i5 primer and 2.5 μl of a uniquely barcoded i7 primer in a 50 μl PCR reaction with Q5 high-fidelity DNA polymerase. The program included gap-filling at 72°C then 14 cycles at 98°C for 10 seconds and 63°C for 10 seconds. After PCR, clean-up was performed by adding 55 μl of SPRI beads and eluting in 21 μl of DNA purification buffer. Libraries were then analyzed using the Agilent 4200 Tapestation instrument and sequenced. Reads were aligned using bowtie2 with the parameters ‘--local --very-sensitive --no-mixed --no-discordant --phred33 -I 10 -X 700 -3 75’ and coverage calculated for previously defined ATAC peaks using BAMScale.129 Coverage density heatmaps for ATAC-seq and Cut&Tag datasets were plotted using Deeptools ‘plotHeatmap’ function.130
In situ hybridization
The sequence of pop2 was retrieved from an EST library while the sequences of pop1 and pop3 were obtained from available transcriptomes. For in situ hybridisation the full-length sequence of all three genes were cloned into pGemT. pop1 and pop2 plasmids were linearised with NcoI and transcribed with SP6 polymerase. pop3 plasmid was linearised with SpeI and transcribed with T7 polymerase. In situ hybridisation was performed using standard methods (Harland 1991) with Digoxigenin labelled RNA probes and developed with chromogenic substrates NBT and BCIP. The Delta and alx1 probes have been described previously (Röttinger et al. 2004). Control and experimental embryos were developed for the same time in the same experiments. Embryos were imaged with an Axio Imager M2 microscope.
Overexpression of mRNA
For overexpression studies, the open reading frame of each pop gene was amplified by PCR and cloned into the pCS2 vector at the BamHI and XhoI sites. Capped mRNAs were synthesized from NotI-linearized templates using mMessage mMachine kit (Ambion) and SP6 polymerase. After synthesis, capped RNAs were purified on Sephadex G50 columns and quantitated by spectrophotometry. RNAs were mixed with Tetramethylrhodamine Dextran (10000 MW). pmar1 mRNA was injected at 30 μg/ml pop1, pop2 and pop3 mRNAs were injected at concentrations in the range 30–100 μg/mL with similar effects.
Quantification and statistical analysis
Various statistical tests were used to calculate p values as indicated in the methods section, figure legend, or text, where appropriate. Results were considered statistically significant when p < 0.05 or FDR<0.05 when multiple hypothesis correction was applied, unless stated otherwise. Statistical analyses were conducted using R (v4.1.0).
Acknowledgments
F.M. is supported by a Royal Society University research fellowship (URF\R1\191161) and a BBSRC research grant (BB/V01109X/). The authors acknowledge support from the Marine Genomics Network of Excellence (MGE), the European Marine Biological Resource Centre (EMBRC), and the Coordinated Research Infrastructures Building Enduring Life-science (CORBEL). Proximity ligation Chicago and HiC were supported by Dovetail Genomics (Cantata Bio). Pacbio sequencing was funded by a grant from the Agence Nationale de la Recherche (ANR) to T.L. (project ANR-14-CE11-0006-01) and by a grant from CORBEL to M.I.A. E.K.L. was supported by a fellowship from EMBRC. We thank Hiroshi Wada and Atsuko Yamazaki for providing the pmar sequences of Eucidaris tribuloides. C.P. and X.T. are funded by the grant PID2020-118550RB (MarGeCh), funded by MCIN/AEI/10.13039/501100011033 (Spanish Government). We thank Alexandre de Mendoza for insightful comments. We also thank Carla Falugi, Sonia Manzo, and Maeve S. Kelly for support in the early phases of the project.
Author contributions
C.G. initiated the project. M.I.A. prepared the genomic DNA. A.C., J.M.A., V.B., and P.W. supervised the acquisition of genomic data. T.L., A.J.P., M.B., C.D.S., M.I.A., and P.D. generated and processed genomic and transcriptome resources. G.L., L.B., M.I.A., A.-M.G., S.M., and T.L. processed and sequenced BAC clones. J.P., K.L., C.D.S., S.M., B.N., A.C., J.M.A., and V.B. generated sequencing libraries and processed the sequencing data. F.M., A.C., and J.M.A. assembled the genome. P.C., J.M., M.I.A., S.B.T.d.L., P.O., and T.L. collected samples for transcriptome analysis. P.D., E.K.L., F.M., and C.D.S. assembled the transcriptomes. C.P., M.P., and X.T. identified lncRNAs from transcriptomes. R.R., C.C., F.Z., A.N., M.A.R., C.F., S.M., M.D.C., R.R.C., J.Y.E., P.M., V.C., J.C., and M.D.B. contributed to the analyses of the genome sequence and to preparation of experimental materials. A.C., M.D.M., and T.L. identified, cloned, and performed the functional analysis of the pop genes. F.M. did the phylogenetic analysis of the pop genes. T.L. prepared and quality-checked the ATAC-seq and Cut&Tag libraries. S.L.G., T.Y., F.M., and D.G. processed and analyzed the ATAC-seq and Cut&Tag data. F.M. generated a chromosome scale assembly and performed integrative bioinformatics analyses. C.G. and T.L. supervised and coordinated the project. F.M. and T.L. wrote the paper. All authors commented and approved the manuscript.
Declaration of interests
The authors declare no competing interests.
Published: April 5, 2023
Footnotes
Supplemental information can be found online at https://doi.org/10.1016/j.xgen.2023.100295.
Contributor Information
Ferdinand Marlétaz, Email: f.marletaz@ucl.ac.uk.
Thierry Lepage, Email: thierry.lepage@unice.fr.
Supplemental information
Data and code availability
The pop1, pop2 and pop3 transcripts have been deposited to NCBI under the accessions Genbank: ON325581, Genbank: ON325582, Genbank: ON325583.
The genome (Genbank: GCA_940671915.1) and sequencing reads have been deposited to NCBI under the accession PRJEB25800.
The RNA-seq and ATAC-seq have also been deposited to NCBI Gene Expression Omnibus (GEO) under the accession GEO: GSE202034.
Other data files including genome assembly and annotation are available on zenodo (https://doi.org/10.5281/zenodo.7459274).
Code underlying the analyses is available on github: https://github.com/paracentrotus/genome.
References
- 1.Aristotle, Ross D., Smith A., J., Thompson, Wentworth D. Vol. 4. Historia animalium (Oxford University Press; 1910. (The Works of Aristotle). [Google Scholar]
- 2.McClay D.R. Evolutionary crossroads in developmental biology: sea urchins. Development. 2011;138:2639–2648. doi: 10.1242/dev.048967. [DOI] [PMC free article] [PubMed] [Google Scholar]
- 3.Ernst S.G. Offerings from an urchin. Dev. Biol. 2011;358:285–294. doi: 10.1016/j.ydbio.2011.06.021. [DOI] [PubMed] [Google Scholar]
- 4.Mooi R., David B. Radial symmetry, the anterior/posterior Axis, and echinoderm hox genes. Annu. Rev. Ecol. Evol. Syst. 2008;39:43–62. doi: 10.1146/annurev.ecolsys.39.110707.173521. [DOI] [Google Scholar]
- 5.Bruguière J.G. Chez Panckoucke; 1792. Histoire naturelle des vers. [Google Scholar]
- 6.Kapli P., Natsidis P., Leite D.J., Fursman M., Jeffrie N., Rahman I.A., Philippe H., Copley R.R., Telford M.J. Lack of support for Deuterostomia prompts reinterpretation of the first Bilateria. Sci. Adv. 2021;7:eabe2741. doi: 10.1126/sciadv.abe2741. [DOI] [PMC free article] [PubMed] [Google Scholar]
- 7.Arnone, M.I., Byrne, M., and Martinez, P. (2015). Echinodermata. In: Evolutionary Developmental Biology of Invertebrates. Vol 6 (Deuterostomia). In Evolutionary Developmental Biology of Invertebrates. Vol 6 (Deuterostomia) 10.1007/978-3-7091-1856-6_1.
- 8.Dylus D.V., Czarkwiani A., Stångberg J., Ortega-Martinez O., Dupont S., Oliveri P. Large-scale gene expression study in the ophiuroid Amphiura filiformis provides insights into evolution of gene regulatory networks. EvoDevo. 2016;7:2. doi: 10.1186/s13227-015-0039-x. [DOI] [PMC free article] [PubMed] [Google Scholar]
- 9.Revilla-i-Domingo R., Oliveri P., Davidson E.H. A missing link in the sea urchin embryo gene regulatory network: hesC and the double-negative specification of micromeres. Proc. Natl. Acad. Sci. USA. 2007;104:12383–12388. doi: 10.1073/pnas.0705324104. [DOI] [PMC free article] [PubMed] [Google Scholar]
- 10.Sea Urchin Genome Sequencing Consortium. Sodergren E., Weinstock G.M., Davidson E.H., Cameron R.A., Gibbs R.A., Angerer R.C., Angerer L.M., Arnone M.I., Burgess D.R., et al. The genome of the sea urchin Strongylocentrotus purpuratus. Science. 2006;314:941–952. doi: 10.1126/science.1133609. [DOI] [PMC free article] [PubMed] [Google Scholar]
- 11.Davidson E.H., Rast J.P., Oliveri P., Ransick A., Calestani C., Yuh C.-H., Minokawa T., Amore G., Hinman V., Arenas-Mena C., et al. A genomic regulatory network for development. Science. 2002;295:1669–1678. doi: 10.1126/science.1069883. [DOI] [PubMed] [Google Scholar]
- 12.Oliveri P., Tu Q., Davidson E.H. Global regulatory logic for specification of an embryonic cell lineage. Proc. Natl. Acad. Sci. USA. 2008;105:5955–5962. doi: 10.1073/pnas.0711220105. [DOI] [PMC free article] [PubMed] [Google Scholar]
- 13.Meadows J.R.S., Lindblad-Toh K. Dissecting evolution and disease using comparative vertebrate genomics. Nat. Rev. Genet. 2017;18:624–636. doi: 10.1038/nrg.2017.51. [DOI] [PubMed] [Google Scholar]
- 14.Pearson J.C., Lemons D., McGinnis W. Modulating Hox gene functions during animal body patterning. Nat. Rev. Genet. 2005;6:893–904. doi: 10.1038/nrg1726. [DOI] [PubMed] [Google Scholar]
- 15.Martinez P., Rast J.P., Arenas-Mena C., Davidson E.H. Organization of an echinoderm Hox gene cluster. Proc. Natl. Acad. Sci. USA. 1999;96:1469–1474. doi: 10.1073/pnas.96.4.1469. [DOI] [PMC free article] [PubMed] [Google Scholar]
- 16.Cameron R.A., Rowen L., Nesbitt R., Bloom S., Rast J.P., Berney K., Arenas-Mena C., Martinez P., Lucas S., Richardson P.M., et al. Unusual gene order and organization of the sea urchin hox cluster. J. Exp. Zool. B Mol. Dev. Evol. 2006;306:45–58. doi: 10.1002/jez.b.21070. [DOI] [PubMed] [Google Scholar]
- 17.Arenas-Mena C., Cameron A.R., Davidson E.H. Spatial expression of Hox cluster genes in the ontogeny of a sea urchin. Development. 2000;127:4631–4643. doi: 10.1242/dev.127.21.4631. [DOI] [PubMed] [Google Scholar]
- 18.Baughman K.W., McDougall C., Cummins S.F., Hall M., Degnan B.M., Satoh N., Shoguchi E. Genomic organization of Hox and ParaHox clusters in the echinoderm, Acanthaster planci. Genesis. 2014;52:952–958. doi: 10.1002/dvg.22840. [DOI] [PubMed] [Google Scholar]
- 19.Zhang X., Sun L., Yuan J., Sun Y., Gao Y., Zhang L., Li S., Dai H., Hamel J.-F., Liu C., et al. The sea cucumber genome provides insights into morphological evolution and visceral regeneration. PLoS Biol. 2017;15:e2003790. doi: 10.1371/journal.pbio.2003790. [DOI] [PMC free article] [PubMed] [Google Scholar]
- 20.Byrne M., Martinez P., Morris V. Evolution of a pentameral body plan was not linked to translocation of anterior Hox genes: the echinoderm HOX cluster revisited. Evol. Dev. 2016;18:137–143. doi: 10.1111/ede.12172. [DOI] [PubMed] [Google Scholar]
- 21.Davidson P.L., Guo H., Wang L., Berrio A., Zhang H., Chang Y., Soborowski A.L., McClay D.R., Fan G., Wray G.A. Chromosomal-level genome assembly of the sea urchin Lytechinus variegatus substantially improves functional genomic analyses. Genome Biol. Evol. 2020;12:1080–1086. doi: 10.1093/gbe/evaa101. [DOI] [PMC free article] [PubMed] [Google Scholar]
- 22.Li Y., Omori A., Flores R.L., Satterfield S., Nguyen C., Ota T., Tsurugaya T., Ikuta T., Ikeo K., Kikuchi M., et al. Genomic insights of body plan transitions from bilateral to pentameral symmetry in Echinoderms. Commun. Biol. 2020;3:371. doi: 10.1038/s42003-020-1091-1. [DOI] [PMC free article] [PubMed] [Google Scholar]
- 23.Shimeld S.M., Holland P.W. Vertebrate innovations. Proc. Natl. Acad. Sci. USA. 2000;97:4449–4452. doi: 10.1073/pnas.97.9.4449. [DOI] [PMC free article] [PubMed] [Google Scholar]
- 24.Putnam N.H., Butts T., Ferrier D.E.K., Furlong R.F., Hellsten U., Kawashima T., Robinson-Rechavi M., Shoguchi E., Terry A., Yu J.-K., et al. The amphioxus genome and the evolution of the chordate karyotype. Nature. 2008;453:1064–1071. doi: 10.1038/nature06967. [DOI] [PubMed] [Google Scholar]
- 25.Marlétaz F., Firbas P.N., Maeso I., Tena J.J., Bogdanovic O., Perry M., Wyatt C.D.R., de la Calle-Mustienes E., Bertrand S., Burguera D., et al. Amphioxus functional genomics and the origins of vertebrate gene regulation. Nature. 2018;564:64–70. doi: 10.1038/s41586-018-0734-6. [DOI] [PMC free article] [PubMed] [Google Scholar]
- 26.Simakov O., Marlétaz F., Yue J.-X., O’Connell B., Jenkins J., Brandt A., Calef R., Tung C.-H., Huang T.-K., Schmutz J., et al. Deeply conserved synteny resolves early events in vertebrate evolution. Nat. Ecol. Evol. 2020;4:820–830. doi: 10.1038/s41559-020-1156-z. [DOI] [PMC free article] [PubMed] [Google Scholar]
- 27.Seo H.C., Kube M., Edvardsen R.B., Jensen M.F., Beck A., Spriet E., Gorsky G., Thompson E.M., Lehrach H., Reinhardt R., Chourrout D. Miniature genome in the marine chordate Oikopleura dioica. Science. 2001;294:2506. doi: 10.1126/science.294.5551.2506. [DOI] [PubMed] [Google Scholar]
- 28.Simakov O., Kawashima T., Marlétaz F., Jenkins J., Koyanagi R., Mitros T., Hisata K., Bredeson J., Shoguchi E., Gyoja F., et al. Hemichordate genomes and deuterostome origins. Nature. 2015;527:459–465. doi: 10.1038/nature16150. [DOI] [PMC free article] [PubMed] [Google Scholar]
- 29.Simakov O., Bredeson J., Berkoff K., Marletaz F., Mitros T., Schultz D.T., O’Connell B.L., Dear P., Martinez D.E., Steele R.E., et al. Deeply conserved synteny and the evolution of metazoan chromosomes. Sci. Adv. 2022;8:eabi5884. doi: 10.1126/sciadv.abi5884. [DOI] [PMC free article] [PubMed] [Google Scholar]
- 30.Martín-Zamora F.M., Liang Y., Guynes K., Carrillo-Baltodano A.M., Davies B.E., Donnellan R.D., Tan Y., Moggioli G., Seudre O., Tran M., et al. Annelid functional genomics reveal the origins of bilaterian life cycles. Nature. 2023;615:105–110. doi: 10.1038/s41586-022-05636-7. [DOI] [PMC free article] [PubMed] [Google Scholar]
- 31.Hörstadius S. Clarendon Press; 1973. Experimental Embryology of Echinoderms. [Google Scholar]
- 32.Maderspacher F. Theodor Boveri and the natural experiment. Curr. Biol. 2008;18:R279–R286. doi: 10.1016/j.cub.2008.02.061. [DOI] [PubMed] [Google Scholar]
- 33.Boveri, T Uber mehrpolige Mitosen als Mittle zur Analyse des Zellkerns. Verh. Phys-med Ges Wulzburg NF. 1902;35:67–90. [Google Scholar]
- 34.Driesch H. Foundations of experimental embryology. 1892. The potency of the first two cleavage cells in echinoderm development. Experimental production of partial and double formations; pp. 38–55. [Google Scholar]
- 35.Rowan E. Bioarchaeological preservation and non-elite diet in the Bay of Naples: an analysis of the food remains from the Cardo V sewer at the Roman site of Herculaneum. Environ. Archaeol. 2017;22:318–336. doi: 10.1080/14614103.2016.1235077. [DOI] [Google Scholar]
- 36.Agnetta D., Badalamenti F., Ceccherelli G., Di Trapani F., Bonaviri C., Gianguzza P. Role of two co-occurring Mediterranean sea urchins in the formation of barren from Cystoseira canopy. Estuar. Coast Shelf Sci. 2015;152:73–77. doi: 10.1016/j.ecss.2014.11.023. [DOI] [Google Scholar]
- 37.Carreras C., García-Cisneros A., Wangensteen O.S., Ordóñez V., Palacín C., Pascual M., Turon X. East is East and West is West: population genomics and hierarchical analyses reveal genetic structure and adaptation footprints in the keystone species Paracentrotus lividus (Echinoidea) Divers. Distrib. 2020;26:382–398. doi: 10.1111/ddi.13016. [DOI] [Google Scholar]
- 38.Mongiardino Koch N., Thompson J.R., Hiley A.S., McCowin M.F., Armstrong A.F., Coppard S.E., Aguilera F., Bronstein O., Kroh A., Mooi R., Rouse G.W. Phylogenomic analyses of echinoid diversification prompt a re-evaluation of their fossil record. Elife. 2022;11:e72460. doi: 10.7554/eLife.72460. [DOI] [PMC free article] [PubMed] [Google Scholar]
- 39.Lipani C., Vitturi R., Sconzo G., Barbata G. Karyotype analysis of the sea urchin Paracentrotus lividus (Echinodermata): evidence for a heteromorphic chromosome sex mechanism. Mar. Biol. 1996;127:67–72. doi: 10.1007/bf00993645. [DOI] [Google Scholar]
- 40.Eno C.C., Böttger S.A., Walker C.W. Methods for karyotyping and for localization of developmentally relevant genes on the chromosomes of the purple sea urchin, Strongylocentrotus purpuratus. Biol. Bull. 2009;217:306–312. doi: 10.1086/BBLv217n3p306. [DOI] [PubMed] [Google Scholar]
- 41.Kaya-Okur H.S., Wu S.J., Codomo C.A., Pledger E.S., Bryson T.D., Henikoff J.G., Ahmad K., Henikoff S. CUT&Tag for efficient epigenomic profiling of small samples and single cells. Nat. Commun. 2019;10:1930. doi: 10.1038/s41467-019-09982-5. [DOI] [PMC free article] [PubMed] [Google Scholar]
- 42.Kouzarides T. Chromatin modifications and their function. Cell. 2007;128:693–705. doi: 10.1016/j.cell.2007.02.005. [DOI] [PubMed] [Google Scholar]
- 43.Panigrahi A., O’Malley B.W. Mechanisms of enhancer action: the known and the unknown. Genome Biol. 2021;22:108. doi: 10.1186/s13059-021-02322-1. [DOI] [PMC free article] [PubMed] [Google Scholar]
- 44.Range R., Lapraz F., Quirin M., Marro S., Besnardeau L., Lepage T. Cis-regulatory analysis of nodal and maternal control of dorsal-ventral axis formation by Univin, a TGF-beta related to Vg1. Development. 2007;134:3649–3664. doi: 10.1242/dev.007799. [DOI] [PubMed] [Google Scholar]
- 45.Boyle A.P., Araya C.L., Brdlik C., Cayting P., Cheng C., Cheng Y., Gardner K., Hillier L.W., Janette J., Jiang L., et al. Comparative analysis of regulatory information and circuits across distant species. Nature. 2014;512:453–456. doi: 10.1038/nature13668. [DOI] [PMC free article] [PubMed] [Google Scholar]
- 46.Wu J., Huang B., Chen H., Yin Q., Liu Y., Xiang Y., Zhang B., Liu B., Wang Q., Xia W., et al. The landscape of accessible chromatin in mammalian preimplantation embryos. Nature. 2016;534:652–657. doi: 10.1038/nature18606. [DOI] [PubMed] [Google Scholar]
- 47.Liang Y., Martín-Zamora F.M., Guynes K., Carrillo-Baltodano A.M., Tan Y., Moggioli G., Seudre O., Tran M., Mortimer K., Luscombe N.M., et al. Annelid functional genomics reveal the origins of bilaterian life cycles. bioRxiv. 2022 doi: 10.1101/2022.02.05.479245. Preprint at. [DOI] [PMC free article] [PubMed] [Google Scholar]
- 48.Madgwick A., Magri M.S., Dantec C., Gailly D., Fiuza U.-M., Guignard L., Hettinger S., Gomez-Skarmeta J.L., Lemaire P. Evolution of embryonic cis-regulatory landscapes between divergent Phallusia and Ciona ascidians. Dev. Biol. 2019;448:71–87. doi: 10.1016/j.ydbio.2019.01.003. [DOI] [PubMed] [Google Scholar]
- 49.Putnam N.H., Srivastava M., Hellsten U., Dirks B., Chapman J., Salamov A., Terry A., Shapiro H., Lindquist E., Kapitonov V.V., et al. Sea anemone genome reveals ancestral eumetazoan gene repertoire and genomic organization. Science. 2007;317:86–94. doi: 10.1126/science.1139158. [DOI] [PubMed] [Google Scholar]
- 50.Brasó-Vives M., Marlétaz F., Echchiki A., Mantica F., Acemel R.D., Gómez-Skarmeta J.L., Targa L.L., Pontarotti P., Tena J.J., Maeso I., et al. Parallel evolution of amphioxus and vertebrate small-scale gene duplications. bioRxiv. 2022 doi: 10.1101/2022.01.18.476203. Preprint at. [DOI] [PMC free article] [PubMed] [Google Scholar]
- 51.Zdobnov E.M., Bork P. Quantification of insect genome divergence. Trends Genet. 2007;23:16–20. doi: 10.1016/j.tig.2006.10.004. [DOI] [PubMed] [Google Scholar]
- 52.Holland P.W.H., Marlétaz F., Maeso I., Dunwell T.L., Paps J. New genes from old: asymmetric divergence of gene duplicates and the evolution of development. Philos. Trans. R. Soc. Lond. B Biol. Sci. 2017;372:20150480. doi: 10.1098/rstb.2015.0480. [DOI] [PMC free article] [PubMed] [Google Scholar]
- 53.Naville M., Henriet S., Warren I., Sumic S., Reeve M., Volff J.-N., Chourrout D. Massive changes of genome size driven by expansions of non-autonomous transposable elements. Curr. Biol. 2019;29:1161–1168.e6. doi: 10.1016/j.cub.2019.01.080. [DOI] [PubMed] [Google Scholar]
- 54.Lapraz F., Röttinger E., Duboc V., Range R., Duloquin L., Walton K., Wu S.-Y., Bradham C., Loza M.A., Hibino T., et al. RTK and TGF-β signaling pathways genes in the sea urchin genome. Dev. Biol. 2006;300:132–152. doi: 10.1016/j.ydbio.2006.08.048. [DOI] [PMC free article] [PubMed] [Google Scholar]
- 55.Furlong R.F., Holland P.W.H. Were vertebrates octoploid? Philos. Trans. R. Soc. Lond. B Biol. Sci. 2002;357:531–544. doi: 10.1098/rstb.2001.1035. [DOI] [PMC free article] [PubMed] [Google Scholar]
- 56.Brasó-Vives M., Marlétaz F., Echchiki A., Mantica F., Acemel R.D., Gómez-Skarmeta J.L., Hartasánchez D.A., Le Targa L., Pontarotti P., Tena J.J., et al. Parallel evolution of amphioxus and vertebrate small-scale gene duplications. Genome Biol. 2022;23:243. doi: 10.1186/s13059-022-02808-6. [DOI] [PMC free article] [PubMed] [Google Scholar]
- 57.Ettensohn C.A., Dey D. KirrelL, a member of the Ig-domain superfamily of adhesion proteins, is essential for fusion of primary mesenchyme cells in the sea urchin embryo. Dev. Biol. 2017;421:258–270. doi: 10.1016/j.ydbio.2016.11.006. [DOI] [PubMed] [Google Scholar]
- 58.Barsi J.C., Tu Q., Calestani C., Davidson E.H. Genome-wide assessment of differential effector gene use in embryogenesis. Development. 2015;142:3892–3901. doi: 10.1242/dev.127746. [DOI] [PMC free article] [PubMed] [Google Scholar]
- 59.Liu C., Eriste E., Sutton S., Chen J., Roland B., Kuei C., Farmer N., Jörnvall H., Sillard R., Lovenberg T.W. Identification of relaxin-3/INSL7 as an endogenous ligand for the orphan G-protein-coupled receptor GPCR135. J. Biol. Chem. 2003;278:50754–50764. doi: 10.1074/jbc.M308995200. [DOI] [PubMed] [Google Scholar]
- 60.Langfelder P., Horvath S. WGCNA: an R package for weighted correlation network analysis. BMC Bioinformatics. 2008;9:559. doi: 10.1186/1471-2105-9-559. [DOI] [PMC free article] [PubMed] [Google Scholar]
- 61.Kryuchkova-Mostacci N., Robinson-Rechavi M. Tissue-specificity of gene expression diverges slowly between orthologs, and rapidly between paralogs. PLoS Comput. Biol. 2016;12:e1005274. doi: 10.1371/journal.pcbi.1005274. [DOI] [PMC free article] [PubMed] [Google Scholar]
- 62.Tautz D., Domazet-Lošo T. The evolutionary origin of orphan genes. Nat. Rev. Genet. 2011;12:692–702. doi: 10.1038/nrg3053. [DOI] [PubMed] [Google Scholar]
- 63.Hilgers L., Hartmann S., Hofreiter M., von Rintelen T. Novel genes, ancient genes, and gene Co-option contributed to the genetic basis of the radula, a Molluscan innovation. Mol. Biol. Evol. 2018;35:1638–1652. doi: 10.1093/molbev/msy052. [DOI] [PMC free article] [PubMed] [Google Scholar]
- 64.Oliveri P., Carrick D.M., Davidson E.H. A regulatory gene network that directs micromere specification in the sea urchin embryo. Dev. Biol. 2002;246:209–228. doi: 10.1006/dbio.2002.0627. [DOI] [PubMed] [Google Scholar]
- 65.Cavalieri V., Geraci F., Spinelli G. Diversification of spatiotemporal expression and copy number variation of the echinoid hbox12/pmar1/micro1 multigene family. PLoS One. 2017;12:e0174404. doi: 10.1371/journal.pone.0174404. [DOI] [PMC free article] [PubMed] [Google Scholar]
- 66.Yamazaki A., Morino Y., Urata M., Yamaguchi M., Minokawa T., Furukawa R., Kondo M., Wada H. pmar1/phb homeobox genes and the evolution of the double-negative gate for endomesoderm specification in echinoderms. Development. 2020;147:dev182139. doi: 10.1242/dev.182139. [DOI] [PubMed] [Google Scholar]
- 67.Zhong Y.-F., Butts T., Holland P.W.H. HomeoDB: a database of homeobox gene diversity. Evol. Dev. 2008;10:516–518. doi: 10.1111/j.1525-142X.2008.00266.x. [DOI] [PubMed] [Google Scholar]
- 68.Gildor T., Ben-Tabou de-Leon S. Comparative study of regulatory circuits in two sea urchin species reveals tight control of timing and high conservation of expression dynamics. PLoS Genet. 2015;11:e1005435. doi: 10.1371/journal.pgen.1005435. [DOI] [PMC free article] [PubMed] [Google Scholar]
- 69.Futschik M.E., Carlisle B. Noise-robust soft clustering of gene expression time-course data. J. Bioinform. Comput. Biol. 2005;3:965–988. doi: 10.1142/s0219720005001375. [DOI] [PubMed] [Google Scholar]
- 70.Almudi I., Vizueta J., Wyatt C.D.R., de Mendoza A., Marlétaz F., Firbas P.N., Feuda R., Masiero G., Medina P., Alcaina-Caro A., et al. Genomic adaptations to aquatic and aerial life in mayflies and the origin of insect wings. Nat. Commun. 2020;11:2631. doi: 10.1038/s41467-020-16284-8. [DOI] [PMC free article] [PubMed] [Google Scholar]
- 71.Wood N.J., Mattiello T., Rowe M.L., Ward L., Perillo M., Arnone M.I., Elphick M.R., Oliveri P. Neuropeptidergic systems in pluteus larvae of the sea urchin Strongylocentrotus purpuratus: neurochemical complexity in a “simple” nervous system. Front. Endocrinol. 2018;9:628. doi: 10.3389/fendo.2018.00628. [DOI] [PMC free article] [PubMed] [Google Scholar]
- 72.Patke A., Young M.W., Axelrod S. Molecular mechanisms and physiological importance of circadian rhythms. Nat. Rev. Mol. Cell Biol. 2020;21:67–84. doi: 10.1038/s41580-019-0179-2. [DOI] [PubMed] [Google Scholar]
- 73.Nord A.S., Blow M.J., Attanasio C., Akiyama J.A., Holt A., Hosseini R., Phouanenavong S., Plajzer-Frick I., Shoukry M., Afzal V., et al. Rapid and pervasive changes in genome-wide enhancer usage during mammalian development. Cell. 2013;155:1521–1531. doi: 10.1016/j.cell.2013.11.033. [DOI] [PMC free article] [PubMed] [Google Scholar]
- 74.Irie N., Kuratani S. Comparative transcriptome analysis reveals vertebrate phylotypic period during organogenesis. Nat. Commun. 2011;2:248. doi: 10.1038/ncomms1248. [DOI] [PMC free article] [PubMed] [Google Scholar]
- 75.Bentsen M., Goymann P., Schultheis H., Klee K., Petrova A., Wiegandt R., Fust A., Preussner J., Kuenne C., Braun T., et al. ATAC-seq footprinting unravels kinetics of transcription factor binding during zygotic genome activation. Nat. Commun. 2020;11:4267. doi: 10.1038/s41467-020-18035-1. [DOI] [PMC free article] [PubMed] [Google Scholar]
- 76.Xu Q., Georgiou G., Frölich S., van der Sande M., Veenstra G.J.C., Zhou H., van Heeringen S.J. ANANSE: an enhancer network-based computational approach for predicting key transcription factors in cell fate determination. Nucleic Acids Res. 2021;49:7966–7985. doi: 10.1093/nar/gkab598. [DOI] [PMC free article] [PubMed] [Google Scholar]
- 77.Davidson E.H. 2nd ed. Academic Press Inc); 1976. Gene Activity in Early Development. [Google Scholar]
- 78.Kenny A.P., Kozlowski D., Oleksyn D.W., Angerer L.M., Angerer R.C. SpSoxB1, a maternally encoded transcription factor asymmetrically distributed among early sea urchin blastomeres. Development. 1999;126:5473–5483. doi: 10.1242/dev.126.23.5473. [DOI] [PubMed] [Google Scholar]
- 79.Wei Z., Angerer R.C., Angerer L.M. Identification of a new sea urchin ets protein, SpEts4, by yeast one-hybrid screening with the hatching enzyme promoter. Mol. Cell Biol. 1999;19:1271–1278. doi: 10.1128/MCB.19.2.1271. [DOI] [PMC free article] [PubMed] [Google Scholar]
- 80.Ghiglione C., Lhomond G., Lepage T., Gache C. Cell-autonomous expression and position-dependent repression by Li of two zygotic genes during sea urchin early development. EMBO J. 1993;12:87–96. doi: 10.1002/j.1460-2075.1993.tb05634.x. [DOI] [PMC free article] [PubMed] [Google Scholar]
- 81.Duboc V., Röttinger E., Lapraz F., Besnardeau L., Lepage T. Left-right asymmetry in the sea urchin embryo is regulated by nodal signaling on the right side. Dev. Cell. 2005;9:147–158. doi: 10.1016/j.devcel.2005.05.008. [DOI] [PubMed] [Google Scholar]
- 82.Hogan J.D., Keenan J.L., Luo L., Ibn-Salem J., Lamba A., Schatzberg D., Piacentino M.L., Zuch D.T., Core A.B., Blumberg C., et al. The developmental transcriptome for Lytechinus variegatus exhibits temporally punctuated gene expression changes. Dev. Biol. 2020;460:139–154. doi: 10.1016/j.ydbio.2019.12.002. [DOI] [PubMed] [Google Scholar]
- 83.Kocot K.M., Aguilera F., McDougall C., Jackson D.J., Degnan B.M. Sea shell diversity and rapidly evolving secretomes: insights into the evolution of biomineralization. Front. Zool. 2016;13:23. doi: 10.1186/s12983-016-0155-z. [DOI] [PMC free article] [PubMed] [Google Scholar]
- 84.Maeso I., Dunwell T.L., Wyatt C.D.R., Marlétaz F., Vető B., Bernal J.A., Quah S., Irimia M., Holland P.W.H. Evolutionary origin and functional divergence of totipotent cell homeobox genes in eutherian mammals. BMC Biol. 2016;14:45. doi: 10.1186/s12915-016-0267-0. [DOI] [PMC free article] [PubMed] [Google Scholar]
- 85.Morino Y., Hashimoto N., Wada H. Expansion of TALE homeobox genes and the evolution of spiralian development. Nat. Ecol. Evol. 2017;1:1942–1949. doi: 10.1038/s41559-017-0351-z. [DOI] [PubMed] [Google Scholar]
- 86.Erwin D.H. Early origin of the bilaterian developmental toolkit. Philos. Trans. R. Soc. Lond. B Biol. Sci. 2009;364:2253–2261. doi: 10.1098/rstb.2009.0038. [DOI] [PMC free article] [PubMed] [Google Scholar]
- 87.Wong E.S., Zheng D., Tan S.Z., Bower N.L., Garside V., Vanwalleghem G., Gaiti F., Scott E., Hogan B.M., Kikuchi K., et al. Deep conservation of the enhancer regulatory code in animals. Science. 2020;370:eaax8137. doi: 10.1126/science.aax8137. [DOI] [PubMed] [Google Scholar]
- 88.Gerstein M.B., Rozowsky J., Yan K.-K., Wang D., Cheng C., Brown J.B., Davis C.A., Hillier L., Sisu C., Li J.J., et al. Comparative analysis of the transcriptome across distant species. Nature. 2014;512:445–448. doi: 10.1038/nature13424. [DOI] [PMC free article] [PubMed] [Google Scholar]
- 89.Chapman J.A., Ho I.Y., Goltsman E., Rokhsar D.S. Meraculous2: fast accurate short-read assembly of large polymorphic genomes. arXiv. 2016 doi: 10.48550/arXiv.1608.01031. Preprint at. [DOI] [Google Scholar]
- 90.Huang S., Kang M., Xu A. HaploMerger2: rebuilding both haploid sub-assemblies from high-heterozygosity diploid genome assembly. Bioinformatics. 2017;33:2577–2579. doi: 10.1093/bioinformatics/btx220. [DOI] [PMC free article] [PubMed] [Google Scholar]
- 91.English A.C., Richards S., Han Y., Wang M., Vee V., Qu J., Qin X., Muzny D.M., Reid J.G., Worley K.C., et al. Mind the gap: upgrading genomes with Pacific Biosciences RS long-read sequencing technology. PLoS One. 2012;7:e47768. doi: 10.1371/journal.pone.0047768. [DOI] [PMC free article] [PubMed] [Google Scholar]
- 92.Putnam N.H., O’Connell B.L., Stites J.C., Rice B.J., Blanchette M., Calef R., Troll C.J., Fields A., Hartley P.D., Sugnet C.W., et al. Chromosome-scale shotgun assembly using an in vitro method for long-range linkage. Genome Res. 2016;26:342–350. doi: 10.1101/gr.193474.115. [DOI] [PMC free article] [PubMed] [Google Scholar]
- 93.Simão F.A., Waterhouse R.M., Ioannidis P., Kriventseva E.V., Zdobnov E.M. BUSCO: assessing genome assembly and annotation completeness with single-copy orthologs. Bioinformatics. 2015;31:3210–3212. doi: 10.1093/bioinformatics/btv351. [DOI] [PubMed] [Google Scholar]
- 94.Grabherr M.G., Haas B.J., Yassour M., Levin J.Z., Thompson D.A., Amit I., Adiconis X., Fan L., Raychowdhury R., Zeng Q., et al. Full-length transcriptome assembly from RNA-Seq data without a reference genome. Nat. Biotechnol. 2011;29:644–652. doi: 10.1038/nbt.1883. [DOI] [PMC free article] [PubMed] [Google Scholar]
- 95.Wu T.D., Watanabe C.K. GMAP: a genomic mapping and alignment program for mRNA and EST sequences. Bioinformatics. 2005;21:1859–1875. doi: 10.1093/bioinformatics/bti310. [DOI] [PubMed] [Google Scholar]
- 96.Mapleson D., Venturini L., Kaithakottil G., Swarbreck D. Efficient and accurate detection of splice junctions from RNA-seq with Portcullis. GigaScience. 2018;7:giy131. doi: 10.1093/gigascience/giy131. [DOI] [PMC free article] [PubMed] [Google Scholar]
- 97.Venturini L., Caim S., Kaithakottil G.G., Mapleson D.L., Swarbreck D. Leveraging multiple transcriptome assembly methods for improved gene structure annotation. GigaScience. 2018;7:giy093. doi: 10.1093/gigascience/giy093. [DOI] [PMC free article] [PubMed] [Google Scholar]
- 98.Stanke M., Keller O., Gunduz I., Hayes A., Waack S., Morgenstern B. AUGUSTUS: ab initio prediction of alternative transcripts. Nucleic Acids Res. 2006;34:W435–W439. doi: 10.1093/nar/gkl200. [DOI] [PMC free article] [PubMed] [Google Scholar]
- 99.Wucher V., Legeai F., Hédan B., Rizk G., Lagoutte L., Leeb T., Jagannathan V., Cadieu E., David A., Lohi H., et al. FEELnc: a tool for long non-coding RNA annotation and its application to the dog transcriptome. Nucleic Acids Res. 2017;45:e57. doi: 10.1093/nar/gkw1306. [DOI] [PMC free article] [PubMed] [Google Scholar]
- 100.Steinegger M., Söding J. MMseqs2 enables sensitive protein sequence searching for the analysis of massive data sets. Nat. Biotechnol. 2017;35:1026–1028. doi: 10.1038/nbt.3988. [DOI] [PubMed] [Google Scholar]
- 101.Derelle R., Philippe H., Colbourne J.K. Broccoli: combining phylogenetic and network analyses for orthology assignment. Mol. Biol. Evol. 2020;37:3389–3396. doi: 10.1093/molbev/msaa159. [DOI] [PubMed] [Google Scholar]
- 102.Huerta-Cepas J., Serra F., Bork P. Ete 3: reconstruction, analysis, and visualization of phylogenomic data. Mol. Biol. Evol. 2016;33:1635–1638. doi: 10.1093/molbev/msw046. [DOI] [PMC free article] [PubMed] [Google Scholar]
- 103.Liu Y., Schmidt B., Maskell D.L. MSAProbs: multiple sequence alignment based on pair hidden Markov models and partition function posterior probabilities. Bioinformatics. 2010;26:1958–1964. doi: 10.1093/bioinformatics/btq338. [DOI] [PubMed] [Google Scholar]
- 104.Nguyen L.-T., Schmidt H.A., von Haeseler A., Minh B.Q. IQ-TREE: a fast and effective stochastic algorithm for estimating maximum-likelihood phylogenies. Mol. Biol. Evol. 2015;32:268–274. doi: 10.1093/molbev/msu300. [DOI] [PMC free article] [PubMed] [Google Scholar]
- 105.Morel B., Kozlov A.M., Stamatakis A., Szöllősi G.J. GeneRax: a tool for species-tree-aware maximum likelihood-based gene family tree inference under gene duplication, transfer, and loss. Mol. Biol. Evol. 2020;37:2763–2774. doi: 10.1093/molbev/msaa141. [DOI] [PMC free article] [PubMed] [Google Scholar]
- 106.Dale R.K., Pedersen B.S., Quinlan A.R. Pybedtools: a flexible Python library for manipulating genomic datasets and annotations. Bioinformatics. 2011;27:3423–3424. doi: 10.1093/bioinformatics/btr539. [DOI] [PMC free article] [PubMed] [Google Scholar]
- 107.Dobin A., Davis C.A., Schlesinger F., Drenkow J., Zaleski C., Jha S., Batut P., Chaisson M., Gingeras T.R. STAR: ultrafast universal RNA-seq aligner. Bioinformatics. 2013;29:15–21. doi: 10.1093/bioinformatics/bts635. [DOI] [PMC free article] [PubMed] [Google Scholar]
- 108.Pertea M., Pertea G.M., Antonescu C.M., Chang T.-C., Mendell J.T., Salzberg S.L. StringTie enables improved reconstruction of a transcriptome from RNA-seq reads. Nat. Biotechnol. 2015;33:290–295. doi: 10.1038/nbt.3122. [DOI] [PMC free article] [PubMed] [Google Scholar]
- 109.Niknafs Y.S., Pandian B., Iyer H.K., Chinnaiyan A.M., Iyer M.K. TACO produces robust multisample transcriptome assemblies from RNA-seq. Nat. Methods. 2017;14:68–70. doi: 10.1038/nmeth.4078. [DOI] [PMC free article] [PubMed] [Google Scholar]
- 110.Liao Y., Smyth G.K., Shi W. The R package Rsubread is easier, faster, cheaper and better for alignment and quantification of RNA sequencing reads. Nucleic Acids Res. 2019;47:e47. doi: 10.1093/nar/gkz114. [DOI] [PMC free article] [PubMed] [Google Scholar]
- 111.Siepel A., Bejerano G., Pedersen J.S., Hinrichs A.S., Hou M., Rosenbloom K., Clawson H., Spieth J., Hillier L.W., Richards S., et al. Evolutionarily conserved elements in vertebrate, insect, worm, and yeast genomes. Genome Res. 2005;15:1034–1050. doi: 10.1101/gr.3715005. [DOI] [PMC free article] [PubMed] [Google Scholar]
- 112.Tu Q., Cameron R.A., Davidson E.H. Quantitative developmental transcriptomes of the sea urchin Strongylocentrotus purpuratus. Dev. Biol. 2014;385:160–167. doi: 10.1016/j.ydbio.2013.11.019. [DOI] [PMC free article] [PubMed] [Google Scholar]
- 113.Ferguson L., Marlétaz F., Carter J.-M., Taylor W.R., Gibbs M., Breuker C.J., Holland P.W.H. Ancient expansion of the hox cluster in lepidoptera generated four homeobox genes implicated in extra-embryonic tissue formation. PLoS Genet. 2014;10:e1004698. doi: 10.1371/journal.pgen.1004698. [DOI] [PMC free article] [PubMed] [Google Scholar]
- 114.Marçais G., Kingsford C. A fast, lock-free approach for efficient parallel counting of occurrences of k-mers. Bioinformatics. 2011;27:764–770. doi: 10.1093/bioinformatics/btr011. [DOI] [PMC free article] [PubMed] [Google Scholar]
- 115.Chapman J.A., Ho I., Sunkara S., Luo S., Schroth G.P., Rokhsar D.S. Meraculous: de novo genome assembly with short paired-end reads. PLoS One. 2011;6:e23501. doi: 10.1371/journal.pone.0023501. [DOI] [PMC free article] [PubMed] [Google Scholar]
- 116.Huang S., Chen Z., Huang G., Yu T., Yang P., Li J., Fu Y., Yuan S., Chen S., Xu A. HaploMerger: reconstructing allelic relationships for polymorphic diploid genome assemblies. Genome Res. 2012;22:1581–1588. doi: 10.1101/gr.133652.111. [DOI] [PMC free article] [PubMed] [Google Scholar]
- 117.Meyer M., Kircher M. Illumina sequencing library preparation for highly multiplexed target capture and sequencing. Cold Spring Harb. Protoc. 2010;2010 doi: 10.1101/pdb.prot5448. pdb.prot5448. [DOI] [PubMed] [Google Scholar]
- 118.Wu T.D., Reeder J., Lawrence M., Becker G., Brauer M.J. GMAP and GSNAP for genomic sequence alignment: enhancements to speed, accuracy, and functionality. Methods Mol. Biol. 2016;1418:283–334. doi: 10.1007/978-1-4939-3578-9_15. [DOI] [PubMed] [Google Scholar]
- 119.Andrews S. Babraham Institute; 2010. FastQC: A Quality Control Tool for High Throughput Sequence Data. Babraham Bioinformatics. [Google Scholar]
- 120.Bolger A.M., Lohse M., Usadel B. Trimmomatic: a flexible trimmer for Illumina sequence data. Bioinformatics. 2014;30:2114–2120. doi: 10.1093/bioinformatics/btu170. [DOI] [PMC free article] [PubMed] [Google Scholar]
- 121.Kim D., Langmead B., Salzberg S.L. HISAT: a fast spliced aligner with low memory requirements. Nat. Methods. 2015;12:357–360. doi: 10.1038/nmeth.3317. [DOI] [PMC free article] [PubMed] [Google Scholar]
- 122.Kovaka S., Zimin A.V., Pertea G.M., Razaghi R., Salzberg S.L., Pertea M. Transcriptome assembly from long-read RNA-seq alignments with StringTie2. Genome Biol. 2019;20:278. doi: 10.1186/s13059-019-1910-1. [DOI] [PMC free article] [PubMed] [Google Scholar]
- 123.Robinson M.D., McCarthy D.J., Smyth G.K. edgeR: a Bioconductor package for differential expression analysis of digital gene expression data. Bioinformatics. 2010;26:139–140. doi: 10.1093/bioinformatics/btp616. [DOI] [PMC free article] [PubMed] [Google Scholar]
- 124.Steenwyk J.L., Buida T.J., 3rd, Li Y., Shen X.-X., Rokas A. ClipKIT: a multiple sequence alignment trimming software for accurate phylogenomic inference. PLoS Biol. 2020;18:e3001007. doi: 10.1371/journal.pbio.3001007. [DOI] [PMC free article] [PubMed] [Google Scholar]
- 125.Alexa A., Rahnenfuhrer J. 2016. topGO: enrichment analysis for gene ontology. R package. [DOI] [Google Scholar]
- 126.Buenrostro J.D., Giresi P.G., Zaba L.C., Chang H.Y., Greenleaf W.J. Transposition of native chromatin for fast and sensitive epigenomic profiling of open chromatin, DNA-binding proteins and nucleosome position. Nat. Methods. 2013;10:1213–1218. doi: 10.1038/nmeth.2688. [DOI] [PMC free article] [PubMed] [Google Scholar]
- 127.Langmead B., Salzberg S.L. Fast gapped-read alignment with Bowtie 2. Nat. Methods. 2012;9:357–359. doi: 10.1038/nmeth.1923. [DOI] [PMC free article] [PubMed] [Google Scholar]
- 128.Quinlan A.R., Hall I.M. BEDTools: a flexible suite of utilities for comparing genomic features. Bioinformatics. 2010;26:841–842. doi: 10.1093/bioinformatics/btq033. [DOI] [PMC free article] [PubMed] [Google Scholar]
- 129.Pongor L.S., Gross J.M., Vera Alvarez R., Murai J., Jang S.-M., Zhang H., Redon C., Fu H., Huang S.-Y., Thakur B., et al. BAMscale: quantification of next-generation sequencing peaks and generation of scaled coverage tracks. Epigenet. Chromatin. 2020;13:21. doi: 10.1186/s13072-020-00343-x. [DOI] [PMC free article] [PubMed] [Google Scholar]
- 130.Ramírez F., Ryan D.P., Grüning B., Bhardwaj V., Kilpert F., Richter A.S., Heyne S., Dündar F., Manke T. deepTools2: a next generation web server for deep-sequencing data analysis. Nucleic Acids Res. 2016;44:W160–W165. doi: 10.1093/nar/gkw257. [DOI] [PMC free article] [PubMed] [Google Scholar]
Associated Data
This section collects any data citations, data availability statements, or supplementary materials included in this article.
Supplementary Materials
Data Availability Statement
The pop1, pop2 and pop3 transcripts have been deposited to NCBI under the accessions Genbank: ON325581, Genbank: ON325582, Genbank: ON325583.
The genome (Genbank: GCA_940671915.1) and sequencing reads have been deposited to NCBI under the accession PRJEB25800.
The RNA-seq and ATAC-seq have also been deposited to NCBI Gene Expression Omnibus (GEO) under the accession GEO: GSE202034.
Other data files including genome assembly and annotation are available on zenodo (https://doi.org/10.5281/zenodo.7459274).
Code underlying the analyses is available on github: https://github.com/paracentrotus/genome.