

Summary
Although oncogene-induced senescence (OIS) is a potent tumor-suppressor mechanism, recent studies revealed that cells could escape from OIS with features of transformed cells. However, the mechanisms that promote OIS escape remain unclear, and evidence of post-senescent cells in human cancers is missing. Here, we unravel the regulatory mechanisms underlying OIS escape using dynamic multidimensional profiling. We demonstrate a critical role for AP1 and POU2F2 transcription factors in escape from OIS and identify senescence-associated chromatin scars (SACSs) as an epigenetic memory of OIS detectable during colorectal cancer progression. POU2F2 levels are already elevated in precancerous lesions and as cells escape from OIS, and its expression and binding activity to cis-regulatory elements are associated with decreased patient survival. Our results support a model in which POU2F2 exploits a precoded enhancer landscape necessary for senescence escape and reveal POU2F2 and SACS gene signatures as valuable biomarkers with diagnostic and prognostic potential.
Keywords: oncogene-induced senescence, cellular senescence, OIS, OIS escape, POU2F2, Oct-2, AP-1, senescence-associated chromatin scars, SACS, colorectal cancer
Graphical abstract
Highlights
-
•
Oncogene-induced senescence is unstable
-
•
POU2F2 is necessary for escape from oncogene-induced senescence
-
•
Post-senescent cells are marked by senescence-associated chromatin scars (SACSs)
-
•
SACS and POU2F2 gene signatures have diagnostic and prognostic potential in CRC
Increasing evidence suggests that oncogene-induced senescence (OIS) is an unstable barrier to malignant cancer progression. Martínez-Zamudio et al. characterize the transcription factor network that promotes OIS escape and identify an epigenetic memory of OIS in post-senescent cells with diagnostic and prognostic potential.
Introduction
After a period of hyperproliferation, cells that overexpress specific oncogenes, such as constitutively active H-RASG12V, undergo oncogene-induced senescence (OIS),1 a multifaceted cell state that arrests cells at risk for malignant transformation. Cells with features of OIS have been detected in early neoplastic and premalignant lesions in humans, some of which remain inactive for years.2,3 However, a subset of these lesions eventually progresses to more advanced cancer stages, an event associated with the loss of senescence features.3,4,5,6 The evolution of premalignant lesions into more aggressive cancer stages raises the possibility that senescent cells within these lesions develop mechanisms to escape from OIS. Elucidating these mechanisms can open inroads into the early detection of, patient stratification for, and intervention into premalignant lesions that remain susceptible to cancer progression.
Cells in OIS remain arrested due to activation of the p53/p21 and/or p16/retinoblastoma (Rb) tumor-suppressor pathways.7,8,9,10 In addition, these senescent cells secrete a mixture of inflammatory cytokines, proteases, and stemness factors called the senescence-associated secretory phenotype (SASP), which further stabilizes the senescence state in an autocrine manner but also affects neighboring cells in a paracrine manner.11,12 Paradoxically, the paracrine effects of the SASP have been shown to facilitate transdifferentiation,13,14 reprogramming,15 stemness,16, and cancer development,17 demonstrating that senescent cells, through their SASP, can destabilize the identity of cells within their immediate environment. However, whether a perturbed SASP output can also destabilize the proliferative arrest of cells in OIS remains unknown.
The stability of OIS is determined by the oncogene and the cellular context under which the signaling occurs.18,19 Furthermore, due to the dynamic nature of senescence,16,20 cells have been shown to escape from the senescence state through cell-autonomous and non-cell-autonomous mechanisms.21,22,23 Recent studies have demonstrated that cells that remained in the senescent state for prolonged periods can resume proliferation and develop features of cancer cells by mechanisms that involve derepression of the hTERT locus,24 downregulation of histone demethylases,25 reorganization of topologically associated domains (TADs),26 and stemness-associated reprogramming.23 While the molecular and phenotypic characteristics acquired by cells escaping the senescence state recapitulate the evolutionary process driving oncogenic transformation,3 the gene-regulatory mechanisms underlying senescence escape and evidence of this phenomenon in human cancer are still absent.
The epigenetic changes that lead to the activation of the senescence state have only recently been investigated from a dynamic perspective. Several studies have revealed transcription factors (TFs) and enhancers as critical determinants for the timely execution of the senescence program and for priming the senescent epigenome to respond to future incoming stimuli.27,28,29,30 These studies have shifted our view of cellular senescence from a static cell fate to a temporally organized process akin to (epi)genetically programmed differentiation and cellular responses to environmental cues. Under this paradigm, the dynamic remodeling of the epigenome, driven by interactions between TFs and enhancers throughout the different senescence phases, predetermines the potential of senescent cells to promote distinct outcomes (i.e., reprogramming, immune clearance, and transformation). Despite these advances in understanding the temporal evolution of the senescence response, the dynamic interplay between TFs and the enhancer landscape of senescent cells that promotes escape from OIS remains fragmentary. In light of the clinical relevance of the potential instability of OIS during cancer development, a detailed understanding of the gene-regulatory mechanisms underlying this process can reveal opportunities for the modulation of senescent cells in premalignant lesions susceptible to cancer progression.
In this study, we defined previously unknown mechanisms of senescence escape by generating and integrating time-resolved gene expression and epigenomic profiles of cells escaping from oncogenic RAS-induced senescence. This approach identified the TF networks regulating senescence escape, potential targets for novel cancer therapies, and senescence-escape signatures in human colorectal cancer (CRC) with diagnostic and prognostic potential.
Results
Dynamic multiomic profiling to decipher OIS escape
Previous studies demonstrated that OIS is an unstable cell fate from which cells can escape by expressing hTERT or promoting chromosomal inversions.24,26 Due to the dynamic nature of the senescence arrest, we hypothesized that senescence escape might occur through multiple routes. Indeed, human primary fibroblasts (strain GM21) expressing oncogenic H-RASG12V frequently escaped from OIS between days 18 and 25 following transduction of the oncogene. Yet, their escape often appeared independent of telomerase activation, as cells did not always retain high hTERT activity or expression levels (Figures S1A–S1C; Table S1). Despite this, cells that escaped from OIS displayed anchorage-independent growth, a hallmark of oncogenic transformation,31,32 and developed small colonies in soft agar whose size and number increased upon ectopic expression of hTERT (Figures S1D–S1J; Table S1). Consistent with this, our results revealed that H-RASG12V-expressing GM21 fibroblasts that escaped from OIS in the absence of hTERT expression eventually ceased proliferation, with features of telomere dysfunction-induced senescence at around day 80 after H-RASG12V transduction (Figures S1K and S1L; Table S1). Escape from OIS was not due to the clonal expansion of a few cells that had lost expression of the oncogene; instead, it was a consequence of a significant fraction of cells (>10%) that consistently started to proliferate throughout the entire culture at around days 18–25 after oncogene transduction (Figures S1N and S1O). In addition, H-RASG12V expression levels remained elevated during the entire time course, although a moderate decrease in RAS levels was observed as cells escaped from OIS, which is consistent with previous observations24 (Figures S1C and S1M). Yet, escape from OIS was independent of H-RASG12V expression levels and human fibroblast strains used (Figures S1P–S1S; Table S1).
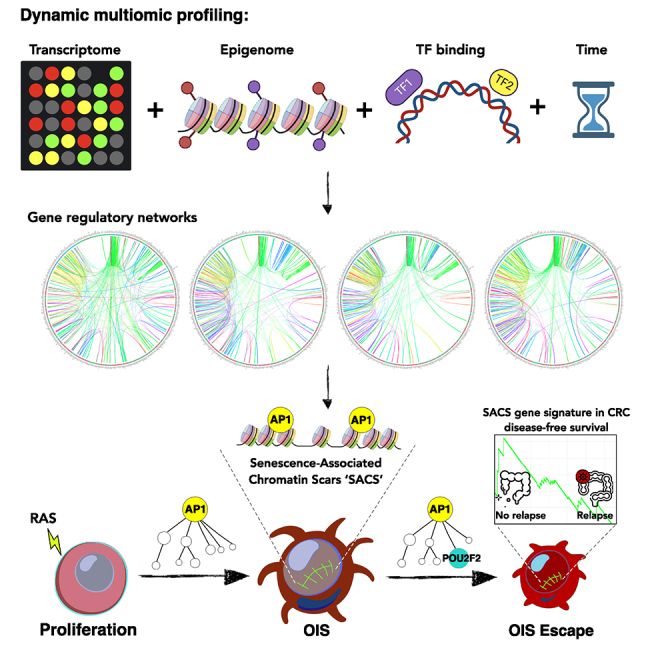
To identify the underlying mechanism for OIS escape, we applied a time-resolved profiling approach previously described by us.24,30 We generated and integrated time-resolved bulk profiles of gene expression using microarrays, gene-regulatory elements (promoters and enhancers) using chromatin immunoprecipitation sequencing (ChIP-seq) of histone modifications H3K27ac and H3K4me1, and TF binding dynamics using assay for transposase-accessible chromatin with sequencing (ATAC-seq) across four stages: proliferation (P; empty vector controls), senescence (S; days 8–17), transition (T; days 18–25), and escape (E; day 26+) (Figure 1A). We tracked senescence by measuring classical senescence biomarkers and features, detecting these only in the senescence and transition stages. Notably, SASP factors IL-1β and IL-8 remained upregulated in post-senescent cells, although at significantly lower expression levels compared with senescent cells (Figure S1C; Table S1).
Figure 1.

Transcriptional landscape of OIS escape
(A) Diagram describing the time-resolved multiomic profiling approach used to define the gene-regulatory mechanisms of escape from OIS.
(B) Averaged self-organizing maps (SOMs) of transcriptomes of three independent experiments of GM21 fibroblasts undergoing escape from OIS (horizontal) and time-matched empty vector control (EV) (vertical) expressed as logarithmic fold change. The transcriptional landscape of each stage of the OIS escape process is highlighted. P, proliferation; S, senescence; T, transition; E, escape.
(C and D) PCA projection plots showing individual (C) and averaged (D) transcriptional trajectories of DEGs of three biologically independent OIS escape time-series experiments.
(E) Heatmap showing the color-coded modules (n ≥ 300 genes per module) of DEGs of GM21 fibroblasts in P, S, T, and E. Average of three biologically independent experiments is shown.
(F) Functional overrepresentation analysis map showing significant associations of the MSigDB hallmark gene sets for each module described in (E). Circle fill is color coded according to the false discovery rate (FDR)-corrected p value from a hypergeometric distribution test. Circle size is proportional to the percentage of genes in each MSigDB gene set.
(G) Volcano plot showing DEGs in cells after OIS escape, relative to EV proliferating cells.
(H) Functional overrepresentation analysis map showing significant associations of the MSigDB hallmark gene sets with genes up and down in post-senescent cells relative to proliferating control cells. Up, 118 genes; down, 150 genes.
(I) Heatmap showing the expression levels of SASP genes from the OIS-specific turquoise module (118 genes predicted to be secreted) of cells in P, S, T, and E. Examples are shown in the insets. Data are averaged from three independent experiments.
Mapping the transcriptional landscape of OIS escape
To visualize transcriptional dynamics of OIS escape, we utilized a self-organizing map (SOM) machine-learning algorithm33 and principal component analysis (PCA). Significantly, while the transcriptional landscape of control cells remained identical until the experiments ended on day 56, the transcriptome of cells expressing H-RasG12V evolved substantially through the senescence, transition, and escape stages (Figures 1B and S2A). Transcriptional trajectories of differentially expressed genes (DEGs) and global transcriptomes confirmed these results (Figures 1C, 1D, and S2B; Table S2). Furthermore, the transcriptional landscape of cells that entered and escaped from OIS was distinct from that of time-matched controls (Figures S2C and S2D; see the behavior of clusters A, F, and K as examples).
We identified 2,118 DEGs (950 up; 1,168 down), which partitioned into four distinct modules (blue, brown, turquoise, and yellow), thereby revealing state-specific transcription patterns (Figures 1E and S2E; Table S2). Pathway analysis34 revealed that OIS was characterized by the upregulation of genes related to the SASP, RAS, and P53 pathways in the turquoise module. In contrast, downregulated genes, represented by the blue, brown, and yellow modules, were enriched for cell cycle, DNA repair, and epithelial-mesenchymal transition (EMT) pathways (Figure 1F). The OIS transition state was defined by the gradual downregulation of SASP genes and upregulation of cell-cycle genes, leading up to OIS escape. At that point, cells resumed proliferation and featured a transcriptional profile markedly distinct from that of normal proliferating fibroblasts (Figures 1E and 1F). Significantly, cells that escaped from OIS retained higher expression levels of a subset of senescence-associated genes involved in inflammatory signaling and cell plasticity (Figures 1G and 1H). In addition, a subset of genes encoding SASP factors, which were highly expressed during the OIS state, remained upregulated in cells that escaped OIS, hinting at the carryover of a senescence signature in cells that escaped from OIS (Figure 1I, top insets). We also found a subset of predicted SASP genes that were maximally expressed in OIS but returned to levels below reference after cells escaped from OIS (Figure 1I, bottom inset). The transcriptional dynamics were faithfully reproduced in three biological replicates, suggesting that cell state succession for OIS escape is precoded (Figure S2F). Overall, these results highlight the dynamic and highly organized nature of the cells’ transcriptional transitions as they enter and escape from OIS.
Senescence enhancer remodeling dictates transcriptional transitions and OIS escape
Growth past senescence barriers may be a pivotal event in the earliest steps of carcinogenesis. How the epigenetic landscape dictates transcriptional transitions and creates windows of opportunity for OIS escape is an open question with important clinical implications. To address this question, we characterized genomic regulatory element (in)activation (promoters and enhancers; Figure 2A). We interrogated TF binding dynamics using ChIP-seq profiling of histone modifications (i.e., H3K4me1 and H3K27ac) and conducted transposon-accessible chromatin profiling using ATAC-seq35 on control cells at day 0 (P) and on H-RASG12V-expressing cells isolated on days 10 (S), 18 and 22 (T), and 32 (E), which identified eight chromatin states (Figure S3A; Table S3). While around 82% of the genome lacked enhancer-associated histone modifications and accessible chromatin, approximately 8% of chromatin was associated with active histone marks H3K4me1 and H3K27ac, as well as with accessible chromatin regions (Figure S3B). We quantified transitions involving activation and inactivation of enhancers and promoters and identified prominent enhancer activation from the unmarked and poised states as cells entered OIS (day 10), followed by dynamic enhancer remodeling during the transition stage (days 18 and 22; Figures 2A and 2B).
Figure 2.

Enhancer remodeling dictates transcriptional transitions and OIS escape
(A) Arc-plot visualization of the chromatin state transitions at indicated stages as cells enter and escape from OIS. The width of the edge is proportional to the number of 200 bp bins undergoing a given chromatin transition.
(B) Histogram visualization of 200 bp bins undergoing the top 20 most frequent chromatin state transitions during the escape from OIS.
(C) Asymmetric biplot of the correspondence analysis (CA) between representative chromatin state transitions and gene expression modules. Nine representative and best-projected (squared cosine > 0.5) chromatin state transitions are shown. Red lines arising from the origin indicate the projections of gene expression modules (from Figure 1E). Statistical significance was calculated using a chi-squared test.
(D) Distance distribution of each peak undergoing chromatin state transitions to the TSS of DEGs in modules described in Figure 1E. Bin size, 20 kb.
(E) Integration of eight select chromatin state transitions (top pictograms, days after H-RASG12V expression) with nearby gene expression output (row Z score boxplots). Centerline of boxplots indicates the median. Edges correspond to the first and third quartiles. Whiskers extend from the edges to 1.5× the interquartile range to the highest and lowest values. Chromatin state transition data (A–D) was computed from two independent immunoprecipitations per time point per histone modification from pooled chromatin from 10 biologically independent experiments. Gene expression data (D) are the average of three biologically independent time series.
In contrast, promoters were only modestly remodeled (Figures 2A and 2B). Visualization of the signal distribution that originated from the unmarked state at day 0 revealed gradual gains of TF binding and enhancer activation as cells entered OIS, peaking at days 14–18 as the cells approached the transition stage, after which enhancers were gradually inactivated and reverted to a poised state (Figure S3C). Similar kinetics of enhancer activation was observed at poised enhancers (defined at day 0; Figure S3D). In contrast, active enhancers underwent cycles of activation and inactivation, returning to levels comparable to those of control cells after cells escaped from OIS (Figure S3E). Consistent with our published results,30 footprinting analysis36 identified the AP1 TF superfamily as the key bookmarking agent of prospective senescence enhancers, defining senescence-associated transcriptional transitions (Figures S3F and S3G). In addition, TFs, including IRF1, MZF1, and FOXC2, were enriched at active enhancers, suggesting a role for these TFs in cell proliferation (Figure S3H). Integrating chromatin state transitions to transcriptional output revealed a robust correlation between the chronology of chromatin state transitions and individual gene modules (Figure 2C). Most of these transitions occurred proximal to the transcription start site (TSS; i.e., within the −20 to 40 kb region; Figure 2D), indicating that local enhancer dynamics underlie the observed gene expression dynamics, consistent with published data.37 Upon examining the expression of genes proximal to the eight most frequent chromatin state transitions, we observed the highest transcriptional variability during OIS (days 8 and 14; Figure 2E), after which the gene expression output stabilized to levels that were distinct from those of control cells. In contrast, the chromatin states acquired during the senescence phase were generally preserved in post-senescent cells (Figure 2E, top of plots). Collectively, our data suggest that dynamic enhancer remodeling dictates OIS transcriptional transitions, creates a window of opportunity for OIS escape, and imprints an epigenetic memory of senescence in post-senescent cells.
Organized waves of transcription factor activity define escape from OIS
TFs form dynamic hierarchical networks that finely control the duration and output of gene expression during cell fate transitions.38,39,40,41 This property of TF networks offers opportunities to manipulate these transitions.42,43,44,45,46 We identified 128 differentially expressed TFs, 45 of which were upregulated, while 83 were downregulated during OIS. Expression of these TFs in cells that escaped from OIS stabilized to levels distinct from control cells, revealing that escape from OIS generates a transcriptome that allows somatic cells to proliferate, despite expression of H-RASG12V (Figure S4A). We detected 339 TFs with differential binding activity at enhancers throughout the OIS escape time series. While most of the binding dynamics were due to constitutively expressed TFs (289), only 50 differentially expressed TFs significantly contributed to this binding activity, suggesting that cells leverage their existing TF networks to orchestrate the OIS response (Figures 3A and S4A; Table S4). In line with this interpretation, we observed organized waves of TF activity that defined each stage of OIS escape. AP1 TFs, the OIS master regulators,30 occupied most enhancers and exhibited maximal binding activity during the S and T stages, returning to near basal levels after OIS escape (Figure 3A). The E2F family of TFs exhibited a reciprocal behavior, being active only in proliferating control cells and after cells escaped from OIS, consistent with their role in promoting cell proliferation (Figure 3A). In contrast, POU and FOX family TFs exhibited peak activity shortly before cells escaped from OIS, indicating a potential role of these TFs in senescence escape (Figure 3A).
Figure 3.

Organized waves of TF activity define OIS escape
(A) Heatmap showing differential TF chromatin binding activity (row Z score) at enhancers at each stage of OIS escape. Only expressed TFs were considered in the analysis. Annotations on left show the number of bound instances per TF and their gene expression (TXN) category (i.e., constitutively expressed [black] or differentially regulated according to the module color code shown in Figure 1E). Insets: chromatin binding activity of representative TF families.
(B and C) TF co-binding matrices at open (B) and closed (C) enhancers in cells entering and escaping from OIS. All binding instances across time points were collapsed onto the matrix and clustered using Ward’s aggregation criterion. Corresponding q values were projected onto the clustering and are color coded based on significance calculated using a hypergeometric distribution test. TF footprinting (A–C) and differential chromatin binding activity (A) were performed on pooled ATAC-seq datasets from two biologically independent time-series experiments.
To gain insights into the TF network hierarchy, we summed all TF binding instances across time points and computed TF co-binding interactions in open and closed enhancers. Consistent with our previous findings,30 AP1 TFs mediated interactions with most other TFs in open and closed enhancers (Figures 3B, 3C, S4B, and S4C). In addition, we identified a distinct cluster involving AP1, POU, and other homeobox-containing TFs in open and closed enhancers, suggesting that these TFs regulate enhancer dynamics. Interestingly, a cluster involving E2F, KLF, SP, TFAP, NFY, and CTCF TFs was apparent only in closed enhancers, indicating that they play a role in regulating cell-cycle-associated genes independent of AP1 (Figures 3C and S4C). The abundance of mRNA, chromatin-bound protein, and TF binding activity revealed good concordance across these three variables, as shown for a subset of TFs (Figures S4D–S4F), confirming the validity of our TF network predictions.
To visualize the hierarchical structure of the TF network during OIS escape, we constructed effector TF networks by focusing on co-binding interactions involving TFs from the OIS-specific gene module (Figure S4A, turquoise module), reasoning that some of these TFs likely play a role in escape from OIS. To this end, we used two different approaches: (1) dynamically regulated enhancers of genes found in the transcriptional modules identified in Figures 1E and (2) opening/closing enhancers at OIS irrespective of their relationship to the gene modules. Regardless of the approach, the structure of the TF networks was remarkably conserved, with AP1 TFs exclusively occupying the top layer and variable compositions of the core and bottom layers (Figures 4A–4D, 5A, and 5B; Table S5. TF networks at transcription modules, Table S6. TF networks at enhancers, EV day 0, Table S7. TF networks at enhancers, day 8, Table S8. TF networks at enhancers, day 14, Table S9. TF networks at enhancers, day 23, Table S10. TF networks at enhancers, day 32). However, the organization and complexity of the networks differed between transcriptional module- and enhancer-linked TF networks. Enhancer-linked TF networks occupied substantially more regions than their transcriptional module-coupled counterparts. Yet, they were simpler in their composition, as AP1 interacted directly with TFs in the bottom layer or through two intermediary nodes in the core layer (Figures S5A and S5B). In line with our TF co-binding analysis, we confirmed the presence of a KLF/SP/CTCF/E2F subnetwork on closed enhancers that operated independent of AP1 (Figure S5B). TF regulation at enhancers of gene modules was more complex, with gene-module-specific TF composition of the core layer (Figures 4A–4D). Counterintuitively, we observed an inverse correlation between TF network complexity and gene module size. TF networks controlling the expression of the blue and turquoise modules (Figures 4A and 4C, 604 and 953 genes) had a simple architecture, with single-level core layers directly linking to the bottom-layer TFs. In contrast, brown and yellow modules (Figures 4B and 4D, 310 and 247 genes) featured highly interconnected multilevel core layers interacting with the bottom-layer TFs. In addition, a common feature of all networks was an overrepresentation of a subset of TFs (POU2F2, ZNF143, PRDM1, RBPJ, MTF1) in the core and bottom layers, suggesting a critical role for these TFs in mediating the escape from OIS.
Figure 4.

Hierarchical TF networks define transcriptional dynamics of OIS escape
(A–D) Effector TF networks for each gene expression module (Figure 1E). TFs (nodes) are represented as circles. Oriented edges (arrows) connecting nodes indicate that at least 15% of the regions bound by a given TF in the bottom and core layers were bound by the interacting TF in the core and top layers, respectively, at the same or previous time points. Strongly connected components (SCCs) are represented as a single node to facilitate visualization. The fill color of the node’s inner circle is based on the normalized dynamicity of TFs. The fill color of the outer ring indicates whether the TF is constitutively expressed (black) or belongs to a transcriptomic module (Figure 1E). The node’s size is proportional to the bound regions by a given TF. Each network has three layers: (1) the top layer with no incoming edges, (2) the core layer with incoming and outgoing edges, and (3) the bottom layer with no outgoing edges. Networks were generated from pooled ATAC-seq datasets from two biologically independent time series.
Figure 5.

POU2F2 is necessary for OIS escape
(A) Immunoblot analysis of indicated proteins in GM21 fibroblasts undergoing OIS escape. γ-tubulin and Ponceau are loading controls. One representative blot of three biologically independent experiments is shown.
(B) Genome-wide POU2F2 enhancer-binding during OIS escape and time-matched controls. Footprinting was performed on pooled ATAC-seq datasets from two biologically independent experiments.
(C) Expression heatmap of POU2F2 gene targets within gene expression modules identified in Figure 1E.
(D) Functional overrepresentation analysis map showing significant associations of the MSigDB hallmark gene sets with each POU2F2 gene target in the indicated modules.
(E) Western blot analysis of POU2F2 expression in RAS-expressing GM21 fibroblasts expressing non-targeting and POU2F2-targeting shRNAs. γ-tubulin and Ponceau are loading controls. One representative blot of four biologically independent experiments is shown.
(F) Cumulative population doubling plot at the OIS (S, days 8–16), transition (T, days 18–25), and escape (E, days 26–35) phases of GM21 fibroblasts expressing non-targeting and POU2F2-targeting shRNAs. Population doublings within each time interval per stage of four biologically independent experiments were included in the analysis. ∗p = 0.0412 using a two-tailed unpaired Student’s t test.
(G) Quantitation of 5-Ethynyl-2′-deoxyuridine (EdU)-positive GM21 fibroblasts expressing non-targeting and POU2F2-targeting shRNAs at senescence (S) and OIS escape (E) stages. Data are from three biologically independent experiments. ∗∗p = 0.0088, ∗p = 0.0173, using a two-tailed unpaired Student’s t test.
(H) Representative immunofluorescence micrographs of EdU incorporation at the OIS and escape phases in GM21 fibroblasts expressing non-targeting and POU2F2-targeting shRNAs.
(I) GSEA showing normalized enrichment score (NES) plots and FDR values for POU2F2 predicted target genes (from C) in transcriptomes of pLKO- and shPOU2F2-expressing cells at day 14 after H-RASG12V expression. Statistical evaluation of GSEA results was based on a non-parametric Kolmogorov-Smirnov test.
(J) Intersections of positively and negatively regulated POU2F2 target genes within the predicted gene set defined in (C).
(K and L) Expression heatmaps of positively and negatively POU2F2-regulated genes.
(M) Functional overrepresentation analysis map showing significant associations of the MSigDB hallmark gene sets with positively (+ve) and negatively (−ve) regulated POU2F2 target genes. Only genes concordantly modulated by both POU2F2-specific shRNAs were considered in the analyses (I–M).
(N) Histogram plot showing the normalized CDKN2A reads in cells as described in (I). ∗Adjusted p = 3.05 × 10⁻⁵, Wald test, relative to empty-vector cells in the E phase. The average of two biologically independent experiments is shown.
(O) Immunoblot analysis of indicated proteins in H-RASG12V-expressing GM21 fibroblasts expressing non-targeting and POU2F2-targeting shRNAs. γ-tubulin and Ponceau were used as loading controls. Numbers on top of the CDKN2A/p16INK4a blot show a densitometric fold increase relative to pLKO at each time point. One representative blot of three biologically independent experiments is shown.
In summary, our TF network analysis provides an information-rich yet simple representation of the complex relationships between TF binding dynamics and gene expression output as cells enter and escape from OIS, thereby exposing TFs that may be decisive for OIS escape.
POU2F2 expression is necessary for OIS escape
POU2F2, a member of the POU family of TFs,47,48,49 emerged as a candidate that potentially promotes OIS escape, not only because it was upregulated transcriptionally shortly before cells escaped from OIS, but also because it was among the TFs with the highest differential binding activity at enhancers as cells escaped from OIS and its direct connection to AP1 in the TF networks (Figures S4A, 3A, 4, and S5). To corroborate the potential role of POU2F2 in OIS escape, we analyzed our time-series gene expression data to identify transcriptional regulators.50,51 These analyses identified POU2F2 as a transcriptionally induced TF that regulates cell-cycle and cytoskeleton genes at the transition stage (days 23–32; Figures S6A and S6B) and predicted peak POU2F2 activity between days 23 (transition) and 32 (escape) of the time series (Figure S6C). At the protein level, the expression of POU2F2 was barely detectable in control cells. However, its expression levels increased dramatically in oncogene-expressing cells as they entered, remained in, and escaped from OIS (Figure 5A). Protein levels of CDKN2A (alias p16INK4a), a potent inducer of cellular senescence, were upregulated only in the senescence stage, declining back to reference levels as cells escaped from OIS, consistent with the CDKN2A mRNA expression pattern (Figures 5A and S1J; Table S11). Protein levels of POU2F2, RAS, and CDKN2A followed a pattern similar to that observed in GM21 cells in WI38 and LF1 fibroblasts undergoing OIS escape, as well as across various 4-OHT concentrations in OIS-inducible GM21-ER:RAS cells (Figures S6D–S6G). WI38 and LF1 lung fibroblasts displayed reduced but detectable CDKN2A protein levels after they escaped from OIS, likely due to their tolerance to low CDKN2A expression under normal proliferative conditions.31,52,53,54 Digital TF-footprinting of ATAC-seq datasets, an approach that faithfully recapitulates ChIP-seq-based TF-binding profiles as demonstrated by us previously,30 revealed a time-dependent increase in the chromatin binding activity of POU2F2 in oncogenic RAS-expressing cells, peaking at day 23 (Figure 5B). POU2F2 binding was dynamic, associating with different regions and genes, including CDKN2A, throughout the various stages as cells entered and escaped from OIS (total of 446 genes; Figures S6H and S6I; Table S11). Annotation of POU2F2 footprints identified 168, 182, and 32 target genes in the blue, turquoise, and yellow modules, enriching pathways relevant to OIS escape, including “EMT,” “inflammatory signaling,” and “E2F targets” (Figures 5C and 5D; Table S11).
To directly test whether suppression of POU2F2 hinders OIS escape, we silenced its expression before induction of OIS using two independent shRNAs. While expression of POU2F2-targeting shRNAs did not affect the proliferation rate of control cells (Figures S6J and S6K; Table S11), depletion of POU2F2 in H-RasG12V-expressing cells stabilized OIS as early as the transition stage by delaying or completely blocking these cells from escaping OIS in a manner that was dependent on silencing efficiency (Figures 5E–5H and S6L). To understand the mechanism by which POU2F2 promotes escape from OIS in greater detail, we performed RNA sequencing on control and shPOU2F2-expressing cells at days 14 (S) and 27 (E) after RAS induction. Gene set enrichment analysis (GSEA) demonstrated that POU2F2 regulated a subset of its predicted targets (163/446 [36.5%] at day 14; 198/446 [44.3%] at day 27), in line with differential regulation of target genes by TFs55 (Figures 5I, 5J, S6M, and S6N). POU2F2 acted primarily as a transcriptional activator but also negatively regulated the expression of a smaller subset of genes at both time points (Figures 5K, 5L, S6O, and S6P). Functional overrepresentation analysis of the validated POU2F2 gene targets confirmed its role in mediating escape from OIS, as it promoted the expression of genes involved in EMT and cell proliferation and suppressed genes involved in inflammatory signaling and the P53 pathway (Figure 5M). Within this last class, we identified CDKN2A/p16INK4a as a critical POU2F2 target gene whose mRNA and protein levels increased upon POU2F2 downregulation (Figures 5N, 5O, and S6Q). Interestingly, we observed deacetylation at two AP1-marked enhancers in the vicinity of the CDKN2A locus upon POU2F2 binding during the senescence phase, suggesting that POU2F2 may recruit silencing complexes to chromatin (unpublished data). Overall, our results reveal that POU2F2 plays a central role in facilitating escape from OIS by regulating cell identity and SASP and cell-cycle genes.
POU2F2 promotes an inflammatory gene expression program in colorectal cancer
To gain insights into the role of POU2F2 during oncogenic RAS-driven carcinogenesis, we analyzed clinical, transcriptional, and chromatin accessibility data of human CRCs from The Cancer Genome Atlas (TCGA). We focused on CRC because RAS gene mutations are present in a subset of aggressive cancers56,57,58 and animal models of KRAS-driven CRC develop neoplastic lesions comprising senescent cells,59 therefore modeling a scenario during which senescent cells may escape from OIS in vivo. Consistent with recent evidence implicating POU2F2 in facilitating cancer progression in various tissues,60,61,62 increased POU2F2 mRNA expression in primary CRCs was associated with decreased overall survival (Figures 6A and 6B). Footprinting analysis on chromatin accessibility datasets of 12 normal human colon tissues (from five donors) and 38 human CRCs revealed significantly upregulated POU2F2 chromatin binding activity in CRCs relative to normal tissue (Figure 6C). Annotation of POU2F2 footprints and integration with transcriptional data from primary CRC tumors identified a proliferative and inflammatory expression program composed of 1,686 DEGs (Figure S7A; Table S12). We identified a POU2F2 signature comprising 110 genes that overlapped with the POU2F2 targets of our in vitro OIS escape model. This gene signature was characterized by overexpression of inflammatory and EMT-associated genes (Figures S7B and S7C; Table S12), which are known to promote CRC progression.63,64,65,66 GSEA using this gene signature revealed activation of IL-17 and WNT signaling pathways, also known drivers of CRC development67,68,69,70 (Figure 6D).
Figure 6.

POU2F2 drives an inflammatory gene expression program in colorectal cancer
(A) Kaplan-Meier plot showing overall survival comparing colorectal cancer (CRC) patients with low (blue) and high (red) normalized POU2F2 mRNA expression in primary tumors from the TCGA-COADREAD dataset as defined in (B). Statistical significance was conducted using a log-rank test. The p value and n for each POU2F2 expression group are indicated. Vertical red and blue lines show each group’s 50% survival probability.
(B) Normalized POU2F2 expression in the TCGA-COADREAD tumor samples. Red hashed line indicates expression cutoff used for survival analysis (0.72 Fragments Per Kilobase of transcript per Million mapped reads upper quartile (FKPM-UQ).
(C) Genome-wide meta profiles of POU2F2 binding at accessible chromatin in normal colon tissue (NC) and CRC. Footprinting was performed on 12 NC (five donors) and 38 tumor DNase-seq and ATAC-seq datasets.
(D) GSEA map showing significant associations of KEGG gene sets with a POU2F2 escape gene signature in CRC samples. Circle fill is color coded according to the adjusted p value based on a non-parametric Kolmogorov-Smirnov test. Circle size is proportional to the number of POU2F2 target genes within each KEGG gene set (rows). POU2F2 CRC gene targets were identified using gene expression data from 101 NC and 631 primary tumors deposited in the TCGA using the Xena Differential Gene Expression Analysis Pipeline. POU2F2 targets in CRC were then overlapped with POU2F2 targets in GM21 fibroblasts that escaped from OIS, and the union of these two sets was analyzed.
(E and F) Representative micrographs at 10× (top; scale bar, 50 μm) and 40× (bottom; scale bar, 10 μm) original magnifications of hematoxylin and immunohistochemical analysis of POU2F2 expression in adjacent non-tumor biopsy and adenocarcinoma.
(G) GSEA showing normalized enrichment score (NES) plots and FDR values for the POU2F2 escape gene signature in a comprehensive analysis of CRC transcriptomes (GEO: GSE14333, GSE33113, GSE37892, GSE39852) profiled after surgery and classified into relapse (n = 262) and no-relapse (n = 720) groups. Statistical evaluation of GSEA results was based on a non-parametric Kolmogorov-Smirnov test.
To validate these findings, we analyzed POU2F2 levels by immunohistochemistry (IHC) in normal colon tissue, dysplastic polyps, high-grade colonic dysplasias, and colon adenocarcinoma from four different patients. We observed moderate cytoplasmic/membranous POU2F2 staining in enterocytes and endocrine cells of glands of the colonic mucosa, as well as moderate nuclear staining in sporadic mucosal lymphoid cells in non-tumor tissue (Figures 6E, 6F, and S7D–S7H), consistent with published data.71,72 In contrast, the increasingly widespread, strong nuclear expression of POU2F2 was evident in dysplastic colonic tissue, particularly in colon (adeno)carcinoma (Figures 6E, 6F, and S7D–S7H). To evaluate a possible role of POU2F2 in CRC progression, we determined the prognostic potential of the POU2F2 OIS escape gene signature consisting of 36 POU2F2 target genes overexpressed in CRC relative to normal colon tissue in four publicly accessible, clinically annotated transcriptome datasets of CRC tumors across various stages of disease.73,74,75,76 Combining all transcriptomes into a master dataset, followed by differential expression analysis of information-rich genes (relative to normal colonic mucosa; log2 fold change ≥2) generated eight gene modules (I–VIII) (Figure S8A). Significant overlaps between the POU2F2 OIS escape gene signature and the DEGs detected in modules III and VII were involved in inflammatory signaling and cell cycle, respectively (Figures S8B–S8D), consistent with results obtained from TCGA data. Importantly, we found that the POU2F2-driven OIS escape gene signature faithfully identified tumors that relapsed after surgery (Figure 6G, FDR = 0.012; Table S14). Furthermore, the POU2F2-driven gene signature had the potential as a prognostic marker of disease progression in an independent dataset of normal colon, adenoma, and adenocarcinoma transcriptomes77 (see below). In summary, integrative analysis of epigenomic and transcriptomic datasets from human CRCs and OIS escape highlights POU2F2 activation and its associated OIS-escape gene signature as prognostic biomarkers and potential parameters for human CRC progression.
An epigenetic memory defines post-senescent cells and is detectable in colorectal cancer
Although escape from OIS may be a path to carcinogenesis,3,19 direct evidence of senescence escape as a potential cause of cancer progression in humans remains elusive. The reproducibility of the gene expression trajectories and the persistence of enhancer states after OIS escape prompted us to evaluate whether an epigenetic memory of this event could be identified in post-senescent cells. To this end, we interrogated our chromatin accessibility datasets, focusing on enhancers. The differential analysis identified two modules comprising 27,117 enhancers whose accessibility changed during OIS (Figure 7A; Table S13). Visualization of differentially accessible chromatin trajectories by PCA revealed transitions virtually identical to those identified in gene expression datasets of cells that entered and escaped OIS. In contrast, time-matched control cells remained stable (Figure S9A).
Figure 7.

SACSs define post-senescent cells and are present in colorectal cancer
(A) Heatmap showing the chromatin accessibility modules at enhancers per time point as cells enter and escape from OIS. The analysis identified 27,117 differentially accessible regions. Biologically independent replicates are numbered.
(B) Chow-Ruskey diagram showing intersections and disjunctive unions of differentially accessible chromatin regions at each time point measured as cells enter and escape from OIS relative to the empty-vector control (day 0). The black center circle depicts 1,926 senescence scars.
(C) True/false emission heatmap visualization of differentially accessible genomic regions at each chromatin accessibility module at enhancers for each time-point pairwise comparison, as indicated at the bottom of the heatmap. SACSs span horizontally for all time-point comparisons relative to day 0 (five leftmost lanes of the heatmap).
(D) Histogram visualization of 200 bp windows within senescence scars undergoing the top 10 most frequent chromatin state transitions.
(E and F) Functional overrepresentation analysis maps showing significant associations of the MSigDB hallmark (E) and KEGG (F) gene sets with genes associated with SACSs in each chromatin accessibility module. Circle fill is color-coded according to the FDR-corrected p value from a hypergeometric distribution test. Circle size is proportional to the ratio of genes in the database set (MSigDB or KEGG) found within the genes associated with SACSs in each chromatin accessibility module. The numbers of biologically independent experiments per time point are indicated in (A).
(G–I) Rank plots showing the summed binding instances of TFs in accessible chromatin, SACSs in CRC, and SACSs in post-senescent cells.
(J) Normalized meta profiles of SACSs in individual normal colon and CRC samples.
(K) Heatmap showing the modules (a–i) of differentially expressed genes in normal colon (n = 24), adenomas (n = 44), and adenocarcinomas (n = 34) from GEO: GSE20916.
(L) Functional overrepresentation analysis map showing significant associations of POU2F2 and SACS gene signatures in the modules described in (K).
(M) GSEA showing NES plots and FDR values for SACS gene signature in a comprehensive analysis of transcriptomes of samples of patients with CRC (GEO: GSE14333, GSE33113, GSE37892, GSE39852) profiled after surgery and classified into relapse (n = 262) and no-relapse (n = 720) groups. SACS-associated genes in CRC were identified using gene expression data from 101 normal colon and 631 primary tumors deposited in TCGA using the Xena Differential Gene Expression Analysis Pipeline.
Interestingly, integrating chromatin accessibility dynamics with transcriptional modules revealed contributions of both opening and closing enhancers to the gene expression output, confirming the role of local chromatin state dynamics in determining gene expression levels78 (Figure S8B). We next performed time-point pairwise differential analysis to identify enhancer regions that permanently change accessibility as cells enter and escape from OIS. This analysis identified 1,926 differentially accessible regions in OIS that were also preserved in post-senescent cells, which we termed senescence-associated chromatin scars (SACSs) (Figures 7B, 7C, and S8C–S8F; Table S13). Most of these SACSs localized to genomic regions poised to become active enhancers (Figure 7D) and enriched for senescence- and cancer-associated pathways in functional enrichment analyses using two independent databases (Figures 7E and 7F). Representative genome browser snapshots of opening and closing SACSs are shown (Figures S8G and S8H). These results demonstrate that post-senescent cells store an “epigenetic memory” of OIS.
To test whether SACS are detectable in cancer, we performed differential chromatin accessibility analysis in normal colon and in CRC, which identified two distinct modules (Figure S8I; Table S13). Comparing genomic coordinates of SACSs with accessible chromatin modules from CRCs revealed an overlap of 119 SACSs in CRC-accessible chromatin modules (Figure S8J). Importantly, relative to the overall TF binding distribution across the CRC-accessible chromatin landscape, AP1 TFs were preferentially bound to SACSs in CRC, consistent with their binding profile to SACSs identified in vitro (Figures 7G–7I). Furthermore, the SACS signal distribution revealed increased CRC intensity across all cancer stages relative to normal colon (Figures 7J, S9K, and S9L; Table S13), indicating that SACSs may originate in premalignant lesions. However, individual differences in the genomic region and tissue/tumor sample could be observed (Figure S9K). This heterogeneity is likely due to the cellular diversity of colonic tissue, immune infiltration, and disease stage.37,79 To provide additional evidence that SACSs originate in premalignant lesions, we integrated CRC SACSs with transcriptomic data from primary CRCs and identified a signature of 47 differentially regulated genes (Table S13). We tested the biomarker potential of our SACS gene signature in a dataset of normal colon, adenoma, and adenocarcinoma transcriptomes77 and found significant enrichment of this signature in adenoma- and adenocarcinoma-specific gene modules, similar to the POU2F2-driven gene signature described above (Figures 7K and 7L, modules a, g, and i for SACS and modules a and f for the POU2F2-driven signature; Table S15). Furthermore, our SACS gene signature readily identified tumors that did not relapse after surgery in an analysis of 982 CRC transcriptomes annotated with disease-free survival information (Figures S8 and 7M; Table S14). Our integrative analysis, therefore, provides strong evidence for epigenomic features of senescence escape within the CRC epigenome with diagnostic and prognostic value.
Discussion
Recent studies revealed that cellular senescence is not a stable barrier to cancer progression.23,24,25,80,81,82 However, the gene-regulatory mechanisms that control TF networks and promote escape from cellular senescence and whether post-senescent cells are present in human cancers are largely unknown. This knowledge would prove highly useful not only for diagnostic and prognostic purposes in a variety of cancers that have been shown to develop features of OIS, but also for the development of therapies to modulate senescence-associated cell-fate transitions during early cancer development and to target post-senescent cells at later cancer stages. Our study reveals AP1 and POU2F2 as critical regulators of the transcriptional program that allows cells to escape from OIS and thus provides the foundation for understanding the processes that enable oncogene-expressing cells to escape the barriers that constrain their continued proliferation.
A major finding of our study is that entry into and exit from OIS is precoded and mediated at the epigenetic level by AP1 pioneer TFs.30 This extends the role of AP1 TFs as master regulators of the senescence program to critical mediators of senescence-associated cell-fate transitions. We confirm that AP1 bookmarks prospective senescence enhancers, suggesting that it not only orchestrates entry into senescence but also promotes OIS escape by facilitating interactions of senescence-induced TFs with enhancer chromatin. These interactions, newly established during the senescence stage, likely execute the transcriptional programs required for senescence escape. This highly complex and orchestrated process occurs at enhancers proximal to gene promoters and follows reproducible transcriptional and epigenome trajectories, indicating that the capacity of cells to engage and disengage the senescent state is predetermined by locally established TF-enhancer interactions throughout the epigenome. Thus, OIS and its associated cell-fate transitions are not simply stress responses but are essentially indistinguishable from other epigenetically precoded processes, such as cell differentiation programs.38
Our data also reveal that escape from OIS is accompanied by a gradual downregulation of SASP-associated genes and reexpression of genes that promote cell-cycle progression. SASP gene expression never returned to basal levels in cells escaping from OIS but remained elevated at significantly higher levels than in normal cells. Therefore, cells that had escaped from OIS retained a secretory phenotype known to drive cancer initiation, proliferation, progression, metastasis, and resistance to therapy.21,83 As SASP factors have also been shown to induce stemness and cellular reprogramming through paracrine mechanisms,15,16 our results raise the possibility that post-senescent cells, using their remnant SASP, render cells within their microenvironment more susceptible to further transformation by increasing their plasticity.
Our time-resolved integrative profiling revealed novel transcriptional regulators relevant to cancer development and epigenomic features with prognostic potential. Foremost, we identified POU2F2 as a critical factor that promotes OIS escape in vitro and provided compelling evidence that POU2F2 performs a similar function during CRC development, where its overexpression and increased activity are associated with a proliferative and inflammatory transcriptional program as well as decreased overall and disease-free survival. Furthermore, this putative function of POU2F2 in CRC is consistent with recent evidence demonstrating its role in the progression of cancers in several tissues, including in stomach, lung, brain, and germinal B cell lymphomas, where it regulates transcriptional networks that alter metabolic pathways, promotes cell proliferation and metastasis, and activates cell differentiation programs.60,61,62,84 Collectively, these findings highlight POU2F2 as a potential therapeutic target in CRC.
Another important finding is the identification of 119 AP1-associated SACSs in human CRCs, which indicates that at least a subset of the CRC samples analyzed underwent a period of senescence during cancer development. Given that AP1 TFs are master mediators of the senescence program,30,85 the preferential binding of AP1 TFs at SACSs relative to the overall CRC-accessible chromatin landscape supports this conclusion. Furthermore, a SACS gene signature was detectable at the adenoma stage of disease progression and predicted disease-free survival in CRC, in contrast to the POU2F2-driven gene signature. This suggests that patients with CRCs in which senescence responses remain functional, detectable by the presence of SACSs, generally respond better to treatment compared with patients with cancers that originated from cells that had escaped from OIS through a POU2F2-dependent mechanism. Overall, our findings highlight the prognostic and diagnostic power of senescence-associated gene signatures in CRC and support the beneficial aspects of senescence in the outcome of anticancer therapy.6,30,86 Future work will have to establish the generalizability of senescence-associated gene signatures as diagnostic and prognostic tools during disease progression and their ability to inform and direct therapeutic decision-making.
In summary, our work provides a comprehensive framework of the gene-regulatory mechanisms governing OIS escape and its associated cell-fate transitions in the context of cancer development. It also highlights the strength of integrative time-resolved profiling as an effective approach to improving cancer diagnostics/prognostics and revealing therapeutic liabilities to modulate the senescence program for clinical benefit.
Limitations of the study
Our study was focused on the epigenome and transcriptional dynamics at the population level. Therefore, we cannot formally exclude the possibility that individual cells or subpopulations with intrinsic resistance to OIS and/or distinct RAS levels may exist. How single-cell transcriptomic heterogeneity in cell-fate decision trajectories determines the population dynamics87 during the escape from OIS remains to be addressed using single-cell multiomic approaches in future work. Similarly, although we detected SACSs in CRC, we cannot exclude a contribution of cells within the tumor microenvironment to the epigenetic memory of senescence in CRC. This will be addressed in future experiments by isolating the different cell types within CRC tumors and characterizing their chromatin accessibility landscape.
STAR★Methods
Key resources table
| REAGENT or RESOURCE | SOURCE | IDENTIFIER |
|---|---|---|
| Antibodies | ||
| H3K4me1 | Active Motif | Cat #39297; RRID: AB_2615075 |
| H3K27ac | Active Motif | Cat #39133; RRID: AB_2561016 |
| RAS | BD | Cat#610001; RRID: AB_397424 |
| POU2F2 | Santa Cruz Biotechnology | Cat# sc-377475-X |
| γ-Tubulin | Millipore-Sigma | Cat# T6557; RRID: AB_477584 |
| HNF-3α (A-3) X | Santa Cruz Biotechnology | Cat# sc-514695 X |
| Twist (Twist2C1a) | Santa Cruz Biotechnology | Cat# sc-81417; RRID: AB_1130910 |
| Oct-3/4 (C-10) X (POU5F1) | Santa Cruz Biotechnology | Cat# sc-5279 X; RRID: AB_628051 |
| TEF-1 (H-4) X (TEAD1) | Santa Cruz Biotechnology | Cat# sc-376113 X |
| H3 | Cell signalling | Cat# 4499; RRID: AB_10544537 |
| C-JUN (G-4) | Santa Cruz Biotechnology | Cat# sc-74543 X; RRID: AB_1121646 |
| FOSL2 (FRA2 (Q20) | Santa Cruz Biotechnology | Cat# sc-604 X; RRID: AB_2107084 |
| HRP-conjugated goat anti-rabbit | PerkinElmer | Cat# NEF812001EA; RRID: AB_2571640 |
| HRP-conjugated goat anti-mouse | Cell Signalling | Cat# 70765 |
| P16 INK4a (JC8) | GeneTex | Cat# GTX22419; RRID: AB_372414 |
| 53BP1 (1285C) | Novus Biologicals | Cat# NBP2-54753 |
| Goat anti-Rabbit IgG (H+L) Cross-Adsorbed Secondary Antibody, Alexa Fluor™ 488 | Thermo Fisher Scientific, discontinued | Cat# A-11008; RRID: AB_143165 |
| Bacterial and virus strains | ||
| MAX Efficiency™ DH5α Competent Cells | Thermo Fisher Scientific | Cat# 18258012 |
| Biological samples | ||
| Human Colorectal Tissues | Department of Surgery, New Jersey Medical School | Table S16 |
| Chemicals, peptides, and recombinant proteins | ||
| 4-Hydroxytamoxifen | Sigma | Cat# 68392-35-8 |
| Tissue-Tek O.C.T. compound | Sakura | Cat# 4583 |
| Puromycin | Millipore Sigma | Cat# SKU: P9620 |
| Neomycin | Millipore Sigma (Product of Roche) | Cat# SKU: 4727878001 |
| Ham's F-10 Nutrient Mix | Life Technologies- Thermo Fisher Scientific | Cat# 11550043 |
| DMEM, high glucose | Life Technologies-Thermo Fisher Scientific | Cat# 11965092 |
| Ultralink Resin | Thermo Fisher Scientific | Cat# 53116 |
| AMPure XP (SPRI beads) | Beckman Coulter | Cat# A63881 |
| Glycogen | Ambion™ By Thermo Fisher Scientific |
Cat# AM9510 |
| Proteinase K | NEB | Cat# P8107S |
| CHAPS lysis buffer | Millipore Sigma | Cat# S7705 |
| Halt™ Protease and Phosphatase Inhibitor Cocktail (100X) | Thermo Fisher Scientific | Cat# 78440 |
| Blotting Grade Blocker Non-Fat Dry Milk | Bio-Rad | Cat# 1706404XTU |
| Clarity Max Western ECL Substrate | Bio-Rad | Cat# 1705062 |
| Cytoseal | Thermo Fisher Scientific | Cat# 48212-154 |
| PNA-Cy3 | Panagene | Cat# F1002 |
| Albumin, Acetylated from bovine serum | Sigma | Cat# B2518 |
| Spectra™ Multicolor Broad Range Protein Ladder | Thermo Fisher Scientific | Cat# 26634 |
| Critical commercial assays | ||
| NucleoSpin® RNA Plus XS | Macherey-Nagel Inc | Cat# 740990.250 |
| Affymetrix Human Transcriptome Arrays 2.0 | Applied Biosystems™ | Cat# 902162 |
| Accel-NGS 2S Plus DNA Library kit | Swift Biosciences | Cat# 21024 |
| Invitrogen Qubit DS DNA HS Assay kit | Thermo Fisher Scientific | Cat# Q32854 |
| NEB Next High-Fidelity 2× PCR Master Mix | NEB | Cat# M0541S |
| Illumina Tagment DNA Enzyme and Buffer Kit | Illumina | Cat# 20034210 |
| Qiagen MinElute PCR kit | Qiagen | Cat# 28004 |
| NEBNext Ultra II Library Prep Kit | NEB | Cat# E7645S |
| Invitrogen™ Click-iT™ EdU Cell Proliferation Kit for Imaging, Alexa Fluor™ 488 dye | Thermo Fisher Scientific | Cat# C10337 |
| iScript™ cDNA Synthesis Kit, | Bio-Rad | Cat# 1708891 |
| iTaq Universal SYBR® Green Supermix | Bio-Rad | Cat# 1725124 |
| Mouse and Rabbit specific HRP/DAB (ABC) Detection IHC Kits | Abcam | Cat# ab64264 |
| TRAPEZE® RT Telomerase Detection Kit | Millipore Sigma | Cat# S7710 |
| EndoFree Plasmid Maxi Kit | Qiagen | Cat# 12362 |
| Deposited data | ||
| GEO:GSE205898 | Gene Expression Omnibus database | https://www.ncbi.nlm.nih.gov/geo/query/acc.cgi?acc=GSE205898 |
| GEO: GSE206496 | Gene Expression Omnibus database | https://www.ncbi.nlm.nih.gov/geo/query/acc.cgi?acc=GSE206496 |
| GEO: GSE206493 | Gene Expression Omnibus database | https://www.ncbi.nlm.nih.gov/geo/query/acc.cgi?acc=GSE206493 |
| GEO: GSE206402 | Gene Expression Omnibus database | https://www.ncbi.nlm.nih.gov/geo/query/acc.cgi?acc=GSE206402 |
| ENCSR763AKE | ENCODE Consortium36,88 | https://www.encodeproject.org/experiments/ENCSR763AKE/ |
| ENCSR276ITP | ENCODE Consortium36,88 | https://www.encodeproject.org/experiments/ENCSR276ITP/ |
| ENCSR340MRJ | ENCODE Consortium36,88 | https://www.encodeproject.org/experiments/ENCSR340MRJ/ |
| ENCSR923JYH | ENCODE Consortium36,88 | https://www.encodeproject.org/experiments/ENCSR923JYH/ |
| ENCSR760QZM | ENCODE Consortium36,88 | https://www.encodeproject.org/experiments/ENCSR760QZM/ |
| ENCSR462XTM | ENCODE Consortium36,88 | https://www.encodeproject.org/experiments/ENCSR462XTM/ |
| TCGA-AA-A024 | TCGA | TCGA-AA-A024 |
| TCGA-AA-A00L | TCGA | TCGA-AA-A00L |
| TCGA-AA-A01X | TCGA | TCGA-AA-A01X |
| TCGA-QL-A97D | TCGA | TCGA-QL-A97D |
| TCGA-NH-A50V | TCGA | TCGA-NH-A50V |
| TCGA-AA-A01D | TCGA | TCGA-AA-A01D |
| TCGA-NH-A6GC | TCGA | TCGA-NH-A6GC |
| TCGA-AA-A02E | TCGA | TCGA-AA-A02E |
| TCGA-A6-A56B | TCGA | TCGA-A6-A56B |
| TCGA-AA-A01P | TCGA | TCGA-AA-A01P |
| TCGA-QG-A5YV | TCGA | TCGA-QG-A5YV |
| TCGA-NH-A50U | TCGA | TCGA-NH-A50U |
| TCGA-AA-A00E | TCGA | TCGA-AA-A00E |
| TCGA-AA-A01S | TCGA | TCGA-AA-A01S |
| TCGA-3L-AA1B | TCGA | TCGA-3L-AA1B |
| TCGA-AA-A010 | TCGA | TCGA-AA-A010 |
| TCGA-AY-A69D | TCGA | TCGA-AY-A69D |
| TCGA-AY-A71X | TCGA | TCGA-AY-A71X |
| TCGA-NH-A6GA | TCGA | TCGA-NH-A6GA |
| TCGA-AY-A8YK | TCGA | TCGA-AY-A8YK |
| TCGA-4N-A93T | TCGA | TCGA-4N-A93T |
| TCGA-A6-A565 | TCGA | TCGA-A6-A565 |
| TCGA-QG-A5YX | TCGA | TCGA-QG-A5YX |
| TCGA-AA-A022 | TCGA | TCGA-AA-A022 |
| TCGA-AA-A02F | TCGA | TCGA-AA-A02F |
| TCGA-NH-A8F8 | TCGA | TCGA-NH-A8F8 |
| TCGA-AD-6889 | TCGA | TCGA-AD-6889 |
| TCGA-AA-A00Q | TCGA | TCGA-AA-A00Q |
| TCGA-AY-A54L | TCGA | TCGA-AY-A54L |
| TCGA-NH-A5IV | TCGA | TCGA-NH-A5IV |
| TCGA-A6-A566 | TCGA | TCGA-A6-A566 |
| TCGA-AA-A01R | TCGA | TCGA-AA-A01R |
| TCGA-A6-A567 | TCGA | TCGA-A6-A567 |
| TCGA-AA-A00W | TCGA | TCGA-AA-A00W |
| TCGA-DM-A28G | TCGA | TCGA-DM-A28G |
| TCGA-NH-A8F7 | TCGA | TCGA-NH-A8F7 |
| TCGA-AA-A00J | TCGA | TCGA-AA-A00J |
| TCGA-SS-A7HO | TCGA | TCGA-SS-A7HO |
| GEO: GSE14333 | Gene Expression Omnibus database | https://www.ncbi.nlm.nih.gov/geo/query/acc.cgi?acc=GSE14333 |
| GEO: GSE33113 | Gene Expression Omnibus database | https://www.ncbi.nlm.nih.gov/geo/query/acc.cgi?acc=GSE33113 |
| GEO: GSE37892 | Gene Expression Omnibus database | https://www.ncbi.nlm.nih.gov/geo/query/acc.cgi?acc=GSE37892 |
| GEO: GSE39582 | Gene Expression Omnibus database | https://www.ncbi.nlm.nih.gov/geo/query/acc.cgi?acc=GSE39582 |
| GEO: GSE20916 | Gene Expression Omnibus database | https://www.ncbi.nlm.nih.gov/geo/query/acc.cgi?acc=GSE20916 |
| GEO: GSE206496 | Gene Expression Omnibus database | This paper |
| Experimental models: Cell lines | ||
| Human foreskin fibroblasts GM21 (male) | Coriell Institute | Cat# GM21808; RRID: CVCL_H991 |
| Human lung Fibroblasts WI38 (female) | European Collection of Authenticated Cell Cultures (ECACC) | ECACC Cat# 90020107; RRID: CVCL_0579 |
| Human lung Fibroblasts LF1 (female) | A gift from Sedivy J.M., Brown University89 | RRID: CVCL_C120 |
| Human embryonic kidney 293T cells (female) | ATCC | Cat# CRL-3216; RRID: CVCL_0063 |
| Platinum-A (female) | Cell Biolabs | Cat# RV-102; RRID: CVCL_B489 |
| Oligonucleotides | ||
| GADPH QuantiTect Primers | Qiagen | Cat# QT00079247 |
| HRAS QuantiTect Primers | Qiagen | Cat# QT00008799 |
| IL1B QuantiTect Primers | Qiagen | Cat# QT00021385 |
| IL8 QuantiTect Primers | Qiagen | Cat# QT00000322 |
| CDKN2A QuantiTect Primers | Qiagen | Cat# QT00089964 |
| CDKN1A QuantiTect Primers | Qiagen | Cat# QT00062090 |
| CCNA2 QuantiTect Primers | Qiagen | Cat# QT00014798 |
| POU2F2 QuantiTect Primers | Qiagen | Cat# QT00087290 |
| TERT QuantiTect Primers | Qiagen | Cat# QT00073409 |
| Recombinant DNA | ||
| pBABE-puro H-RASG12V | a gift from Bob Weinberg | RRID: Addgene_1768; http://n2t.net/addgene:1768 |
| pBABE-puro Empty Vector | a gift from Hartmut Land & Jay Morgenstern & Bob Weinberg90 | RRID: Addgene_1764; http://n2t.net/addgene:1764 |
| pBABE-Neo hTERT | a gift from Bob Weinberg91 | RRID: Addgene_1774; http://n2t.net/addgene:1774 |
| pLNCX2 ER: Ras | a gift from Masashi Narita92 | RRID: Addgene_67844; http://n2t.net/addgene:67844 |
| POU2F2-targeting shRNAs, pLKO.1-Neo-CMV-tGFP | Sigma | Cat# TRCN0000245324 |
| POU2F2-targeting shRNAs, pLKO.1-Neo-CMV-tGFP | Sigma | Cat# TRCN0000245325 |
| pLKO.1. Empty Vector-Neo-CMV-tGFP | Sigma | TRC1.5 alternate vector backbones |
| PAX-2 | a gift from Malin Parmar | RRID: Addgene_35002; http://n2t.net/addgene:35002 |
| PMD2.G | a gift from Didier Trono | RRID: Addgene_12259; http://n2t.net/addgene:12259 |
| Software and algorithms | ||
| oligo v.1.62.0 | Carvalho et al.93 | https://doi.org/10.1093/bioinformatics/btq431 |
| Limma v.3.54.0 | Ritchie et al.94 | https://doi.org/10.1093/nar/gkv007 |
| oposSOM v.2.16.0 | Loffler-Wirth et al.33 | https://doi.org/10.1093/bioinformatics/btv342 |
| WGCNA v.1.71 | Langfelder et al.95 | https://doi.org/10.1186/1471-2105-9-559 |
| clusterProfiler v.4.6.0 | Wu et al.34 | https://doi.org/10.1016/j.xinn.2021.100141 |
| DREM v.2.0.4 | Schulz et al.50 | https://doi.org/10.1186/1752-0509-6-104 |
| ISMARA | Balwierz et al.51 | ISMARA |
| fastq-mcf v.1.0.5 | Erik Aronesty (2011). ea-utils: "Command-line tools for processing biological sequencing data"; | fastq-mcf |
| samtools v.1.1.1 | Li et al.96 | samtools |
| PicardTools v.2.2.2 | Broad Institute | Picard |
| Bowtie2 v.2.4.4 | Langmead et al.97 | https://doi.org/10.1038/nmeth.1923 |
| MACS v.2.2.7.1 | Liu98 | https://doi.org/10.1007/978-1-4939-0512-6_4 |
| DESeq2 v.1.36.0 | Love et al.99 | https://doi.org/10.1186/s13059-014-0550-8 |
| chromstaR v.1.22.0 | Hanna et al.100 | https://doi.org/10.1038/s41594-017-0013-5 |
| FactoMineR v.2.6.0 | Le et al.101 | FactoMineR |
| Vennerable v.3.1.0.9000 | Swinton, Github Inc. | Vennerable |
| ChIPseeker v.1.32.0 | Yu et al.102 | ChIPseeker |
| deeptools v3.3.1 | Ramirez et al.103 | deepTools |
| HINT-RGT v.0.13.2 | Li et al.36 | HINT-RGT |
| TFBSTools v.1.34.0 | Tan & Lenhard104 | TFBSTools |
| Igraph v.1.3.4 | Gustavsen et al.105 | https://doi.org/10.12688/f1000research.2088.3 |
| Rcytoscape v.2.13 | Bioconductor Open-Source Software for Bioinformatics | Rcytoscape |
| CyREST API | Ono et al.106 | CyREST |
| Bedtools v.2.30.0 | Quinlan et al.107 | Bedtools |
| Bedops v.2.4.41 | Neph et al.108 | Bedops |
| GraphPad Prism version 9.5 | GraphPad By Dotmatics | https://www.graphpad.com/ |
| GSEA GUI version 4.2.2 | Broad Institute/MIT | https://www.gsea-msigdb.org/gsea/index.jsp |
| Zen Blue 2.3 software | Zeiss | https://www.zeiss.com/microscopy/en/products/software/zeiss-zen.html |
| Protein Simple FluorChem E Imaging System | Bio-Techne | https://www.bio-techne.com/p/imaging/fluorchem-e-system_92-14860-00 |
| Image Studio Lite Ver. 5.2. | LI-COR Biosciences (discontinued) | https://www.licor.com/bio/image-studio-lite/ |
| Bio-Rad CFX Manager 3.1 | BioRad | https://www.bio-rad.com/en-us/sku/1845000-cfx-manager-software?ID=1845000 |
| AxioVision version 4.7.1 | Zeiss | https://www.zeiss.com/microscopy/en/products/software/zeiss-zen.html |
| ImageJ version 1.51 | NIH | https://imagej.nih.gov/ij/ |
Resource availability
Lead contact
Further information and requests for resources and reagents should be directed to and will be fulfilled by the lead contact, Utz Herbig (herbigut@njms.rutgers.edu).
Materials availability
Materials generated in this study are available from the lead contact upon request.
Experimental model and subject details
Primary cell culture
Human somatic GM21 foreskin fibroblasts (Coriell Institute, Camden, NJ) WI38 (#90020107, European Collection of Authenticated Cell Cultures, Porton Down, UK) and LF1 fetal human lung fibroblasts89 (RRID: CVCL_C120, gift from Sedivy J.M.) were cultured in a DMEM (Life Technologies) or Ham’s F-10 (Life Technologies) (LF1) medium containing 10% fetal bovine serum (FBS, Atlanta Biologicals) and 1× penicillin/streptomycin (Corning) at 37 °C in a 2% oxygen atmosphere. GM21-ER:RAS fibroblasts were cultured as above and stimulated with 4-hydroxytamoxifen (4-OHT) at the indicated concentrations in the main text and was replenished every 2-3 days for the duration of the experiment. Samples were collected and processed at the time points indicated in the main text. Human embryonic kidney 293T cells (CRL-3216, ATCC) and Platinum-A (Plat-A, Cell Biolabs) were cultured in DMEM medium supplemented with 10% fetal bovine serum (FBS) and maintained at 37°C in an atmosphere of 5% CO2.
Tissue collection
Tissue samples were collected from the Department of Surgery, NJMS-University Hospital, from patients undergoing partial or complete colectomy surgery. The participants included in this study signed a consent form before inclusion. The local IRB committee approved the study. Clinical information on the patients is in Table S16. The age and sex for one of the human tissues used are missing due to technical issues, as we no longer have access to the hospital databases containing that information. Following histopathological analysis by the surgical pathologist, tissue considered excess was provided. Samples were transported on ice and immediately cryopreserved in OCT compound (Sakura, Torrence, CA) using 2-methylbutane cooled with liquid nitrogen. Samples were stored at –80°C until ready for use.
Method details
Retroviral transductions
The following retroviral plasmids were used: pBABE-puro H-RASG12V; Addgene plasmid 1768, pBABE-puro Empty Vector; Addgene plasmid 1764,90 pBABE-Neo hTERT; Addgene plasmid 1774,91 pLNCX2 ER: Ras; Addgene plasmid 67844.92 All plasmids were produced in MAX Efficiency™ DH5α Competent Cells (Thermo Fisher) and isolated with EndoFree Plasmid Maxi Kit (Qiagen) according to the manufacturer's instructions. GM21-, WI38-, and LF1-H-RASG12V fibroblasts and their empty vector counterparts were generated by retroviral transduction, as described in.24 Briefly, using the calcium phosphate precipitation method, retroviral particles were produced by transfecting the packaging cell lines, Platinum-A (Cell Biolabs), with the vector of interest. After transfection, viral supernatants were collected, and target cells were transduced with virus for 8-12 h. Cells were selected with 2 μg/mL puromycin (#P9620, Millipore Sigma) for 48 h or with 400μg/ml neomycin (#4727878001, Sigma, product of Roche) for seven days.
Lentiviral transductions
The following lentiviral plasmids were used: POU2F2-targeting shRNAs (pLKO.1-Neo-CMV-tGFP, TRCN0000245324, and TRCN0000245325, purchased from Sigma) as well as pLKO.1. Empty Vector-Neo-CMV-tGFP (purchased from Sigma) together with helper plasmids PAX-2; Addgene 35002 and PMD2.G; Addgene 12259.109 GM21 and WI38 fibroblasts constitutively expressing non-targeting and POU2F2-targeting shRNAs were generated by lentiviral transduction. Briefly, using the calcium phosphate precipitation method, lentiviral particles were produced by transfecting the packaging cell lines, human embryonic kidney 293T (CRL-3216, ATCC), with the vector of interest and both helper plasmids. After transfection, viral supernatants were collected, and target cells were transduced with virus for 8–12 h. Cells were selected with 400 μg/ml neomycin (#4727878001, Sigma, product of Roche) for seven days. Cells were subsequently retrovirally transduced with H-RASG12V or empty vector as described above.
RNA and microarrays
RNA from each time-point from GM21 fibroblasts undergoing escape from OIS was purified using the Macherey-Nagel Nucleospin RNA Plus XS kit according to the manufacturer’s instructions (Macherey-Nagel Inc, Allentown, PA). According to the manufacturer’s instructions, 100 ng RNA per sample was analyzed using Affymetrix Human Transcriptome Arrays 2.0 (Applied Biosystems, Santa Clara, CA).
Microarray data preprocessing
Data were processed as described in.30 Briefly, all microarrays were normalized simultaneously using the robust multi-array normalization algorithm implemented in the oligo package.93 Internal control probes were removed, and deciles of average expression were defined for the entire time series. Probes falling in the lowest four deciles of expression were removed. Identification and removal of unidentified sources of variability were performed using the removebatcheffect option of the limma package.94 Replicate similarity was evaluated at each preprocessing step using principal component analysis and bi-clustering using Pearson’s correlation with Ward’s aggregation criterion.
Self-organizing maps (SOMs)
SOM expression portraits were generated using the unsupervised machine learning method deployed in oposSOM.33 Metagenes were visualized in a 60 x 60 grid of rectangular topology, wherein expression portraits are projected by metagene distance matrix similarity using a logarithmic fold-change scale. To verify that expressions portraits from GM21 fibroblasts escaping OIS differ from time-matched controls, we implemented the D-clustering feature of oposSOM, which reveals clusters of differentially expressed genes based on SOM units with local maxima relative to the mean Euclidean distance to their neighbors.
Gene co-expression networks
Normalized and preprocessed microarray expression data were analyzed for differential expression using limma.94 Due to the similarity of consecutively measured time points on PCA plots and SOM portraits, we collapsed them into four stages: proliferation, senescence, transition, and escape. We performed contrasts comparing the senescence, transition, and escape stages to the proliferation reference to identify differentially expressed genes. The statistical approach involves empirical Bayes-moderated t-statistics applied to all contrasts for each probe, followed by moderated F-statistic to test whether all the contrasts are zero, evaluating the significance of the expression changes observed. For significant probes, p-values were corrected for multiple testing with the FDR approach using a significance level of 0.005 as a cut-off. Probes matching these criteria that also exhibited a minimal absolute fold change of 1 were considered differentially expressed genes (DEGs). 2,118 DEGs were used as input for unsupervised clustering using WGCNA95 using the ‘signed’ option with default parameters except for the soft-thresholding power, which was set to 19. The identified co-expressed gene modules were visualized by heatmaps, network, and PCA plots. Gene modules were also submitted to pathway analysis using clusterProfiler34 using the Molecular Signatures Database Hallmark and KEGG gene sets.110,111 Statistical significance was determined by hypergeometric tests with a cut-off of FDR <= 0.1 with Benjamini-Hochberg correction.
DREM and ISMARA
Time-series microarray gene expression data were analyzed using DREM50 and ISMARA.51 DREM was run using default settings except for the change thresholding parameter, set to the maximum-minimum setting with a minimum absolute expression change of 1. Gene Ontology analysis was performed with default settings, with statistical significance calculated using randomization with 500 random samples. For ISMARA, raw CEL files were uploaded to the ISMARA server (https://ismara.unibas.ch/mara/) and run using default parameters.
Histone modification ChIP-seq
Chromatin was collected from GM21 fibroblasts retrovirally transduced with an empty vector (referred to as day 0) or H-RASG12V at days 10, 18, 22, and 32 after transduction. A total of 0.8-1 × 10⁷ cells (per time point, from 10 pooled biological replicates) were fixed in 1% formaldehyde for 15 min, quenched in 2 M glycine for an additional 5 min, and pelleted by centrifugation at 2,000 r.p.m., 4 °C for 4 min. Nuclei were extracted in extraction buffer 2 (0.25 M sucrose, 10 mM Tris-HCl pH 8.0, 10 mM MgCl2, 1% Triton X-100 and proteinase inhibitor cocktail) on ice for 10 min, followed by centrifugation at 3,000 × g at 4 °C for 10 min. The supernatant was removed, and nuclei were resuspended in nuclei lysis buffer (50 mM Tris-HCl pH 8.0, 10 mM EDTA, 1% SDS, and proteinase inhibitor cocktail). Sonication was performed using a Branson sonicator until the desired average fragment size (100–300 bp) was obtained. Soluble chromatin was obtained by centrifugation at 12,000 r.p.m. for 15 min at 4 °C, and chromatin was diluted tenfold. Immunoprecipitation was performed overnight at 4 °C with rotation using 1 × 10⁶ cell equivalents per immunoprecipitation using antibodies (5 μg) against H3K4me1 (Active Motif, Carlsbad, MA; Cat no. 39297) and H3K27ac (Active Motif, Carlsbad, MA; Cat no. 39133). Subsequently, 30 μl of Ultralink Resin (Thermo Fisher Scientific, Waltham, MA) was added and allowed to tumble for 4 h at 4 °C. The resin was pelleted by centrifugation and washed three times in low-salt buffer (150 mM NaCl, 0.1% SDS, 1% Triton X-100, 20 mM EDTA, 20 mM Tris-HCl pH 8.0), one time in high-salt buffer (500 mM NaCl, 0.1% SDS, 1% Triton X-100, 20 mM EDTA, 20 mM Tris-HCl pH 8.0), two times in lithium chloride buffer (250 mM LiCl, 1% IGEPAL CA-630, 15 sodium deoxycholate, 1 mM EDTA, 10 mM Tris-HCl pH 8.0) and two times in TE buffer (10 mM Tris-HCl, 1 mM EDTA). Washed beads were resuspended in elution buffer (10 mM Tris-Cl pH 8.0, 5 mM EDTA, 300 mM NaCl, 0.5% SDS) treated with RNAse H (30 min, 37 °C) and Proteinase K (2 h, 37 °C), 1 μl glycogen (20 mg/ml; Ambion, Austin, TX) was added and decrosslinked overnight at 65 °C. For histone modifications, DNA was recovered by mixing the decrosslinked supernatant with 2.2× SPRI beads followed by 4 min of incubation at room temperature. The SPRI beads were washed twice in 80% ethanol, allowed to dry, and DNA was eluted in 35 μl of 10 mM Tris-Cl pH 8.0. Libraries were constructed using an Accel-NGS 2S Plus DNA Library kit (21024; Swift Biosciences, Ann Arbor, MI) and amplified for 9 cycles. Libraries were then resuspended in 20 μl of low EDTA–TE buffer. Libraries were quality controlled in an Agilent Technologies 2100 Bioanalyzer (Applied Biosystems, Santa Clara, CA) and quantified using an Invitrogen Qubit DS DNA HS Assay kit (Q32854) (Thermo Fischer Scientific, Waltham, MA). Libraries were sequenced using an Illumina High-Seq 2500. Typically, 30–50 million reads were required for downstream analyses.
ATAC-seq
The transposition reaction and library construction were performed as previously described in.35 Briefly, 50,000 cells from each time point of the OIS escape time course (two biological replicates) were collected, washed in 1× in PBS, and centrifuged at 500 × g at 4 °C for 5 min. Nuclei were extracted by incubating cells in nuclear extraction buffer (containing 10 mM Tris-HCl, pH 7.4, 10 mM NaCl, 3 mM MgCl2, 0.1% IGEPAL CA-630) and immediately centrifuged at 500 × g at 4 °C for 5 min. The supernatant was carefully removed by pipetting, and the transposition was performed by resuspending nuclei in 50 μl of Transposition Mix containing 1× TD Buffer (Illumina, San Diego, CA) and 2.5 μl Tn5 (Illumina) for 30 min at 37 °C. DNA was extracted using a Qiagen MinElute kit (Qiagen, Germantown, MD). Libraries were produced by PCR amplification (12 cycles) of tagmented DNA using an NEB Next High-Fidelity 2× PCR Master Mix (New England Biolabs, Ipswich, MA). Library quality was assessed using an Agilent Bioanalyzer 2100 (Applied Biosystems, Santa Clara, CA). Paired-end sequencing was performed in an Illumina Hiseq 2500 system. Typically, 30–50 million reads per library were required for downstream analyses.
RNA-seq
RNA from control and shPOU2F2-expressing GM21 fibroblasts at the senescence (day 14) and escape (day 27) phases was isolated with a Macherey-Nagel Nucleospin RNA Plus XS kit according to the manufacturer’s instructions (Macherey-Nagel Inc, Allentown, PA). The RNA integrity number (RIN) of all samples was at least 9. Libraries were generated using the NEBNext Ultra II Library Prep Kit (New England Biolabs, Ipswich, MA) and sequenced in an Illumina Hiseq 2500 system. 40 million reads per library were required for downstream analyses.
Preprocessing of high-throughput sequencing data
Paired-end (RNA-seq and ATAC-seq) and single-end reads (ChIP-seq) were aligned to the hg19 version of the human genome using bowtie297 using the local mode. Low-quality reads and adapters were removed using fastq-mcf v.1.0.5 (https://github.com/ExpressionAnalysis/ea-utils). Alignments were further processed using samtools v.1.1.1,96 and PCR and optical duplicates were removed with PicardTools v.2.2.2 (http://broadinstitute.github.io/picard/). Enriched regions for histone modifications and ATAC-seq were identified using MACS v.2.2.7.198 (macs2 callpeak —nomodel —shiftsize —shift-control—gsize hs -p 1e-3). The identified peaks were subsequently processed using the irreproducibility discovery rate (IDR) pipeline,112 generating time point-specific reproducible peak sets for histone modifications and ATAC-seq at each time point. A master peak set was constructed using a custom bedops108 script that merges common peaks between samples. For RNA-seq samples, reads were counted using summarized overlaps and normalized with DESeq2 for visualization.
Chromatin state transitions
To identify and quantify combinatorial chromatin state dynamics, we analyzed the genome-wide combinations of H3K4me1, H3K27ac, and ATAC-seq signals on IDR-controlled reproducible peaks of GM21 escaping OIS using the chromstaR package, which relies on implementing a univariate Hidden Markov Model (HMM) with two hidden states (unmodified and modified).100 Briefly, the algorithm was run on differential mode and configured to partition the genome in 200 bp non-overlapping bins and count the number of reads of histone modification/ATAC-seq mapping into each bin at the time points indicated in the main text and modeled using a univariate HMM based on a two-component mixture, the zero-inflated binomial distribution. Subsequently, a multivariate HMM assigns every bin in the genome to one of the multivariate components considering 2(5-time points x 3 genomic enrichment variables [histone modifications and ATAC-seq]) possible states. Only robust transitions (differential score of >= 1.9) were considered in the analysis. To verify the chromatin states linked to histone modifications/ATAC-seq in GM21 fibroblasts undergoing escape from OIS, we performed extensive comparisons with chromatin state data generated in NHLF cells from the ENCODE project. To evaluate the relationship between chromatin state dynamics and transcriptional output, we first identified nearby genes to the select chromatin state transitions shown in Figure 2B, further selected genes belonging to the identified co-expression modules, and visualized their expression dynamics relative to chromatin state transitions using correspondence analysis (CA, Figure 2C) and boxplots (Figure 2E). For CA, results were visualized on an asymmetric biplot using FactoMineR101 after filtering for the top contributing chromatin state transitions (square cosine >0.5).
Chromatin accessibility and senescence scars
To highlight peaks with differential accessibility (DA) over time, we used DESeq2.99 ‘Senescence scars’ were defined as the intersection of DA peaks when comparing each time point in the dataset (Days 8, 14, 18, 23, and 32) with peaks identified at Day 0. Significant peaks were selected at an adjusted p-value of 0.05 (Ward’s test) and used for subsequent analyses. Venn diagram plots were generated by the R package Vennerable (https://github.com/js229/Vennerable). To identify modules of peaks with correlated accessibility profiles over time, we used WGCNA.95 We set the ‘minimum cluster size’ and the ‘deepSplit’ parameters to 130 and 3. We obtained the value of the ‘soft threshold’ parameter, set at 20, using the elbow method recommended by the developers. By visually inspecting the obtained modules, we defined the ‘dissimilarity threshold’ parameter as 0.20.
Chromatin accessibility and transcription integration
We determined the closest gene to each DA peak using the R package ChIPseeker.102 We used the clusterProfiler34 R package to perform an over-representation analysis of each identified DA peak module based on the Molecular Signatures Database. We integrated our DNA accessibility and transcriptomic datasets by inspecting the overlap of DA peaks target genes with identified DE genes and generated a river plot using the R package NetworkD3 (https://cran.r-project.org/web/packages/networkD3/index.html) to observe the association between the dynamic profiles obtained by the hierarchical clustering of each dataset.
Normalized genome browser tracks
For genome track visualizations, RNA-seq, ChIP-seq and ATAC-seq alignments were normalized using deeptools v3.3.1100103 using the RPGC approach to obtain 1X coverage (bamCoverage -b –normalizeUsing RPGC –effectiveGenomeSize 2864785220 –ignoreDuplicates –binSize 10 –verbose -o).
Transcription factor footprinting
Footprinting, TF motif enrichment, and differential binding activity were performed with HINT-ATAC36 using the JASPAR position weight matrix database for vertebrate TFs113 on merged ATAC-seq datasets (at least two biological replicates) of the indicated time points of GM21 fibroblasts undergoing escape from OIS. HINT-ATAC uses position dependency models (PDM) to estimate the bias of Tn5 cleavage events and incorporates nucleosomal density and strand-specific information to increase footprinting quality. We limited our footprinting and differential binding activity analyses to enhancer regions undergoing chromatin state transitions defined by chromstaR and considered only expressed TFs. We used the R package TFBSTools104 to compute the similarities between any two binding motifs based on their Pearson correlation. We clustered together TFs with a similarity higher than 0.9, obtaining 255 distinct unique TF clusters. To investigate TF co-binding, we joined chromatin regions containing TF binding instances less than 500 bp apart, resulting in a set of chromatin regions with variable sizes (up to 3 kbp) concentrating TF activity during the entire time course, as described in.30 We performed a hypergeometric test for each pairwise co-binding possibility for each time point and adjusted p-values for multiple testing using Bonferroni correction.
Transcription factor networks
We built TF hierarchical networks as previously described in,30 focusing on transcriptionally upregulated TFs from the OIS gene module to evaluate the TF hierarchical and temporal activity. Briefly, each identified TF is represented as a node, connected by directed edges representing co-binding events along the chromatin and during the entire time course. An edge with TF A as the source and TF B as the target indicates that TF A binds to the same chromatin regions as TF B at the same or at a previous time point. For each TF, we computed their normalized total number of bound regions and dynamicity and represented those properties in the networks as node size and node color, respectively. Each edge is associated with a weight in the interval [0, 1], representing the fraction of TF B binding instances previously occupied by TF A. We filtered the networks for edges with a weight higher than 0.15 and performed a transitive reduction to simplify the obtained networks while keeping essential topological features. Nodes included in the same strongly connected component (SCC), i.e., connected both by incoming and outgoing paths, were merged into a single node. We represented the identified transcriptomic module distribution for TFs included in the same SCC as Doughnut Charts. We used the R package igraph to represent the TF networks and exported them from the R environment to the Cytoscape software using the R package Rcy3105 and the CyREST API.106
Integration of public CRC chromatin accessibility and gene expression data
Fastq files of normal colon DNA-seq datasets from the ENCODE Consortium88 with identifiers ENCSR088CMZ, ENCSR340MRJ, ENCSR276ITP, ENCSR923JYH, and ENCSR760QZM (all generated by the John Stamatoyannopoulos laboratory) were downloaded from SRA and aligned to the GRCh38.d1.vd1 version of the human genome using bowtie297 with the local alignment option. Alignments were preprocessed as described above for ChIP-seq and ATAC-seq datasets. Alignments of 38 ATAC-seq datasets of colorectal cancer tumor samples available at the Cancer Genome Atlas (TCGA) were downloaded. Enriched regions were called using MACS v.2.2.7.1 using a relaxed p-value threshold of 0.01. Master peaksets including normal colon and CRC peaks were generated using a custom bedops script as described above. Differentially accessible regions (DARs) were determined using DESeq2 and only DARs with a log2 fold-change of >= 1 were used for clustering with WGCNA. Footprinting and differential binding activity at DARs were performed using HINT-ATAC as described above. SACS in CRC were identified with bedtools107 intersect using the GRCh38.d1.vd1 coordinates of SACS identified in GM21 and the CRC-specific differentially accessible modules as input. Where indicated in the main text, integration with differential expression data from CRC was performed by annotating POU2F2 footprints and SACS to the nearest gene, and genes with an absolute log2 fold change of 0.29 were considered. Differential expression data was obtained from the Xena Differential Gene Expression Analysis Pipeline comparing 631 primary tumors to 101 solid normal tissue biopsies.114 Functional characterization of POU2F2 OIS escape and SACS CRC-specific gene signatures was performed with clusterProfiler using MSigDB and KEGG pathway gene sets. The results shown here are in whole or part, based upon data generated by the TCGA Research Network: https://www.cancer.gov/tcga.
Prognostic potential of POU2F2 in CRC survival
Gene expression and overall survival information for all samples (n = 617) in the TCGA-COADREAD project were downloaded from the Genomic Data Commons Data Portal. Normalized expression values for POU2F2 (FKPM UQ) were extracted and samples were grouped as ‘POU2F2 low’ or ‘POU2F2 high’ using a FKPM UQ cut-off of 0.72. Survival probability was calculated with a log-rank test using GraphPad Prism version 9.5. Significance was set at p-value = 0.05.
Prognostic evaluation of SACS and POU2F2 gene signatures
Microarray expression data of normal colon mucosa (n = 24) and CRCs at various stages of disease progression (n = 1077) with disease free survival information (n = 982) from four publicly available studies in the Gene Expression Omnibus database (GEO: GSE14333, GSE33113, GSE37892 and GSE39582) was downloaded and preprocessed together as described in the microarray section above, except that we discarded the bottom 30% of all probes. Batch correction using the study code as the source of variation was performed using the removebatcheffect option of the limma package.94 We determined the differentially expressed genes (DEGs) between CRC and normal colon mucosa using limma, subset for DEGs with a log2 fold change of at least 2 to retrieve information-rich genes only, clustered the DEGs using WGCNA as described above and verified the enrichment of our POU2F2 and SACS gene signatures in this dataset using a hypergeometric test. We then performed gene set enrichment analysis (GSEA), linking our gene signatures to disease-free survival (relapse versus no relapse after surgery; n = 982). To evaluate the biomarker potential of SACS and POU2F2 gene signatures in disease progression, we analyzed microarray expression data from GEO: GSE20916, processed as above, except that an absolute log2 fold change of 0.5 was used. Significant enrichment was considered at an FDR of >= 0.05.
GSEA
GSEA was performed on transcriptomes (GEO: GSE14333, GSE33113, GSE37892, and GSE39582) of patients with CRC phenotypically classified into groups ‘relapse’ or ‘no relapse’ after surgery using GSEA GUI version 4.2.2. Probe sets were collapsed to the gene level using the correlation-based approach.115 The correlation of probe sets representing the same gene was computed to decide whether to average probe sets (c > 0.2) or to use the probe set with the highest average expression across samples (c ≤ 0.2). Probe sets without known annotation were removed. The signal-to-noise ratio (μA – μB)/(σA + σB) (μ represents the mean, σ the standard deviation) was used as a ranking metric and statistics based on gene set permutations. For POU2F2 RNA interference experiments, the list of predicted POU2F2 target genes defined by ATAC-seq footprinting was used as input to determine positively and negatively regulated POU2F2 target genes. The labels ‘pLKO’ and ‘shPOU2F2’ were used to define the phenotypes according to the shRNA treatment, and genes were ranked from high to low expression relative to ‘pLKO’. GSEA was performed using the log2-ratio-of-classes as a ranking metric, and statistics were calculated based on gene set permutations. Positively and negatively regulated genes were selected by subsetting target genes at a ranking metric of >= 0.3 and <= -0.2, respectively.
EdU incorporation and population doublings
Growth curves were generated by counting the cells with a hematocytometer and using the formula PD=3.32∗[log(N final)-log(N initial)], where N final is the number of cells recovered from the dish and N initial is the number of cells initially seeded at each plate. To measure EdU incorporation, cells were labeled with 10μM EdU for 48 hrs, and EdU-positive cells were detected using the ClickiT Plus EdU Alexa Fluor 488 (Thermo Fisher Scientific, Waltham, MA) according to the manufacturer’s instructions. Images were acquired using a Zeiss Axio Observer Z1, an AxioCam MRm camera (Zeiss, Jena, Germany), and Zen Blue 2.3 software (Zeiss, Jena, Germany). For EdU incorporation, 3 to 5 images per coverslip were imaged at 10x magnification, and positive signals and a total number of cells were manually counted with Zen Blue 2.3 software.
Western blotting
Protein extracts were prepared in 1x CHAPS Lysis buffer (Millipore-Sigma, Saint Louis, MO) containing 1:100 Halt protease and phosphatase inhibitor cocktail (Thermo Fisher Scientific, Waltham, MA) or in nuclei lysis buffer (50 mM Tris-HCl pH 8.0, 10 mM EDTA, 1% SDS, and proteinase inhibitor cocktail) following sonication. A total of 10 to 20 μg of whole-cell lysates were resolved on 4-15% SDS/PAGE precast gels (Bio-rad, Hercules, CA). Spectra™ Multicolor Broad Range Protein Ladder (Thermo Fisher Scientific) was run on parallel as reference. Proteins were transferred to nitrocellulose membranes using the Trans-Blot Turbo Transfer System (Bio-rad, Hercules, CA) and probed as described.10 Briefly, after transfer, membranes were blocked in 5% non-fat dry milk (Bio-Rad, USA) in 1x TBST (150 mM NaCl, 10 mM Tris–HCl, pH 8.0, 0.05% Tween 20) at room temperature for 1 h, then incubated with primary antibody at 4°C overnight with shaking. Membranes were washed three times in 1 × TBST for 10 min with shaking, then incubated with secondary antibodies for 1 h shaking, washed three times in 1 × TBST for 10 min with shaking, and imaged at Protein Simple FluorChem E Imaging System. The following primary antibodies and dilutions were used: anti-Ras (BD Transduction Laboratories, San Jose, CA; Cat no. 610001; 1:1000 dilution), POU2F2 (Santa Cruz Biotechnology, Dallas TX; Cat no. sc-377475-X; 1:500 dilution) and γ-Tubulin (Millipore-Sigma, Saint Louis, MO; Cat no. T6557; 1:1000 dilution). HNF-3α (A-3) X (Santa Cruz Biotechnology, Dallas TZ; Cat no sc-514695 X; dilution 1:1000). Twist (Twist2C1a) (Santa Cruz Biotechnology, Dallas TZ; Cat no sc-81417; dilution 1:1000). Oct-3/4 (C-10) X (POU5F1) (Santa Cruz Biotechnology, Dallas TZ; Cat no sc-5279 X, dilution 1:1000). TEF-1 (H-4) X (TEAD1) (Santa Cruz Biotechnology, Dallas TZ; Cat no sc-376113 X, dilution 1:1000). H3 (Cell Signalling, Danvers, MA; Cat no. 4499, dilution 1:3000). C-JUN (G-4) (Santa Cruz Biotechnology, Dallas TZ; Cat no sc-74543 X; dilution 1:2000). FOSL2 (FRA2 (Q20), Santa Cruz Biotechnology, Dallas TZ; Cat no sc-604 x; dilution 1:2000). p16INK4a (JC8, GeneTex, Cat# GTX22419; dilution 1:1000). HRP-conjugated goat anti-rabbit (PerkinElmer, Waltham, MA; Cat no. NEF812001EA; 1:6000 dilution) or anti-mouse (Cell Signalling, Danvers, MA; Cat no. 70765; 1:3000 dilution) antibodies were used as secondary antibodies. Densitometric analysis of CDKN2A/p16Ink4a in shPOU2F2 cells is presented as a fold increase compared to control plkO.1 EV cells. γ-tubulin is used as a loading control. Bands were visualized using the Clarity Max ECL system (Bio-Rad, USA) and were quantified using Image Studio Lite Ver. 5.2.
Real-time quantitative polymerase chain reaction
Total RNA was isolated from cells with RNeasy Mini kit (Qiagen, Germantown, MD) or Nucleospin RNA Plus XS (Macherey-Nagel, Allentown, PA) according to the manufacturer’s protocol. As per the manufacturer's instructions, reverse transcription of 500 ng of total RNA was carried out using the iScript cDNA synthesis kit (Bio-rad, Hercules, CA). Quantitative real-time PCR (qPCR) was performed using specific primers (listed below) with the iTaq Universal SYBR Green Supermix (Bio-rad, Hercules, CA) on a CFX96 Touch Real-Time PCR detection system (Bio-rad, Hercules, CA). Samples were analyzed in technical triplicates, and GADPH levels were used for normalization. The following Qiagen QuantiTect Primers were used: GADPH (QT00079247), HRAS (QT00008799), IL1B (QT00021385), IL8 (QT00000322), CDKN2A (QT00089964), CDKN1A (QT00062090), CCNA2 (QT00014798) and POU2F2 (QT00087290), TERT (QT00073409) (Qiagen, Germantown, MD).
Tissue processing
Tissue samples were transported on ice and immediately cryopreserved in OCT compound (Sakura, Torrence, CA) using 2-methylbutane cooled with liquid nitrogen. Samples were stored at –80 °C until ready for use. The tissue was cut into 8 μm sections using a cryomicrotome (Leica, Dublin, OH) set to -16 °C mounting block temperature and -20 °C air temperature in the chamber and affixed to room temperature positively charged microscope slides (Fisher, Waltham, MA). Slides were then placed on dry ice for transport to storage at –80 °C until staining. H&E stain was performed by serial submission in hematoxylin, mild-acid differentiator, bluing solution, and eosin with wash steps after each, followed by dehydration with ethanol and xylene before mounting coverslips with Cytoseal (Thermo Fisher Scientific, Waltham, MA). All tissue samples were collected from NJMS-University Hospital with the approval of the local IRB committee.
Immunohistochemistry
Tissue samples were brought to room temperature and outlined in a hydrophobic pen. PBS was used to dissolve excess OCT, and samples were then fixed in 4% PFA for 3 minutes. Immunohistochemistry was performed in duplicate for each sample per manufacturer’s instructions using Mouse and Rabbit specific HRP/DAB (ABC) Detection IHC Kits (Abcam, Cambridge, UK) with TBST used for wash buffer. Briefly, slides were blocked with peroxide block, then protein block for ten minutes each, incubated with primary antibody for one hour at room temperature, followed by incubation with biotinylated goat anti-mouse or anti-rabbit secondary and streptavidin HRP for ten minutes each. DAB chromogen/substrate mixture was applied for 1 minute, and samples were given a final rinse in deionized water. The primary antibodies used were monoclonal mouse anti-POU2F2 (Santa Cruz Biotechnology, Dallas, TX; Cat no. sc-377475-X). One duplicate of each stain was counterstained with hematoxylin and ammonium bluing solution; then all samples were dehydrated with ethanol and xylenes and coverslips mounted with Cytoseal (Thermo Fisher Scientific, Waltham, MA). Tissues were visualized on a Zeiss AX10 microscope, images acquired in AxioVision version 4.7.1, and processed on ImageJ version 1.51.
Telomerase activity
Telomerase activity was measured by the TRAPeze RT Telomerase detection Kit (Millipore-Sigma, Saint Louis, MO), using PCR and Amplifluor primers according to the manufacturer's instructions. Pelleted cells were resuspended in CHAPS lysis buffer, incubated on ice for 30 min, and spun to collect the supernatant. 400 ng of protein lysate was used to detect telomerase activity using the Real-Time PCR system (Bio-Rad). Quantitative values of the telomerase activity were obtained from a standard curve generated by dilutions of the control template provided by the kit.
Telomere-immuno FISH
To detect Telomere Dysfunction Induced Foci (TIF), cells were fixed in 4% paraformaldehyde (PFA) for 20 minutes at 4°C, permeabilized with PBS-Triton X 100 (PBS-T) 0.2% for 20 min at room temperature, and subsequently serially dehydrated by placing them in 70%, 80%, and 95% (vol/vol) ethanol for 3 min each. After air-drying, nuclear DNA was denatured for 5 min at 80 °C in hybridization buffer containing Cy3-conjugated telomere-specific PNA [Cy3-(C3TA2)3; Panagene] at a concentration of 0.5 μg/mL, 70% (vol/vol) formamide, 12 mM Tris·HCl (pH 8.0), 5 mM KCl, 1 mM MgCl2, 0.08% Triton X-100, and 0.25% acetylated albumin (BSA, Sigma), followed by incubation in the same buffer overnight at room temperature. Coverslips were washed sequentially with 70% (vol/vol) formamide/0.6× SSC [90 mM NaCl, 9 mM Na–citrate (pH 7); three times for 15 min each], 2× SSC (15 min), and [PBS + 0.1% Tween 20 (PBST); 5 min] and then blocked with 4% BSA diluted in PBS-T 0.1% for 1 h at room temperature followed by immunostaining for markers of DNA damage, using primary antibody 53BP1 (Novus; dilution 1:1000) and secondary Alexa Fluor 488-conjugated goat anti-rabbit antibodies (Thermo Fisher).
Quantification of telomere dysfunction-induced DNA damage foci
Images were acquired using a Zeiss Axiovert 200M microscope, an AxioCamMRm camera (Zeiss, Jena, Germany), and AxioVision software (Version 4.6.3; Zeiss). To analyze and quantitate colocalization between telomere signals and DSB foci, images were acquired as z-series (7 to 11 images, 0.3-μm optical slices) using a motorized stage, a 63×/1.4 oil immersion lens, and an ApoTome (Zeiss, Jena, Germany). ApoTome microscopy eliminates out-of-focus light and generates shallow focal planes (0.5 μM using a 63× oil objective). Random images of at least 100 cells were acquired using a 63×/1.4 oil immersion lens to quantitate DDR foci.
Colony formation assay
5,000 cells that entered into and escaped from OIS and time-matched empty vector controls with or without immortalization by retroviral transduction of hTERT were mixed with a final concentration of 0.3% agar and DMEM medium containing 10% FBS and plated in triplicates onto six-well dishes containing a basal layer of 0.8% agar containing DMEM medium and 10% FBS. The plates were kept in a humidified incubator at 37 °C with 5% CO2 and 2% Oxygen for five weeks. Fresh medium was added every four days. After five weeks, digital images of 20 random fields at 10x magnification were acquired using Zeiss Axio Observer Z1 with an attached AxioCam MRm camera (Zeiss). The number and size of colonies were counted manually using Zen Blue 2.3 software (Zeiss).
Quantification and statistical analysis
The quantitative and statistical analyses are described in the relevant sections of the method details for microarray and high-throughput sequencing data or in the table and figure legends for other data types.
Acknowledgments
R.I.M.-Z. is a Mexican National Researchers System (SNI) fellow. This study was supported by the National Cancer Institute of the NIH (R01CA136533). The content is solely the responsibility of the authors and does not necessarily represent the official views of the National Institutes of Health.
Author contributions
R.I.M.-Z., A.S., O.B., and U.H. designed the study, designed experiments, interpreted data, and wrote the manuscript. R.I.M.-Z. and A.S. generated cell culture systems; performed ChIP-seq, ATAC-seq, and RNA interference experiments; and analyzed data. R.I.M.-Z. performed computational analyses on the microarray, ChIP-seq, ATAC-seq, ENCODE, GEO, and TCGA data and generated and prepared figures. P.-F.R. processed ATAC-seq data and designed computational pipelines to analyze microarray and ChIP-seq data. A.S. performed colony formation and telomerase activity experiments and analyzed data. A.S. and T.V. performed EdU incorporation and TIF experiments and analyzed data. M.S. performed immunohistochemistry experiments. G.D. generated the microarray data. J.A.N.L.F.F. generated the TF networks and analyzed ATAC-seq data. R.J.C. conducted surgeries on cancer patients, and R.J.C. and M.A.G. provided tumor tissue and consulted on pathologic diagnoses.
Declaration of interests
The authors declare no competing interests.
Published: April 5, 2023
Footnotes
Supplemental information can be found online at https://doi.org/10.1016/j.xgen.2023.100293.
Contributor Information
Ricardo Iván Martínez-Zamudio, Email: ricardo.martinezzamudio@rutgers.edu.
Oliver Bischof, Email: oliver.bischof@cnrs.fr.
Utz Herbig, Email: herbigut@njms.rutgers.edu.
Supplemental information
This table contains the source data and associated statistical analyses for Figure S1A (population doublings), Figure S1B (telomerase activity), Figure S1C (ER-qPCR), Figures S1D–S1H (colony formation), Figure S1K (population doublings long time course), Figure S1L (TIF quantification), Figures S1O and S1S (EdU incorporation), and Figures S1P–S1R (population doublings WI38, LF1, GM21ERRAS); related to STAR Methods sections “EdU incorporation and population doublings,” “real-time quantitative polymerase chain reaction,” “telomerase activity,” and “colony formation assay.”
This table contains normalized and annotated microarray fluorescence intensity data used to generate Figures 1B–1I and S2. Additional tabs contain gene expression modules (Figures 1E, 1F, and S2F), self-organizing map-associated D clusters (Figures 2C and 2D), differentially expressed genes in OIS escape cells (Figure S2E), and the list of predicted secreted genes (Figure 2I); related to Figures 1 and S2.
This table contains the global K4me1, K27ac, and ATAC peak sets; chromatin states per time point; and differential chromatin states used to generate Figures 2A–2E and S3; related to Figures 2 and S3.
This table contains normalized TF expression data used to generate Figure S4A, differential binding activity used to generate Figure 3A, and co-binding matrices used to generate Figures 3B, 3C, S4B, and S4C; related to Figures 3 and S4.
This table contains data used to generate TF networks at WGCNA gene modules described in Figure 1; related to Figure 4.
This table contains data used to generate TF networks dynamics at opening and closing enhancers at day 0 (EV-transduced cells); related to STAR Methods section “TF networks.”
This table contains data used to generate TF networks dynamics at opening and closing enhancers at day 8 after RAS overexpression; related to STAR Methods section “TF networks.”
This table contains data used to generate TF networks dynamics at opening and closing enhancers at day 14 after RAS overexpression; related to STAR Methods section “TF networks.”
This table contains data used to generate TF networks dynamics at opening and closing enhancers at day 23 after RAS overexpression; related to STAR Methods section “TF networks.”
This table contains data used to generate TF networks dynamics at opening and closing enhancers at day 32 after RAS overexpression; related to STAR Methods section “TF networks.”
This table contains the microarray counts for POU2F2 gene targets (Figures 5C and 5D), population doublings of POU2F2 KD cells (Figures 5F, S6L, and S6K), EdU incorporation of POU2F2 KD cells (Figure 5G), POU2F2 target genes and their pathway analysis (Figures 5J–5M), CDKN2A RNA-seq reads in POU2F2 KD cells (Figure 5N), and P16 densitometry analyses (Figures 5O and S6Q); related to Figures 5 and S6.
This table contains the normalized RNA-seq POU2F2 reads and the overall survival information of CRC TCGA-COAGREAD samples (Figure 6A), POU2F2 gene targets in CRC and their pathway analysis (Figures 6C, 6D, and S7A), and the POU2F2 escape gene signature and its pathway analysis (Figure S7C); related to Figures 6 and S7.
This table contains chromatin accessibility coordinates and signal values (Figure 7A), emission matrix for SACS identification (Figures 7B and 7C), SACS coordinates and their chromatin state transitions (Figures 7D and 7E), chromatin accessibility and gene expression linkage (Figure S9B), chromatin accessibility modules in CRC and normal colon (Figure S9I), SACS coordinates in CRC (Figure S9K), and SACS gene targets in CRC used for GSEA (Figures 7K–7M); related to Figures 7 and S9.
This table contains the WGCNA modules of DEGs identified in public CRC and normal colon transcriptomes; related to STAR Methods sections “prognostic evaluation of SACS and POU2F2 gene signatures” and “GSEA.”
This table contains the WGCNA modules od DEGs of public CRC progression datasets from GEO20916; related to STAR Methods sections “prognostic evaluation of SACS and POU2F2 gene signatures” and “GSEA.”
Data and code availability
-
•
Microarray and high-throughput sequencing data have been deposited at the Gene Expression Omnibus and Sequence Read Archive databases and are publicly available as of the date of publication. Accession numbers are listed in the key resources table.
-
•
This paper analyzes existing, publicly available data. These accession numbers for the datasets are listed in the key resources table.
-
•
All code is available at Mendeley: (https://data.mendeley.com/datasets/92869mbc4n/draft?a=5968a459-a783-46ff-bfbf-95e3bfec4908).
-
•
Any additional information required to reanalyze the data reported in this paper is available from the lead contact upon request.
-
•
All code used to preprocess and analyze data and generate all figures in this manuscript can be found in the supplemental information.
References
- 1.Serrano M., Lin A.W., McCurrach M.E., Beach D., Lowe S.W. Oncogenic ras provokes premature cell senescence associated with accumulation of p53 and p16INK4a. Cell. 1997;88:593–602. doi: 10.1016/s0092-8674(00)81902-9. [DOI] [PubMed] [Google Scholar]
- 2.Collado M., Serrano M. Senescence in tumours: evidence from mice and humans. Nat. Rev. Cancer. 2010;10:51–57. doi: 10.1038/nrc2772. [DOI] [PMC free article] [PubMed] [Google Scholar]
- 3.Saab R. Senescence and pre-malignancy: how do tumors progress? Semin. Cancer Biol. 2011;21:385–391. doi: 10.1016/j.semcancer.2011.09.013. [DOI] [PubMed] [Google Scholar]
- 4.Gray-Schopfer V.C., Cheong S.C., Chong H., Chow J., Moss T., Abdel-Malek Z.A., Marais R., Wynford-Thomas D., Bennett D.C. Cellular senescence in naevi and immortalisation in melanoma: a role for p16? Br. J. Cancer. 2006;95:496–505. doi: 10.1038/sj.bjc.6603283. [DOI] [PMC free article] [PubMed] [Google Scholar]
- 5.Fujita K., Mondal A.M., Horikawa I., Nguyen G.H., Kumamoto K., Sohn J.J., Bowman E.D., Mathe E.A., Schetter A.J., Pine S.R., et al. p53 isoforms Delta133p53 and p53beta are endogenous regulators of replicative cellular senescence. Nat. Cell Biol. 2009;11:1135–1142. doi: 10.1038/ncb1928. [DOI] [PMC free article] [PubMed] [Google Scholar]
- 6.Haugstetter A.M., Loddenkemper C., Lenze D., Gröne J., Standfuss C., Petersen I., Dörken B., Schmitt C.A. Cellular senescence predicts treatment outcome in metastasised colorectal cancer. Br. J. Cancer. 2010;103:505–509. doi: 10.1038/sj.bjc.6605784. [DOI] [PMC free article] [PubMed] [Google Scholar]
- 7.Braig M., Lee S., Loddenkemper C., Rudolph C., Peters A.H.F.M., Schlegelberger B., Stein H., Dörken B., Jenuwein T., Schmitt C.A. Oncogene-induced senescence as an initial barrier in lymphoma development. Nature. 2005;436:660–665. doi: 10.1038/nature03841. [DOI] [PubMed] [Google Scholar]
- 8.Collado M., Gil J., Efeyan A., Guerra C., Schuhmacher A.J., Barradas M., Benguría A., Zaballos A., Flores J.M., Barbacid M., et al. Tumour biology: senescence in premalignant tumours. Nature. 2005;436:642. doi: 10.1038/436642a. [DOI] [PubMed] [Google Scholar]
- 9.Bartkova J., Rezaei N., Liontos M., Karakaidos P., Kletsas D., Issaeva N., Vassiliou L.V.F., Kolettas E., Niforou K., Zoumpourlis V.C., et al. Oncogene-induced senescence is part of the tumorigenesis barrier imposed by DNA damage checkpoints. Nature. 2006;444:633–637. doi: 10.1038/nature05268. [DOI] [PubMed] [Google Scholar]
- 10.Suram A., Kaplunov J., Patel P.L., Ruan H., Cerutti A., Boccardi V., Fumagalli M., Di Micco R., Mirani N., Gurung R.L., et al. Oncogene-induced telomere dysfunction enforces cellular senescence in human cancer precursor lesions. EMBO J. 2012;31:2839–2851. doi: 10.1038/emboj.2012.132. [DOI] [PMC free article] [PubMed] [Google Scholar]
- 11.Acosta J.C., O'Loghlen A., Banito A., Guijarro M.V., Augert A., Raguz S., Fumagalli M., Da Costa M., Brown C., Popov N., et al. Chemokine signaling via the CXCR2 receptor reinforces senescence. Cell. 2008;133:1006–1018. doi: 10.1016/j.cell.2008.03.038. [DOI] [PubMed] [Google Scholar]
- 12.Acosta J.C., Banito A., Wuestefeld T., Georgilis A., Janich P., Morton J.P., Athineos D., Kang T.W., Lasitschka F., Andrulis M., et al. A complex secretory program orchestrated by the inflammasome controls paracrine senescence. Nat. Cell Biol. 2013;15:978–990. doi: 10.1038/ncb2784. [DOI] [PMC free article] [PubMed] [Google Scholar]
- 13.Demaria M., Ohtani N., Youssef S.A., Rodier F., Toussaint W., Mitchell J.R., Laberge R.M., Vijg J., Van Steeg H., Dollé M.E.T., et al. An essential role for senescent cells in optimal wound healing through secretion of PDGF-AA. Dev. Cell. 2014;31:722–733. doi: 10.1016/j.devcel.2014.11.012. [DOI] [PMC free article] [PubMed] [Google Scholar]
- 14.Razdan N., Vasilopoulos T., Herbig U. Telomere dysfunction promotes transdifferentiation of human fibroblasts into myofibroblasts. Aging Cell. 2018;17 doi: 10.1111/acel.12838. [DOI] [PMC free article] [PubMed] [Google Scholar]
- 15.Mosteiro L., Pantoja C., Alcazar N., Marión R.M., Chondronasiou D., Rovira M., Fernandez-Marcos P.J., Muñoz-Martin M., Blanco-Aparicio C., Pastor J., et al. Tissue damage and senescence provide critical signals for cellular reprogramming in vivo. Science. 2016;354 doi: 10.1126/science.aaf4445. [DOI] [PubMed] [Google Scholar]
- 16.Ritschka B., Storer M., Mas A., Heinzmann F., Ortells M.C., Morton J.P., Sansom O.J., Zender L., Keyes W.M. The senescence-associated secretory phenotype induces cellular plasticity and tissue regeneration. Genes Dev. 2017;31:172–183. doi: 10.1101/gad.290635.116. [DOI] [PMC free article] [PubMed] [Google Scholar]
- 17.Li F., Huangyang P., Burrows M., Guo K., Riscal R., Godfrey J., Lee K.E., Lin N., Lee P., Blair I.A., et al. FBP1 loss disrupts liver metabolism and promotes tumorigenesis through a hepatic stellate cell senescence secretome. Nat. Cell Biol. 2020;22:728–739. doi: 10.1038/s41556-020-0511-2. [DOI] [PMC free article] [PubMed] [Google Scholar]
- 18.Courtois-Cox S., Jones S.L., Cichowski K. Many roads lead to oncogene-induced senescence. Oncogene. 2008;27:2801–2809. doi: 10.1038/sj.onc.1210950. [DOI] [PubMed] [Google Scholar]
- 19.Lee S., Schmitt C.A. The dynamic nature of senescence in cancer. Nat. Cell Biol. 2019;21:94–101. doi: 10.1038/s41556-018-0249-2. [DOI] [PubMed] [Google Scholar]
- 20.Parry A.J., Hoare M., Bihary D., Hänsel-Hertsch R., Smith S., Tomimatsu K., Mannion E., Smith A., D'Santos P., Russell I.A., et al. NOTCH-mediated non-cell autonomous regulation of chromatin structure during senescence. Nat. Commun. 2018;9:1840. doi: 10.1038/s41467-018-04283-9. [DOI] [PMC free article] [PubMed] [Google Scholar]
- 21.Krtolica A., Parrinello S., Lockett S., Desprez P.Y., Campisi J. Senescent fibroblasts promote epithelial cell growth and tumorigenesis: a link between cancer and aging. Proc. Natl. Acad. Sci. USA. 2001;98:12072–12077. doi: 10.1073/pnas.211053698. [DOI] [PMC free article] [PubMed] [Google Scholar]
- 22.Eggert T., Wolter K., Ji J., Ma C., Yevsa T., Klotz S., Medina-Echeverz J., Longerich T., Forgues M., Reisinger F., et al. Distinct functions of senescence-associated immune responses in liver tumor surveillance and tumor progression. Cancer Cell. 2016;30:533–547. doi: 10.1016/j.ccell.2016.09.003. [DOI] [PMC free article] [PubMed] [Google Scholar]
- 23.Milanovic M., Fan D.N.Y., Belenki D., Däbritz J.H.M., Zhao Z., Yu Y., Dörr J.R., Dimitrova L., Lenze D., Monteiro Barbosa I.A., et al. Senescence-associated reprogramming promotes cancer stemness. Nature. 2018;553:96–100. doi: 10.1038/nature25167. [DOI] [PubMed] [Google Scholar]
- 24.Patel P.L., Suram A., Mirani N., Bischof O., Herbig U. Derepression of hTERT gene expression promotes escape from oncogene-induced cellular senescence. Proc. Natl. Acad. Sci. USA. 2016;113:E5024–E5033. doi: 10.1073/pnas.1602379113. [DOI] [PMC free article] [PubMed] [Google Scholar]
- 25.Yu Y., Schleich K., Yue B., Ji S., Lohneis P., Kemper K., Silvis M.R., Qutob N., van Rooijen E., Werner-Klein M., et al. Targeting the senescence-overriding cooperative activity of structurally unrelated H3K9 demethylases in melanoma. Cancer Cell. 2018;33:785. doi: 10.1016/j.ccell.2018.03.009. [DOI] [PubMed] [Google Scholar]
- 26.Zampetidis C.P., Galanos P., Angelopoulou A., Zhu Y., Polyzou A., Karamitros T., Kotsinas A., Lagopati N., Mourkioti I., Mirzazadeh R., et al. A recurrent chromosomal inversion suffices for driving escape from oncogene-induced senescence via subTAD reorganization. Mol. Cell. 2021;81:4907–4923.e8. doi: 10.1016/j.molcel.2021.10.017. [DOI] [PubMed] [Google Scholar]
- 27.Tasdemir N., Banito A., Roe J.S., Alonso-Curbelo D., Camiolo M., Tschaharganeh D.F., Huang C.H., Aksoy O., Bolden J.E., Chen C.C., et al. BRD4 connects enhancer remodeling to senescence immune surveillance. Cancer Discov. 2016;6:612–629. doi: 10.1158/2159-8290.CD-16-0217. [DOI] [PMC free article] [PubMed] [Google Scholar]
- 28.Sen P., Lan Y., Li C.Y., Sidoli S., Donahue G., Dou Z., Frederick B., Chen Q., Luense L.J., Garcia B.A., et al. Histone acetyltransferase p300 induces de novo super-enhancers to drive cellular senescence. Mol. Cell. 2019;73:684–698.e8. doi: 10.1016/j.molcel.2019.01.021. [DOI] [PMC free article] [PubMed] [Google Scholar]
- 29.Guan Y., Zhang C., Lyu G., Huang X., Zhang X., Zhuang T., Jia L., Zhang L., Zhang C., Li C., Tao W. Senescence-activated enhancer landscape orchestrates the senescence-associated secretory phenotype in murine fibroblasts. Nucleic Acids Res. 2020;48:10909–10923. doi: 10.1093/nar/gkaa858. [DOI] [PMC free article] [PubMed] [Google Scholar]
- 30.Martínez-Zamudio R.I., Roux P.F., de Freitas J.A.N.L.F., Robinson L., Doré G., Sun B., Belenki D., Milanovic M., Herbig U., Schmitt C.A., et al. AP-1 imprints a reversible transcriptional programme of senescent cells. Nat. Cell Biol. 2020;22:842–855. doi: 10.1038/s41556-020-0529-5. [DOI] [PMC free article] [PubMed] [Google Scholar]
- 31.Hamburger A.W., Salmon S.E. Primary bioassay of human tumor stem cells. Science. 1977;197:461–463. doi: 10.1126/science.560061. [DOI] [PubMed] [Google Scholar]
- 32.Boehm J.S., Hession M.T., Bulmer S.E., Hahn W.C. Transformation of human and murine fibroblasts without viral oncoproteins. Mol. Cell Biol. 2005;25:6464–6474. doi: 10.1128/MCB.25.15.6464-6474.2005. [DOI] [PMC free article] [PubMed] [Google Scholar]
- 33.Löffler-Wirth H., Kalcher M., Binder H. oposSOM: R-package for high-dimensional portraying of genome-wide expression landscapes on bioconductor. Bioinformatics. 2015;31:3225–3227. doi: 10.1093/bioinformatics/btv342. [DOI] [PubMed] [Google Scholar]
- 34.Wu T., Hu E., Xu S., Chen M., Guo P., Dai Z., Feng T., Zhou L., Tang W., Zhan L., et al. clusterProfiler 4.0: a universal enrichment tool for interpreting omics data. Innovation. 2021;2 doi: 10.1016/j.xinn.2021.100141. [DOI] [PMC free article] [PubMed] [Google Scholar]
- 35.Buenrostro J.D., Giresi P.G., Zaba L.C., Chang H.Y., Greenleaf W.J. Transposition of native chromatin for fast and sensitive epigenomic profiling of open chromatin, DNA-binding proteins and nucleosome position. Nat. Methods. 2013;10:1213–1218. doi: 10.1038/nmeth.2688. [DOI] [PMC free article] [PubMed] [Google Scholar]
- 36.Li Z., Schulz M.H., Look T., Begemann M., Zenke M., Costa I.G. Identification of transcription factor binding sites using ATAC-seq. Genome Biol. 2019;20:45. doi: 10.1186/s13059-019-1642-2. [DOI] [PMC free article] [PubMed] [Google Scholar]
- 37.Corces M.R., Granja J.M., Shams S., Louie B.H., Seoane J.A., Zhou W., Silva T.C., Groeneveld C., Wong C.K., Cho S.W., et al. The chromatin accessibility landscape of primary human cancers. Science. 2018;362 doi: 10.1126/science.aav1898. [DOI] [PMC free article] [PubMed] [Google Scholar]
- 38.Tsankov A.M., Gu H., Akopian V., Ziller M.J., Donaghey J., Amit I., Gnirke A., Meissner A. Transcription factor binding dynamics during human ES cell differentiation. Nature. 2015;518:344–349. doi: 10.1038/nature14233. [DOI] [PMC free article] [PubMed] [Google Scholar]
- 39.Goode D.K., Obier N., Vijayabaskar M.S., Lie-A-Ling M., Lilly A.J., Hannah R., Lichtinger M., Batta K., Florkowska M., Patel R., et al. Dynamic gene regulatory networks drive hematopoietic specification and differentiation. Dev. Cell. 2016;36:572–587. doi: 10.1016/j.devcel.2016.01.024. [DOI] [PMC free article] [PubMed] [Google Scholar]
- 40.Mayran A., Drouin J. Pioneer transcription factors shape the epigenetic landscape. J. Biol. Chem. 2018;293:13795–13804. doi: 10.1074/jbc.R117.001232. [DOI] [PMC free article] [PubMed] [Google Scholar]
- 41.Khoyratty T.E., Ai Z., Ballesteros I., Eames H.L., Mathie S., Martín-Salamanca S., Wang L., Hemmings A., Willemsen N., von Werz V., et al. Distinct transcription factor networks control neutrophil-driven inflammation. Nat. Immunol. 2021;22:1093–1106. doi: 10.1038/s41590-021-00968-4. [DOI] [PMC free article] [PubMed] [Google Scholar]
- 42.Karamouzis M.V., Papavassiliou A.G. Transcription factor networks as targets for therapeutic intervention of cancer: the breast cancer paradigm. Mol. Med. 2011;17:1133–1136. doi: 10.2119/molmed.2011.00315. [DOI] [PMC free article] [PubMed] [Google Scholar]
- 43.Wilkinson A.C., Nakauchi H., Göttgens B. Mammalian transcription factor networks: recent advances in interrogating biological complexity. Cell Syst. 2017;5:319–331. doi: 10.1016/j.cels.2017.07.004. [DOI] [PMC free article] [PubMed] [Google Scholar]
- 44.Lambert M., Jambon S., Depauw S., David-Cordonnier M.H. Targeting transcription factors for cancer treatment. Molecules. 2018;23 doi: 10.3390/molecules23061479. [DOI] [PMC free article] [PubMed] [Google Scholar]
- 45.Niwa H. The principles that govern transcription factor network functions in stem cells. Development. 2018;145 doi: 10.1242/dev.157420. [DOI] [PubMed] [Google Scholar]
- 46.Bushweller J.H. Targeting transcription factors in cancer - from undruggable to reality. Nat. Rev. Cancer. 2019;19:611–624. doi: 10.1038/s41568-019-0196-7. [DOI] [PMC free article] [PubMed] [Google Scholar]
- 47.Latchman D.S. The Oct-2 transcription factor. Int. J. Biochem. Cell Biol. 1996;28:1081–1083. doi: 10.1016/1357-2725(96)00050-7. [DOI] [PubMed] [Google Scholar]
- 48.Schonemann M.D., Ryan A.K., Erkman L., McEvilly R.J., Bermingham J., Rosenfeld M.G. POU domain factors in neural development. Adv. Exp. Med. Biol. 1998;449:39–53. doi: 10.1007/978-1-4615-4871-3_4. [DOI] [PubMed] [Google Scholar]
- 49.Phillips K., Luisi B. The virtuoso of versatility: POU proteins that flex to fit. J. Mol. Biol. 2000;302:1023–1039. doi: 10.1006/jmbi.2000.4107. [DOI] [PubMed] [Google Scholar]
- 50.Schulz M.H., Devanny W.E., Gitter A., Zhong S., Ernst J., Bar-Joseph Z. Drem 2.0: improved reconstruction of dynamic regulatory networks from time-series expression data. BMC Syst. Biol. 2012;6:104. doi: 10.1186/1752-0509-6-104. [DOI] [PMC free article] [PubMed] [Google Scholar]
- 51.Balwierz P.J., Pachkov M., Arnold P., Gruber A.J., Zavolan M., van Nimwegen E. ISMARA: automated modeling of genomic signals as a democracy of regulatory motifs. Genome Res. 2014;24:869–884. doi: 10.1101/gr.169508.113. [DOI] [PMC free article] [PubMed] [Google Scholar]
- 52.Wei W., Hemmer R.M., Sedivy J.M. Role of p14(ARF) in replicative and induced senescence of human fibroblasts. Mol. Cell Biol. 2001;21:6748–6757. doi: 10.1128/MCB.21.20.6748-6757.2001. [DOI] [PMC free article] [PubMed] [Google Scholar]
- 53.Itahana K., Zou Y., Itahana Y., Martinez J.L., Beausejour C., Jacobs J.J.L., Van Lohuizen M., Band V., Campisi J., Dimri G.P. Control of the replicative life span of human fibroblasts by p16 and the polycomb protein Bmi-1. Mol. Cell Biol. 2003;23:389–401. doi: 10.1128/MCB.23.1.389-401.2003. [DOI] [PMC free article] [PubMed] [Google Scholar]
- 54.Zhang H., Cohen S.N. Smurf2 up-regulation activates telomere-dependent senescence. Genes Dev. 2004;18:3028–3040. doi: 10.1101/gad.1253004. [DOI] [PMC free article] [PubMed] [Google Scholar]
- 55.Cusanovich D.A., Pavlovic B., Pritchard J.K., Gilad Y. The functional consequences of variation in transcription factor binding. PLoS Genet. 2014;10 doi: 10.1371/journal.pgen.1004226. [DOI] [PMC free article] [PubMed] [Google Scholar]
- 56.Kim S.Y., Kim T.I. Serrated neoplasia pathway as an alternative route of colorectal cancer carcinogenesis. Intest. Res. 2018;16:358–365. doi: 10.5217/ir.2018.16.3.358. [DOI] [PMC free article] [PubMed] [Google Scholar]
- 57.Nakanishi Y., Diaz-Meco M.T., Moscat J. Serrated colorectal cancer: the road less travelled? Trends Cancer. 2019;5:742–754. doi: 10.1016/j.trecan.2019.09.004. [DOI] [PMC free article] [PubMed] [Google Scholar]
- 58.Saeed O., Lopez-Beltran A., Fisher K.W., Scarpelli M., Montironi R., Cimadamore A., Massari F., Santoni M., Cheng L. RAS genes in colorectal carcinoma: pathogenesis, testing guidelines and treatment implications. J. Clin. Pathol. 2019;72:135–139. doi: 10.1136/jclinpath-2018-205471. [DOI] [PubMed] [Google Scholar]
- 59.Bennecke M., Kriegl L., Bajbouj M., Retzlaff K., Robine S., Jung A., Arkan M.C., Kirchner T., Greten F.R. Ink4a/Arf and oncogene-induced senescence prevent tumor progression during alternative colorectal tumorigenesis. Cancer Cell. 2010;18:135–146. doi: 10.1016/j.ccr.2010.06.013. [DOI] [PubMed] [Google Scholar]
- 60.Wang S.M., Tie J., Wang W.L., Hu S.J., Yin J.P., Yi X.F., Tian Z.H., Zhang X.Y., Li M.B., Li Z.S., et al. POU2F2-oriented network promotes human gastric cancer metastasis. Gut. 2016;65:1427–1438. doi: 10.1136/gutjnl-2014-308932. [DOI] [PMC free article] [PubMed] [Google Scholar]
- 61.Luo R., Zhuo Y., Du Q., Xiao R. POU2F2 promotes the proliferation and motility of lung cancer cells by activating AGO1. BMC Pulm. Med. 2021;21:117. doi: 10.1186/s12890-021-01476-9. [DOI] [PMC free article] [PubMed] [Google Scholar]
- 62.Yang R., Wang M., Zhang G., Li Y., Wang L., Cui H. POU2F2 regulates glycolytic reprogramming and glioblastoma progression via PDPK1-dependent activation of PI3K/AKT/mTOR pathway. Cell Death Dis. 2021;12:433. doi: 10.1038/s41419-021-03719-3. [DOI] [PMC free article] [PubMed] [Google Scholar]
- 63.Wang H., Wang H.S., Zhou B.H., Li C.L., Zhang F., Wang X.F., Zhang G., Bu X.Z., Cai S.H., Du J. Epithelial-mesenchymal transition (EMT) induced by TNF-alpha requires AKT/GSK-3beta-mediated stabilization of snail in colorectal cancer. PLoS One. 2013;8 doi: 10.1371/journal.pone.0056664. [DOI] [PMC free article] [PubMed] [Google Scholar]
- 64.Huynh P.T., Beswick E.J., Coronado Y.A., Johnson P., O'Connell M.R., Watts T., Singh P., Qiu S., Morris K., Powell D.W., Pinchuk I.V. CD90(+) stromal cells are the major source of IL-6, which supports cancer stem-like cells and inflammation in colorectal cancer. Int. J. Cancer. 2016;138:1971–1981. doi: 10.1002/ijc.29939. [DOI] [PMC free article] [PubMed] [Google Scholar]
- 65.Yu X., Wang D., Wang X., Sun S., Zhang Y., Wang S., Miao R., Xu X., Qu X. CXCL12/CXCR4 promotes inflammation-driven colorectal cancer progression through activation of RhoA signaling by sponging miR-133a-3p. J. Exp. Clin. Cancer Res. 2019;38:32. doi: 10.1186/s13046-018-1014-x. [DOI] [PMC free article] [PubMed] [Google Scholar]
- 66.Zhang Z., Xu J., Liu B., Chen F., Li J., Liu Y., Zhu J., Shen C. Ponicidin inhibits pro-inflammatory cytokine TNF-alpha-induced epithelial-mesenchymal transition and metastasis of colorectal cancer cells via suppressing the AKT/GSK-3beta/Snail pathway. Inflammopharmacology. 2019;27:627–638. doi: 10.1007/s10787-018-0534-5. [DOI] [PubMed] [Google Scholar]
- 67.Takahashi N., Vanlaere I., de Rycke R., Cauwels A., Joosten L.A.B., Lubberts E., van den Berg W.B., Libert C. IL-17 produced by Paneth cells drives TNF-induced shock. J. Exp. Med. 2008;205:1755–1761. doi: 10.1084/jem.20080588. [DOI] [PMC free article] [PubMed] [Google Scholar]
- 68.Yang S., Wang B., Guan C., Wu B., Cai C., Wang M., Zhang B., Liu T., Yang P. Foxp3+IL-17+ T cells promote development of cancer-initiating cells in colorectal cancer. J. Leukoc. Biol. 2011;89:85–91. doi: 10.1189/jlb.0910506. [DOI] [PubMed] [Google Scholar]
- 69.Wu D., Wu P., Huang Q., Liu Y., Ye J., Huang J. Interleukin-17: a promoter in colorectal cancer progression. Clin. Dev. Immunol. 2013;2013 doi: 10.1155/2013/436307. [DOI] [PMC free article] [PubMed] [Google Scholar]
- 70.Dow L.E., O'Rourke K.P., Simon J., Tschaharganeh D.F., van Es J.H., Clevers H., Lowe S.W. Apc restoration promotes cellular differentiation and reestablishes crypt homeostasis in colorectal cancer. Cell. 2015;161:1539–1552. doi: 10.1016/j.cell.2015.05.033. [DOI] [PMC free article] [PubMed] [Google Scholar]
- 71.Pontén F., Jirström K., Uhlen M. The human protein atlas--a tool for pathology. J. Pathol. 2008;216:387–393. doi: 10.1002/path.2440. [DOI] [PubMed] [Google Scholar]
- 72.Uhlén M., Fagerberg L., Hallström B.M., Lindskog C., Oksvold P., Mardinoglu A., Sivertsson Å., Kampf C., Sjöstedt E., Asplund A., et al. Proteomics. Tissue-based map of the human proteome. Science. 2015;347 doi: 10.1126/science.1260419. [DOI] [PubMed] [Google Scholar]
- 73.Jorissen R.N., Gibbs P., Christie M., Prakash S., Lipton L., Desai J., Kerr D., Aaltonen L.A., Arango D., Kruhøffer M., et al. Metastasis-associated gene expression changes predict poor outcomes in patients with dukes stage B and C colorectal cancer. Clin. Cancer Res. 2009;15:7642–7651. doi: 10.1158/1078-0432.CCR-09-1431. [DOI] [PMC free article] [PubMed] [Google Scholar]
- 74.Kemper K., Versloot M., Cameron K., Colak S., de Sousa e Melo F., de Jong J.H., Bleackley J., Vermeulen L., Versteeg R., Koster J., Medema J.P. Mutations in the Ras-Raf Axis underlie the prognostic value of CD133 in colorectal cancer. Clin. Cancer Res. 2012;18:3132–3141. doi: 10.1158/1078-0432.CCR-11-3066. [DOI] [PubMed] [Google Scholar]
- 75.Laibe S., Lagarde A., Ferrari A., Monges G., Birnbaum D., Olschwang S., COL2 Project A seven-gene signature aggregates a subgroup of stage II colon cancers with stage III. OMICS. 2012;16:560–565. doi: 10.1089/omi.2012.0039. [DOI] [PubMed] [Google Scholar]
- 76.Marisa L., de Reyniès A., Duval A., Selves J., Gaub M.P., Vescovo L., Etienne-Grimaldi M.C., Schiappa R., Guenot D., Ayadi M., et al. Gene expression classification of colon cancer into molecular subtypes: characterization, validation, and prognostic value. PLoS Med. 2013;10 doi: 10.1371/journal.pmed.1001453. [DOI] [PMC free article] [PubMed] [Google Scholar]
- 77.Skrzypczak M., Goryca K., Rubel T., Paziewska A., Mikula M., Jarosz D., Pachlewski J., Oledzki J., Ostrowski J. Modeling oncogenic signaling in colon tumors by multidirectional analyses of microarray data directed for maximization of analytical reliability. PLoS One. 2010;5 doi: 10.1371/journal.pone.0013091. [DOI] [PMC free article] [PubMed] [Google Scholar]
- 78.Ishihara S., Sasagawa Y., Kameda T., Yamashita H., Umeda M., Kotomura N., Abe M., Shimono Y., Nikaido I. Local states of chromatin compaction at transcription start sites control transcription levels. Nucleic Acids Res. 2021;49:8007–8023. doi: 10.1093/nar/gkab587. [DOI] [PMC free article] [PubMed] [Google Scholar]
- 79.Tape C.J. The heterocellular emergence of colorectal cancer. Trends Cancer. 2017;3:79–88. doi: 10.1016/j.trecan.2016.12.004. [DOI] [PMC free article] [PubMed] [Google Scholar]
- 80.Kim J.J., Lee S.B., Yi S.Y., Han S.A., Kim S.H., Lee J.M., Tong S.Y., Yin P., Gao B., Zhang J., Lou Z. WSB1 overcomes oncogene-induced senescence by targeting ATM for degradation. Cell Res. 2017;27:274–293. doi: 10.1038/cr.2016.148. [DOI] [PMC free article] [PubMed] [Google Scholar]
- 81.Le Duff M., Gouju J., Jonchère B., Guillon J., Toutain B., Boissard A., Henry C., Guette C., Lelièvre E., Coqueret O. Regulation of senescence escape by the cdk4-EZH2-AP2M1 pathway in response to chemotherapy. Cell Death Dis. 2018;9:199. doi: 10.1038/s41419-017-0209-y. [DOI] [PMC free article] [PubMed] [Google Scholar]
- 82.Saleh T., Tyutyunyk-Massey L., Gewirtz D.A. Tumor cell escape from therapy-induced senescence as a model of disease recurrence after dormancy. Cancer Res. 2019;79:1044–1046. doi: 10.1158/0008-5472.CAN-18-3437. [DOI] [PubMed] [Google Scholar]
- 83.Faget D.V., Ren Q., Stewart S.A. Unmasking senescence: context-dependent effects of SASP in cancer. Nat. Rev. Cancer. 2019;19:439–453. doi: 10.1038/s41568-019-0156-2. [DOI] [PubMed] [Google Scholar]
- 84.Hodson D.J., Shaffer A.L., Xiao W., Wright G.W., Schmitz R., Phelan J.D., Yang Y., Webster D.E., Rui L., Kohlhammer H., et al. Regulation of normal B-cell differentiation and malignant B-cell survival by OCT2. Proc. Natl. Acad. Sci. USA. 2016;113:E2039–E2046. doi: 10.1073/pnas.1600557113. [DOI] [PMC free article] [PubMed] [Google Scholar]
- 85.Zheng Y., Liu X., Le W., Xie L., Li H., Wen W., Wang S., Ma S., Huang Z., Ye J., et al. A human circulating immune cell landscape in aging and COVID-19. Protein Cell. 2020;11:740–770. doi: 10.1007/s13238-020-00762-2. [DOI] [PMC free article] [PubMed] [Google Scholar]
- 86.Paffenholz S.V., Salvagno C., Ho Y.J., Limjoco M., Baslan T., Tian S., Kulick A., de Stanchina E., Wilkinson J.E., Barriga F.M., et al. Senescence induction dictates response to chemo- and immunotherapy in preclinical models of ovarian cancer. Proc. Natl. Acad. Sci. USA. 2022;119 doi: 10.1073/pnas.2117754119. [DOI] [PMC free article] [PubMed] [Google Scholar]
- 87.Fischer D.S., Fiedler A.K., Kernfeld E.M., Genga R.M.J., Bastidas-Ponce A., Bakhti M., Lickert H., Hasenauer J., Maehr R., Theis F.J. Inferring population dynamics from single-cell RNA-sequencing time series data. Nat. Biotechnol. 2019;37:461–468. doi: 10.1038/s41587-019-0088-0. [DOI] [PMC free article] [PubMed] [Google Scholar]
- 88.Davis C.A., Hitz B.C., Sloan C.A., Chan E.T., Davidson J.M., Gabdank I., Hilton J.A., Jain K., Baymuradov U.K., Narayanan A.K., et al. The Encyclopedia of DNA elements (ENCODE): data portal update. Nucleic Acids Res. 2018;46:D794–D801. doi: 10.1093/nar/gkx1081. [DOI] [PMC free article] [PubMed] [Google Scholar]
- 89.Brown J.P., Wei W., Sedivy J.M. Bypass of senescence after disruption of p21CIP1/WAF1 gene in normal diploid human fibroblasts. Science. 1997;277:831–834. doi: 10.1126/science.277.5327.831. [DOI] [PubMed] [Google Scholar]
- 90.Morgenstern J.P., Land H. Advanced mammalian gene transfer: high titre retroviral vectors with multiple drug selection markers and a complementary helper-free packaging cell line. Nucleic Acids Res. 1990;18:3587–3596. doi: 10.1093/nar/18.12.3587. [DOI] [PMC free article] [PubMed] [Google Scholar]
- 91.Counter C.M., Hahn W.C., Wei W., Caddle S.D., Beijersbergen R.L., Lansdorp P.M., Sedivy J.M., Weinberg R.A. Dissociation among in vitro telomerase activity, telomere maintenance, and cellular immortalization. Proc. Natl. Acad. Sci. USA. 1998;95:14723–14728. doi: 10.1073/pnas.95.25.14723. [DOI] [PMC free article] [PubMed] [Google Scholar]
- 92.Young A.R.J., Narita M., Ferreira M., Kirschner K., Sadaie M., Darot J.F.J., Tavaré S., Arakawa S., Shimizu S., Watt F.M., Narita M. Autophagy mediates the mitotic senescence transition. Genes Dev. 2009;23:798–803. doi: 10.1101/gad.519709. [DOI] [PMC free article] [PubMed] [Google Scholar]
- 93.Carvalho B.S., Irizarry R.A. A framework for oligonucleotide microarray preprocessing. Bioinformatics. 2010;26:2363–2367. doi: 10.1093/bioinformatics/btq431. [DOI] [PMC free article] [PubMed] [Google Scholar]
- 94.Ritchie M.E., Phipson B., Wu D., Hu Y., Law C.W., Shi W., Smyth G.K. Limma powers differential expression analyses for RNA-sequencing and microarray studies. Nucleic Acids Res. 2015;43:e47. doi: 10.1093/nar/gkv007. [DOI] [PMC free article] [PubMed] [Google Scholar]
- 95.Langfelder P., Horvath S. WGCNA: an R package for weighted correlation network analysis. BMC Bioinf. 2008;9:559. doi: 10.1186/1471-2105-9-559. [DOI] [PMC free article] [PubMed] [Google Scholar]
- 96.Li H., Handsaker B., Wysoker A., Fennell T., Ruan J., Homer N., Marth G., Abecasis G., Durbin R., 1000 Genome Project Data Processing Subgroup The sequence alignment/map format and SAMtools. Bioinformatics. 2009;25:2078–2079. doi: 10.1093/bioinformatics/btp352. [DOI] [PMC free article] [PubMed] [Google Scholar]
- 97.Langmead B., Salzberg S.L. Fast gapped-read alignment with Bowtie 2. Nat. Methods. 2012;9:357–359. doi: 10.1038/nmeth.1923. [DOI] [PMC free article] [PubMed] [Google Scholar]
- 98.Liu T. Use model-based Analysis of ChIP-Seq (MACS) to analyze short reads generated by sequencing protein-DNA interactions in embryonic stem cells. Methods Mol. Biol. 2014;1150:81–95. doi: 10.1007/978-1-4939-0512-6_4. [DOI] [PubMed] [Google Scholar]
- 99.Love M.I., Huber W., Anders S. Moderated estimation of fold change and dispersion for RNA-seq data with DESeq2. Genome Biol. 2014;15:550. doi: 10.1186/s13059-014-0550-8. [DOI] [PMC free article] [PubMed] [Google Scholar]
- 100.Hanna C.W., Taudt A., Huang J., Gahurova L., Kranz A., Andrews S., Dean W., Stewart A.F., Colomé-Tatché M., Kelsey G. MLL2 conveys transcription-independent H3K4 trimethylation in oocytes. Nat. Struct. Mol. Biol. 2018;25:73–82. doi: 10.1038/s41594-017-0013-5. [DOI] [PubMed] [Google Scholar]
- 101.Lê S., Josse J., Husson F. FactoMineR: an R package for multivariate analysis. J. Stat. Softw. 2008;25:1–18. doi: 10.18637/jss.v025.i01. [DOI] [Google Scholar]
- 102.Yu G., Wang L.G., He Q.Y. ChIPseeker: an R/Bioconductor package for ChIP peak annotation, comparison and visualization. Bioinformatics. 2015;31:2382–2383. doi: 10.1093/bioinformatics/btv145. [DOI] [PubMed] [Google Scholar]
- 103.Ramírez F., Ryan D.P., Grüning B., Bhardwaj V., Kilpert F., Richter A.S., Heyne S., Dündar F., Manke T. deepTools2: a next generation web server for deep-sequencing data analysis. Nucleic Acids Res. 2016;44:W160–W165. doi: 10.1093/nar/gkw257. [DOI] [PMC free article] [PubMed] [Google Scholar]
- 104.Tan G., Lenhard B. TFBSTools: an R/bioconductor package for transcription factor binding site analysis. Bioinformatics. 2016;32:1555–1556. doi: 10.1093/bioinformatics/btw024. [DOI] [PMC free article] [PubMed] [Google Scholar]
- 105.Gustavsen J.A., Pai S., Isserlin R., Demchak B., Pico A.R. RCy3: network biology using Cytoscape from within. F1000Res. 2019;8:1774. doi: 10.12688/f1000research.20887.3. [DOI] [PMC free article] [PubMed] [Google Scholar]
- 106.Ono K., Muetze T., Kolishovski G., Shannon P., Demchak B. CyREST: turbocharging Cytoscape access for external tools via a RESTful API. F1000Res. 2015;4:478. doi: 10.12688/f1000research.6767.1. [DOI] [PMC free article] [PubMed] [Google Scholar]
- 107.Quinlan A.R., Hall I.M. BEDTools: a flexible suite of utilities for comparing genomic features. Bioinformatics. 2010;26:841–842. doi: 10.1093/bioinformatics/btq033. [DOI] [PMC free article] [PubMed] [Google Scholar]
- 108.Neph S., Kuehn M.S., Reynolds A.P., Haugen E., Thurman R.E., Johnson A.K., Rynes E., Maurano M.T., Vierstra J., Thomas S., et al. BEDOPS: high-performance genomic feature operations. Bioinformatics. 2012;28:1919–1920. doi: 10.1093/bioinformatics/bts277. [DOI] [PMC free article] [PubMed] [Google Scholar]
- 109.Qin H., Zhao A.D., Sun M.L., Ma K., Fu X.B. Direct conversion of human fibroblasts into dopaminergic neuron-like cells using small molecules and protein factors. Mil. Med. Res. 2020;7:52. doi: 10.1186/s40779-020-00284-2. [DOI] [PMC free article] [PubMed] [Google Scholar]
- 110.Liberzon A., Birger C., Thorvaldsdóttir H., Ghandi M., Mesirov J.P., Tamayo P. The Molecular Signatures Database (MSigDB) hallmark gene set collection. Cell Syst. 2015;1:417–425. doi: 10.1016/j.cels.2015.12.004. [DOI] [PMC free article] [PubMed] [Google Scholar]
- 111.Kanehisa M., Furumichi M., Tanabe M., Sato Y., Morishima K. KEGG: new perspectives on genomes, pathways, diseases and drugs. Nucleic Acids Res. 2017;45:D353–D361. doi: 10.1093/nar/gkw1092. [DOI] [PMC free article] [PubMed] [Google Scholar]
- 112.Landt S.G., Marinov G.K., Kundaje A., Kheradpour P., Pauli F., Batzoglou S., Bernstein B.E., Bickel P., Brown J.B., Cayting P., et al. ChIP-seq guidelines and practices of the ENCODE and modENCODE consortia. Genome Res. 2012;22:1813–1831. doi: 10.1101/gr.136184.111. [DOI] [PMC free article] [PubMed] [Google Scholar]
- 113.Fornes O., Castro-Mondragon J.A., Khan A., van der Lee R., Zhang X., Richmond P.A., Modi B.P., Correard S., Gheorghe M., Baranašić D., et al. Jaspar 2020: update of the open-access database of transcription factor binding profiles. Nucleic Acids Res. 2020;48:D87–D92. doi: 10.1093/nar/gkz1001. [DOI] [PMC free article] [PubMed] [Google Scholar]
- 114.Goldman M.J., Craft B., Hastie M., Repečka K., McDade F., Kamath A., Banerjee A., Luo Y., Rogers D., Brooks A.N., et al. Visualizing and interpreting cancer genomics data via the Xena platform. Nat. Biotechnol. 2020;38:675–678. doi: 10.1038/s41587-020-0546-8. [DOI] [PMC free article] [PubMed] [Google Scholar]
- 115.Subramanian A., Tamayo P., Mootha V.K., Mukherjee S., Ebert B.L., Gillette M.A., Paulovich A., Pomeroy S.L., Golub T.R., Lander E.S., Mesirov J.P. Gene set enrichment analysis: a knowledge-based approach for interpreting genome-wide expression profiles. Proc. Natl. Acad. Sci. USA. 2005;102:15545–15550. doi: 10.1073/pnas.0506580102. [DOI] [PMC free article] [PubMed] [Google Scholar]
Associated Data
This section collects any data citations, data availability statements, or supplementary materials included in this article.
Supplementary Materials
This table contains the source data and associated statistical analyses for Figure S1A (population doublings), Figure S1B (telomerase activity), Figure S1C (ER-qPCR), Figures S1D–S1H (colony formation), Figure S1K (population doublings long time course), Figure S1L (TIF quantification), Figures S1O and S1S (EdU incorporation), and Figures S1P–S1R (population doublings WI38, LF1, GM21ERRAS); related to STAR Methods sections “EdU incorporation and population doublings,” “real-time quantitative polymerase chain reaction,” “telomerase activity,” and “colony formation assay.”
This table contains normalized and annotated microarray fluorescence intensity data used to generate Figures 1B–1I and S2. Additional tabs contain gene expression modules (Figures 1E, 1F, and S2F), self-organizing map-associated D clusters (Figures 2C and 2D), differentially expressed genes in OIS escape cells (Figure S2E), and the list of predicted secreted genes (Figure 2I); related to Figures 1 and S2.
This table contains the global K4me1, K27ac, and ATAC peak sets; chromatin states per time point; and differential chromatin states used to generate Figures 2A–2E and S3; related to Figures 2 and S3.
This table contains normalized TF expression data used to generate Figure S4A, differential binding activity used to generate Figure 3A, and co-binding matrices used to generate Figures 3B, 3C, S4B, and S4C; related to Figures 3 and S4.
This table contains data used to generate TF networks at WGCNA gene modules described in Figure 1; related to Figure 4.
This table contains data used to generate TF networks dynamics at opening and closing enhancers at day 0 (EV-transduced cells); related to STAR Methods section “TF networks.”
This table contains data used to generate TF networks dynamics at opening and closing enhancers at day 8 after RAS overexpression; related to STAR Methods section “TF networks.”
This table contains data used to generate TF networks dynamics at opening and closing enhancers at day 14 after RAS overexpression; related to STAR Methods section “TF networks.”
This table contains data used to generate TF networks dynamics at opening and closing enhancers at day 23 after RAS overexpression; related to STAR Methods section “TF networks.”
This table contains data used to generate TF networks dynamics at opening and closing enhancers at day 32 after RAS overexpression; related to STAR Methods section “TF networks.”
This table contains the microarray counts for POU2F2 gene targets (Figures 5C and 5D), population doublings of POU2F2 KD cells (Figures 5F, S6L, and S6K), EdU incorporation of POU2F2 KD cells (Figure 5G), POU2F2 target genes and their pathway analysis (Figures 5J–5M), CDKN2A RNA-seq reads in POU2F2 KD cells (Figure 5N), and P16 densitometry analyses (Figures 5O and S6Q); related to Figures 5 and S6.
This table contains the normalized RNA-seq POU2F2 reads and the overall survival information of CRC TCGA-COAGREAD samples (Figure 6A), POU2F2 gene targets in CRC and their pathway analysis (Figures 6C, 6D, and S7A), and the POU2F2 escape gene signature and its pathway analysis (Figure S7C); related to Figures 6 and S7.
This table contains chromatin accessibility coordinates and signal values (Figure 7A), emission matrix for SACS identification (Figures 7B and 7C), SACS coordinates and their chromatin state transitions (Figures 7D and 7E), chromatin accessibility and gene expression linkage (Figure S9B), chromatin accessibility modules in CRC and normal colon (Figure S9I), SACS coordinates in CRC (Figure S9K), and SACS gene targets in CRC used for GSEA (Figures 7K–7M); related to Figures 7 and S9.
This table contains the WGCNA modules of DEGs identified in public CRC and normal colon transcriptomes; related to STAR Methods sections “prognostic evaluation of SACS and POU2F2 gene signatures” and “GSEA.”
This table contains the WGCNA modules od DEGs of public CRC progression datasets from GEO20916; related to STAR Methods sections “prognostic evaluation of SACS and POU2F2 gene signatures” and “GSEA.”
Data Availability Statement
-
•
Microarray and high-throughput sequencing data have been deposited at the Gene Expression Omnibus and Sequence Read Archive databases and are publicly available as of the date of publication. Accession numbers are listed in the key resources table.
-
•
This paper analyzes existing, publicly available data. These accession numbers for the datasets are listed in the key resources table.
-
•
All code is available at Mendeley: (https://data.mendeley.com/datasets/92869mbc4n/draft?a=5968a459-a783-46ff-bfbf-95e3bfec4908).
-
•
Any additional information required to reanalyze the data reported in this paper is available from the lead contact upon request.
-
•
All code used to preprocess and analyze data and generate all figures in this manuscript can be found in the supplemental information.