

Abstract
Background
Identifying lymph node metastasis (LNM) relies mainly on indirect radiology. Current studies omitted the quantified associations with traits beyond cancer types, failing to provide generalisation performance across various tumour types.
Methods
4400 whole slide images across 11 cancer types were collected for training, cross-verification, and external validation of the pan-cancer lymph node metastasis (PC-LNM) model. We proposed an attention-based weakly supervised neural network based on self-supervised cancer-invariant features for the prediction task.
Results
PC-LNM achieved a test area under the curve (AUC) of 0.732 (95% confidence interval: 0.717–0.746, P < 0.0001) in fivefold cross-validation of multiple cancer types, which also demonstrated good generalisation in the external validation cohort with AUC of 0.699 (95% confidence interval: 0.658–0.737, P < 0.0001). The interpretability results derived from PC-LNM revealed that the regions with the highest attention scores identified by the model generally correspond to tumours with poorly differentiated morphologies. PC-LNM achieved superior performance over previously reported methods and could also act as an independent prognostic factor for patients across multiple tumour types.
Discussion
We presented an automated pan-cancer model for predicting the LNM status from primary tumour histology, which could act as a novel prognostic marker across multiple cancer types.
Subject terms: Tumour biomarkers, Prognostic markers
Background
As the secondary cause of death in America, cancer remains an important public health issue worldwide. Overing the past 27 years, cancer mortality rate has declined by about 31%; nevertheless, there are still more than 608,000 cancer-related deaths estimated to occur in the United States in 2022 [1]. Among all risk factors associated with cancer death, lymph node metastasis (LNM) is a crucial issue among patients with malignant tumours, which plays an important role in patient treatment and prognosis. Patients with LNM have a significantly higher risk of tumour recurrence and distant metastasis after surgical resection of the primary tumour. Therefore, the identification of the presence of LNM is essential for pathologic tumour staging and clinical decision-making [2].
Radiological observation is currently the most common method for the preliminary evaluation of LNM, but the diagnostic accuracy is restrained by its indirect imaging and low resolution. Pathological evaluation on the surgically resected lymph node is supposed to be the golden criterion for LNM identification [3]. However, the successful identification of LNM mainly relies on the surgically resected lymph node, which depends mostly on the surgical experience of the surgeons. In addition, manual screening of LNM by pathologists on tissue sections is time-consuming and tedious, which might restrict the efficiency, reproducibility, and accuracy of the workflow [4]. Besides, transcriptomics with high-throughput sequencing has also been proposed to predict LNM [5–7], but its routine application is restricted by its high cost.
Computational histopathology based on deep learning is currently revolutionising the workflow of histopathology, which is based on the analysis of haematoxylin–eosin (H&E)-stained tissue slides [8, 9]. Application of deep learning has illustrated perfect performance in several medical tasks, including tumour segmentation [10], subtyping [11], mutation prediction [12], and microsatellite instability prediction [13], some of which could not be recognised from H&E-stained images by experienced pathologists. Recently, a weakly supervised deep-learning strategy was reported to predict the origin of unknown cancers based on primary H&E-stained images with a multiple-instance learning strategy [14]. Some studies also presented the use of deep learning in the prediction of LNM based on resected lymph node images [15–17]. However, current studies omitted the quantified associations with traits beyond cancer types, failing to provide the required generalisation performance across various tumour types.
In this study, we presented an automated pan-cancer lymph node metastasis (PC-LNM) analysis from H&E-stained histologic slides of primary cancer by applying a deep-learning algorithm. To the best of our knowledge, this is the first study to predict LNM from primary histologic slides across various tumour types, providing constructional suggestions for quick identification of patients with LNM and high risk of poor prognosis.
Methods
Data sources
In this study, we retrieved two pan-cancer cohorts with multiple cancer types from the Cancer Genome Atlas (TCGA, https://portal.gdc.cancer.gov/) and the Clinical Proteomic Tumour Analysis Consortium (CPTAC, https://www.cancerimagingarchive.net/) through Cancer Imaging Archive [18–20]. All included samples should have a definite pathological diagnosis of a single malignant tumour, with complete clinicopathological information and access to H&E-strained whole slide image (WSI) based on paraffin sections. Only scanned slides with analysable images with a magnification of 10× were included in the analysis, without sex restrictions.
The TCGA cohort contained 3848 WSIs from 11 of the most common solid tumour types: colon adenocarcinoma (COAD, 429 samples), oesophageal carcinoma (ESCA, 139 samples), kidney renal clear cell carcinoma (KIRC, 248 samples), kidney renal papillary cell carcinoma (KIRP, 76 samples), liver hepatocellular carcinoma (LIHC, 259 samples), breast invasive carcinoma (BRCA, 1075 samples), lung adenocarcinoma (LUAD, 508 samples), rectum adenocarcinoma (READ, 155 samples), stomach adenocarcinoma (STAD, 391 samples), testicular germ cell tumour (TGCT, 101 samples) and thyroid carcinoma (THCA, 467 samples). Fivefold cross-validation was conducted in the TCGA cohort for the training and internal cross-validation of the PC-LNM.
The CPTAC cohort contained 552 WSIs from four different types of malignant tumours, including COAD (140 samples), KIRC (122 samples), BRCA (114 samples) and LUAD (176 samples), which was further used for the external validation of the PC-LNM. The basic clinical information of the included samples is shown in Supplementary Table S1.
Image processing
The original slide images were segmented to remove non-tissue regions through Otsu’s method. Due to the gigapixel scale of a slide image, it was difficult to directly input a WSI into a deep neural network. Therefore, we first divided the WSIs into tiles of non-overlap 224 × 224 pixels within the foreground regions at ×10 magnification level. A contrastive self-supervised method [21] was further applied to extract universal and robust image features from digital histopathology, which helped to preserve the integrated information from raw pixels and describe tissue microenvironments of patches. Based on the pretrained Swin Transformer [22], the 768-dimensional feature vector was acquired from each cropped patch for training models.
The feature extraction method is based on our previous report method [23]. In specific, we collected the largest histopathological image dataset, which contained about 15 million unlabelled patches cropped from WSIs in TCGA and PAIP. After removing background regions, we crop these WSIs into non-overlapping patches of 1024 × 1024. After preprocessing, we obtain a TCGA pretraining dataset with 14,325,848 unlabelled histopathological patches. With this large-scale image, we use a semantically relevant contrastive learning (SRCL) with a hybrid backbone (CTransPath) to train a feature extractor. The input patch and its two data augmentations can be regarded as three different views of an input, which are first encoded into corresponding feature vectors using three network branches. In the pseudo-positive mining process, given a query vector from the current input, semantically relevant patches are retrieved from the memory bank based on the cosine similarity metric, which are then adopted as additional pseudo-positives for the SRCL calculation. The CTransPath backbone adopts the Swin Transformer for its multi-scale feature extraction capacity, whereas the patch partitioning part is replaced with a CNN-based nonlinear mapper to improve the stability of network training and facilitate better local feature extraction.
Deep learning on histopathological images
Our computational approach, PC-LNM, capture informative representations from the 768-dimensional features through attention-based aggregation to extract spatial context from the local morphology. After image preprocessing, we obtain thousands of image patches for each WSI. Formally, each image patch is called an instance and each WSI is called a bag. The classification of WSI is therefore a multiple-instance learning problem. Let be a bag (namely a WSI) of K instances (namely image patches), then an attention-based aggregation means sum over all instances in a bag to get a global feature for classification:
where αk is the attention score of the instance hk, and
where w and V are learnable parameters implemented by stacking fully connected layers. tanh () is hyperbolic tangent activation function
With the aggregated global WSI feature z, we can further incorporate the categorical labels of the WSI because this clinical information provides unique information for different cancer types. This consideration is in line with the intuition that, even for the same visual features from WSI, they could probably represent distinct statuses of lymph metastasis for different cancer types. Thus, we design categorial embeddings of cancer type to concatenate with the aggregated WSI feature for final classification prediction. Technically, we define 11 embeddings for 11 cancer types in our study, and the embeddings can be jointly trained along with other network parameters.
where σ is a linear classifier; cat() is a concatenation operation; htype is the categorial embedding of the corresponding cancer type; dim = −1 means two vectors are concatenated on the last dimension. Then, the fused features are fed into a classifier to calculate the cross-entropy loss. The analysis pipeline and neural network architecture of this study is illustrated in Fig. 1.
Fig. 1. The analysis pipeline and the neural network architecture of this study.

Our computational approach captures informative representations from the 768-dimensional features through attention-based aggregation to extract spatial context from the local morphology. Then, an attention-based aggregation means sum over all instances in a bag to get a global feature for classification, and the fused features are fed into a classifier to calculate the cross-entropy loss.
Model training and hyperparameter optimisation
The parameters update of the pan-caner network can be noisy because we only obtain slide-level labels for WSIs with weak supervision. We hypothesize that such instability is caused by the rapid changing of the attention network, considering that several cancer types are involved in the same training batch. In this study, we carried out a self-ensemble model training strategy to stabilise the training process. In concrete, given the parameters θ of the training network, we define an exponential moving average version θEMA of the model, which is saved to establish ensemble learning to form a solid consensus of the self-ensemble predictions. We formulate this technique as:
where is a momentum coefficient. In experiments, we set a large momentum m = 0.99 to slowly reduce the optimised parameter fluctuation noise.
We use Adam as our optimiser and a cosine learning rate scheduler with a peak learning rate of 1e-3. We warm up the model for 10 epochs and train the model for 100 epochs in total with a mini-batch size of 1. The loss function is the commonly used cross-entropy loss for binary classification. As suggested, there are three stages in training the proposed model. The first stage is to train a self-supervised learning feature extractor. It takes 250 h to converge using 48 Nvidia V100 GPUs. The second stage is to preprocess the WSIs into image patches and the using the feature extractor to get 768-dimensional vectors. This stage takes around 5 min per WSI, depending on the resolution of WSI. With the 768-dimensional vectors, we train a pan-cancer MIL model for classification with around 30 min to train. The last two stages are run on an NVIDIA V100 GPU.
Statistical analysis
In this study, evaluations of the prediction models were performed by means of receiver operating characteristic curve (ROC) analysis with the area under the curve (AUC) value. Comparations between different AUCs were performed through a nonparametric approach reported by DeLong et al. [24]. Kaplan–Meier (KM) curve analysis with the hazard ratio (HR) and 95% confidence interval (CI) was carried out to compare different survival outcomes through the log-rank test, including overall survival (OS) and disease-free survival (DFS). In addition, the univariate and multivariate Cox regression analysis were also implemented to identify independent prognostic factors across multiple cancer types, and P value less than 0.05 was regarded as significant.
Results
Overall performance of the PC-LNM
A total of 3848 WSIs from 11 different types of cancer in the TCGA cohort were included for the training and internal cross-validation of our PC-LNM. The ROC curve illustrated the classification ability of the PC-LNM based on the deleted positive area, which reached a test AUC of 0.732 (95% CI: 0.717–0.746, P < 0.0001, Fig. 2a) in fivefold cross-validation of multiple cancer types. When the cut-off value was set as 0.4257, our PC-LNM achieved the best general performance with a sensitivity and specificity of 0.734 (95% CI: 0.712–0.754) and 0.612 (95% CI: 0.591–0.633), respectively. The breakdown of the results by cancer type and additional measurements are shown in Supplementary Table S2.
Fig. 2. The overall performance of the PC-LNM.
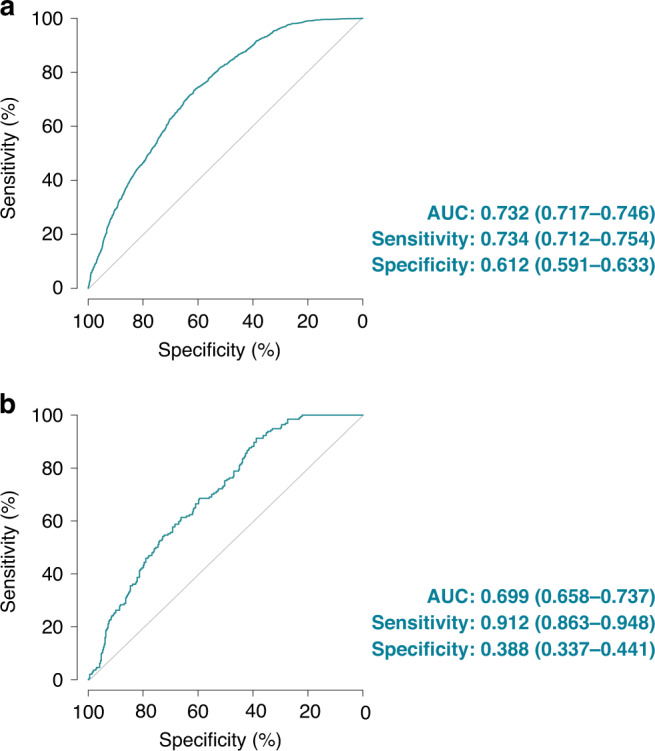
a Receiver operating characteristic curve analysis evaluated the performance of the PC-LNM in the cross-validation cohort. b Receiver operating characteristic curve analysis evaluated the performance of the PC-LNM in the external validation cohort. PC-LNM pan-cancer lymph node metastasis, AUC area under curve, CI confidence interval.
Model interpretability
Interpretability of the deep learning-based pathological model with human-readable morphology might help to understand the working mechanisms under the deep neural networks and facilitate the application in clinical practice. We further explored the potential interpretability of our PC-LNM through patch-level whole slide heatmaps. As shown in Fig. 3, visualisations of the detected areas demonstrated markedly different phenotypes between WSIs with positive-LNM and negative-LNM. The most attended regions recognised by PC-LNM were shown with red colour and considered to be associated with a high risk of lymphatic metastasis, which generally corresponds with poorly differentiated morphology, pathological mitosis and singular nucleus. The patch-level visualisation by our model also presented the spatial heterogeneity within tumour samples.
Fig. 3. Interpretability of the deep learning-based pathological model.

WSI whole slide image, ROI region of interest, TMB tumour mutational burden, TMB-H TMB-high, TMB-L TMB-low.
Validation on the external cohort
Due to the data-specific variable of the internal patient cohort, the performance of the prediction models might be influenced by different protocols for tissue processing and slide preparation, which arouse the importance of validating the models in external data sets [11]. Therefore, we included an external CPTAC cohort (four cancer types, n = 552), which was not involved in the training and validation process, to evaluate the generalisation performance of our PC-LNM. As shown in Fig. 2b, the PC-LNM also exhibited good generalisation in the external validation cohort with an AUC of 0.699 (95% CI: 0.658–0.737, P < 0.0001). The breakdown of the results by cancer type and additional measurements are shown in Supplementary Table S3. A moderate drop in accuracy was found in the external validation, which might result from the potential batch effect and the limited sample size of the validation cohort.
Comparison with the state-of-the-art methods
Recently, some novel algorithms focusing on weakly supervised deep learning have also been proposed to accomplish classification using slide-level labels, including the TransMIL [25] and the clustering-constrained-attention multiple-instance learning framework (CLAM) [11], which is characterised by high-throughput and data-efficient. We next perform comparison analyses to explore whether our PC-LNM outperformed other state-of-the-art methods in the task of LNM status prediction across multiple cancer types. For each method, the training and internal cross-validation were carried out based on the same fivefold samples. Comparisons between different AUCs were performed through a nonparametric approach reported by DeLong et al. [24]. We observed that our PC-LNM achieved superior performance over previously reported methods by significant margins, with improvements in AUC from 2.4 to 3.5% in the internal cross-validation cohort (Table 1). In addition, improvement in mean AUCs by 3.6–4.2% was also observed in the external validation cohort through the PC-LNM, which further confirmed the advantage of our novel algorithm in the task of accessing the LNM status from primary pan-cancer slides.
Table 1.
Comparison for the performance of PC-LNM and other state-of-the-art methods for predicting lymphatic metastasis across multiple cancer types.
| Area under curve | 95% confidence interval | P value | |
|---|---|---|---|
| TCGA cohort | |||
| PC-LNM | 0.732 | 0.717–0.746 | / |
| CLAM-MB | 0.708 | 0.693–0.722 | 0.0015 |
| CLAM-SB | 0.697 | 0.682–0.712 | <0.0001 |
| TransMIL | 0.699 | 0.684–0.713 | <0.0001 |
| CPTAC cohort | |||
| PC-LNM | 0.699 | 0.658–0.737 | / |
| CLAM-MB | 0.657 | 0.616–0.696 | 0.011 |
| CLAM-SB | 0.663 | 0.622–0.702 | 0.030 |
| TransMIL | 0.660 | 0.619–0.699 | 0.022 |
PC-LNM pan-cancer lymph node metastasis, CLAM-MB multi-branch CLAM model, CLAM-SB single-attention-branch CLAM model.
Comparison with the pathologists only based on primary cancer slides
In order to further confirm the superiority of our PC-LNM in clinical practices, we launched a comparison for accessing the status of LNM from primary cancer slides between the PC-LNM and three experienced pathologists. Based on the 552 WSIs from the CPTAC cohort with slide-level labels, our PC-LNM delivered significantly improved performance, which prevailed over the pathologists by 16.2%, 18.2% and 18.6% in average test AUC. The improvements are 7.40%, 7.23% and 2.24% in terms of accuracy (Table 2).
Table 2.
Comparison of the PC-LNM with three pathologists only based on primary cancer slides.
| AUC | 95% confidence interval | P value | Accuracy | |
|---|---|---|---|---|
| PC-LNM | 0.699 | 0.658–0.737 | 54.39% | |
| Pathologist 1 | 0.537 | 0.494–0.579 | <0.001 | 46.99% |
| Pathologist 2 | 0.517 | 0.475–0.560 | <0.001 | 47.16% |
| Pathologist 3 | 0.513 | 0.470–0.555 | <0.001 | 52.15% |
PC-LNM pan-cancer lymph node metastasis, AUC area under the curve.
Comparison with current clinical features
The clinical decisions are made not only based on the histology data but also on clinical features. Therefore, we performed a further analysis based on some important clinical features, including cancer types, primary tumour stage, patient age and sex. As shown in Supplementary Table S4, our PC-LNM exhibited better performance than cancer types (AUC: 0.732 vs. 0.670, P < 0.0001), primary tumour stage (AUC: 0.732 vs. 0.653, P < 0.0001), patient age (AUC: 0.732 vs. 0.532, P < 0.0001), and sex (AUC: 0.732 vs. 0.530, P < 0.0001). In addition, our further results indicated that the combination of PC-LNM and clinicopathologic features could achieve better performance in predicting the status of lymphatic metastasis (Supplementary Tables S4 and S5).
Prognosis prediction through PC-LNM
The significance of LNM in cancer progression and prognosis has been widely recognised [2]. Accurate assessment of LNM is one of the key elements in determining to adjust treatments, guiding clinical follow-up, and predicting survival outcomes. In order to facilitate the clinical use of our PC-LNM in clinical practice, we categorised patients as PC-LNM ( + ) if their PC-LNM values over the best filter (0.4257), otherwise as PC-LNM (−). Only tumours with analysable mortality were included in the survival analysis, including COAD, ESCA, KIRC, KIRP, LIHC, LUAD, READ and STAD. KM curve analyses revealed that patients with PC-LNM ( + ) seemed to have worse OS outcomes when compared with patients with PC-LNM (−), with HR of 1.49 (95% CI: 1.28–1.73, P < 0.0001) in the TCGA cohort (Fig. 4a). As shown in Fig. 4b, results on the external CPTAC cohort also confirmed that patients with different PC-LNM statuses had distinct prognoses during the follow-up, with HR of 2.84 (95% CI: 1.22–6.62, P = 0.015), illustrating that our PC-LNM had a promising risk-stratification performance for patients with solid tumours.
Fig. 4. Prognosis prediction through the PC-LNM.
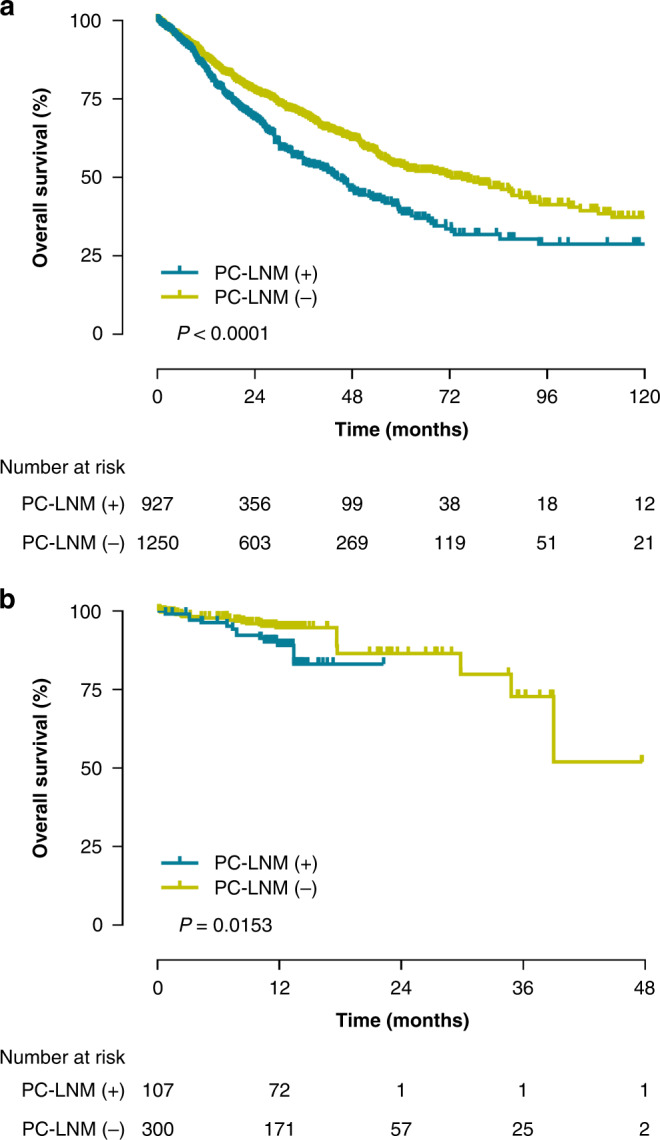
a Kaplan–Meier survival analysis stratified by PC-LNM for overall survival in the TCGA cohort. b Kaplan–Meier survival analysis stratified by PC-LNM for overall survival in the CPTAC cohort. PC-LNM pan-cancer lymph node metastasis, HR hazard ratio, CI confidence interval TCGA The Cancer Genome Atlas, CPTAC Clinical Proteomic Tumour Analysis Consortium.
We further performed univariate and multivariate Cox regression analysis to identify whether PC-LNM could act as an independent prognostic factor across multiple cancer types. As shown in Table 3, univariate Cox regression analysis first recognised PC-LNM, patient age, and tumour stage as prognostic factors for OS in the TCGA cohort, which were subsequently incorporated into multivariate Cox regression analysis. Our result revealed that only PC-LNM and tumour stage could act as prognostic factors for OS in the TCGA cohort. Similar results were found when identifying the independent prognostic factors for DFS in the TCGA cohort. Results on an external CPTAC cohort further confirmed that our PC-LNM was an independent prognostic factor for multiple malignant tumours.
Table 3.
Univariate and multivariate Cox regression analysis identifying PC-LNM as an independent prognostic factor across multiple cancer types.
| Univariate Cox regression analysis | Multivariate Cox regression analysis | |||||
|---|---|---|---|---|---|---|
| HR | 95% CI | P value | HR | 95% CI | P value | |
| TCGA cohort (OS) | ||||||
| PC-LNM | 2.7 | 2.03–3.59 | <0.001 | 1.68 | 1.24–2.26 | 0.001 |
| Sex | 1.07 | 0.93–1.24 | 0.356 | / | / | / |
| Age | 1.01 | 1.00–1.02 | 0.0006 | 1.01 | 1.01–1.02 | <0.001 |
| Stage | 1.66 | 1.55–1.79 | <0.001 | 1.64 | 1.51–1.77 | <0.001 |
| CPTAC cohort (OS) | ||||||
| PC-LNM | 74.14 | 7.96–690.25 | <0.001 | 29.80 | 1.14–780.87 | 0.042 |
| Sex | 0.42 | 0.19–0.92 | 0.030 | 0.56 | 0.25–1.28 | 0.170 |
| Age | 1.03 | 0.98–1.09 | 0.230 | / | / | / |
| Stage | 2.32 | 1.41–3.81 | 0.001 | 2.49 | 1.47–4.23 | 0.001 |
PC-LNM pan-cancer lymph node metastasis, HR hazard ratio, CI confidence interval, TCGA The Cancer Genome Atlas, CPTAC Clinical Proteomic Tumour Analysis Consortium, OS overall survival.
Discussion
The cancer-invaded lymph node is significantly associated with poor clinical outcomes due to the increased risk of tumour recurrence and distant metastasis [26–28]. Clinically, patients with rectal cancer and breast cancer with LNM are recommended to receive adjuvant therapy after surgery in order to prevent tumour progression [29, 30]. The pathological diagnosis of LNM can only be made when the cancer-invaded lymph nodes are found and resected, thus resulting in the missed diagnosis for patients with inconspicuous lymph nodes. In addition, some tumour cells may have invaded outside the primary tumour but have not spread into the lymph nodes, which is likely to be ignored during the traditional histopathological workup [31].
Thanks to the outbreak of deep-learning algorithms in computational histopathology, computer vision exhibits high potential to enhance the traditional histopathology processes [9, 11]. Based on a gigapixel WSI, deep-learning analysis of the primary tumour is supposed to capture subtle differences in imaging features, which are relevant to the presence of LNM [32]. Based on convolutional neural networks, a deep-learning approach was proposed to predict sentinel lymph node status directly from WSI of primary melanoma tumours, with an AUC of about 61.8% among unmatched cases [31]. While in colon cancer, an AUC of 0.677 was also identified in the prediction of LNM from primary histopathology tumour images via using a deep convolutional neural network [33]. In another study, a multiple-instance learning method based on deep graph convolutional network was also proposed for histopathological image classification [34]. The model achieved an accuracy of 0.6761 in predicting the LNM of colorectal cancer. However, computational feature representation could find similar images and quantify associations with traits beyond tissue types. Therefore, better implementation of LNM-positive prediction in clinical practice might require generalisation performance across various tumour types.
In this study, we presented PC-LNM to predict LNM based on histopathology images from primary pan-cancer. To our knowledge, this is the first study to propose a state-of-the-art prediction of LNM from H&E-stained pathological images across various tumour types, which provides constructional suggestions for quick identification of patients with LNM and a high risk of poor prognosis. Taking about 4 min to scan the H&E-strained slide and automatically analyse WSI through our deep-learning pipeline, the pathologist can evaluate whether the patient is LNM-positive as soon as he makes the primary pathologic diagnosis. Furthermore, the prediction of LNM was appropriate for multiple types of cancer, which was not limited by a specific single cancer type as other studies reported [15–17]. Our results also revealed that our deep learning-based model performed particularly well in renal cell carcinoma, with an AUC of 0.794, a sensitivity of 0.667, and a NPV of 0.94, even though renal cell carcinoma did not have the largest training sample size. The possible reason might be that renal cell carcinoma could gradually spread to adjacent tissues and infiltrate the surrounding lymphatic vessels, which could be more easily recognised by deep neural network and act as effective prediction basis. A successful application of this approach in even one type of cancer might make this study significantly meaningful.
A weakly supervised deep-learning strategy was carried out for our prediction pipeline. Unlike the task of tumour segmentation which could be manually annotated, only slide-level labels for LNM-positive or LNM-negative were accessed for our study. It is also impossible to annotate the regions with LNM-positive for supervised learning. Limited data without annotation has boosted the critical need for data-efficient strategy through weakly supervised learning [11]. A higher resolution might capture local cellular information but hindered access to global tissue microenvironment information. Inversely, operating at a lower resolution might limit the resolvability of cells and access to cellular properties. In this study, we aggregated patient-level predictions from a magnification of 10× to make an appropriate scale for classification. In addition, unlike previous studies without interpretability [35], we provided interpretable visualisations to demonstrate the attention associated with LNM-positive within each sub-region of the WSI. The visual heatmaps indicated spatial heterogeneity within tumour regions, and nucleolar morphosis varied between tumours with LNM-positive or LNM-negative.
However, clinical decisions are made not only based on the histology data but also on clinical features. Therefore, we also provided additional analysis based on cancer subtype, primary tumour stage, and patient age. Our further results indicated that the combination of PC-LNM and clinicopathologic features could achieve better performance in the prediction of lymphatic metastasis.
LNM-positive is observably associated with a higher risk of tumour metastasis and progression, which is more likely to lead to a prognosis problem. Currently, critical challenges for predicting LNM consist of the balance between sensitivity and specificity. The improvement of the consistency through deep learning lies in the increased training dataset and the decreased imbalance among samples across multiple cancer types. In addition, we performed segmentation and classification of cell nuclei to mine additional histological features for further improvements. Computational feature representation is perceived quantified associations with traits beyond cancer types. Better implementation of pan-cancer computational histopathology could predict lymph node status from primary tumour slides through deep learning.
There are three improvements over the standard MIL methods, including self-supervised training for feature extraction, categorical embedding for classification, and exponential moving average training updates. These improvements are important for PC-LNM. The parameters update of the pan-caner network can be noisy because we only obtain slide-level labels for WSIs with weak supervision. We hypothesize that such instability is caused by the rapid changing of the attention network, considering that several cancer types are involved in the same training batch. In this study, we carried out a self-ensemble model training strategy to stabilise the training process by updating the parameters in an exponential moving average manner.
Except for the application of deep learning and WSI for predicting LNM in certain tumours, it had also been reported to predict pan-cancer prognosis through histopathology image, which highlighted prognostically related areas, including necrosis and lymphocytic aggregates [9]. Even though the prediction of indirect outcome indicators might cause bias in primal intentions, our PC-LNM also performed well in distinguishing patients with high survival risk across various tumour types. Patients with PC-LNM ( + ) predicted showed a worse prognosis. Therefore, our study might provide constructional suggestions for quickly identifying patients with LNM and poor prognosis, which might need more aggressive treatments and closer follow-up.
Conclusion
In summary, we presented the first automated pan-cancer model for predicting lymph node status from primary tumour histology, which outperformed current state-of-the-art methods in predicting lymph node status. In addition, our study also confirmed the feasibility of pan-cancer computational histopathology through deep learning.
Supplementary information
Acknowledgements
We appreciate the technical support for the professional pathology assessments in the comparison analysis from the department of Pathology, Shanghai General Hospital, Shanghai Jiao Tong University School of Medicine. Partial data used in this publication were retrieved from the National Cancer Institute Clinical Proteomic Tumour Analysis Consortium, the Cancer Genome Atlas, and the Cancer Imaging Archive used in this study.
Author contributions
JHZ, XH and JZ participated in the study conception and design, reviewed the paper and approved the final draft for submission. SC, JX and XW participated in the data collection, data analysis, wrote and approved the final draft for submission. SY and WY participated in data collection, reviewed the paper and approved the final draft for submission.
Funding
This work was supported by the National Natural Science Foundation of China (81972393). The funding sources had no role in the design of the study; collection, analysis or interpretation of the data; writing of the report; the decision to submit for publication.
Data availability
Data supporting the findings of this study are available within the supplementary information and are also available from the authors upon reasonable request.
Competing interests
The authors declare no competing interests.
Ethics approval and consent to participate
No further ethical approval was required since all the slice images from the CPTAC cohort and the TCGA cohort were publicly available for research purposes.
Consent for publication
Not applicable.
Footnotes
Publisher’s note Springer Nature remains neutral with regard to jurisdictional claims in published maps and institutional affiliations.
These authors contributed equally: Siteng Chen, Jinxi Xiang, Xiyue Wang.
Contributor Information
Jun Zhang, Email: junejzhang@tencent.com.
Junhua Zheng, Email: zhengjh0471@sjtu.edu.cn.
Xiao Han, Email: haroldhan@tencent.com.
Supplementary information
The online version contains supplementary material available at 10.1038/s41416-023-02262-6.
References
- 1.Siegel RL, Miller KD, Fuchs HE, Jemal A. Cancer statistics, 2022. CA Cancer J Clin. 2022;72:7–33. doi: 10.3322/caac.21708. [DOI] [PubMed] [Google Scholar]
- 2.Kawada K, Taketo MM. Significance and mechanism of lymph node metastasis in cancer progression. Cancer Res. 2011;71:1214–8. doi: 10.1158/0008-5472.CAN-10-3277. [DOI] [PubMed] [Google Scholar]
- 3.Giuliano AE, Hunt KK, Ballman KV, Beitsch PD, Whitworth PW, et al. Axillary dissection vs no axillary dissection in women with invasive breast cancer and sentinel node metastasis: a randomized clinical trial. J Am Med Assoc. 2011;305:569–75. doi: 10.1001/jama.2011.90. [DOI] [PMC free article] [PubMed] [Google Scholar]
- 4.Holten-Rossing H, Talman MM, Jylling AMB, Laenkholm AV, Kristensson M, Vainer B. Application of automated image analysis reduces the workload of manual screening of sentinel lymph node biopsies in breast cancer. Histopathology. 2017;71:866–73. doi: 10.1111/his.13305. [DOI] [PubMed] [Google Scholar]
- 5.Fujimoto N, He Y, D’Addio M, Tacconi C, Detmar M, Dieterich LC. Single-cell mapping reveals new markers and functions of lymphatic endothelial cells in lymph nodes. PLoS Biol. 2020;18:e3000704. doi: 10.1371/journal.pbio.3000704. [DOI] [PMC free article] [PubMed] [Google Scholar]
- 6.Núñez NG, Tosello Boari J, Ramos RN, Richer W, Cagnard N, Anderfuhren CD, et al. Tumor invasion in draining lymph nodes is associated with Treg accumulation in breast cancer patients. Nat Commun. 2020;11:3272. doi: 10.1038/s41467-020-17046-2. [DOI] [PMC free article] [PubMed] [Google Scholar]
- 7.Nishiwada S, Sho M, Banwait JK, Yamamura K, Akahori T, Nakamura K, et al. A microRNA signature identifies pancreatic ductal adenocarcinoma patients at risk for lymph node metastases. Gastroenterology. 2020;159:562–74. doi: 10.1053/j.gastro.2020.04.057. [DOI] [PMC free article] [PubMed] [Google Scholar]
- 8.Barisoni L, Lafata KJ, Hewitt SM, Madabhushi A, Balis UGJ. Digital pathology and computational image analysis in nephropathology. Nat Rev Nephrol. 2020;16:669–85. doi: 10.1038/s41581-020-0321-6. [DOI] [PMC free article] [PubMed] [Google Scholar]
- 9.Yu F, Jung AW, Torne RV, Gonzalez S, Vhringer H, Shmatko A, et al. Pan-cancer computational histopathology reveals mutations, tumor composition and prognosis. Nat Cancer. 2020;1:800–10. doi: 10.1038/s43018-020-0085-8. [DOI] [PubMed] [Google Scholar]
- 10.Wang X, Fang Y, Yang S, Zhu D, Wang M, Zhang J, et al. A hybrid network for automatic hepatocellular carcinoma segmentation in H&E-stained whole slide images. Med Image Anal. 2021;68:101914. doi: 10.1016/j.media.2020.101914. [DOI] [PubMed] [Google Scholar]
- 11.Lu MY, Williamson DFK, Chen TY, Chen RJ, Barbieri M, Mahmood F. Data-efficient and weakly supervised computational pathology on whole-slide images. Nat Biomed Eng. 2021;5:555–70. doi: 10.1038/s41551-020-00682-w. [DOI] [PMC free article] [PubMed] [Google Scholar]
- 12.Coudray N, Ocampo PS, Sakellaropoulos T, Narula N, Snuderl M, Fenyö D, et al. Classification and mutation prediction from non-small cell lung cancer histopathology images using deep learning. Nat Med. 2018;24:1559–67. doi: 10.1038/s41591-018-0177-5. [DOI] [PMC free article] [PubMed] [Google Scholar]
- 13.Yamashita R, Long J, Longacre T, Peng L, Berry G, Martin B, et al. Deep learning model for the prediction of microsatellite instability in colorectal cancer: a diagnostic study. Lancet Oncol. 2021;22:132–41. doi: 10.1016/S1470-2045(20)30535-0. [DOI] [PubMed] [Google Scholar]
- 14.Lu MY, Chen TY, Williamson DFK, Zhao M, Shady M, Lipkova J, et al. AI-based pathology predicts origins for cancers of unknown primary. Nature. 2021;594:106–10. doi: 10.1038/s41586-021-03512-4. [DOI] [PubMed] [Google Scholar]
- 15.Hu Y, Su F, Dong K, Wang X, Zhao X, Jiang Y, et al. Deep learning system for lymph node quantification and metastatic cancer identification from whole-slide pathology images. Gastric Cancer. 2021;24:868–77. doi: 10.1007/s10120-021-01158-9. [DOI] [PubMed] [Google Scholar]
- 16.Pham HHN, Futakuchi M, Bychkov A, Furukawa T, Kuroda K, Fukuoka J. Detection of lung cancer lymph node metastases from whole-slide histopathologic images using a two-step deep learning approach. Am J Pathol. 2019;189:2428–39. doi: 10.1016/j.ajpath.2019.08.014. [DOI] [PubMed] [Google Scholar]
- 17.Ehteshami Bejnordi B, Veta M, Johannes van Diest P, van Ginneken B, Karssemeijer N, Litjens G, et al. Diagnostic assessment of deep learning algorithms for detection of lymph node metastases in women with breast cancer. J Am Med Assoc. 2017;318:2199–210. doi: 10.1001/jama.2017.14585. [DOI] [PMC free article] [PubMed] [Google Scholar]
- 18.Clark K, Vendt B, Smith K, Freymann J, Kirby J, Koppel P, et al. The Cancer Imaging Archive (TCIA): maintaining and operating a public information repository. J Digit Imaging. 2013;26:1045–57. doi: 10.1007/s10278-013-9622-7. [DOI] [PMC free article] [PubMed] [Google Scholar]
- 19.Weinstein JN, Collisson EA, Mills GB, Shaw KR, Ozenberger BA, Ellrott K, et al. The Cancer Genome Atlas Pan-Cancer analysis project. Nat Genet. 2013;45:1113–20. doi: 10.1038/ng.2764. [DOI] [PMC free article] [PubMed] [Google Scholar]
- 20.Huang KL, Mashl RJ, Wu Y, Ritter DI, Wang J, Oh C, et al. Pathogenic germline variants in 10,389 adult cancers. Cell. 2018;173:355–70. doi: 10.1016/j.cell.2018.03.039. [DOI] [PMC free article] [PubMed] [Google Scholar]
- 21.Ciga O, Xu T, Martel AL. Self supervised contrastive learning for digital histopathology. Mach Learn Appl. 2022;100198:1–14. [Google Scholar]
- 22.Liu Z, Lin Y, Cao Y, Hu H, Wei Y, Zhang Z, et al. Swin transformer: hierarchical vision transformer using shifted windows. arXiv [Preprint] 2021. Available from: 10.48550/arXiv.2103.14030.
- 23.Wang X, Yang S, Zhang J, Wang M, Zhang J, Yang W, et al. Transformer-based unsupervised contrastive learning for histopathological image classification. Med Image Anal. 2022;81:102559. doi: 10.1016/j.media.2022.102559. [DOI] [PubMed] [Google Scholar]
- 24.DeLong ER, DeLong DM, Clarke-Pearson DL. Comparing the areas under two or more correlated receiver operating characteristic curves: a nonparametric approach. Biometrics. 1988;44:837–45. doi: 10.2307/2531595. [DOI] [PubMed] [Google Scholar]
- 25.Shao Z, Bian H, Chen Y, Wang Y, Zhang J, Ji X, et al. TransMIL: transformer based correlated multiple instance learning for whole slide image classification. arXiv [Preprint] 2021. Available from: 10.48550/arXiv.2106.00908.
- 26.Bray F, Ferlay J, Soerjomataram I, Siegel RL, Torre LA, Jemal A. Global cancer statistics 2018: GLOBOCAN estimates of incidence and mortality worldwide for 36 cancers in 185 countries. CA Cancer J Clin. 2018;68:394–424. doi: 10.3322/caac.21492. [DOI] [PubMed] [Google Scholar]
- 27.Lykke J, Roikjaer O, Jess P, Rosenberg J. Identification of risk factors associated with stage III disease in nonmetastatic colon cancer: results from a Prospective National Cohort Study. Ann Coloproctol. 2020;36:316–22. doi: 10.3393/ac.2019.03.03. [DOI] [PMC free article] [PubMed] [Google Scholar]
- 28.Hanna AN, Sinnamon AJ, Roses RE, Kelz RR, Elder DE, Xu X, et al. Relationship between age and likelihood of lymph node metastases in patients with intermediate thickness melanoma (1.01-4.00 mm): a National Cancer Database study. J Am Acad Dermatol. 2019;80:433–40. doi: 10.1016/j.jaad.2018.08.022. [DOI] [PubMed] [Google Scholar]
- 29.Glimelius B, Tiret E, Cervantes A, Arnold D. Rectal cancer: ESMO Clinical Practice Guidelines for diagnosis, treatment and follow-up. Ann Oncol. 2013;24:vi81–8. doi: 10.1093/annonc/mdt240. [DOI] [PubMed] [Google Scholar]
- 30.Senkus E, Kyriakides S, Ohno S, Penault-Llorca F, Poortmans P, Rutgers E, et al. Primary breast cancer: ESMO Clinical Practice Guidelines for diagnosis, treatment and follow-up. Ann Oncol. 2015;26:v8–30. doi: 10.1093/annonc/mdv298. [DOI] [PubMed] [Google Scholar]
- 31.Brinker TJ, Kiehl L, Schmitt M, Jutzi TB, Krieghoff-Henning EI, Krahl D, et al. Deep learning approach to predict sentinel lymph node status directly from routine histology of primary melanoma tumours. Eur J Cancer. 2021;154:227–34. doi: 10.1016/j.ejca.2021.05.026. [DOI] [PubMed] [Google Scholar]
- 32.Brockmoeller S, Echle A, Ghaffari Laleh N, Eiholm S, Malmstrøm ML, Plato Kuhlmann T, et al. Deep learning identifies inflamed fat as a risk factor for lymph node metastasis in early colorectal cancer. J Pathol. 2022;256:269–81. doi: 10.1002/path.5831. [DOI] [PubMed] [Google Scholar]
- 33.Kwak MS, Lee HH, Yang JM, Cha JM, Jeon JW, Yoon JY, et al. Deep convolutional neural network-based lymph node metastasis prediction for colon cancer using histopathological images. Front Oncol. 2020;10:619803. doi: 10.3389/fonc.2020.619803. [DOI] [PMC free article] [PubMed] [Google Scholar]
- 34.Zhao Y, Yang F, Fang Y, Liu H, Zhou N, Zhang J, et al. Predicting lymph node metastasis using histopathological images based on multiple instance learning with deep graph convolution. In: Proceedings of the IEEE/CVF Conference on Computer Vision and Pattern Recognition. 2020. p. 4837–46.
- 35.Wang L, Jiao Y, Qiao Y, Zeng N, Yu R. A novel approach combined transfer learning and deep learning to predict TMB from histology image. Pattern Recognit Lett. 2020;135:244–8. doi: 10.1016/j.patrec.2020.04.008. [DOI] [Google Scholar]
Associated Data
This section collects any data citations, data availability statements, or supplementary materials included in this article.
Supplementary Materials
Data Availability Statement
Data supporting the findings of this study are available within the supplementary information and are also available from the authors upon reasonable request.