

SUMMARY
Mental health profoundly impacts inflammatory responses in the body. This is particularly apparent in inflammatory bowel disease (IBD), where psychological stress is associated with exacerbated disease flares. Here, we discover a critical role for the enteric nervous system (ENS) in mediating the aggravating effect of chronic stress on intestinal inflammation. We find that chronically elevated levels of glucocorticoids drive the generation of an inflammatory subset of enteric glia that promotes monocyte- and TNF-mediated inflammation via CSF1. Additionally, glucocorticoids cause transcriptional immaturity in enteric neurons, acetylcholine deficiency, and dysmotility via TGFβ2. We verify the connection between the psychological state, intestinal inflammation, and dysmotility in three cohorts of IBD patients. Together, these findings offer a mechanistic explanation for the impact of the brain on peripheral inflammation, define the ENS as a relay between psychological stress and gut inflammation, and suggest that stress management could serve as a valuable component of IBD care.
Graphical Abstract

In brief
The enteric nervous system relays chronically elevated levels of glucocorticoids to induce transcriptional immaturity in enteric neurons, monocyte recruitment, dysmotility and a general inflammatory state in the gut associated with inflammatory bowel disease
INTRODUCTION
Psychological stress exerts a profound impact on inflammatory processes throughout the body1–3, suggesting that improving a patient’s mental state might be a powerful yet underutilized strategy for the management of numerous diseases. The effect of psychological stress on disease severity is particularly striking in inflammatory bowel disease (IBD)4, with numerous epidemiological studies supporting the hypothesis that stressful life events can induce exacerbated IBD flares5–8. However, the mechanistic basis for aggravated stress-associated IBD flares is not fully understood.
In this study, we uncover several mechanisms by which psychological stress influences bowel inflammation via the enteric nervous system (ENS). Unlike the central nervous system (CNS), where responses to psychological stress have been deeply characterized9, ENS responses to stress and their consequences are less well understood. We provide insights into how the ENS may serve as a relay between brain-derived stress signals and the priming of inflammatory responses in the intestine. Our findings highlight enteric neurons and glia as possible therapeutic targets to ameliorate inflammatory sequelae of mental health impairment.
RESULTS
Monocytes mediate stress-driven colitis exacerbation
To investigate mechanisms underlying the impact of psychological stress on intestinal inflammation, we used a mouse model of prolonged psychological stress (restraint stress10) and induced colitis using dextran sodium sulfate (DSS) (Figure 1A). Psychological stress exacerbated intestinal inflammation, as documented by weight loss, colonoscopy, mortality, histology, and fecal lipocalin levels (Figures 1B–1E and S1A–S1C). RNA-sequencing of colonic tissue revealed pronounced changes in gene expression induced by psychological stress. This included downregulation of genes involved in type 2 immunity (Il33, Il13ra, Retnla) as well as antimicrobial peptides (Ang4, Itln1, Lyz2). In contrast, the expression of IBD-associated genes (Duox2, Duoxa2) and pro-inflammatory cytokines (Tnf Ccl2, Il6) was upregulated (Figures S1D–S1F). Restraint stress-induced colitis exacerbation was also observed under housing conditions that ameliorate environmental stress, including thermoneutrality11 and cage enrichment (Figures S1G–S1N). Although we noted slightly increased water intake in the stressed group, colitis aggravation was not caused by increased DSS consumption (Figures S1O–S1T). We also observed exacerbated colitis in stressed mice across different starting weights and durations of the stress period (Figures S1U and S1V). Interestingly, when we applied restraint stress at different time points during the experimental protocol (Figure S2A), we noted that stress experienced before the onset of colitis had the strongest effect of disease exacerbation (Figures S2B–S2E), suggesting that psychological stress may precondition the bowel for enhanced inflammation during the subsequent encounter of a colitogenic trigger. DSS-induced colitis was likewise aggravated in a model of social stress12, as demonstrated by weight loss, survival, and colonoscopy data (Figures S2F–S2I). Similarly, in an alternative IBD model13 that is based on genetic deficiency in IL-10, restraint stress led to body weight loss, elevated colonoscopy scores, higher rate of rectal prolapses, and reduced colon length (Figures S2J–S2N). In contrast, wild-type mice exposed to restraint stress did not develop macroscopic signs of colitis (Figures S2O–S2S). Together, these data from several independent mouse models suggest that psychological stress per se is not sufficient to induce overt colitis but preconditions the intestinal mucosa by inducing a pro-inflammatory state that exacerbates the consequences of a colitogenic trigger.
Figure 1. Psychological stress exacerbates intestinal inflammation via colonic myeloid cells.

(A) Schematic of experimental stress-colitis paradigm.
(B-E) Colitis severity readouts.
(F) UMAP embedding of 23,696 colon leukocytes after 7 days of stress, including subclustering of myeloid cell populations.
(G) Pseudotime trajectory analysis comparing control vs. stressed myeloid cells as well as TNF expression in Mono1 and Mac1 subclusters.
(H) Flow cytometry of CD45+ Ly6G−CD11b+ live colonic leukocytes. Bar charts depict relative abundances of cells in the respective quadrants (Q1-Q3).
(I-K) Absolute numbers of Ly6C+ MHCII− cells (I), Ly6C+ MHCII+ (J), Ly6C− MHCII+ cells (K) from panel H.
(L-N) Colitis readouts in CCR2-DTR mice.
(O-Q) Colitis readouts in anti-TNF-treated mice.
See also Figures S1–S4.
We next sought to identify potential effector cells of stress-exacerbated colitis. To this end, we hereafter mostly focused on the combination of restraint stress and DSS colitis due to the simplicity of these experimental paradigms. Single-cell RNA-sequencing of 23,696 CD45+ leukocytes isolated from colonic tissue of stressed and control mice yielded 13 distinct immune cell types, which were annotated using signatures of known lineage markers (Figures 1F, S3A, and S3B). Among all clusters, T cells, macrophages/monocytes, and innate lymphoid cells had the most differentially expressed genes in stressed mice (Figure S3C), nominating these cell types as potential drivers of stress-induced enhanced intestinal inflammation. We first focused on T cells, given their well-described role in the pathogenesis of colitis14. Psychological stress induced several elements of an enhanced TH17 response in the intestine (Figures S3D and S3E). However, adaptive immune cells were dispensable for stress-mediated enhancement of colitis (Figures S3F–S3I). We thus turned to innate lymphoid cells (ILCs), motivated by their large number of differentially regulated genes (Figure S3C), the enrichment of IL-22-producing ILCs in the intestines of stressed mice (Figures S4A and S4B), and a recent report on the role for IL-22 in stress-mediated exacerbation of enteric infection15. However, neither genetic deficiency in IL-22 nor neutralization of the IL-22-inducing cytokine IL-23 influenced the stress-mediated colitis phenotype (Figures S4C–S4I). Likewise, ILC-deficient Rag2/Il2rg knockout mice were as susceptible to the impact of stress on colitis as their wild-type counterparts (Figure S4J). These results suggest that neither innate nor adaptive lymphocytes are essential drivers of the intestinal inflammatory response to stress.
We therefore focused on myeloid cells, and in particular on monocytes and macrophages, given their strong transcriptional changes induced by psychological stress (Figure S3C). Sub-clustering of the single-cell data revealed five populations of myeloid cells (Figures 1F and S4K): three monocyte (Mono 1, 2 and 3) and two macrophage subsets (Mac 1-2). The impact of psychological stress was particularly apparent in the transcriptomes of the Mono1 and Mac2 clusters (Figure S4L). Notably, pseudotime trajectory analysis indicated an accumulation of monocytes in stressed mice (Figure 1G), which we verified by flow cytometry (Figures 1H–1K). To determine whether monocyte accumulation was functionally involved in the inflammatory phenotype, we used CCR2-DTR mice to deplete monocytes in vivo (Figure S4M). Indeed, depletion of CCR2+ monocytes protected from stress-mediated colitis aggravation (Figures 1L–1N). To dissect the molecular mechanisms by which monocytes drive inflammation under stressed conditions, we analyzed differential gene expression in myeloid cells along the pseudotime axis. We noted a strong accumulation of TNF-producing monocytes in colons from stressed mice (Figure 1G), consistent with elevated transcripts of Tnf in colonic tissue (Figure S1E). Similar to monocyte depletion, pharmacological neutralization of TNF by treatment with a monoclonal antibody was sufficient to protect from the inflammation-enhancing effect of stress (Figures 1O–1Q). In contrast, neutralization of IL-6, another cytokine strongly induced in the context of psychological stress3 (Figures S1F and S4N) was not protective (Figures S4O–S4R). Together, these experiments suggest that psychological stress alters the landscape of intestinal myeloid cells, results in accumulation of inflammatory monocytes, and leads to TNF-mediated colitis exacerbation.
Psychological stress impacts intestinal inflammation through glucocorticoids
We next asked how psychological stress is transmitted from the brain to the intestine. Perception of stress by the CNS results in elevated levels of catecholamines and corticosteroids in the periphery16. Indeed, the canonical stress hormones noradrenaline and corticosterone were significantly increased in the serum of mice experiencing restraint stress (Figures 2A and S5A). To assess the impact of catecholamine release on colitis, we depleted sympathetic neurons with 6-hydroxydopamine (6-OHDA). Successful chemical sympathectomy was confirmed by strongly reduced norepinephrine concentrations (Figure S5B). Interestingly, abrogation of adrenergic signaling seemed to further exacerbate colitis in stressed mice, as evidenced by pronounced weight loss, high mortality, and severe mucosal damage (Figures S5C–S5G). Likewise, mice treated with the β2-receptor antagonist ICI-118,551 showed an exacerbated stress-induced colitis phenotype (Figures S5H–S5J). Together, these data suggest that catecholamines counteract, rather than enhance, inflammation during chronic stress17–19.
Figure 2. Psychological stress impacts intestinal inflammation through glucocorticoid signaling.

(A) Serum corticosterone after 1, 7, and 14 days of stress.
(B-I) Colitis readouts in RU-486-treated (B-D) and dexamethasone-treated (E-I) stressed mice.
(J) Flow cytometry of CD45+ Ly6G− CD11b+ live colonic leukocytes after 7 days of dexamethasone treatment. Bar charts depict relative abundances of cells in the respective quadrants (Q1-Q3).
(K-M) Absolute abundance of cells in Q1-Q3 from panel J.
(N-Q) Colitis readouts of anti-TNF treated mice receiving dexamethasone.
See also Figure S5.
To investigate the involvement of increased glucocorticoids in stress-induced severe colitis, we pharmacologically blocked the brain-mediated induction of adrenal corticosterone release with the corticotropin-releasing hormone receptor 1 (CRHR1) antagonist antalarmin. This treatment efficiently diminished corticosterone levels (Figure S5K) and rendered mice resistant to the impact of restraint stress on colitis (Figures S5L–S50). Similarly, corticosterone depletion by adrenalectomy (Figures S5P–S5T) or inhibition of glucocorticoid receptor (GR) signaling using mifepristone (RU-486) prevented colitis exacerbation by psychological stress (Figures 2B–2D), suggesting that glucocorticoids mediated the detrimental effect of stress on gut inflammation. Since RU-486 is not specific to GR, but also targets the progesterone receptor, we wondered whether GR signaling was sufficient to recapitulate the effect of stress on colitis. To this end, we treated mice with the synthetic GR agonist dexamethasone, followed by exposure to DSS. Notably, dexamethasone treatment, at a concentration that matches stress-induced serum levels of corticosterone (Figures S5U and S5V), phenocopied the effects of stress and induced a severe colitis phenotype, evidenced by early mortality, severe mucosal injury as assessed by colonoscopy and histology, as well as reduced colon length (Figures 2E–2I). These results were surprising given that corticosteroids are used for the acute treatment of bowel inflammation20. Due to the increased receptor affinity of dexamethasone and the fact that we detected it at higher levels in intestinal tissue compared to corticosterone (Figures S5W and S5X), we also used a low-dose dexamethasone protocol, which likewise exacerbated colitis severity (Figures S5Y–S5AB). Dexamethasone treatment also led to monocyte accumulation as seen in stressed mice (Figures 2J–2M). Consistently, anti-TNF treatment ameliorated the chronic dexamethasone-induced sensitization to severe intestinal inflammation (Figures 2N–2Q). Together, these data indicate that chronically elevated glucocorticoids may mediate the impact of stress perception by the brain on colitis exacerbation.
Psychological stress drives colitis exacerbation via inflammatory enteric glia
Based on these findings and recent reports demonstrating an impact of glucocorticoids on myeloid cell migration21, we hypothesized that GR signaling in myeloid cells was responsible for the detrimental effects of psychological stress on IBD. However, mice lacking the GR gene Nr3c1 specifically in myeloid cells (Nr3c1LysM) were as susceptible to the effects of stress on gut inflammation as their littermate controls, as manifested by weight loss, colonoscopy, colon shortening, and inflammatory cytokine expression (Figures 3A–3F). This suggested that the effect of glucocorticoids on monocytes was indirect. Outside of the immune system, glucocorticoids exert a strong effect on both epithelial and neuronal cells9,22,23. Epithelial-specific GR deletion in Nr3c1Vil1 mice did not protect mice from the aggravating effects of stress on colitis (Figures S6A–S6D). We thus tested whether cells of the ENS might be affected by chronic psychological stress. To this end, we deleted Nr3c1 in enteric neurons and glia using Hand2-Cre mice. Remarkably, Nr3c1Hand2 mice were protected from the impact of stress on colitis (Figures 3A–3F), without affecting food or water intake (Figures S6E and S6F). Furthermore, ENS-specific deletion of Nr3c1 also prevented the stress-induced accumulation of monocytes (Figure 3G). We observed the same protective effect of GR deficiency in the ENS when we induced colitis with an IL-10 receptor-targeting antibody (Figures S6G–S6L). Given that Nr3c1Hand2 mice lack GR expression in both enteric neurons and glia, we sought to disentangle the individual roles of glia and neurons in the gastrointestinal tract. The large majority of adult enteric glia are characterized by Plp1 or Sox10 expression24. We thus generated inducible Nr3c1Plp1/Sox10 mice and exposed them to restraint stress. Notably, deletion of GR in adult glia largely protected mice from the colitis-exacerbating effects of stress (Figures 3H–3K). Collectively, these results point to the ENS, and particularly enteric glia cells, as a critical relay between glucocorticoids derived from the hypothalamic-pituitary-adrenal axis and inflammatory reactions in the gut.
Figure 3. The ENS relays the detrimental effect of glucocorticoids on intestinal inflammation.
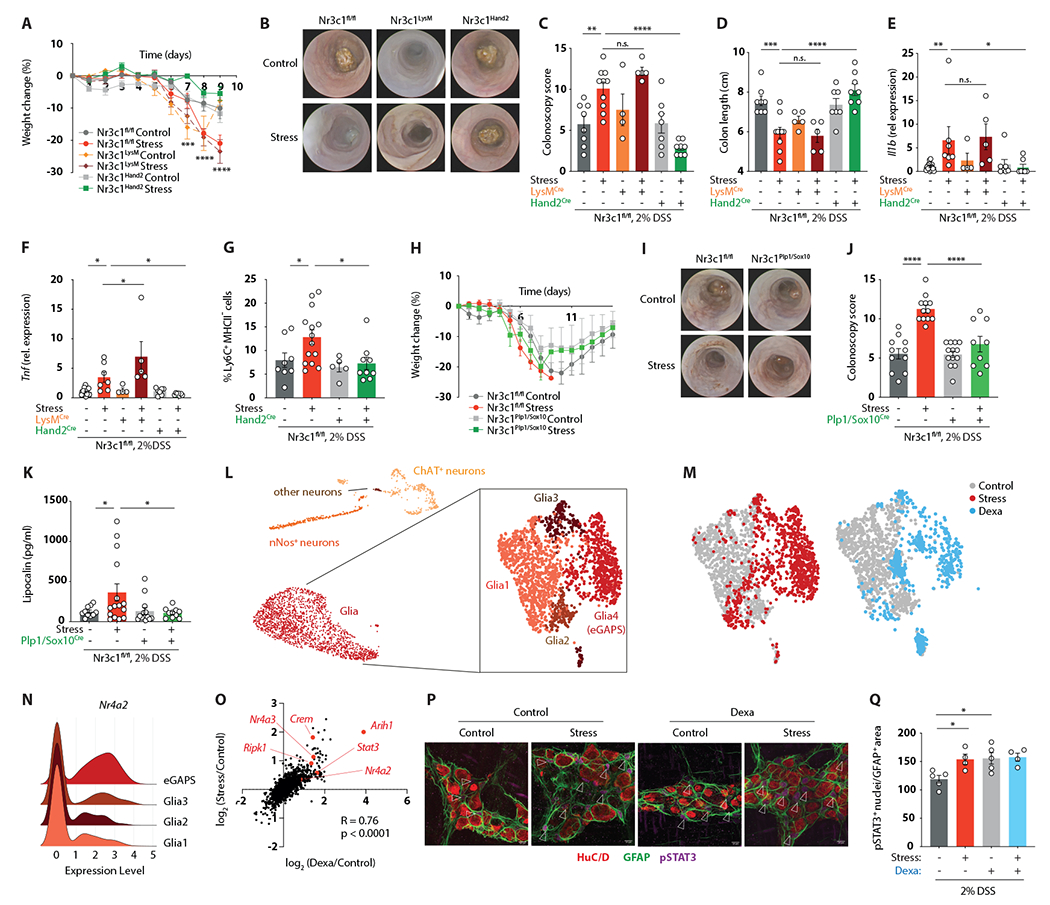
(A-F) Colitis readouts (A-D) and relative gene expression levels of Il1b (E) and Tnf (F) in Nr3c1fl/fl, Nr3c1Hand2, and Nr3c1LysM mice.
(G) Relative abundance of Ly6C+ MHCII− cells determined by flow cytometry after an adjusted experimental paradigm (only 4 days of 2% DSS).
(H-K) Colitis readouts in Nr3c1fl/fl and Nr3c1Sox10/Plp1 mice.
(L) UMAP embedding of 9,858 enteric nuclei from Sox10Cre-INTACT mice after 7 days of stress with subclustering of glia cells.
(M) UMAP embedding showing the distribution of cells from control (grey), stress (red) and dexamethasone-treated (blue) mice.
(N) Ridgeline plot showing relative transcript levels of Nr4a2 in individual glia cell clusters.
(O) Spearman correlation of the avg log2FC expression of significantly regulated genes in stress compared to control and dexamethasone-treated compared to control nuclei.
(P and Q) Whole-mount IF staining for HuC/D, GFAP and pSTAT3 (arrows indicate pSTAT3+ nuclei) (P), and quantification of pSTAT3+ enteric glia cell nuclei normalized to the GFAP+ area (Q) after 7 days of stress or dexamethasone treatment.
To understand the molecular effects of psychological stress on the ENS, we performed single-nucleus RNA-sequencing of enteric glia and neurons using mice expressing a conditional Sun1-GFP allele under the control of the (non-inducible) Sox10 promoter25 (Figure S7A). We profiled 9,858 nuclei, excluded contaminating cells (epithelial, immune, and stromal cells), and identified UMAP clusters as neurons and glia cells based on their gene expression profile (Figures 3L and S7B). Given the protective phenotype of Nr3c1Plp1/Sox10 mice, we first focused on glia cells. Sub-clustering analysis revealed the presence of four distinct transcriptional states, one of which was exclusively present under stressed conditions (Figures 3L and 3M). We hence termed this subset enteric glia associated with psychological stress (eGAPS). The expression profile of eGAPS was characterized by the induction of pro-inflammatory and pro-apoptotic pathways, while adhesion and cellular interaction pathways were downregulated (Figure S7C). Specifically, eGAPS were marked by high expression of the glucocorticoid-induced factors Nr4a1, Nr4a2, and Nr4a3, the ubiquitin ligase Arih1, the apoptosis/necroptosis mediator Ripk1, and the transcription factor Stat3 (Figures 3N and S7D). Notably, chronic dexamethasone treatment was sufficient for the generation of eGAPS (Figure 3M). The transcriptional profile of dexamethasone-elicited eGAPS showed a high degree of similarity to those from stressed mice, including the Nur transcription factors, Arih1, Ripk1, and Stat3 (Figure 3O). STAT3 activity was likewise increased, as evidenced by enhanced phosphorylation in enteric glia from both stressed and dexamethasone-treated mice (Figures 3P and 3Q). These data highlight the transcriptional response of enteric glia to chronic stress and nominate these cells as a possible link between glucocorticoids and intestinal inflammation.
To functionally test the role of enteric glia, we used transgenic mice enabling the inducible depletion of Sox10-expressing cells (iDTRSox10) (Figures S7E and S7F). Remarkably, glia-depleted mice were resistant to the detrimental effect of psychological stress on intestinal inflammation (Figures 4A and 4B). The same observation was made with an alternative Cre-line that targets enteric glia via Plp1-Cre (iDTRPlp1), which conferred resistance to the colitis-exacerbating effect of dexamethasone (Figures 4C, 4D, and S7G). To avoid potential confounding effects caused by ablation of Sox10- or Plp1-expressing astrocytes, we used a pegylated variant of DT which does not cross the blood-brain barrier and selectively ablates cells in the peripheral nervous system (BRAINSPAReDT)26. This approach likewise reduced intestinal glia numbers and prevented stress-induced colitis exacerbation (Figures 4E–4G, S7H, and S7I). Importantly, glia ablation also blocked the accumulation of colonic monocytes (Figures 4H and 4I), suggesting that communication between enteric glia and monocytes is critical for the impact of stress on colitis.
Figure 4. Psychological stress drives colitis exacerbation via inflammatory enteric glia and CSF1.

(A-D) Colonoscopy readouts of stressed iDTRSox10 and iDTRfl/fl mice (A and B) and of dexamethasone-treated iDTRPlp1 and iDTRfl/fl mice (C and D)
(E-G) Colitis readouts of BRAINSPAReDT-treated stressed mice.
(H and I) Flow cytometry of CD45+ Ly6G− live colonic leukocytes (H) and relative abundance of CD11b+Ly6Chi cells
(I) from iDTRplp1 or iDTRfl/fl mice after 7 days of stress.
(J) Circos plot showing significant cell-cell interactions determined by NicheNet.
(K) Relative expression of Csf1 in enteric glia of control and stress mice determined by snRNA-seq.
(L) CSF1 protein concentration in the colonic muscularis layer after 7 days of stress.
(M) Percentage of colonic lymphocytes (live CD45+ CD19+/CD3+/CD5+) or Ly6Chi monocytes (live CD45+ Ly6G−, CD11b+ Ly6Chi) expressing CSF1R as determined by flow cytometry.
(N) Relative abundance of Ly6Chi MHCII− (as a percentage of living CD45+ Ly6G− CD11b+) cells in anti-CSF1 treated mice.
(O-Q) Colitis readouts of mice treated with anti-CSF1.
(R) Schematic of proposed pathway linking psychological stress to exacerbated colitis.
See also Figures S6 and S7.
To explore possible modes of glia-myeloid cell interactions involved in the inflammatory response to stress, we generated a pairwise interaction map based on our single-cell and single-nucleus transcriptome data. This analysis indicated numerous hypothetical interactions between eGAPS and myeloid cell populations in the colon (Figure 4J). We focused on interactions between eGAPS and the Mono1 cluster, given the high expression of Tnf in these monocytes (Figure 1G). Among the candidate mediators of this interaction was Csf1, which has recently been shown to drive inflammatory myeloid cell responses in the gut27. Indeed, Csf1 was highly expressed in enteric glia cells upon stress (Figure 4K). Furthermore, elevated CSF1 protein could be detected in the colonic muscularis layer of stressed mice (Figure 4L). The high levels of colonic Csf1 expression depended on GR signaling in the ENS, since Nr3c1Hand2 mice showed blunted Csf1 induction in response to stress (Figure S7J). Expression of the CSF1 receptor was restricted to myeloid cells (Figure S7K) and was found on the majority of Ly6C+ monocytes (Figure 4M). In addition to its monocyte-recruiting function, CSF1 has been suggested to prime mononuclear phagocytes to transcribe and release TNF28, which we verified by observing a potentiating effect of CSF1 on LPS-induced TNF production by monocytes (Figures S7L and S7M). We thus hypothesized that CSF1 might mediate glia-monocyte communication and drive stress-induced aggravation of bowel inflammation. To address this, we neutralized CSF1 signaling with a monoclonal antibody. Indeed, Ly6C+ MHC-II− monocyte counts were normalized upon anti-CSF1 treatment of stressed mice (Figure 4N). Intriguingly, CSF1 blockage also conferred resistance to the detrimental impact of psychological stress on colonic inflammation (Figures 4O–4Q). Collectively, these data suggest a model whereby chronic stress results in glucocorticoid exposure of enteric glia and the generation of eGAPS. Enteric glia, in turn, promote the accumulation of TNF-producing monocytes via CSF1 and enhance inflammatory responses to a colitogenic insult (Figure 4R).
Psychological stress causes dysmotility via enteric neuron immaturity
Throughout our experiments, we consistently noticed that restraint stress, in addition to exacerbating colitis, caused a marked delay in colonic transit time (Figure 5A), in line with earlier reports29. The same phenomenon could be observed in dexamethasone-treated mice (Figure 5B). We thus examined the neuronal compartment in our single-nucleus ENS data set, given the critical role of enteric neurons in intestinal motility30 (Figures 5C and S8A–S8E). Notably, the cholinergic and nitrergic subsets of mature neurons were underrepresented in the stressed group, while the precursor compartment was enriched (Figure S8F). To verify this finding, we aligned the cells along a pseudotime trajectory that highlighted precursor genes, such as Itga2, Nes, Sox2, and Ednrb, and genes that drive the functions of mature neuron subsets, such as Chat, Penk, Tac1, and Nos1 (Figure 5D). When we projected neurons derived from stressed and control mice onto the pseudotime trajectory, we observed that the distribution of cells was shifted toward the immature compartment under conditions of psychological stress (Figure 5E).
Figure 5. Psychological stress causes dysmotility via transcriptional immaturity in enteric neurons.

(A and B) Intestinal transit time after 7 days of stress (A) or dexamethasone treatment (B).
(C) UMAP embedding of enteric nuclei isolated from colon of control and stressed Sox10Cre-INTACT mice after 7 days of stress.
(D) Heatmap of differentially expressed genes across pseudotime.
(E) Diffusion pseudotime after 7 days of stress.
(F) Relative Nestin expression in bulk RNA-sequencing of total colon after 7 days of stress.
(G and H) Whole-mount IF staining for HuC/D and Nestin (G) and quantification of Nestin+ cells (H).
(I and J) Immunoblot analysis of colonic muscularis for Nestin (I) and quantification of relative Nestin protein levels
(J) after 7 days of stress.
(K-N) Whole-mount IF staining and quantifications of HuC/D, nNOS and ChAT (GFP) (K-L) and acetylcholine (ACh) concentrations in total colon tissue (N) after 7 days of stress.
(O) Relative abundance of cells with pseudotime<0.3 after 7 days of dexamethasone treatment (determined by snRNA-seq).
(P-S) Whole-mount IF staining and quantifications of HuC/D, nNOS and ChAT (GFP) (P-R), and acetylcholine (ACh) concentrations in total colon tissue (S) after 7 days of dexamethasone treatment.
(T) Intestinal transit time after 7 days of stress in nicotine-treated mice.
See also Figure S8.
This finding implied that stress increased the proportion of precursor-like neurons, while decreasing the number of mature neurons. We validated this prediction with several orthogonal tools. First, we found higher levels of Nes transcript expression (Figure 5F), a larger number of Nestin-expressing neurons in whole-mount-stained myenteric plexus (Figures 5G and 5H), and elevated Nestin protein content in the muscularis of stressed mice (Figures 5I and 5J). Second, stress reduced the number of detectable nitric oxide synthase-expressing (nNOS+) neurons (Figures 5K and 5L). Third, the amount of choline acetyltransferase-expressing (ChAT+) neurons likewise plummeted (Figures 5K and 5M), along with reduced levels of acetylcholine (Figure 5N). The same phenomenon could be observed in mice treated with dexamethasone, which showed a strong increase in the immature neuronal compartment (Figure 5O), lower numbers of nNOS+ and ChAT+ neurons (Figures 5P–5R), and reduced acetylcholine levels (Figure 5S). This lack of acetylcholine was functionally important, since restoration of nicotinic acetylcholine receptor signaling levels by exogenous supplementation of nicotine rescued the stress-induced dysmotility phenotype (Figure 5T) and ameliorated colitis after DSS exposure (Figures S8G–S8I). We did not detect a substantial amount of proliferation in enteric neurons (Figure S8J), suggesting that the stress-induced shift in neuronal composition might be caused by transcriptional changes. Together, these data reveal a surprising effect of stress on the population of enteric neurons, with a shift toward a less differentiated phenotype and reduction of nitrergic and cholinergic neurons, resulting in dysmotility.
We next explored the consequences of these stress-induced neuronal changes for DSS-induced colitis. While total neuronal counts were not affected at steady-state, DSS colitis diminished the number of neurons in stressed mice (Figure S8K). To explore the functional consequences of neuronal loss, we ablated enteric neurons in iDTRHand2 mice (Figure S8L), which diminished the levels of acetylcholine (Figure S8M) and massively decelerated intestinal motility (Figure S8N). These results suggest that chronic stress may render enteric neurons more susceptible to injury-induced cell death and dysmotility.
The shift from mature to precursor-like transcriptional states and DSS-induced neuronal loss were dependent on GR signaling in the ENS, since Nr3c1Hand2 mice showed normal neuronal proportions even under conditions of restraint stress (Figures 6A–6D). We therefore hypothesized that the neuronal derangements we observed were a consequence of the eGAPS-monocyte-TNF mechanism triggered by glucocorticoid exposure. However, neither GR deletion in glia nor CSF1 or TNF neutralization counteracted the detrimental effect of stress on intestinal motility or ENS composition (Figures S8O–S8T). These results suggested that a different pathway of ENS-intrinsic glucocorticoid responses mediated the effect of stress on enteric neurons. To identify candidate mediators, we compared the gene expression profiles of pseudotime-high (“mature”) and pseudotime-low (“immature”) enteric neurons (Figure 6E). Interestingly, among the genes most significantly associated with the precursor state was Tgfb2, previously shown to be induced by dexamethasone in the eye31. Indeed, ENS cells from dexamethasone-treated mice showed a similar elevation of Tgfb2 as neurons from stressed mice (Figure 6F). Furthermore, both transcript and protein levels of TGFβ2 were strongly induced in the colonic muscularis of stressed mice (Figures 6G and 6H). Given that TGFβ2 has previously been suggested to regulate neuronal cell death32, we asked whether TGFβ2 was a functional driver of ENS alterations in response to emotional stress. Notably, a TGFβ-neutralizing antibody prevented the shift from nNOS+ to Nestin+ neurons (Figures 6I–6K) and restored normal bowel motility in stressed mice (Figure 6L). This treatment also significantly, albeit incompletely, improved colitis severity (Figures 6M–6O and S8U). Monocyte counts were unaffected by TGFβ blockade (Figure S8V), emphasizing the notion that the eGAPS-CSF1-monocyte axis was not affected by stress-mediated induction of TGFβ2. Taken together, glucocorticoid exposure of enteric neurons induces a precursor-like expression program that is driven by TGFβ2. As a result, the number of functional nitrergic and cholinergic neurons is diminished, susceptibility to injury-induced neuronal loss is increased, and marked dysmotility develops (Figure 6P).
Figure 6. Enteric neuronal immaturity contributes to stress-induced dysmotility via TGFβ2.

(A-D) Whole-mount IF staining and quantification of HuC/D, nNOS and Nestin in Nr3c1fl/fl and Nr3c1Hand2 mice exposed to stress for 7 days followed by 4 days of 2% DSS in drinking water.
(E) Volcano plot of differentially expressed genes in neurons in low vs. high diffusion pseudotime.
(F) Normalized Tgfb2 expression in the ENS nuclei of control, stress, and dexamethasone-treated mice (determined by snRNA-seq).
(G and H) Relative Tgfb2 expression in colon determined by bulk mRNA sequencing (G) and TGFβ2 protein concentrations in colon muscularis layer (H) after 7 days of stress.
(I-K) Whole-mount IF staining and quantifications of HuC/D, nNOS and Nestin in anti-TGFβ treated mice after a shortened experimental paradigm (only 4 days of 2% DSS).
(L) Intestinal transit time after 7 days of stress and anti-TGFβ treatment.
(M-O) Colitis readouts of anti-TGFβ treated mice.
(P) Schematic of the proposed mechanism linking psychological stress to enteric dysmotility.
See also Figure S8.
Psychological stress exacerbates IBD in humans
Finally, we explored the connection of psychological stress, dysmotility, and bowel inflammation in human patients. We analyzed data from 502,505 individuals from the UK Biobank (Figure 7A and Table S1). Patients with ICD codes indicating high levels of chronic psychological stress had a significantly higher risk of developing IBD during a 10-year follow-up than participants without a stressful lifestyle (Figure 7B). In addition, psychological stress was also linked to a more severe course of IBD after diagnosis, as indicated by higher serum C-reactive protein (CRP) and increased overall mortality (Figures 7C and 7D). These findings applied across both two principal types of IBD, ulcerative colitis and Crohn’s disease (Figures S9A and S9B).
Figure 7. Psychological stress exacerbates IBD in humans.

(A) Workflow of data analysis from the UK Biobank.
(B) Cumulative risk (adjusted for age, sex, BMI) for developing IBD in control vs. stressed participants.
(C) Serum levels of C-reactive protein in control vs. stressed IBD patients.
(D) Kaplan-Meier survival curve of control and stressed IBD patients with adjusted hazard ratio for age, sex, BMI.
(E and F) Leukocyte (E) and monocyte (F) counts in the blood of control vs. stressed participants with IBD.
(G) Dissatisfaction with bowel habits (scale max 10) in control vs. stressed IBD patients.
(H) Presence of obstipation (in %) in control vs. stressed IBD patients.
(I) Schematic of real-world telehealth study evaluating the effect of psychosocial stress on IBD severity.
(J) Spearman’s correlation of questionnaire-based stress score and IBD activity score (MIAH).
(K) Schematic of prospective study evaluating the effect of emotional stress on IBD severity.
(L) Spearman’s correlation of perceived stress score and colonoscopy score (0-3).
(M-R) Spearman’s correlation of perceived stress score with expression of the indicated genes.
To investigate whether emotional stress triggered similar mechanisms as we had observed in mice, we focused on markers of inflammation and dysmotility. Indeed, leukocyte counts, including monocytes, were elevated in stressed patients (Figures 7E, 7F, S9C and S9D). Interestingly, stressed patients were more likely to report dissatisfaction with bowel habits and obstipation (Figures 7G, 7H, and S9E–S9J). Stressed IBD patients were also more likely to require surgery and to develop ileus (Figures S9K and S9L). To explore whether these were general consequences of psychosocial stress or specific to IBD patients, we investigated populations in the UK Biobank that were disease-free, patients with an extraintestinal disease (rheumatoid arthritis), and patients with a different intestinal disease (irritable bowel syndrome) (Figure S9M and Table S1). We observed that dysmotility was associated with stress across all populations; however, monocyte accumulation and elevated inflammatory markers were only found in the context of intestinal disease (Figures S9N–S9AB). These observations suggest that, as in mice, psychological stress is associated with dysmotility in humans and predisposes the intestinal mucosa to a subsequent colitogenic trigger.
To substantiate these findings in a different IBD cohort, we assessed stress levels in the myIBDcoach study, a real-world, prospective, multicenter cohort study33 (Figure 7I). Longitudinally assessed stress scores positively correlated with subsequent bowel inflammation as assessed by the clinically validated Monitor IBD at Home (MIAH) questionnaire34 (Figure 7J), further suggesting that psychological stress may prime a heightened inflammatory response in the intestine.
To examine colonic, rather than systemic, inflammatory processes associated with stress, we embarked on a detailed prospective study of 63 IBD patients whose mental health was assessed with a questionnaire that allowed us to assign a perceived stress score to each patient. We then performed colonoscopies on these individuals and evaluated gene expression levels in biopsies obtained during the procedure (Figure 7K). Remarkably, perceived stress levels strongly correlated with colonoscopic evaluation of disease severity (Figure 7L). They also positively correlated with transcripts indicative of monocyte recruitment (Figures 7M and 7N), myeloid cell-driven inflammation (Figures 7O and 7P), and TNF production (Figure 7Q), as well as with levels of TGFB2 (Figure 7R). Altogether, these findings provide evidence for the link between psychological stress and exacerbated intestinal inflammation in individuals with IBD.
DISCUSSION
Chronic psychological stress is strongly associated with the severity of IBD flares6,8,35, but the underlying mechanisms remain largely unclear. In this study, we identify a cascade of cellular and molecular events that link stress perception to exacerbation of enteric inflammation, elements of which may apply to other inflammatory diseases of the gut as well as extraintestinal disorders associated with psychological stress.
Our findings have several important implications. First, we provide important insights into the biology of enteric glia cells. Our results demonstrate that the molecular state of enteric glia and their impact on the intestinal microenvironment are influenced by CNS-derived signals. As such, enteric glia may perform previously unrecognized functions in CNS-ENS communication. Of note, the molecular profile of stress-associated astrocytes shares several features with eGAPS, including high expression levels of Nur family transcription factors36,37, suggesting that this stress-associated glial expression profile may emerge via common signaling mechanisms in different tissues.
Second, our study addresses a conundrum that arises from the fact that stress worsens inflammatory disease, while the canonical systemic mediators of psychological stress, catecholamines and glucocorticoids, are generally considered anti-inflammatory16. The induction of inflammatory enteric glia and exacerbated colitis by glucocorticoid signaling was particularly perplexing, given that the glucocorticoid receptor agonist prednisone is used to treat colitis in IBD patients. There are several possible explanations for this paradox. For instance, prolonged stress or dexamethasone treatment may induce inadequate adrenal production of corticosterone due to negative feedback-mediated suppression of the hypothalamic-pituitary-adrenal axis38,39. However, the beneficial effects of acute GR inhibition (Figures 2B–2D) are not consistent with “adrenal suppression”. Alternatively, the balance between anti- and pro-inflammatory effects of glucocorticoids might be a temporal phenomenon40–42. While acute glucocorticoid treatment ameliorates DSS-induced colitis43, we find that persistently elevated levels of corticosterone contribute to the appearance of eGAPS and accumulation of TNF-producing monocytes. Similarly, clinical observations have documented that only short-term steroid treatment leads to beneficial outcomes in IBD44,45.
Third, our study emphasizes the importance of considering a patient’s mental health in the clinical management of inflammatory diseases. Given that we found opposing roles of two common IBD treatment regimens (corticosteroids and monoclonal antibodies against TNF) on the severity of stress-mediated colitis in mice, it is possible that treatment effects vary depending on the psychological state of affected individuals. The evaluation of mental state, in conjunction with strategies to reduce stress, anxiety, and depression, could thus be a powerful and underutilized tool to enhance treatment success46.
Limitations of this study
Our model implies that glia are the critical source of CSF1 and neurons the critical source of TGFβ2 in stress-exacerbated colitis. While several lines of evidence support this model, the generation of new conditional knockout mice for cell type-specific ablation of these cytokines will be required for unequivocal evidence. Additionally, our findings do not clarify the temporal sequence of events underlying TGFβ2-mediated neuronal alterations in response to stress. Is TGFβ2 induced by GR signaling and subsequently reprograms neurons to express precursor genes rather than differentiation genes? Alternatively, does GR signaling induce an immature state in neurons that is then propagated by TGFβ2? Similar questions regarding the induction of the eGAPS phenotype remain to be clarified.
Our model suggests that the downstream effect of glial and neuronal perturbation by psychological stress are largely distinct, with glia affecting TNF-driven inflammation and neuronal changes driving dysmotility. However, inhibition of TGFβ signaling also provides a certain degree of protection from severe inflammation, albeit only partially. This either suggests that our dichotomous model is oversimplified, or that the rescue of motility itself helps to ameliorate bowel inflammation.
Finally, our study does not address the evolutionary purpose of exacerbated inflammatory responses to chronic stress. Systemic stress responses likely serve the function of resource allocation during times of high energy demand. Notably, the relative benefits of a heightened inflammatory and alert state versus an immunosuppressed state that allows for reallocation of energy within the organism may depend on the source and nature of the stressful trigger47. We speculate that glucocorticoids thus serve a dual function, with acute immunosuppression purposed to centralize resources for survival of essential organs, followed by inflammatory states in the periphery in case the trigger persists. Understanding the impact of stress on intestinal inflammation in more detail may ultimately facilitate harnessing the power of brain-derived signals in the treatment of IBD48.
STAR Methods
RESOURCE AVAILABILITY
Lead Contact
Further information and requests for resources and reagents should be directed to and will be fulfilled by the lead contact, Christoph Thaiss (thaiss@pennmedicine.upenn.edu).
Materials availability
Animal strains used in this study are available from The Jackson Laboratory or were provided by the indicated investigators.
Data and code availability
All data and code to understand and assess the conclusions of this research are available in the main text, supplementary materials. Single-cell RNA-seq and bulk RNA-seq data have been deposited at GEO and are publicly available. Accession numbers are listed in the key resources table.
This paper does not contain original code.
Any additional information required to reanalyze the data reported in this paper is available from the lead contact upon request.
KEY RESOURCES TABLE
| REAGENT or RESOURCE | SOURCE | IDENTIFIER |
|---|---|---|
| Antibodies | ||
| Anti-GFAP (dilution 1:400) | Novus Biologicals | AB_10001722 |
| Anti-GFP (dilution 1:1000) | Aves labs | AB_2307313 |
| Anti-NOS1 (dilution 1:400) | Millipore Sigma | AB_91824 |
| Anti-HuC/D/ANNA-1 (dilution 1:20000) | Gift from Vanda Lennon | AB_2313944 |
| Anti-ChAT (dilution: 1:100) | Novus Biologicals | AB_1968484 |
| Anti-Nestin (dilution: 1:200) | Santa Cruz | AB_627994 |
| Donkey Anti-rabbit Cy2 (dilution 1:400) | Jackson Immuno Research | AB_2340612 |
| Donkey Anti-rat Cy2, Cy5 (dilution 1:400) | Jackson Immuno Research | AB_2340673, AB_2340671 |
| Donkey Anti-chicken Cy5 (dilution 1:400) | Jackson Immuno Research | AB_2340365 |
| Donkey anti-goat AF647 (dilution 1:400) | Jackson Immuno Research | AB_2340436 |
| Donkey anti-human Cy3 (dilution 1:400) | Jackson Immuno Research | AB_2340535 |
| Rat APC/Cy7 anti-mouse CD45 (dilution 1:200) | Biolegend | 103116 |
| Rat PE/Cy5 anti-mouse CD45 (dilution 1:200) | Thermo Fisher Scientific | 15-0451-82 |
| Armenian Hamster PE/Cyanine5 anti-mouse TCR B (dilution 1:200) | Biolegend | 109209 |
| Rat FITC anti-mouse CD64 (dilution 1:200) | Biolegend | 139316 |
| Rat PE/dazzle anti-mouse CD3 (dilution 1:200) | Biolegend | 100245 |
| Rat PE/dazzle anti-mouse CD5 (dilution 1:200) | Biolegend | 100643 |
| Rat PE/dazzle anti-mouse CD19 (dilution 1:200) | Biolegend | 115553 |
| Rat APC anti-mouse CD11c (dilution 1:200) | Biolegend | 117310 |
| Rat PE/Cy7 anti-mouse CD11b (dilution 1:200) | Biolegend | 101216 |
| Rat PE anti-mouse CSF1R (dilution 1:200) | Thermo Fisher Scientific | MA5-16531 |
| Rat PerCP/Cy5.5 anti-mouse Ly6G (dilution 1:200) | Biolegend | 127616 |
| Rat BV605 anti-mouse CD103 (dilution 1:200) | Biolegend | 121433 |
| Rat BV421 anti-mouse MHCII (dilution 1:200) | Biolegend | 107632 |
| Rat BV711 anti-mouse CX3CR1 (dilution 1:200) | Biolegend | 149031 |
| Rat AF700 anti-mouse Ly6C (dilution 1:200) | Biolegend | 128024 |
| Mouse APC-eFluor 780 anti-mouse CD90 (dilution 1:200) | Thermo Fisher Scientific | 47-0900-82 |
| Rat Anti-mouse TNFα monoclonal antibody | BioXCell | AB_1107764, BP0058 |
| Rat Anti-mouse IL-23 (p19) monoclonal antibody | BioXCell | AB_2754551, BE0313 |
| Rat Anti-mouse CSF1 monoclonal antibody | BioXCell | AB_10950309, BE0204 |
| Mouse Anti-mouse TGFβ monoclonal antibody | BioXCell | AB_1107757, BP0057 |
| Rat anti-mouse IL-6 | BioXCell | AB_1107709, BE0046 |
| Rat anti-mouse IL-10R (CD210) | BioXcell | AB_1107611, BE0050 |
| Chemicals, Peptides, and Recombinant Proteins | ||
| Dextran sulfate sodium | MP Biomedicals | 160110 |
| Tamoxifen | Sigma | T5648-1G |
| 6-hydroxydopamine hydrochloride (6-OHDA) | Sigma | H4381-500MG |
| Dexamethasone | Med Chem Express | HY-14648 |
| ICI118,551 | Sigma | 5052750001 |
| RU486 | Cayman Chemicals | 10006317 |
| Antalarmin | Sigma | A8727-50MG |
| Nicotine | Sigma | N3876 |
| BRAINSPAReDT | Gift from Ana Domingos (Oxford) | N/A |
| Diphtheria Toxin | Sigma | D0564-1MG |
| clozapine N-oxide | Sigma | C0832 |
| Carmine red dye | Sigma | C1022 |
| Methylcellulose | Sigma | 94378-100G |
| 4% paraformaldehyde | Thermo scientific | J19943.K2 |
| Methanol | Sigma | 322415-1L |
| Donkey serum | Jackson ImmunoResearch | 017-000-001 |
| Benzyl alcohol | Sigma | 305197-1L |
| Bezyl benzoate | Sigma | W213810-100G-K |
| Collagenase V | StemCell | 07430, 07431, 100-0681 |
| DTT | Sigma | 10197777001 |
| Collagenase D | Sigma | 11088866001 |
| Dispase | Sigma | D4693-1G |
| DNase | Roche | 4716728001 |
| TRIzol | Invitrogen | 15596026 |
| DMSO | Sigma-Aldrich | cat. # D8418 |
| Triton X-100 | Sigma-Aldrich | X100-100ML |
| Fetal bovine serum (FBS) | Cell center | Cat. #7210 |
| LIVE/DEAD Fixable Aqua Cell Stain Kit | ThermoFisher | Cat. #L34957 |
| Dulbecco’s Phosphate Buffered Saline | Fisher Scientific | Cat. #11593377 |
| LPS | Novus Biologicals | NBP2-25295 |
| Recombinant murine CSF-1 | PeproTech | 315-02 |
| Dulbecco’s Modified Eagle Medium (DMEM) | Thermo Fisher Scientific | #10569010 |
| Penicillin-Streptomycin (10,000 U/mL) | Thermo Fisher Scientific/Gibco | #15140122 |
| Critical Commercial Assays | ||
| Mouse Lipocalin-2 DuoSet ELISA | R&D Systems | DY1857-05 |
| Norepinephrine ELISA Kit | IBL-America | IB89537 |
| Amplex® Red Acetylcholine Assay Kit | Invitrogen | A12217 |
| Corticosterone ELISA kit | DRG International | EIA-4164 |
| IL-6 ELISA kit | R&D Systems | DY406-05 |
| Dexamethasone ELISA kit | Elabscience | E-FS-E009 |
| TNF ELISA kit | Thermo Fisher Scientific, | 88-7324-22 |
| Monocyte Isolation kit (BM, Mouse) | Miltenyi | 130-100-629 |
| Click-iT™ EdU Alexa Fluor™ 647 Imaging Kit | Thermo Fisher Scientific | C10340 |
| Illumina TruSeq stranded mRNA kit | Illumina | 20020594 |
| Deposited Data | ||
| ENS snRNASeq | GEO | GSE229322 |
| Leukocyte ScRNASeq | GEO | GSE229321 |
| Bulk RNASeq Colon | GEO | GSE229320 |
| Experimental Models: Organisms/Strains | ||
| C57BL6/J | Jackson Laboratory | #000664 |
| C57BL6/J | Charles River | 027C57BL6/J |
| B6;CBA-Tg-Sox10-cre 1Wdr/J | Jackson Laboratory | #025807 |
| CBA;B6-Tg(Sox10-icre/ERT2)388Wdr/J | Jackson Laboratory | #027651 |
| B6.Cg-Tg(Plp1-cre/ERT)3Pop/J | Jackson Laboratory | #005975 |
| C57BL/6-Gt(ROSA)26Sortm1(HBEGF)Awai/ROSA26iDTR | Jackson Laboratory | #007900 |
| B6;129-Gt(ROSA)26Sortm5(CAG-Sun1/sfGFP)Nat/J | Jackson Laboratory | #021039 |
| B6.129P2-Il10tm1Cgn/J | Jackson Laboratory | #002251 |
| B6.Cg-Rag2tm1.1Cgn/J | Jackson Laboratory | #008449 |
| B6.Cg-Tg(RP23-268L19-EGFP)2Mik/J | Jackson Laboratory | #007902 |
| B6.Cg-Tg(Vil1-cre)1000Gum/J | Jackson Laboratory | #021504 |
| C57BL/6NTac.Cg-Rag2tm1FwaIl2rgtm1Wjl | Taconic | 4111-F/M |
| IL-17-GFP | Gift from R. Flavell (Yale) | N/A |
| Il22−/− | Gift from R. Flavell (Yale) | N/A |
| CCR2-DTR | Gift from M. Abt (UPenn) | N/A |
| Il22 tdTomato | Gift from S. Durum (NIH/NCI) | N/A |
| B6.129S6-Nr3c1tm2.1Ljm/J | Jackson Laboratory | # 012914 |
| B6.129P2-Lyz2tm1(cre)Ifo/J | Jackson Laboratory | 004781 |
| Software and Algorithms | ||
| GraphPad Prism version 9 | GraphPad Software | https://www.graphpad.com |
| Fiji | ImageJ | https://imagej.net |
| Microsoft Excel | Microsoft | https://www.microsoft.com/en-us/microsoft-365/excel |
| FlowJo 10 | BD | www.flowjo.com |
| Statistical computing environment R | R core team | www.r-project.org |
| Kallisto version 0.46 | Pachter lab | https://pachterlab.github.io/kallisto/ |
| Seurat | Satija lab | https://satijalab.org/seurat/ |
| SingleR version 1.4.0 | N/A | Aran, Looney et al., 2019 |
EXPERIMENTAL MODEL AND SUBJECT DETAILS
Mice
C57BL/6J (stock no. 000664) mice were purchased from The Jackson Laboratory and allowed to acclimatize to the animal facility environment for 2 weeks before being used for experimentation. B6;CBA-Tg-Sox10-cre 1Wdr/J (025807), CBA;B6-Tg(Sox10-icre/ERT2)388Wdr/J (027651), B6.Cg-Tg(Plp1-cre/ERT)3Pop/J (005975), C57BL/6-Gt(ROSA)26Sortm1(HBEGF)Awai/ROSA26iDTR (007900), B6;129-Gt(ROSA)26Sortm5(CAG-Sun1/sfGFP)Nat/J (021039), B6.129P2-Il10tm1Cgn/J(002251), B6.Cg-Rag2tm1.1Cgn/J (008449), B6.Cg-Tg(Vil1-cre)1000Gum/J (021504), and B6.Cg-Tg(RP23-268L19-EGFP)2Mik/J (007902) mice were purchased from The Jackson Laboratory. C57BL/6NTac.Cg-Rag2tm1FwaIl2rgtm1Wjl(4111-F/M) were purchased from Taconic. IL-17-GFP and Il22−/− mice were kindly provided by Richard Flavell (Yale). CCR2-DTR mice were kindly provided by Michael Abt (UPenn). Il22 tdTomato mice were kindly provided by Scott Durum (NIH/NCI). In all experiments, age- and gender-matched littermates were used. Mice were 8-12 weeks of age at the beginning of experiments. Mice were given access to a normal chow diet and water ad libitum and maintained under a 12-hour light-dark cycle at room temperature or under thermoneutral conditions (30°C) where indicated. All mice were maintained in filter-topped cages on autoclaved food and water at the PennULAR facilities. In addition, the following enrichment items were provided were indicated: one mouse house with one opening made of cardboard, three gnawing wood pieces (4 cm in length, 1 cm in diameter). For tamoxifen-inducible Cre recombinase expression mice were injected intraperitoneally (i.p.) with 100 mg/kg body weight of tamoxifen in 200 μl corn oil (Sigma).
All experiments were performed in accordance with the PennULAR guidelines and approved by the local IACUC. All experiments used co-housed littermates to ensure consistency of common microbiota and genetic background.
UK Biobank
The ‘UK Biobank’ (UKB) is a population-based cohort study conducted in the United Kingdom from 2006 to 2010, which recruited 502,505 volunteers aged 37 to 73 years at baseline. All participants were registered with the UK National Health Service and attended an initial examination, which is followed by a long-term follow-up taking place continuously. On all analyzed visits, blood samples were taken, and physical measures were performed. All participants gave informed consent for genotyping and data linkage to medical reports. Ongoing inpatient hospital records beginning in 1996 until 2018 were used to identify diagnoses according to the International Classification of Diseases, Tenth Revision (ICD-10) codes (UKB data field 41270). The presence of the following primary ICD10 codes was evaluated: IBD was defined as the presence of K50 or K51. Ulcerative colitis was defined as K51 and Crohn’s disease as K50. In a subset of IBD patients, K50 and K51 diagnoses were present. Those patients were included in both subgroups. Obstipation was defined as K59.0 and Ileus as K56. Psychological stress was defined as depression (F32, F33), or reaction to stress (F43). For comparison we used rheumatoid arthritis (M06) and irritable bowel syndrome (K58). Matching was not used since the cohorts had comparable sizes to the IBD cohort. For all ICD-10 diagnoses the date of first diagnosis was extracted. CRP (UKB data field 30710), leukocytes (UKB data field 30000), and monocytes (UKB data field 30130) at enrollment as well as a digestive health questionnaire at follow up were evaluated to assess inflammation (UKB data fields 21040, 21035, 21038). Dissatisfaction with bowel habits was scored on a scale from 0 to 10. To evaluate bowel surgery, we looked at G4 to H2 operation codes collected in UKB (data field 41272). The UK Biobank receives death notifications (age at death and primary ICD diagnosis that led to death) through linkage to national death registries. End of follow-up was defined as death or end of hospital inpatient data collection in June 2020. For IBD development after stress, stress prior to baseline examination was used and patients that experienced stress after baseline excluded to reduce confounding. The healthy control cohort only contains participants that indicated to be healthy (health rating “good” or “excellent” (UKB field 2178)). This cohort was propensity score-matched (based on age, sex and BMI to the IBD patients. All populations are described in Table S1.
Validation cohort
Clinical validation was performed in a cohort of 551 IBD patients from the Netherlands. This real-world, multicenter, prospective cohort consists of IBD patients of Maastricht University Medical Center+ and Zuyderland Medical Centre which were enrolled between June 1, 2020 and July 1, 2021 and were using myIBDcoach. MyIBDcoach is an established telemedicine platform for management of adult IBD patients. In short, myIBDcoach is a telemedicine-app which 3-monthly monitors several patient-reported outcomes (PROMs), including on disease activity, side-effects, lifestyle, nutrition and psychological factors. These periodic measurements also include the Monitor IBD at Home (MIAH) questionnaire, which is a validated PROM developed to predict endoscopic inflammation in IBD patients with good diagnostic accuracy (score 0-10, with higher scores indicating more disease activity). As for psychosocial factors, stress is measured periodically using a numeric rating scale (1-10) on which patients report their level of (perceived) stress. MyIBDcoach generates automated alerts for the back office, which is managed by nurse practitioners and IBD specialists, if certain pre-set threshold levels are exceeded. An RCT comparing myIBDcoach to standard care demonstrated that myIBDcoach is safe, has high platform adherence rates and patient satisfaction. Currently, myIBDcoach is used in over 20 Dutch hospitals, reaching over 8000 IBD patients. The current prospective myIBDcoach cohort has been approved by the Ethics Committee of Maastricht University Medical Center+ (MEC 2019-1115). In order to evaluate the association between stress and subsequent disease activity over time, a linear mixed model was constructed modelling clinical disease activity scores (measured using the MIAH questionnaire) as the dependent factor, preceding stress levels as the independent factor, and including time both as a repeated factor and as a time lag factor. In addition, a multivariable model was constructed, adjusting for disease phenotype, age at cohort entry, disease duration at cohort entry, sex, and current smoking status. Estimates of fixed effects and corresponding 95% confidence intervals (CI) were obtained. A p value of < 0.05 was considered statistically significant. All analyses were performed using SPSS (IBM Corp, Version 27.0).
Prospective stress cohort
Colonoscopy was performed in a cohort of 63 prospectively recruited IBD patients. All participants filled out a standardized questionnaire (perceived stress scale49). Biopsies with sufficient mRNA yield were available for 41 individuals. The colonoscopy score was determined based on the endoscopy report (0 = no inflammatory signs, 1 = erythema, 2 = friability/erosions, 3 = ulcerations/spontaneous bleeding). The biosample collection study was approved by the University of Pennsylvania Institutional Review Board, protocol number 833338.
METHOD DETAILS
DSS colitis model
To induce colitis, mice were treated with 2% Dextran sulfate sodium (DSS) in drinking water for 7 days (MP Biomedicals, 160110). Mice were monitored for weight loss daily to assess disease progression. In addition, colonoscopy assessment was performed in a blinded fashion after completion of the 7 days of DSS treatment (day 7 or 8).
Restraint stress model
To induce restraint stress, mice were placed into 50 ml polypropylene conical tubes with ventilation caps for 3 hours on 7-10 consecutive days. Stress sessions were started daily between 8-9 AM.
Experimental stress paradigm
8-12 weeks old mice were exposed to 3 h of restraint stress for 7 days followed by 7 days of treatment with 2% DSS in drinking water. Afterwards, mice were followed up for up to 7 days, under continuation of daily restraint stress.
Experimental paradigm with limited DSS supply
Mice were supplied with 2% DSS drinking water overnight at a dosage of 4 ml (day 1-3), 3 ml (day 4), 2 ml (day 5-6) and 1 ml (day 7) per mouse and provided with normal drinking water ad libitum during the light cycle to ensure equal amounts of consumed DSS between control and stress mice. Colonoscopy was performed on day 5 of DSS treatment.
IL-10−/− colitis model
Il-10−/− mice (B6.129P2-Il-10tm1Cgn/J) were purchased from Jackson Laboratories and allowed to acclimatize to the animal facility environment for 2 weeks before being used for experimentation. IL-10−/− mice spontaneously develop a chronic IBD phenotype under specific pathogen-free conditions in our animal facility. Starting at 8-12 weeks of age, respective treatments were initiated, and mice were monitored for weight loss regularly to assess disease progression. In addition, colonoscopy assessment was performed in a blinded fashion after 30 days.
αIL-10R mAb colitis model
To induce colitis, mice (8-12 weeks old) were treated with αIL-10R mAb (1 mg/mouse, four weekly injections, i.p., BioXcell, BE0050). One week after the fourth injection, colitis severity was assessed by the following parameters: (A) Colonoscopy (B) colon length (C) survival (D) qPCR analysis of genes of interest.
Social defeat stress model
4-6 months old CD-1 retired breeder mice (aggressor mice) were singly housed for a minimum of 7 days with free access to food and water. To select CD-1 mice with consistent levels of aggressive behaviors, these aggressor mice were exposed to a C57BL/6J screener mice during the screening process. To this end, the screener mice were placed directly into the home cage of the aggressor for 180 s with the aggressor present. Regardless of latency to aggression, the screener mouse was kept in the cage for the full 180 s. The screening was performed 3 consecutive times. Only aggressor mice that showed consistent aggressive behavior were included in the experiments. To induce social defeat stress, experimental mice were housed in the same cage with a CD-1 aggressor separated by a divider. Every day the divider was removed for 5 minutes and experimental mice were subjected to direct exposure to the CD-1 aggressor mouse. After each cycle, experimental mice rotated into a new aggressor cage and were separated by a divider. Mice were exposed to at least 7 cycles (days) before the start of DSS treatment. Control mice underwent the same procedure but were housed with C57Bl/6J mice.
Adrenalectomy
C57BL6/J mice with surgically removed adrenal glands (ADREX) or sham controls were purchased from Charles River and allowed to acclimatize to the animal facility environment for 2 weeks before being used for experimentation. In brief, a midline incision was made, and the abdominal cavity was entered through the abdominal wall, lateral to the dorsal incision. The adrenal gland with the attached fat pad was individually pulled out of the abdominal cavity. The adrenal gland was dissected, and the fat pad returned to the abdominal cavity. The process was repeated on the opposite side. The skin incision was closed with wound clips. After surgery, the mice were supplied with 0.9% saline solution as drinking water. Success of the surgical procedure was determined by measuring corticosterone levels of randomly selected ADREX and sham mice.
Food and water consumption measurement
Food and water consumption were measured using the BioDAQ food-intake monitoring system (Research Diets). Age- and weight-matched mice were acclimatized in the BioDAQ cages for 1 week. After acclimatization, food and water intake were measured continuously for each mouse.
Drug administration
6-hydroxydopamine hydrochloride (6-OHDA) was diluted in 0.1% sodium-ascorbate immediately before administration and protected from light. For depletion of sympathetic neurons mice were i.p. injected with 6-OHDA at a dose of 150 mg/kg body weight followed by another injection of 100 mg/kg body weight on two consecutive days prior to the start of restraint stress. Mice were treated with an additional 100 mg/kg body weight dose after 7 days of stress treatment before initiation of DSS treatment. PBS was used for control injections. Dexamethasone (Med Chem Express, HY-14648) solved in corn oil was administered by i.p. injection at a dose of 2.5 mg/kg body weight or at a lower dose of 2.5 μg/kg were indicated. Mice were injected daily i.p. with ICI118,551 (Sigma, I127) solved in PBS at a dose of 1.25 mg/kg body weight.
Mice were injected daily i.p. with RU486 (Cayman Chemicals, 10006317) solved in corn oil at a dose of 70 mg/kg body weight. Treatment was initiated on day 1 of DSS treatment. Antalarmin (Sigma, A8727-50MG) was administered daily via i.p. injection at a dose of 20 mg/kg body weight. Nicotine (Sigma, N3876) was administered twice a day (8 am and 8 pm) at a dose of 0.6 mg/kg body weight.
Anti-mouse TNF monoclonal antibody (BioXCell, BP0058) was injected i.p. at a dose of 25 mg/kg body weight 1 day before the start of DSS treatment and on day 3. Anti-mouse IL-23 (p19) monoclonal antibody (BioXCell, BE0313) was injected i.p. at a dose of 5 mg/kg body weight every 72h 1 day before the stress intervention and throughout the experiment. Anti-mouse CSF1 monoclonal antibody (BioXCell, BE0204) was injected i.p. at a dose of 6 mg/kg body weight every other day throughout the experiment. Anti-mouse TGF-β was injected i.p. at a dose of 8 mg/kg body weight every other day throughout the experiment. Anti-IL-6 Ab (BioXCell, BE0046) was injected i.p. at a dose of 8 mg/kg body weight every other day throughout the experiment. PBS, corn oil or respective isotype controls were used for control injections where indicated.
Measurement of gastrointestinal transit times
Carmine red dye (Sigma-Aldrich, C1022) was prepared as a 6% (w/v) solution in 0.5% methylcellulose (Sigma-Aldrich). Mice were gavaged with 200 μl of the carmine solution between 09:00 am and 09:15 am local time. Animals were not fasted beforehand. Mice were separated into individual cages and monitored. Feces were collected and streaked across a sterile white napkin to assay for the presence of the red carmine dye. The time from gavage to the initial appearance of carmine in the feces was recorded as the total intestinal transit time for that animal
Induction of glia depletion
Mice expressing iDTR (ROSA26iDTR) were crossed to Sox10-creERT or Plp1-cre mice for specific depletion of glia cells. Mice were i.p. injected with 100 mg/kg body weight tamoxifen on two consecutive days followed by 2 i.p. injections of diphtheria toxin (DT) at a dose of 10 ng/kg body weight on 2 consecutive days. For specific depletion of peripheral glia cells mice were injected twice with BRAINSPAReDT at a dose of 10 ng/kg body weight on 2 consecutive days. Glia depletion was performed before initiation of stress and DSS treatment, respectively.
Induction of enteric neuron depletion
Mice expressing iDTR (ROSA26iDTR) were crossed to Hand2-cre mice for specific depletion of enteric neurons and glia. Mice were i.p. injected with 100 mg/kg body weight tamoxifen on two consecutive days followed by 2 i.p. injections of diphtheria toxin (DT) at a dose of 10 ng/g body weight on 2 consecutive days.
Induction of CCR2+ leukocyte depletion
Mice expressing the diphtheria toxin receptor in CCR2+ cells (CCR2 DTR) were i.p. injected with 10 ng/g body weight diphtheria toxin (DT) 1 day prior and every 72 h throughout the experiment.
Serum collection
Blood was collected from the submandibular vein by cheek punch. Blood was collected in 1.1-ml z-gel micro tubes (SARSTEDT AG &Co. KG, 41.1500.005) and centrifuged at 10,000 × g for 5 min. The serum was removed and stored at −80°C until use.
Lipocalin-2 ELISA
Lipocalin-2 concentrations in fecal samples were measured using a mouse lipocalin-2 ELISA kit (R&D Systems) according to the manufacturer’s protocol. 10 μl PBS were added per mg of stool, and a 1:1000 dilution was measured by ELISA.
Norepinephrine ELISA
Norepinephrine concentrations were measured in serum samples and tissue lysates using a norepinephrine ELISA kit (IBL-America, IB89537) according to the manufacturer’s instructions.
Acetylcholine assay
Acetylcholine concentrations were measured using a kit (Invitrogen Amplex® Red Acetylcholine Assay Kit, A12217) according to the manufacturer’s instructions.
Two centimeters of the mid colon, 4 cm distal to the ceco-colonic junction, was dissected and then homogenized in a bead tube at a concentration of 100 mg/ml in the reaction buffer. The tubes were centrifuged for 10 min at 4°C, 10,000 × g, and the supernatant was diluted 1/10 in the same buffer and measured according to the manufacturer’s instructions.
Corticosterone ELISA
Corticosterone concentrations were measured with an ultrasensitive corticosterone enzyme-linked immunosorbent assay (ELISA) kit (DRG International, EIA-4164) according to the manufacturer’s instructions.
Two centimeters of the mid colon, 4 cm distal to the ceco-colonic junction, was dissected and then homogenized in a bead tube at a concentration of 100 mg/ml in the reaction buffer. The tubes were centrifuged for 10 min at 4°C, 10,000 × g, and the supernatant was diluted 1/10 in the same buffer and measured according to the manufacturer’s instructions.
Dexamethasone ELISA
Dexamethasone concentrations were measured using an enzyme-linked immunosorbent assay (ELISA) kit (Elabscience, E-FS-E009) according to the manufacturer’s instructions. Whole colon was homogenized in a bead tube at a concentration of 100 mg/ml in PBS. Dexamethasone was extracted from serum or tissue lysate using ethyl-acetate and resuspended in ELISA buffer according to the manufacturer’s instructions.
IL-6 ELISA
IL-6 concentrations were measured in serum samples using an enzyme-linked immunosorbent assay (ELISA) kit (R&D Systems, DY406-05) according to the manufacturer’s instructions.
TNF ELISA
TNF concentrations were measured in cell culture supernatants using an enzyme-linked immunosorbent assay (ELISA) kit (Thermo Fisher Scientific, 88-7324-22) according to the manufacturer’s instructions.
Measuring of cell proliferation
Proliferating cells in the colon of mice were visualized using the Click-iT™ EdU Alexa Fluor™ 647 Imaging Kit according to the manufacturer’s instructions. Mice were exposed to restraint stress for 21 consecutive days and injected with EdU i.p. (33 mg/kg body weight) on days 8 and 9. Mice were sacrificed on day 21 and the colon was dissected and further processed for whole-mount immunofluorescence imaging.
Whole-mount intestine immunofluorescence
In brief, mice were sacrificed by cervical dislocation, the colon was removed, and placed in ice-cold PBS. The intestine was cut open longitudinally and the luminal contents were gently washed away in PBS. The tissue was pinned down in a plate coated with Sylgard and then fixed for 30 minutes using 4% paraformaldehyde (PFA) with gentle agitation. After washing in PBS, whole-mount samples were dehydrated in 100% Methanol and permeabilized in Dent’s Bleach for 1 h at room temperature with gentle shaking. Samples were then blocked for 12 h in blocking buffer (0.5% PBST + 0.02% NaN3 with 5% donkey serum) at 4°C with gentle agitation. Next, antibodies were diluted in blocking buffer at appropriate concentrations and added to tissue samples for three days at 4°C. After primary antibody incubation, the tissue was washed three times in PBS and then incubated in blocking buffer with secondary antibodies (1:400 in blocking buffer) for 24 hours at 4°C. Samples were again washed three times in PBS, dehydrated in an ascending methanol series (50%, 70%, 80%, 95%, 100%, 100%, 100%) at room temperature, then cleared with BABB (Murray’s Clear) and mounted in Murray’s Clear on slides. Slides were kept in the dark at 4°C until they were imaged.
Whole-mount intestine samples were imaged on an inverted LSM 710 laser scanning confocal microscope.
Quantification of enteric neurons
Tile scans of 1 cm x 1 cm pieces of whole-mount colons were imaged at 10x magnification. Alternatively, at least 5 view fields (size 502021 μm2) at 20x magnification were imaged. Images were then analyzed using ImageJ. Image brightness was adjusted, auto thresholding on single channels (Otsu) was applied and HuC/D+ cells were counted automatically. Count data was then divided by the size of the surveyed area (size 502021 μm2) and multiplied by 100,000 to calculate the number of counted neurons per 0.1 mm2. In case of insufficient staining quality for automatic quantification, nNOS1+ and ChAT+ neurons as well as Nestin+ cells were counted manually. All investigators were blinded during quantifications. Every data point of a given graph corresponds to a single animal. ChAT+ neurons and nNOS+ were normalized to the count of HuC/D+ neurons.
Colonoscopy in mice
Colonoscopy was performed using a high-resolution mouse video endoscopic system (Carl Storz, Tuttlingen, Germany). The colonoscope was advanced until the proximal colon. Macroscopic grading of colitis severity was determined based on translucency (0-3), vascularity (0-3), granularity (0-3), fibrin (0-3) and appearance of fecal content (0-3). Colonoscopy scores reflect composite scores (0-15).
Isolation of colonic leukocytes
The intestine was flushed with cold PBS, opened longitudinally, and cut into 0.5 cm pieces. Epithelial cells and mucus were removed by incubation (45 min) with dissociation buffer at 37°C (HBSS (without Ca2+ and Mg2+), 5% FBS, 2 mM EDTA, and 0.15 mg/ml (1 mM) DTT (Sigma)). After removing epithelial cells, the remaining intestinal pieces were washed thoroughly in cold PBS and then digested in HBSS containing 5% FBS, 0.6 mg/ml Collagenase V (Sigma), 1.25 mg/ml collagenase D (Sigma), 1 mg/ml Dispase II (Sigma) and 0.1 mg/ml DNase I (Roche) for 45 min at 37°C shaking at 250 rpm. The digested cell suspension was washed with PBS and passed sequentially through 100 and 40 μm cell strainers. Lamina propria leukocytes were then used for FACS analysis or cell sorting.
Flow cytometry analysis of intestinal leukocytes
Leukocytes were isolated from the colon (as described above). Cell viability staining was performed using the LIVE/DEAD Fixable Aqua Cell Stain Kit (ThermoFisher) according to the manufacturer’s protocol. Intestinal lamina propria cells were stained with antibodies against CD45, TCRB, CD90, CD3, CD5, CD19, CD11b, CD11c, MHCII, CSF1-R, CX3CR1, Ly6C, Ly6G, CD64, CD103 (see antibody table for details). All samples were acquired by flow cytometry (FACS LSR D; BD Biosciences) and analyzed using the FlowJo software (Tree Star Inc, Ashland, OR, USA).
RNA extraction and RT–qPCR analysis
Total RNA was extracted using TRIzol™ (Invitrogen, 15596026) according to the manufacturer’s protocol and reverse transcribed using the High-Capacity cDNA Reverse Transcription Kit (4368814, Applied Biosystems). RT–qPCR was performed with the QuantiFast SYBR Green PCR Kit 2000 (204056, Qiagen) on an Applied Biosystems CFX96 machine. Expression data were normalized to Gapdh mRNA levels unless stated otherwise. The data are presented in arbitrary units and were calculated using the delta CT method.
H&E histology & pathological scoring
For histology, the colon was fixed with 10% buffered formalin immediately after euthanasia and kept overnight at 4°C. After fixation, the samples were transferred into 70% ethanol before paraffin embedding. 5 μm thick sections were cut in the sagittal plane for staining with hematoxylin and eosin (H&E). Colitis severity was evaluated based on pathological grading of H&E-stained sections by a board-certified pathologist in a blinded fashion. Composite scores are divided in 4 grades: Acute inflammation (0-3), crypt distortion (0-3), erosion (0/1), ulceration (0/1), apoptosis (0-3).
Monocyte stimulation
Bone marrow was harvested, and red blood cells were lysed using ACK lysis buffer according to the manufacturer’s instructions. Monocytes were isolated by Magnetic-activated cell sorting (MACS) using the Miltenyi Monocyte Isolation kit. Monocytes were plated in a TC treated 24 well plate (~150.000 cells per well) in D10 media (DMEM, 10% FBS, 1% Penicillin-Streptomycin) supplemented with 10 ng/μl of recombinant mouse CSF-1 or no CSF-1 and incubated for 16 h at 37°C. Then cells were stimulated with LPS (1 μg/ml) for 6 h where indicated before supernatant was collected for further analysis.
RNA library preparation and sequencing
Libraries were prepared using the Illumina TruSeq stranded mRNA kit with Illumina TruSeq unique dual indices according to the manufacturer’s instructions. Quality and quantity control of RNA and libraries were performed using an Agilent 4200 TapeStation and Qubit 4, respectively. Libraries were sequenced on an Illumina NextSeq 550 instrument to produce 75–base pair single-end reads with an average sequencing depth of 14 M reads per sample. Raw reads were mapped to the mouse reference transcriptome (Ensembl; Mus musculus version 67) using Kallisto50 version 0.46. Subsequent analysis was carried out using the statistical computing environment R version 3.6.1 in RStudio and Bioconductor51 version 3.8. Briefly, transcript quantification data were summarized to genes using the tximport package52 and normalized using the trimmed mean of M values (TMM) method in edgeR53. Genes with <1 CPM in n+1 of the samples, where n is the size of the smallest group of replicates, were filtered out. Differential Gene Expression was tested with limma-voom54,55 by fitting a linear model and extracting empirical Bayes statistics.
Single-Cell RNA-seq
For single-cell RNA sequencing paired total colon samples of control (n=2) and stressed (n=2) mice were collected after 7 days of restraint stress. Total colonic leukocytes were isolated as described above and brought into single-cell suspensions. Cell suspensions were stained with DAPI and sorted on a BD FACSAria Fusion sorter (BD Biosciences). Sorted cells were then immediately encapsulated into droplets and libraries prepared using the 10X Genomics platform and libraries sequenced on an Illumina NextSeq. BCL files were demultiplexed, aligned to Mus musculus mm10 genome, filtered, and UMI counted using CellRanger software v5.0 (10X Genomics), and downstream analysis performed with Seurat v4 (Stuart et al., 2019). Data were filtered to remove cells with high mitochondrial reads (>20%), low gene detection (<200), and high gene detection (>4,000). Since certain B-cell and plasma cell genes (e.g. Igkc and Jchain) were highly expressed by lots of cells, we removed the contaminating reads using the decontX workflow56.
Normalization was performed with SCTransform57 and integrated58. Subsequently, cells were clustered using Louvain clustering (resolution = 0.5), and UMAP was used for visualization (assay = “SCT”, dims = 1:30). After normalization and clustering, we used ALRA (Adaptively thresholded Low-Rank Approximation)59 to impute the RNA count matrix and fill in technical dropouts.
Single-Nucleus RNA-seq of the ENS
For single-nuclei RNA sequencing paired total colon samples of control (n=2), stress (n=3), and dexamethasone-treated Sun1-GFP(INTACT)Sox10 mice were collected after 7 days of restraint stress. Total colon tissue samples were rinsed, washed in cold PBS, and immediately placed on a Petri dish containing 5 ml nuclei isolation buffer (10 mM Tris pH 7.5, 25 mM KCL, 5 mM MgCl2, 250 mM sucrose, 0.1 mM DTT, 1x Complete protease Inhibitors (Roche), RNasin Plus 0.1 U/μl, 0.1% Triton) on top of a crushed ice bed. Tissue samples were chopped with a razor blade into small pieces, transferred into a 15 ml Falcon tube containing Triton, and mixed by pipetting up and down. Samples were incubated 5 min on ice with shaking every minute. After incubation 10 ml nuclei isolation buffer was added, and samples were filtered through a 40 μm cell strainer into a 15 ml Falcon tube. Samples were centrifuged for 10 min at 4°C, supernatant gently aspirated leaving about 50 μl that was resuspended with 400 μl PBS + 1% BSA. Before sorting samples were filtered through a 40 μl mesh into a FACS tube and DAPI was added before loading. Samples were sorted on a BD FACSAria Fusion sorter (BD Biosciences) (Gating see Fig. S.5A). Sorted nuclei were then immediately encapsulated into droplets and libraries prepared using the 10X Genomics platform and libraries sequenced on an Illumina NextSeq. BCL files were demultiplexed, aligned to mouse mm10 genome, filtered, and UMI counted using CellRanger software v5.0 (10X Genomics). Data was read into the Seurat single cell genomics software (v. 3.2.2) in R (v. 4.1.0). Quality control of libraries was performed to remove: (1) low-quality cells or empty droplets, (2) cell doublets or multiplets, and (3) low-quality/dying cells with extensive mitochondrial contamination. Cells expressing less than 20% mitochondrial genes with unique feature counts over 200 and less than 4000 were kept. Cell-cell normalization was performed using the LogNormalize method. Highly variable features were found using the “vst” selection method, and data was scaled to standardize the range of features, giving equal weight to each gene so highly expressed genes did not dominate analyses. This was also a preprocessing step for principal component analysis (PCA). PCA was performed on scaled data as a form of linear dimensional reduction; 50 principal components (PCs) were computed and stored. The majority of true signal (dimensionality of the dataset) was found to be captured in the first 20 PCs evidenced by an ElbowPlot. Clustering was performed on the PCA-reduced expression data at a resolution of 0.25 for the first 20 PCs. This was done using the nearest neighbor method based on Jaccard similarity. The resolution was selected based on results from analysis using the clustree package (v. 0.4.3). Resolutions tested were 0.1, 0.25, 0.3, 0.4, 0.5, 0.6, 0.75, and 0.9. Clustering for the first 20 PCs was visualized using uniform manifold approximation and projection (UMAP), a nonlinear dimensionality reduction technique, which places similar cells together in a low-dimensional space. Cells were annotated manually and automatically. For automatic annotation, SingleR (v. 1.4.0), an unbiased, reference-based single-cell RNA seq annotation algorithm, was used. A reference dataset of samples with known labels is used by the algorithm to assign labels to the user’s dataset based on expression profile similarities. Here, the reference dataset used was MouseRNAseqData, containing mouse bulk expression data of sorted cell populations. The dataset was obtained through the celldex package (v. 1.0.0). SingleR returned labels for cell types within each cluster. For manual annotation, marker genes for glia (Sox10, Gfra1, Gfap, Plp1, Gas7), nNos+ neurons (Nos1, Vip, Etv1), ChAT+ neurons (Chat, Tac1, Penk, Casz1), and neurons (Casz1, Rbfox3, Gap43, Elavl3) were mapped onto the UMAP using the FeaturePlot() function in Seurat. Expression levels for each cluster were visualized using the VlnPlot() function in Seurat. Overall unbiased, automatic annotation and manual annotation were used in conjunction to annotate clusters. The glia cluster was subsetted from the full ENS UMAP. The same procedure was followed starting with cell-cell normalization, except Seurat v. 4.0.1 was used to allow us to perform multimodal reference mapping with the dexamethasone dataset.
Glia identified from the dexamethasone dataset were defined as the ‘query’ object, and glia from the restraint-stress dataset was defined as the ‘reference’ object. Transfer anchors were determined using log normalization, PCA as the reference reduction, and the first 30 dimensions. Data were then transferred to the reference dataset, also using the first 30 dimensions. Transfer products were added as metadata to the query object, and query data was projected onto the UMAP structure of the reference object (glia from restraint stress).
NicheNet Ligand-Receptor Analysis
Ligand-receptor analysis was performed using NicheNet (v. 1.0.0), a method that predicts which ligands in a ‘sender cell’ population regulate gene expression in a ‘receiver’ population. NicheNet was the preferred method for ligand-receptor analysis, as it predicts which ligands influence gene expression in other cells and what target genes are affected by each ligand. It does this by first prioritizing ligands based on how well a ligand can predict observed differentially expressed genes in the receiver population. It then infers active-ligand target links to see which prioritized ligands regulate which differentially expressed genes in the receiver cells. This goes beyond other models that solely predict ligand-receptor interactions where specific gene targets are not considered.
Analysis Pipeline.
To perform NicheNet analysis, sender (eGAPS) and receiver (Mono1, Mono2, Mac1, Mac2) populations were defined. A geneset of interest was also defined, which are genes in the receiver population that may be affected by ligands in the senders. Here, the geneset of interest was defined as differentially expressed genes between stressed and control conditions in the receiver populations. Differentially expressed genes between control and stress (adjusted p-value < 0.05) were determined using Seurat (v. 3.2.2). Background genes were defined as any genes that were not differentially expressed. NicheNet network gene symbols were also converted from human to mouse. NicheNet first defined a set of potential ligands, which are ligands that are expressed by the sender cell population and bind to a putative receptor expressed by the target population. Ligand-activity analysis was then performed, which ranked the previously defined potential ligands based on their level of regulation of genes in the geneset of interest compared to the background gene set. Pearson correlation was used to determine ligand activity; calculated coefficients were between the ligand’s target predictions and the observed transcriptional response. As there was overlap in terms of which cell types expressed which ligands/receptors, ligands, and receptors were assigned to their respective cell types by observing which cell types expressed the respective ligand/receptor to a degree that was higher than the average plus the standard deviation. Active ligand target links (receptors and genes targeted by top-ranked ligands) were then determined.
Visualization Pipeline.
CircosPlot (from Circlize package v. 0.4.13) was used to display the most significant ligand-target links, links comprising the bottom 95% of lowest regulatory potential scores were removed. Each segment of ligands and targets was given a specific color and order and gaps were defined between the different segments. Links were made transparent based on ligand-target potential score; the lower the score, the more transparent the link.
ENS Diffusion Pseudotime
Diffusion pseudotime (DPT) was performed in Python (v. 3.0), and DPT values were then loaded into Seurat (v. 3.2.2) for further analysis.
DPT.
Control, restraint stress, and dexamethasone data (output of cellranger pipeline from 10x) were imported into Python. Data were preprocessed, filtering out (1) cells with less than 200 genes expressed and (2) genes detected in less than three cells. Cells were then again filtered, keeping cells (1) with greater than 200 genes and less than 400 genes, and (2) expressing less than 20% mitochondrial genes. Variable features were then determined, and data were normalized and scaled. Annotations (cell identities) from Seurat were added, and PCA, neighbors, and UMAP dimensionality reduction were computed. The cell with the highest expression of Nestin was chosen as the root cell, and pseudotime was subsequently calculated. Pseudotime values were then exported.
Seurat finalization.
We first created a control/stressed/dexamethasone Seurat object following the pipelines outlined above. We then subsetted this object to only include mature neurons and enteric neuronal progenitor cells (ENPCs). ENPCs were defined as Nestin (a canonical ENPC marker) expressing cells without Plp1 expression in order to filter out overlapping glia cells. DPT values from Python were added to the object as metadata.
QUANTIFICATION AND STATISTICAL ANALYSIS
Data are presented as mean ± SEM. The significance of the differences between more than two groups was evaluated using ANOVA followed by Sidak’s multiple comparison test. Comparisons between two conditions were analyzed by paired or unpaired 2-tailed student’s t-test or Mann-Whitney U test dependent on normality of the data. Tests were two-sided unless a one-sided hypothesis was tested. The significance of differences in datasets consisting of repeated measurements over time (e.g., body weight development over time) were evaluated by multiple unpaired two-tailed t-tests (one per timepoint) with Holm-Sidak correction. If not indicated otherwise, asterisks in the respective figures indicate significant differences between the conditions “stress” and “stress + respective intervention”. Significance of differences between two groups in survival datasets was determined by Log-rank (Mantel-cox) test. A p-value < 0.05 was considered significant. In figures, asterisks denote statistical significance (* p<0.05; ** p<0.01; *** p<0.001; **** p<0.0001), unless indicated otherwise. Experiments were repeated at least twice. Statistical analysis was performed in GraphPad PRISM 8. For clinical UKB data, all continuous variables were analyzed by unpaired, two-tailed t-tests or Mann-Whitney U test, and by an appropriate multivariable model corrected for age, sex and BMI. The results are presented as mean ± SEM (normal distribution). All categorical variables were displayed as relative (%) frequencies and the corresponding contingency tables were analyzed using the Chi-square test. HRs were calculated using Cox proportional hazard regression models. Multivariable logistic regression was performed to test for independent associations. Differences were considered to be statistically significant when p<0.05. The data were analyzed using R version 4.0.2 (R Foundation for Statistical Computing; Vienna, Austria), SPSS Statistics version 26 (IBM; Armonk, NY, USA) and Prism version 8 (GraphPad, LaJolla, CA, USA).
ADDITIONAL RESOURCES
The clinical trial identifier for the myIBDcoach study is NCT02173002.
Supplementary Material
Figure S1. Psychological stress exacerbates intestinal inflammation in different housing conditions, Related to Figure 1.
(A-C) Colitis readouts after experimental stress paradigm.
(D) Bulk RNA-sequencing after 7 days of stress. Heatmap of significantly differentially expressed genes.
(E-F) Relative colonic gene expression levels of Tnf (E) and Il6 (F) determined by RT-qPCR (normalized to Gapdh).
(G-J) Colitis readouts of mice housed under thermoneutral (30°C) (G-J) and enriched (K-N) conditions. Statistical comparison in (K) is between “control + enrichment” and “stress + enrichment”.
(O and P) Food intake (O) and water consumption (P).
(Q-T) Colitis readouts after an adjusted experimental protocol with limited daily DSS supply to normalized DSS intake between groups (s. methods).
(U and V) Absolute body weight change of mice undergoing the standard experimental paradigm (U) or an extended experimental protocol (16 days of stress prior to DSS treatment).
Figure S2. Psychological stress exacerbates intestinal inflammation in several independent mouse models, Related to Figure 1
(A) Schematic representation of experimental stress-colitis model with different stress exposure periods.
(B-E) Colitis readouts.
(F-I) Colitis readouts after social stress.
(J-S) Colitis readouts of Il10−/− mice (J-N) and wildtype mice (O-S) exposed to restraint stress. Colonoscopy was performed after 30 days of daily stress.
Figure S3. Colonic T- or B-cells do not promote stress-induced inflammation, Related to Figure 1.
(A) Dot plot visualization showing relative marker gene expression.
(B) UMAP embedding of 23,696 colon leukocytes after 7 days of stress.
(C) Number of DEGs in the individual UMAP clusters.
(D) Gating strategy for TH17 cells using IL-17-GFP-reporter mice.
(E) Relative abundance of TH17 cells (as % of CD45+/TCRB+ cells) from ileum after 7 days of stress.
(F-I) Colitis readouts of Rag−/− mice.
Figure S4. Colonic myeloid cells promote stress-induced inflammation, Related to Figure 1
(A and B) Gating strategy (A) and relative abundance (B) of IL-22+ ILC3 (as % of CD45+/TCRB+ cells) in ileum after 7 days of stress using IL-22-tdTomato reporter mice.
(C-F) Colitis readouts in Il22−/− mice.
(G) Relative gene expression (normalized to Gapdh) of Il23r after 7 days of stress.
(H and I) Colitis readouts of mice injected with anti-IL-23.
(J) Weight development of Rag2−/−/Il2rg−/− mice.
(K) Dot plot visualization showing relative marker gene expression.
(L) Number of DEGs in the individual UMAP clusters.
(M) Relative abundance of colonic Ly6C+ MHCII− monocytes (as % of CD45+ Ly6G− CD11b+). CCR2+ cells were depleted with diphtheria toxin.
(N-R) Serum IL-6 levels (N) and colitis readouts (O-R) of anti-IL-6-treated mice.
Figure S5. Canonical stress mediators modulate colitis, Related to Figure 2.
(A and B) Norepinephrine levels after 3 h of stress in serum of untreated mice (A) and in spleen and colon tissue lysates of 6-OHDA and vehicle-treated mice (B).
(C-J) Colitis readouts of 6-OHDA-treated mice (C-G) and ICI-118,551 treated mice (H-J).
(K) Corticosterone serum levels of antalarmin-treated mice after 3 h of stress.
(L-O) Colitis readouts of antalarmin-treated mice.
(P-T) Serum corticosterone levels of sham and adrenalectomy mice (P), and colitis readouts.
(U-X) Levels of corticosterone in serum (U) and tissue (W), and levels of dexamethasone in serum (V) and tissue (X) of control, stressed, and dexamethasone-treated mice (for 7 days).
(Y-AB) Colitis readouts after low-dose dexamethasone treatment.
Figure S6. Colitis is modulated by ENS-specific glucocorticoid signaling, Related to Figures 3 and 4
(A-D) Colitis readouts of Nr3c1Vil1 mice.
(E and F) Food intake (E) and water consumption (F) of Nr3c1fl/fl and Nr3c1Hand2 mice.
(G-L) Colitis readouts (G-J), and relative gene expression levels of Il6 (K) and Ccr2 (L) determined by RT-qPCR (normalized to Gapdh) of mice treated with anti-IL-10R mAb and stressed for 30 days.
Figure S7. Psychological stress affects enteric glia cells, Related to Figures 3 and 4
(A) FACS of colonic nuclei isolated from Sox10-cre INTACT (Sun1-GFP) transgenic mice.
(B-D) Relative marker gene expression in UMAP embedding of snRNAseq data of sorted Sox10 lineage-positive nuclei.
(C) Geneset enrichment analysis of Bioplanet pathways of the top 150 differentially up-or downregulated genes in eGAPS.
(D) Volcano plot of differentially expressed genes in eGAPS.
(E and F) Representative whole-mount staining (E) and quantification (F) of GFAP in the myenteric plexus of iDTRSox10 and iDTRfl/fl mice treated with diphtheria toxin (DT).
(G) Survival of dexamethasone-treated iDTRfl/fl or iDTRPlp1 mice.
(H and I) Representative whole mount staining (H) and quantification (I) of GFAP in the myenteric plexus of iDTRSox10 or iDTRPlp1 mice treated with pegylated diphtheria toxin (BRAINSPAReDT).
(J) Relative gene expression level of Csf1 determined by RT-qPCR in the colon of mice treated with anti-IL-10R for 4 weeks.
(K) Relative Csf1r mRNA expression across different UMAP clusters.
(L) Schematic of the isolation of monocytes and subsequent treatment in in vitro experiments.
(M) TNF levels in supernatant of monocyte cultures determined by ELISA.
Figure S8. Psychological stress affects enteric neurons, Related to Figures 5 and 6
(A-E) Relative marker gene expression in UMAP embedding of snRNAseq data of sorted Sox10 lineage-marked nuclei.
(F) Relative contributions of cells from stressed and control mice to ENPC, ChAT+ and nNOS+ neuron clusters identified by snRNA-seq. (G-I) Colitis readouts of nicotine-treated mice.
(J) Whole-mount IF staining for HuC/D and EdU (scale bar 50 μm) to measure proliferating neurons in the colon.
(K) Quantification of HuC/D+ neurons in distal colon myenteric plexus of stress and control mice after 7 days of stress and after 7 days of stress followed by 4 days of 2% DSS treatment.
(L-N) Whole-mount IF staining for HuC/D and nNOS (scale bar 62μm) (L), relative acetylcholine (ACh) levels in colon lysates (M), and intestinal transit time (N) of iDTRfl/fl and iDTRHand2 mice.
(O-Q) Intestinal transit time of Nr3c1plp1/Sox10 (O), anti-CSF1 treated (P), and anti-TNF treated mice after 7 days of stress.
(R-T) Whole mount IF staining for HuC/D, ChAT (GFP) and nNOS (scale bar 62 μm) (R), relative abundance of ChAT (S) and nNOS neurons (T) of anti-TNF treated mice after 7 days of stress.
(U and V) Survival (U), and relative abundance of Ly6C+MHCII− monocytes (as % of CD45+ Ly6G− CD11b+) (V) of stressed mice after anti-TGFβ treatment.
Figure S9. Psychological stress is associated with severe IBD, Related to Figure 7
(A and B) Kaplan-Meier survival curve of control and stressed patients with ulcerative colitis (A) or Crohn’s disease (B) with adjusted hazard ratio (aHR) for age, sex, BMI.
(C-F) Blood leukocyte count (C and D), and dissatisfaction with bowel habits (E and D) in ulcerative colitis and Crohn’s disease in UK Biobank participants.
(G-L) Presence of obstipation (G and H), experiencing of “current abdominal distension” (I and J) and bowel surgery or ileus in medical history (all in %) (K and L) in ulcerative colitis and Crohn’s disease in UK Biobank participants.
(M) Schematic of study populations (disease-free, rheumatoid arthritis, irritable bowel syndrome) from the UK Biobank.
(N-AB) Abdominal distension (N, S, X), dissatisfaction with bowel habits (scale 0-10) (O, T, Y), obstipation (P, U, Z), blood monocytes (Q, V, AA), and serum CRP (R, W, AB) in disease-free individuals (N-R), individuals with rheumatoid arthritis (S-W), and individuals with irritable bowel syndrome (X-AB).
Highlights.
Psychological stress leads to monocyte-mediated exacerbation of gut inflammation
Chronic glucocorticoid signaling drives the effect of stress on IBD
Stress induces inflammatory enteric glia that promote monocyte recruitment via CSF1
Stress provokes transcriptional immaturity in enteric neurons and dysmotility
Acknowledgments
We acknowledge the UPenn Molecular Pathology and Imaging Core and the CDB Microscopy Core Facility, Vanda Lennon (Mayo Clinic) for ANNA-1 antibody, Ana Domingos (Oxford) for BRAINSPAReDT, Richard Flavell (Yale), Scott Durum (NIH/NCI) and Michael Abt (UPenn) for mouse lines, the Shalem lab (CHOP) for cell sorting, and the I3 Study team for sample collection. K.M.S. received a postdoctoral fellowship of the German Research Foundation (DFG, SCHN 1626/1-1), P.L. was supported by NIH F31HL160065 and 5T32AI141393-03, J.K. and S. Kircher received a Boehringer Ingelheim MD Fellowship, and N.B. and S. Kardo were supported by the German National Academic Foundation. E.J.W. is supported by NIH grants AI155577, AI115712, AI117950, AI108545, AI082630, CA210944 and by the Parker Institute for Cancer Immunotherapy. R.O.H. is supported by the Irma and Norman Braman Endowment, the Suzi and Scott Lustgarten Center Endowment, the Children’s Hospital of Philadelphia (CHOP) Research Institute, the CHOP Center for Precision Diagnosis and Therapy for Pediatric Motility Disorders Frontier Program, NIH 1R01DK122798-01A1, 1R01DK129691-01, 1R01DK128282, and 1R21NS116574-01A1. M.L. is a Searle Scholar and Pew Biomedical Scholar and is supported by the NIH Director’s New Innovator Award (DP2-AG-067511), the W.W. Smith Charitable Trust, an American Cancer Society Scholar Award, the Edward Mallinckrodt Jr Foundation, the Prevent Cancer Foundation, the Abramson Cancer Center (P30-CA-016420 Pilot), the Basser Center, the Penn-CHOP microbiome program, the Penn Center for Research on Coronavirus and Other Emerging Pathogens, the Penn Institute for Immunology, the Penn Center for Nutritional Science and Medicine, the Penn Center for Molecular Studies in Digestive and Liver Diseases (P30-DK-050306), Penn Center for Precision Medicine (P30-DK-050306), the Penn Institute on Aging, the Penn Center of Excellence in Environmental Toxicology (P30-ES-013508), and the Borrelli Family Lynch Syndrome grant. C.A.T. is a Pew Biomedical Scholar and a Kathryn W. Davis Aging Brain Scholar, and is supported by the NIH Director’s New Innovator Award (DP2AG067492), NIH 1R01DK129691-01, the Human Frontier Science Program, the Edward Mallinckrodt, Jr. Foundation, the Global Probiotics Council, the IDSA Foundation, the Thyssen Foundation, the PennCHOP Microbiome Program, the Penn Institute for Immunology, the Penn Center for Molecular Studies in Digestive and Liver Diseases (P30-DK-050306), the Penn Diabetes Research Center (P30-DK-019525), the Penn Institute on Aging, the Penn Institute for Infectious & Zoonotic Diseases, the University Research Foundation and the Dean’s Innovation Fund of the University of Pennsylvania, and a Borrelli Family Lynch Syndrome grant. The study has been approved by the UKB Access Committee (Projects #59657 and #71300), and data was used with the permission of the NHS England and UK Biobank.
Footnotes
Publisher's Disclaimer: This is a PDF file of an unedited manuscript that has been accepted for publication. As a service to our customers we are providing this early version of the manuscript. The manuscript will undergo copyediting, typesetting, and review of the resulting proof before it is published in its final form. Please note that during the production process errors may be discovered which could affect the content, and all legal disclaimers that apply to the journal pertain.
Declaration of interests
E.J.W. is an advisor for Danger Bio, Janssen, New Limit, Marengo, Pluto Immunotherapeutics Related Sciences, Rubius Therapeutics, Santa Ana Bio, Synthekine, and Surface Oncology. E.J.W. is a founder of and holds stock in Surface Oncology, Danger Bio, and Arsenal Biosciences. The other authors declare no competing interests.
Inclusion and diversity
We support inclusive, diverse, and equitable conduct of research. One or more of the authors of this paper self-identifies as an underrepresented ethnic minority in their field of research or within their geographical location. One or more of the authors of this paper self-identifies as a gender minority in their field of research. One or more of the authors of this paper self-identifies as a member of the LGBTQIA+ community.
REFERENCES
- 1.Haykin H, and Rolls A (2021). The neuroimmune response during stress: A physiological perspective. Immunity 54, 1933–1947. 10.1016/j.immuni.2021.08.023. [DOI] [PMC free article] [PubMed] [Google Scholar]
- 2.Liu YZ, Wang YX, and Jiang CL (2017). Inflammation: The common pathway of stress-related diseases. Frontiers in Human Neuroscience. 10.3389/fnhum.2017.00316. [DOI] [PMC free article] [PubMed] [Google Scholar]
- 3.Qing H, Desrouleaux R, Israni-Winger K, Mineur YS, Fogelman N, Zhang C, Rashed S, Palm NW, Sinha R, Picciotto MR, et al. (2020). Origin and Function of Stress-Induced IL-6 in Murine Models. Cell 182, 372–387.e14. 10.1016/jcel12020.05.054. [DOI] [PMC free article] [PubMed] [Google Scholar]
- 4.Chang JT (2020). Pathophysiology of Inflammatory Bowel Diseases. The New England journal of medicine 383, 2652–2664. 10.1056/NEJMra2002697. [DOI] [PubMed] [Google Scholar]
- 5.Sgambato D, Miranda A, Ranaldo R, Federico A, and Romano M (2017). The Role of Stress in Inflammatory Bowel Diseases. Current Pharmaceutical Design. 10.2174/1381612823666170228123357. [DOI] [PubMed] [Google Scholar]
- 6.Sun Y, Li L, Xie R, Wang B, Jiang K, and Cao H (2019). Stress Triggers Flare of Inflammatory Bowel Disease in Children and Adults. Frontiers in Pediatrics. 10.3389/fped.2019.00432. [DOI] [PMC free article] [PubMed] [Google Scholar]
- 7.Araki M, Shinzaki S, Yamada T, Arimitsu S, Komori M, Shibukawa N, Mukai A, Nakajima S, Kinoshita K, Kitamura S, et al. (2020). Psychologic stress and disease activity in patients with inflammatory bowel disease: A multicenter cross-sectional study. PLoS ONE. 10.1371/journal.pone.0233365. [DOI] [PMC free article] [PubMed] [Google Scholar]
- 8.Wintjens DSJ, de Jong MJ, van der Meulen-de Jong AE, Romberg-Camps MJ, Becx MC, Maljaars JP, van Bodegraven AA, Mahmmod N, Markus T, Haans J, et al. (2019). Novel Perceived Stress and Life Events Precede Flares of Inflammatory Bowel Disease: A Prospective 12-Month Follow-Up Study. Journal of Crohn’s & colitis 13, 410–416. 10.1093/ecco-jcc/jjyl77. [DOI] [PubMed] [Google Scholar]
- 9.McEwen BS, Bowles NP, Gray JD, Hill MN, Hunter RG, Karatsoreos IN, and Nasca C (2015). Mechanisms of stress in the brain. Nature neuroscience 18, 1353–1363. 10.1038/nn.4086. [DOI] [PMC free article] [PubMed] [Google Scholar]
- 10.Campos AC, Fogaçga MV, Aguiar DC, and Guimarães FS (2013). Animal models of anxiety disorders and stress. Revista Brasileira de Psiquiatria. 10.1590/1516-4446-2013-1139. [DOI] [PubMed] [Google Scholar]
- 11.Man K, Bowman C, Braverman KN, Escalante V, Tian Y, Bisanz JE, Ganeshan K, Wang B, Patterson A, Bayrer JR, et al. (2020). A thermogenic fat-epithelium cell axis regulates intestinal disease tolerance. Proceedings of the National Academy of Sciences of the United States of America 117, 32029–32037. 10.1073/pnas.2012003117. [DOI] [PMC free article] [PubMed] [Google Scholar]
- 12.Reber SO, Obermeier F, Straub RH, Falk W, and Neumann ID (2006). Chronic intermittent psychosocial stress (social defeat/overcrowding) in mice increases the severity of an acute DSS-induced colitis and impairs regeneration. Endocrinology 147, 4968–4976. 10.1210/en.2006-0347. [DOI] [PubMed] [Google Scholar]
- 13.Kühn R, Löhler J, Rennick D, Rajewsky K, and Müller W (1993). Interleukin-10-deficient mice develop chronic enterocolitis. Cell. 10.1016/0092-8674(93)80068-P. [DOI] [PubMed] [Google Scholar]
- 14.Maynard CL, and Weaver CT (2009). Intestinal Effector T Cells in Health and Disease. Immunity. 10.1016/j.immuni.2009.08.012. [DOI] [PMC free article] [PubMed] [Google Scholar]
- 15.Shaler CR, Parco AA, Elhenawy W, Dourka J, Jury J, Verdu EF, and Coombes BK (2021). Psychological stress impairs IL22-driven protective gut mucosal immunity against colonising pathobionts. Nature communications 12, 6664. 10.1038/s41467-021-26992-4. [DOI] [PMC free article] [PubMed] [Google Scholar]
- 16.Russell G, and Lightman S (2019). The human stress response. Nature Reviews Endocrinology. 10.1038/s41574-019-0228-0. [DOI] [PubMed] [Google Scholar]
- 17.Schiller M, Azulay-Debby H, Boshnak N, Elyahu Y, Korin B, Ben-Shaanan TL, Koren T, Krot M, Hakim F, and Rolls A (2021). Optogenetic activation of local colonic sympathetic innervations attenuates colitis by limiting immune cell extravasation. Immunity 54, 1022–1036.e8. 10.1016/j.immuni.2021.04.007. [DOI] [PMC free article] [PubMed] [Google Scholar]
- 18.Aǧaç D, Estrada LD, Maples R, Hooper LV, and Farrar JD (2018). The β2-adrenergic receptor controls inflammation by driving rapid IL-10 secretion. Brain, behavior, and immunity 74, 176–185. 10.1016/j.bbi.2018.09.004. [DOI] [PMC free article] [PubMed] [Google Scholar]
- 19.Matheis F, Muller PA, Graves CL, Gabanyi I, Kerner ZJ, Costa-Borges D, Ahrends T, Rosenstiel P, and Mucida D (2020). Adrenergic Signaling in Muscularis Macrophages Limits Infection-Induced Neuronal Loss. Cell 180, 64–78.e16. 10.1016/j.cell.2019.12.002. [DOI] [PMC free article] [PubMed] [Google Scholar]
- 20.Ungaro R, Mehandru S, Allen PB, Peyrin-Biroulet L, and Colombel J-F (2017). Ulcerative colitis. Lancet (London, England) 389, 1756–1770. 10.1016/S0140-6736(16)32126-2. [DOI] [PMC free article] [PubMed] [Google Scholar]
- 21.Poller WC, Downey J, Mooslechner AA, Khan N, Li L, Chan CT, McAlpine CS, Xu C, Kahles F, He S, et al. (2022). Brain motor and fear circuits regulate leukocytes during acute stress. Nature. 10.1038/s41586-022-04890-z. [DOI] [PMC free article] [PubMed] [Google Scholar]
- 22.Madalena KM, and Lerch JK (2017). The Effect of Glucocorticoid and Glucocorticoid Receptor Interactions on Brain, Spinal Cord, and Glial Cell Plasticity. Neural plasticity 2017, 8640970. 10.1155/2017/8640970. [DOI] [PMC free article] [PubMed] [Google Scholar]
- 23.Muzzi C, Watanabe N, Twomey E, Meers GK, Reichardt HM, Bohnenberger H, and Reichardt SD (2021). The Glucocorticoid Receptor in Intestinal Epithelial Cells Alleviates Colitis and Associated Colorectal Cancer in Mice. Cellular and molecular gastroenterology and hepatology 11, 1505–1518. 10.1016/jjcmgh.2020.12.006. [DOI] [PMC free article] [PubMed] [Google Scholar]
- 24.Rao M, Nelms BD, Dong L, Salinas-Rios V, Rutlin M, Gershon MD, and Corfas G (2015). Enteric glia express proteolipid protein 1 and are a transcriptionally unique population of glia in the mammalian nervous system. GLIA. 10.1002/glia.22876. [DOI] [PMC free article] [PubMed] [Google Scholar]
- 25.Mo A, Mukamel EA, Davis FP, Luo C, Henry GL, Picard S, Urich MA, Nery JR, Sejnowski TJ, Lister R, et al. (2015). Epigenomic Signatures of Neuronal Diversity in the Mammalian Brain. Neuron. 10.1016/j.neuron.2015.05.018. [DOI] [PMC free article] [PubMed] [Google Scholar]
- 26.Pereira MMA, Mahú I, Seixas E, Martinéz-Sánchez N, Kubasova N, Pirzgalska RM, Cohen P, Dietrich MO, López M, Bernardes GJL, et al. (2017). A brain-sparing diphtheria toxin for chemical genetic ablation of peripheral cell lineages. Nature Communications. 10.1038/ncomms14967. [DOI] [PMC free article] [PubMed] [Google Scholar]
- 27.Grubišić V, McClain JL, Fried DE, Grants I, Rajasekhar P, Csizmadia E, Ajijola OA, Watson RE, Poole DP, Robson SC, et al. (2020). Enteric Glia Modulate Macrophage Phenotype and Visceral Sensitivity following Inflammation. Cell Reports. 10.1016/j.celrep.2020.108100. [DOI] [PMC free article] [PubMed] [Google Scholar]
- 28.Chapoval AI, Kamdar SJ, Kremlev SG, and Evans R (1998). CSF-1 (M-CSF) differentially sensitizes mononuclear phagocyte subpopulations to endotoxin in vivo: a potential pathway that regulates the severity of gram-negative infections. Journal of leukocyte biology 63, 245–252. 10.1002/jlb.63.2.245. [DOI] [PubMed] [Google Scholar]
- 29.Farhin S, Wong A, Delungahawatta T, Amin JY, Bienenstock J, Buck R, and Kunze WA (2019). Restraint stress induced gut dysmotility is diminished by a milk oligosaccharide (2’-fucosyllactose) in vitro. PloS one 14, e0215151. 10.1371/journal.pone.0215151. [DOI] [PMC free article] [PubMed] [Google Scholar]
- 30.Margolis KG, Cryan JF, and Mayer EA (2021). The Microbiota-Gut-Brain Axis: From Motility to Mood. Gastroenterology 160, 1486–1501. 10.1053/j.gastro.2020.10.066. [DOI] [PMC free article] [PubMed] [Google Scholar]
- 31.Kasetti RB, Maddineni P, Patel PD, Searby C, Sheffield VC, and Zode GS (2018). Transforming growth factor β2 (TGFβ2) signaling plays a key role in glucocorticoid-induced ocular hypertension. The Journal of biological chemistry 293, 9854–9868. 10.1074/jbc.RA118.002540. [DOI] [PMC free article] [PubMed] [Google Scholar]
- 32.Hashimoto Y, Chiba T, Yamada M, Nawa M, Kanekura K, Suzuki H, Terashita K, Aiso S, Nishimoto I, and Matsuoka M (2005). Transforming growth factor beta2 is a neuronal death-inducing ligand for amyloid-beta precursor protein. Molecular and cellular biology 25, 9304–9317. 10.1128/MCB.25.21.9304-9317.2005. [DOI] [PMC free article] [PubMed] [Google Scholar]
- 33.de Jong MJ, van der Meulen-de Jong AE, Romberg-Camps MJ, Becx MC, Maljaars JP, Cilissen M, van Bodegraven AA, Mahmmod N, Markus T, Hameeteman WM, et al. (2017). Telemedicine for management of inflammatory bowel disease (myIBDcoach): a pragmatic, multicentre, randomised controlled trial. Lancet (London, England) 390, 959–968. 10.1016/S0140-6736(17)31327-2. [DOI] [PubMed] [Google Scholar]
- 34.de Jong MJ, Roosen D, Degens JHRJ, van den Heuvel TRA, Romberg-Camps M, Hameeteman W, Bodelier AGL, Romanko I, Lukas M, Winkens B, et al. (2019). Development and Validation of a Patient-reported Score to Screen for Mucosal Inflammation in Inflammatory Bowel Disease. Journal of Crohn’s & colitis 13, 555–563. 10.1093/ecco-jcc/jjy196. [DOI] [PubMed] [Google Scholar]
- 35.Vagianos K, Shafer LA, Witges K, Graff LA, Targownik LE, and Bernstein CN (2022). Self-reported flares among people living with inflammatory bowel disease are associated with stress and worry but not associated with recent diet changes: The Manitoba Living with IBD Study. JPEN. Journal of parenteral and enteral nutrition. 10.1002/jpen.2349. [DOI] [PubMed] [Google Scholar]
- 36.Campos-Melo D, Galleguillos D, Sánchez N, Gysling K, and Andrés ME (2013). Nur transcription factors in stress and addiction. Frontiers in Molecular Neuroscience. 10.3389/fnmol.2013.00044. [DOI] [PMC free article] [PubMed] [Google Scholar]
- 37.Saijo K, Winner B, Carson CT, Collier JG, Boyer L, Rosenfeld MG, Gage FH, and Glass CK (2009). A Nurr1/CoREST Pathway in Microglia and Astrocytes Protects Dopaminergic Neurons from Inflammation-Induced Death. Cell. 10.1016/j.cell.2009.01.038. [DOI] [PMC free article] [PubMed] [Google Scholar]
- 38.Stein RB, and Hanauer SB (2000). Comparative tolerability of treatments for inflammatory bowel disease. Drug Safety. 10.2165/00002018-200023050-00006. [DOI] [PubMed] [Google Scholar]
- 39.Pezzarossa A, Angiolini A, Cimicchi MC, D’Amato L, Valenti G, and Gnudi A (1987). ADRENAL SUPPRESSION AFTER LONG-TERM EXPOSURE TO OCCUPATIONAL CORTICOSTEROIDS FOLLOWED BY RAPID RECOVERY. The Lancet. 10.1016/S0140-6736(87)92132-5. [DOI] [PubMed] [Google Scholar]
- 40.Wilckens T, and De Rijk R (1997). Glucocorticoids and immune function: Unknown dimensions and new frontiers. Immunology Today. 10.1016/S0167-5699(97)01111-0. [DOI] [PubMed] [Google Scholar]
- 41.Hong JY, Lim J, Carvalho F, Cho JY, Vaidyanathan B, Yu S, Annicelli C, Ip WKE, and Medzhitov R (2020). Long-Term Programming of CD8 T Cell Immunity by Perinatal Exposure to Glucocorticoids. Cell. 10.1016/j.cell.2020.02.018. [DOI] [PMC free article] [PubMed] [Google Scholar]
- 42.Cruz-Topete D, and Cidlowski JA (2015). One hormone, two actions: anti- and pro-inflammatory effects of glucocorticoids. Neuroimmunomodulation 22, 20–32. 10.1159/000362724. [DOI] [PMC free article] [PubMed] [Google Scholar]
- 43.Sales-Campos H, de Souza PR, Basso PJ, Nardini V, Silva A, Banquieri F, Alves VBF, Chica JEL, Nomizo A, and Cardoso CRB (2017). Amelioration of experimental colitis after short-term therapy with glucocorticoid and its relationship to the induction of different regulatory markers. Immunology 150, 115–126. 10.1111/imm.12672. [DOI] [PMC free article] [PubMed] [Google Scholar]
- 44.Bruscoli S, Febo M, Riccardi C, and Migliorati G (2021). Glucocorticoid Therapy in Inflammatory Bowel Disease: Mechanisms and Clinical Practice. Frontiers in immunology 12, 691480. 10.3389/fimmu.2021.691480. [DOI] [PMC free article] [PubMed] [Google Scholar]
- 45.Waljee AK, Wiitala WL, Govani S, Stidham R, Saini S, Hou J, Feagins LA, Khan N, Good CB, Vijan S, et al. (2016). Corticosteroid Use and Complications in a US Inflammatory Bowel Disease Cohort. PloS one 11, e0158017. 10.1371/journal.pone.0158017. [DOI] [PMC free article] [PubMed] [Google Scholar]
- 46.Nemirovsky A, Ilan K, Lerner L, Cohen-Lavi L, Schwartz D, Goren G, Sergienko R, Greenberg D, Slonim-Nevo V, Sarid O, et al. (2022). Brain-immune axis regulation is responsive to cognitive behavioral therapy and mindfulness intervention: Observations from a randomized controlled trial in patients with Crohn’s disease. Brain, behavior, & immunity - health 19, 100407. 10.1016/j.bbih.2021.100407. [DOI] [PMC free article] [PubMed] [Google Scholar]
- 47.Wang A, Luan HH, and Medzhitov R (2019). An evolutionary perspective on immunometabolism. Science. 10.1126/science.aar3932. [DOI] [PMC free article] [PubMed] [Google Scholar]
- 48.Koren T, Yifa R, Amer M, Krot M, Boshnak N, Ben-Shaanan TL, Azulay-Debby H, Zalayat I, Avishai E, Hajjo H, et al. (2021). Insular cortex neurons encode and retrieve specific immune responses. Cell 184, 5902–5915.e17. 10.1016/j.cell.2021.10.013. [DOI] [PubMed] [Google Scholar]
- 49.Cohen S (1994). Perceived Stress Scale - Mind Garden. Mind Garden. [Google Scholar]
- 50.Bray NL, Pimentel H, Melsted P, and Pachter L (2016). Near-optimal probabilistic RNA-seq quantification. Nature Biotechnology. 10.1038/nbt.3519. [DOI] [PubMed] [Google Scholar]
- 51.Huber W, Carey VJ, Gentleman R, Anders S, Carlson M, Carvalho BS, Bravo HC, Davis S, Gatto L, Girke T, et al. (2015). Orchestrating high-throughput genomic analysis with Bioconductor. Nature Methods. 10.1038/nmeth.3252. [DOI] [PMC free article] [PubMed] [Google Scholar]
- 52.Soneson C, Love MI, and Robinson MD (2015). Differential analyses for RNA-seq: transcript-level estimates improve gene-level inferences. F1000research. 10.12688/flOOOresearch.7563.1. [DOI] [PMC free article] [PubMed] [Google Scholar]
- 53.Robinson MD, McCarthy DJ, and Smyth GK (2009). edgeR: A Bioconductor package for differential expression analysis of digital gene expression data. Bioinformatics. 10.1093/bioinformatics/btp616. [DOI] [PMC free article] [PubMed] [Google Scholar]
- 54.Ritchie ME, Phipson B, Wu D, Hu Y, Law CW, Shi W, and Smyth GK (2015). limma powers differential expression analyses for RNA-sequencing and microarray studies. Nucleic Acids Research 43, e47–e47. 10.1093/nar/gkv007. [DOI] [PMC free article] [PubMed] [Google Scholar]
- 55.Law CW, Chen Y, Shi W, and Smyth GK (2014). voom: precision weights unlock linear model analysis tools for RNA-seq read counts. Genome Biology 15, R29. 10.1186/gb-2014-15-2-r29. [DOI] [PMC free article] [PubMed] [Google Scholar]
- 56.Yang S, Corbett SE, Koga Y, Wang Z, Johnson WE, Yajima M, and Campbell JD (2020). Decontamination of ambient RNA in single-cell RNA-seq with DecontX. Genome Biology. 10.1186/sl3059-020-1950-6. [DOI] [PMC free article] [PubMed] [Google Scholar]
- 57.Hafemeister C, and Satija R (2019). Normalization and variance stabilization of single-cell RNA-seq data using regularized negative binomial regression. Genome Biology. 10.1186/sl3059-019-1874-l. [DOI] [PMC free article] [PubMed] [Google Scholar]
- 58.Stuart T, Butler A, Hoffman P, Hafemeister C, Papalexi E, Mauck WM, Hao Y, Stoeckius M, Smibert P, and Satija R (2019). Comprehensive Integration of Single-Cell Data. Cell. 10.1016/j.cell.2019.05.031. [DOI] [PMC free article] [PubMed] [Google Scholar]
- 59.Linderman GC, Zhao J, Roulis M, Bielecki P, Flavell RA, Nadler B, and Kluger Y (2022). Zeropreserving imputation of single-cell RNA-seq data. Nat Commun 13, 192. 10.1038/s41467-021-27729-z. [DOI] [PMC free article] [PubMed] [Google Scholar]
Associated Data
This section collects any data citations, data availability statements, or supplementary materials included in this article.
Supplementary Materials
Figure S1. Psychological stress exacerbates intestinal inflammation in different housing conditions, Related to Figure 1.
(A-C) Colitis readouts after experimental stress paradigm.
(D) Bulk RNA-sequencing after 7 days of stress. Heatmap of significantly differentially expressed genes.
(E-F) Relative colonic gene expression levels of Tnf (E) and Il6 (F) determined by RT-qPCR (normalized to Gapdh).
(G-J) Colitis readouts of mice housed under thermoneutral (30°C) (G-J) and enriched (K-N) conditions. Statistical comparison in (K) is between “control + enrichment” and “stress + enrichment”.
(O and P) Food intake (O) and water consumption (P).
(Q-T) Colitis readouts after an adjusted experimental protocol with limited daily DSS supply to normalized DSS intake between groups (s. methods).
(U and V) Absolute body weight change of mice undergoing the standard experimental paradigm (U) or an extended experimental protocol (16 days of stress prior to DSS treatment).
Figure S2. Psychological stress exacerbates intestinal inflammation in several independent mouse models, Related to Figure 1
(A) Schematic representation of experimental stress-colitis model with different stress exposure periods.
(B-E) Colitis readouts.
(F-I) Colitis readouts after social stress.
(J-S) Colitis readouts of Il10−/− mice (J-N) and wildtype mice (O-S) exposed to restraint stress. Colonoscopy was performed after 30 days of daily stress.
Figure S3. Colonic T- or B-cells do not promote stress-induced inflammation, Related to Figure 1.
(A) Dot plot visualization showing relative marker gene expression.
(B) UMAP embedding of 23,696 colon leukocytes after 7 days of stress.
(C) Number of DEGs in the individual UMAP clusters.
(D) Gating strategy for TH17 cells using IL-17-GFP-reporter mice.
(E) Relative abundance of TH17 cells (as % of CD45+/TCRB+ cells) from ileum after 7 days of stress.
(F-I) Colitis readouts of Rag−/− mice.
Figure S4. Colonic myeloid cells promote stress-induced inflammation, Related to Figure 1
(A and B) Gating strategy (A) and relative abundance (B) of IL-22+ ILC3 (as % of CD45+/TCRB+ cells) in ileum after 7 days of stress using IL-22-tdTomato reporter mice.
(C-F) Colitis readouts in Il22−/− mice.
(G) Relative gene expression (normalized to Gapdh) of Il23r after 7 days of stress.
(H and I) Colitis readouts of mice injected with anti-IL-23.
(J) Weight development of Rag2−/−/Il2rg−/− mice.
(K) Dot plot visualization showing relative marker gene expression.
(L) Number of DEGs in the individual UMAP clusters.
(M) Relative abundance of colonic Ly6C+ MHCII− monocytes (as % of CD45+ Ly6G− CD11b+). CCR2+ cells were depleted with diphtheria toxin.
(N-R) Serum IL-6 levels (N) and colitis readouts (O-R) of anti-IL-6-treated mice.
Figure S5. Canonical stress mediators modulate colitis, Related to Figure 2.
(A and B) Norepinephrine levels after 3 h of stress in serum of untreated mice (A) and in spleen and colon tissue lysates of 6-OHDA and vehicle-treated mice (B).
(C-J) Colitis readouts of 6-OHDA-treated mice (C-G) and ICI-118,551 treated mice (H-J).
(K) Corticosterone serum levels of antalarmin-treated mice after 3 h of stress.
(L-O) Colitis readouts of antalarmin-treated mice.
(P-T) Serum corticosterone levels of sham and adrenalectomy mice (P), and colitis readouts.
(U-X) Levels of corticosterone in serum (U) and tissue (W), and levels of dexamethasone in serum (V) and tissue (X) of control, stressed, and dexamethasone-treated mice (for 7 days).
(Y-AB) Colitis readouts after low-dose dexamethasone treatment.
Figure S6. Colitis is modulated by ENS-specific glucocorticoid signaling, Related to Figures 3 and 4
(A-D) Colitis readouts of Nr3c1Vil1 mice.
(E and F) Food intake (E) and water consumption (F) of Nr3c1fl/fl and Nr3c1Hand2 mice.
(G-L) Colitis readouts (G-J), and relative gene expression levels of Il6 (K) and Ccr2 (L) determined by RT-qPCR (normalized to Gapdh) of mice treated with anti-IL-10R mAb and stressed for 30 days.
Figure S7. Psychological stress affects enteric glia cells, Related to Figures 3 and 4
(A) FACS of colonic nuclei isolated from Sox10-cre INTACT (Sun1-GFP) transgenic mice.
(B-D) Relative marker gene expression in UMAP embedding of snRNAseq data of sorted Sox10 lineage-positive nuclei.
(C) Geneset enrichment analysis of Bioplanet pathways of the top 150 differentially up-or downregulated genes in eGAPS.
(D) Volcano plot of differentially expressed genes in eGAPS.
(E and F) Representative whole-mount staining (E) and quantification (F) of GFAP in the myenteric plexus of iDTRSox10 and iDTRfl/fl mice treated with diphtheria toxin (DT).
(G) Survival of dexamethasone-treated iDTRfl/fl or iDTRPlp1 mice.
(H and I) Representative whole mount staining (H) and quantification (I) of GFAP in the myenteric plexus of iDTRSox10 or iDTRPlp1 mice treated with pegylated diphtheria toxin (BRAINSPAReDT).
(J) Relative gene expression level of Csf1 determined by RT-qPCR in the colon of mice treated with anti-IL-10R for 4 weeks.
(K) Relative Csf1r mRNA expression across different UMAP clusters.
(L) Schematic of the isolation of monocytes and subsequent treatment in in vitro experiments.
(M) TNF levels in supernatant of monocyte cultures determined by ELISA.
Figure S8. Psychological stress affects enteric neurons, Related to Figures 5 and 6
(A-E) Relative marker gene expression in UMAP embedding of snRNAseq data of sorted Sox10 lineage-marked nuclei.
(F) Relative contributions of cells from stressed and control mice to ENPC, ChAT+ and nNOS+ neuron clusters identified by snRNA-seq. (G-I) Colitis readouts of nicotine-treated mice.
(J) Whole-mount IF staining for HuC/D and EdU (scale bar 50 μm) to measure proliferating neurons in the colon.
(K) Quantification of HuC/D+ neurons in distal colon myenteric plexus of stress and control mice after 7 days of stress and after 7 days of stress followed by 4 days of 2% DSS treatment.
(L-N) Whole-mount IF staining for HuC/D and nNOS (scale bar 62μm) (L), relative acetylcholine (ACh) levels in colon lysates (M), and intestinal transit time (N) of iDTRfl/fl and iDTRHand2 mice.
(O-Q) Intestinal transit time of Nr3c1plp1/Sox10 (O), anti-CSF1 treated (P), and anti-TNF treated mice after 7 days of stress.
(R-T) Whole mount IF staining for HuC/D, ChAT (GFP) and nNOS (scale bar 62 μm) (R), relative abundance of ChAT (S) and nNOS neurons (T) of anti-TNF treated mice after 7 days of stress.
(U and V) Survival (U), and relative abundance of Ly6C+MHCII− monocytes (as % of CD45+ Ly6G− CD11b+) (V) of stressed mice after anti-TGFβ treatment.
Figure S9. Psychological stress is associated with severe IBD, Related to Figure 7
(A and B) Kaplan-Meier survival curve of control and stressed patients with ulcerative colitis (A) or Crohn’s disease (B) with adjusted hazard ratio (aHR) for age, sex, BMI.
(C-F) Blood leukocyte count (C and D), and dissatisfaction with bowel habits (E and D) in ulcerative colitis and Crohn’s disease in UK Biobank participants.
(G-L) Presence of obstipation (G and H), experiencing of “current abdominal distension” (I and J) and bowel surgery or ileus in medical history (all in %) (K and L) in ulcerative colitis and Crohn’s disease in UK Biobank participants.
(M) Schematic of study populations (disease-free, rheumatoid arthritis, irritable bowel syndrome) from the UK Biobank.
(N-AB) Abdominal distension (N, S, X), dissatisfaction with bowel habits (scale 0-10) (O, T, Y), obstipation (P, U, Z), blood monocytes (Q, V, AA), and serum CRP (R, W, AB) in disease-free individuals (N-R), individuals with rheumatoid arthritis (S-W), and individuals with irritable bowel syndrome (X-AB).
Data Availability Statement
All data and code to understand and assess the conclusions of this research are available in the main text, supplementary materials. Single-cell RNA-seq and bulk RNA-seq data have been deposited at GEO and are publicly available. Accession numbers are listed in the key resources table.
This paper does not contain original code.
Any additional information required to reanalyze the data reported in this paper is available from the lead contact upon request.
KEY RESOURCES TABLE
| REAGENT or RESOURCE | SOURCE | IDENTIFIER |
|---|---|---|
| Antibodies | ||
| Anti-GFAP (dilution 1:400) | Novus Biologicals | AB_10001722 |
| Anti-GFP (dilution 1:1000) | Aves labs | AB_2307313 |
| Anti-NOS1 (dilution 1:400) | Millipore Sigma | AB_91824 |
| Anti-HuC/D/ANNA-1 (dilution 1:20000) | Gift from Vanda Lennon | AB_2313944 |
| Anti-ChAT (dilution: 1:100) | Novus Biologicals | AB_1968484 |
| Anti-Nestin (dilution: 1:200) | Santa Cruz | AB_627994 |
| Donkey Anti-rabbit Cy2 (dilution 1:400) | Jackson Immuno Research | AB_2340612 |
| Donkey Anti-rat Cy2, Cy5 (dilution 1:400) | Jackson Immuno Research | AB_2340673, AB_2340671 |
| Donkey Anti-chicken Cy5 (dilution 1:400) | Jackson Immuno Research | AB_2340365 |
| Donkey anti-goat AF647 (dilution 1:400) | Jackson Immuno Research | AB_2340436 |
| Donkey anti-human Cy3 (dilution 1:400) | Jackson Immuno Research | AB_2340535 |
| Rat APC/Cy7 anti-mouse CD45 (dilution 1:200) | Biolegend | 103116 |
| Rat PE/Cy5 anti-mouse CD45 (dilution 1:200) | Thermo Fisher Scientific | 15-0451-82 |
| Armenian Hamster PE/Cyanine5 anti-mouse TCR B (dilution 1:200) | Biolegend | 109209 |
| Rat FITC anti-mouse CD64 (dilution 1:200) | Biolegend | 139316 |
| Rat PE/dazzle anti-mouse CD3 (dilution 1:200) | Biolegend | 100245 |
| Rat PE/dazzle anti-mouse CD5 (dilution 1:200) | Biolegend | 100643 |
| Rat PE/dazzle anti-mouse CD19 (dilution 1:200) | Biolegend | 115553 |
| Rat APC anti-mouse CD11c (dilution 1:200) | Biolegend | 117310 |
| Rat PE/Cy7 anti-mouse CD11b (dilution 1:200) | Biolegend | 101216 |
| Rat PE anti-mouse CSF1R (dilution 1:200) | Thermo Fisher Scientific | MA5-16531 |
| Rat PerCP/Cy5.5 anti-mouse Ly6G (dilution 1:200) | Biolegend | 127616 |
| Rat BV605 anti-mouse CD103 (dilution 1:200) | Biolegend | 121433 |
| Rat BV421 anti-mouse MHCII (dilution 1:200) | Biolegend | 107632 |
| Rat BV711 anti-mouse CX3CR1 (dilution 1:200) | Biolegend | 149031 |
| Rat AF700 anti-mouse Ly6C (dilution 1:200) | Biolegend | 128024 |
| Mouse APC-eFluor 780 anti-mouse CD90 (dilution 1:200) | Thermo Fisher Scientific | 47-0900-82 |
| Rat Anti-mouse TNFα monoclonal antibody | BioXCell | AB_1107764, BP0058 |
| Rat Anti-mouse IL-23 (p19) monoclonal antibody | BioXCell | AB_2754551, BE0313 |
| Rat Anti-mouse CSF1 monoclonal antibody | BioXCell | AB_10950309, BE0204 |
| Mouse Anti-mouse TGFβ monoclonal antibody | BioXCell | AB_1107757, BP0057 |
| Rat anti-mouse IL-6 | BioXCell | AB_1107709, BE0046 |
| Rat anti-mouse IL-10R (CD210) | BioXcell | AB_1107611, BE0050 |
| Chemicals, Peptides, and Recombinant Proteins | ||
| Dextran sulfate sodium | MP Biomedicals | 160110 |
| Tamoxifen | Sigma | T5648-1G |
| 6-hydroxydopamine hydrochloride (6-OHDA) | Sigma | H4381-500MG |
| Dexamethasone | Med Chem Express | HY-14648 |
| ICI118,551 | Sigma | 5052750001 |
| RU486 | Cayman Chemicals | 10006317 |
| Antalarmin | Sigma | A8727-50MG |
| Nicotine | Sigma | N3876 |
| BRAINSPAReDT | Gift from Ana Domingos (Oxford) | N/A |
| Diphtheria Toxin | Sigma | D0564-1MG |
| clozapine N-oxide | Sigma | C0832 |
| Carmine red dye | Sigma | C1022 |
| Methylcellulose | Sigma | 94378-100G |
| 4% paraformaldehyde | Thermo scientific | J19943.K2 |
| Methanol | Sigma | 322415-1L |
| Donkey serum | Jackson ImmunoResearch | 017-000-001 |
| Benzyl alcohol | Sigma | 305197-1L |
| Bezyl benzoate | Sigma | W213810-100G-K |
| Collagenase V | StemCell | 07430, 07431, 100-0681 |
| DTT | Sigma | 10197777001 |
| Collagenase D | Sigma | 11088866001 |
| Dispase | Sigma | D4693-1G |
| DNase | Roche | 4716728001 |
| TRIzol | Invitrogen | 15596026 |
| DMSO | Sigma-Aldrich | cat. # D8418 |
| Triton X-100 | Sigma-Aldrich | X100-100ML |
| Fetal bovine serum (FBS) | Cell center | Cat. #7210 |
| LIVE/DEAD Fixable Aqua Cell Stain Kit | ThermoFisher | Cat. #L34957 |
| Dulbecco’s Phosphate Buffered Saline | Fisher Scientific | Cat. #11593377 |
| LPS | Novus Biologicals | NBP2-25295 |
| Recombinant murine CSF-1 | PeproTech | 315-02 |
| Dulbecco’s Modified Eagle Medium (DMEM) | Thermo Fisher Scientific | #10569010 |
| Penicillin-Streptomycin (10,000 U/mL) | Thermo Fisher Scientific/Gibco | #15140122 |
| Critical Commercial Assays | ||
| Mouse Lipocalin-2 DuoSet ELISA | R&D Systems | DY1857-05 |
| Norepinephrine ELISA Kit | IBL-America | IB89537 |
| Amplex® Red Acetylcholine Assay Kit | Invitrogen | A12217 |
| Corticosterone ELISA kit | DRG International | EIA-4164 |
| IL-6 ELISA kit | R&D Systems | DY406-05 |
| Dexamethasone ELISA kit | Elabscience | E-FS-E009 |
| TNF ELISA kit | Thermo Fisher Scientific, | 88-7324-22 |
| Monocyte Isolation kit (BM, Mouse) | Miltenyi | 130-100-629 |
| Click-iT™ EdU Alexa Fluor™ 647 Imaging Kit | Thermo Fisher Scientific | C10340 |
| Illumina TruSeq stranded mRNA kit | Illumina | 20020594 |
| Deposited Data | ||
| ENS snRNASeq | GEO | GSE229322 |
| Leukocyte ScRNASeq | GEO | GSE229321 |
| Bulk RNASeq Colon | GEO | GSE229320 |
| Experimental Models: Organisms/Strains | ||
| C57BL6/J | Jackson Laboratory | #000664 |
| C57BL6/J | Charles River | 027C57BL6/J |
| B6;CBA-Tg-Sox10-cre 1Wdr/J | Jackson Laboratory | #025807 |
| CBA;B6-Tg(Sox10-icre/ERT2)388Wdr/J | Jackson Laboratory | #027651 |
| B6.Cg-Tg(Plp1-cre/ERT)3Pop/J | Jackson Laboratory | #005975 |
| C57BL/6-Gt(ROSA)26Sortm1(HBEGF)Awai/ROSA26iDTR | Jackson Laboratory | #007900 |
| B6;129-Gt(ROSA)26Sortm5(CAG-Sun1/sfGFP)Nat/J | Jackson Laboratory | #021039 |
| B6.129P2-Il10tm1Cgn/J | Jackson Laboratory | #002251 |
| B6.Cg-Rag2tm1.1Cgn/J | Jackson Laboratory | #008449 |
| B6.Cg-Tg(RP23-268L19-EGFP)2Mik/J | Jackson Laboratory | #007902 |
| B6.Cg-Tg(Vil1-cre)1000Gum/J | Jackson Laboratory | #021504 |
| C57BL/6NTac.Cg-Rag2tm1FwaIl2rgtm1Wjl | Taconic | 4111-F/M |
| IL-17-GFP | Gift from R. Flavell (Yale) | N/A |
| Il22−/− | Gift from R. Flavell (Yale) | N/A |
| CCR2-DTR | Gift from M. Abt (UPenn) | N/A |
| Il22 tdTomato | Gift from S. Durum (NIH/NCI) | N/A |
| B6.129S6-Nr3c1tm2.1Ljm/J | Jackson Laboratory | # 012914 |
| B6.129P2-Lyz2tm1(cre)Ifo/J | Jackson Laboratory | 004781 |
| Software and Algorithms | ||
| GraphPad Prism version 9 | GraphPad Software | https://www.graphpad.com |
| Fiji | ImageJ | https://imagej.net |
| Microsoft Excel | Microsoft | https://www.microsoft.com/en-us/microsoft-365/excel |
| FlowJo 10 | BD | www.flowjo.com |
| Statistical computing environment R | R core team | www.r-project.org |
| Kallisto version 0.46 | Pachter lab | https://pachterlab.github.io/kallisto/ |
| Seurat | Satija lab | https://satijalab.org/seurat/ |
| SingleR version 1.4.0 | N/A | Aran, Looney et al., 2019 |