

Abstract
Aims
Heart failure with a preserved ejection fraction (HFpEF) is associated with chronic inflammation. We aimed to investigate the association between pericoronary adipose tissue attenuation (PCATA) on coronary computed tomography angiography as a novel noninvasive marker of pericoronary inflammation and the presence of HFpEF.
Methods and results
This retrospective study included 607 outpatients (median age, 65 years; 50% male) who underwent both echocardiography and coronary computed tomography angiography. Patients with obstructive coronary artery disease were excluded from this study. PCATA was compared between patients with and without HFpEF, which was diagnosed according to the Heart Failure Association (HFA)‐PEFF score. PCATA was assessed at the proximal 40‐mm segments of all three major coronary arteries on coronary computed tomography angiography. Patients with HFpEF had higher PCATA in all coronary arteries compared to the control participants: left anterior descending artery (LAD), −65.2 ± 6.9 Hounsfield units (HU) vs. −68.1 ± 6.7 HU; left circumflex artery (LCX), −62.7 ± 6.8 HU vs. −65.4 ± 6.6 HU; and right coronary artery (RCA), −63.6 ± 8.5 HU vs. −65.5 ± 7.7 HU (P < 0.01). Multivariate logistic regression analysis, including conventional risk factors, revealed that PCATA per standard deviation in the LAD (odds ratio [OR], 1.449; 95% confidence interval [CI], 1.152–1.823), LCX (OR, 1.634; 95% CI, 1.283–2.081), and RCA (OR, 1.388; 95% CI, 1.107–1.740) were independently associated with HFpEF. The association between PCATA and HFpEF was mostly consistent across various patient clinical characteristics. The left ventricular mass and left atrial volume index showed a mild correlation with LAD‐PCATA (ρ = 0.13 [P < 0.01] and ρ = 0.24 [P < 0.01]) and LCX‐PCATA (ρ = 0.16 [P < 0.01] and ρ = 0.23 [P < 0.01]).
Conclusions
High PCATA score was significantly associated with the presence of HFpEF. Our results suggest that inflammation in the pericoronary artery adipose tissue is one of the underlying mechanisms of HFpEF.
Keywords: Adipose tissue, Computed tomography, Coronary artery, Heart failure, Inflammation
Introduction
Heart failure with preserved ejection fraction (HFpEF) is a condition with increasing incidence, which leads to poor quality of life, high mortality rates, and high healthcare‐related costs. 1 , 2 Currently, the underlying mechanisms of HFpEF are not fully understood, while the involvement of chronic inflammation in heart failure has long been the focus of attention. 3 Systemic inflammation is triggered by the combination of cumulative expression of various risk factors and comorbidities, including age, diabetes, hypertension, and renal dysfunction. 4 In addition, chronic low‐grade inflammation causes microvascular dysfunction, which leads to hypertrophy of the myocardial cells and stromal fibrosis. 5
Pericoronary adipose tissue attenuation (PCATA), which is assessed using coronary computed tomography (CCTA), was introduced as a novel noninvasive marker of pericoronary inflammation. 6 The Cardiovascular Risk Prediction using Computed Tomography (CRISP‐CT) study showed that a high PCATA of the right coronary artery (RCA) and left anterior descending artery (LAD) was associated with all‐cause and cardiac mortality. 7 In addition, emerging evidence has demonstrated that PCATA was significantly higher in patients with coronary microvascular dysfunction. 8 , 9 However, the association between PCATA and HFpEF is yet to be investigated.
Here, we hypothesised that chronic inflammation of pericoronary adipose tissue (PCAT) is associated with the pathogenesis of HFpEF. Therefore, in this study, we first investigated whether PCATA in each major coronary artery was associated with the presence of HFpEF; subsequently, we evaluated whether PCATA was correlated with echocardiographic parameters associated with HFpEF.
Methods
Study population
This retrospective, single‐centre, observational study was conducted at Okayama University Hospital, Japan. CCTA findings were derived from a prospective single‐centre, cohort study. 10 Figure 1 shows a flow diagram of the study design. The inclusion criteria were as follows: (i) left ventricular ejection fraction (LVEF) ≥ 50%; (ii) patients who underwent echocardiography and CCTA during the same period (interval between CCTA and echocardiography ≤ 1 month). The exclusion criteria included (i) patients with obstructive coronary artery disease (CAD) (≥ 50% diameter stenosis in any coronary artery on CCTA images) and (ii) poor CCTA image quality. First, among 16 622 patients who underwent echocardiography between August 2011 and December 2016, 1333 patients who were involved in the prospective cohort and who underwent CCTA within 1 month of the indexed echocardiography were selected. After excluding patients with LVEF <50%, obstructive CAD, or poor CCTA image quality, 741 eligible patients were selected. Subsequently, these patients were categorised into two groups based on the presence of heart failure symptoms. Among patients with clinical symptoms or signs of heart failure, according to the 2016 European Society of Cardiology (ESC) guidelines for the diagnosis and treatment of acute and chronic heart failure, 11 we excluded patients with a Heart Failure Association (HFA)‐PEFF score ≤4 12 because this group had a low probability of having HFpEF. Finally, 607 patients (HFpEF, n = 180; control, n = 427) were included in this study.
Figure 1.

The study flow diagram. CCTA, coronary computed tomography angiography; LVEF, left ventricular ejection fraction; CAD, coronary artery disease; HF, heart failure; HFA, heart failure; HFpEF, heart failure with preserved ejection fraction.
This study was conducted following the principles of the Declaration of Helsinki and approved by the ethics committees of the Okayama University Graduate School of Medicine, Dentistry, and Pharmaceutical Sciences (2209‐034). Furthermore, the requirement for informed patient consent was waived because of the low‐risk nature of the study and the inability to obtain consent directly from all study participants.
Clinical data
Details of clinical characteristics, drug therapy, comorbidities, biomarker assessment, arrhythmias, and echocardiography findings were collected from medical records.
Definition of risk factors
The definitions of risk factors have been previously described. 13 Diabetes mellitus was defined as a haemoglobin A1c ≥ 6.5% or the use of diabetic medications. Hypertension was defined as systolic blood pressure >140 mmHg, diastolic blood pressure >90 mmHg, or the use of antihypertensive drugs. Dyslipidaemia was defined as fasting total cholesterol ≥240 mg/dL, low‐density lipoprotein cholesterol ≥140 mg/dL, high‐density lipoprotein cholesterol <40 mg/dL, serum triglyceride ≥150 mg/dL, or current treatment with a lipid‐lowering drug. Smoking status was defined as current smoking or non‐smoking status.
Echocardiographic data
All echocardiographic examinations were performed using commercially available equipment (iE33; Philips Medical Systems, Andover, Massachusetts, USA, and Artida; Canon Medical Systems, Otawara, Japan), which was maintained following the guidelines. 14 , 15 The left ventricular end‐diastolic diameter (LVDd), interventricular septum thickness, posterior wall thickness (PWTd), and left ventricular end‐systolic diameter (LVDs) were measured in parasternal long‐axis views. Left ventricular volumes and LVEF were measured using the disk summation method from apical 4‐ and 2‐chamber views. The relative wall thickness (RWT) was calculated as (2 × PWTd/LVDd). Devereux's formula was used to calculate left ventricular mass (LVM). The maximum left atrial volume (LAV) was measured from apical 4‐ and 2‐chamber views using the disk summation method. LVM and LAV were corrected for body surface area (LVMI: LVM index; LAVI: LAV index). LVEF was measured using Simpson's method. Furthermore, the tissue Doppler‐derived early diastolic mitral annular velocity (e′) was measured at the septal and lateral wall sites in the apical 4‐chamber view. The ratio of early diastolic mitral inflow velocity (E) to e′ (E/e′) was calculated as the mean of the septal and lateral E/e′. The peak tricuspid regurgitation velocity was derived from the peak tricuspid regurgitation jet velocity.
Definition of heart failure with preserved ejection fraction
HFpEF was diagnosed according to the HFA‐PEFF diagnostic algorithm from the HFA of the ESC of Cardiology. The diagnostic criteria included clinical symptoms or signs of heart failure, LVEF ≥50%, elevated levels of natriuretic peptides (brain natriuretic peptide level >35 pg/mL), and an HFA‐PEFF score of >5. 12
The HFA‐PEFF score is a consensus recommendation for assessing the potential HFpEF. 12 After an initial work‐up (Step 1), an echocardiographic assessment of functional and morphological domains and natriuretic peptide testing was performed and categorised into major and minor criteria (Step 2). We classified the participants into the following categories: low score (0–1 point), intermediate score (2–4 points), and high score (≥5 points). The last two steps proposed by the HFA‐PEFF score, functional (performance of echocardiographic or invasive hemodynamic exercise stress tests) and final aetiology step (evaluation and further investigations including molecular phenotyping for addressing the final aetiology of HFpEF), were not performed in this study. Therefore, a total score of ≥5 points was considered diagnostic for HFpEF.
Acquisition of coronary computed tomography angiography
CT scans were performed using a 128‐slice CT scanner (SOMATOM Definition Flash; Siemens Medical Solutions, Erlangen, Germany) as previously described. 16 All patients arrived at the hospital 1 h before the scheduled CT. When the heart rate was >60 b.p.m., the patients received an oral beta‐blocker. In addition, patients mandatorily received an oral dose of short‐acting nitroglycerin.
Non‐contrast cardiac CT images with a 3‐mm slice thickness were obtained before CCTA to measure the coronary artery calcification score (CACS) according to the Agatston method, which involves multiplying the area of each calcified plaque by a density factor determined by the peak pixel intensity within the plaque. The data were evaluated using a dedicated workstation (AZE Virtual Place; Canon Medical Systems Corporation, Otawara, Japan). Furthermore, the CCTA images were reconstructed with a slice thickness of 0.625 mm. On CCTA analysis, we evaluated coronary artery segments with a diameter >2 mm and defined plaque characteristics as per the Society of Cardiovascular Computed Tomography. 17 Two experienced cardiovascular imaging researchers (K. I. and T. M.) interpreted the CCTA results.
Epicardial adipose tissue quantification
Epicardial adipose tissue (EAT) was defined as all adipose tissue within the pericardium with a CT density ranging from −190 to −30 HU. We used the pulmonary artery bifurcation as the superior limit and the level of the posterior descending artery as the inferior limit of the heart. As previously described, the EAT volume (cm3) was quantified from non‐contrast CT images using a dedicated workstation (AZE Virtual Place; Canon Medical Systems Corporation, Otawara, Japan). 18
Coronary plaque quantification
Each coronary segment was evaluated for the presence of CAD and the degree of stenosis (minimal, 1%–29%; mild, 30%–49%; moderate, 50%–69%; severe, 70%–99%; obstruction, 100% diameter stenosis). Stenosis was defined as significant when any coronary artery had a luminal narrowing of >50%. We defined positive remodelling as a remodelling index of >1.1. Plaques with a CT attenuation number <30 HU were defined as low‐attenuation plaques. Spotty calcification was defined as a calcium burden length <1.5 times the vessel diameter and a width less than two‐thirds of the vessel diameter. The presence of two or more high‐risk plaque features, including positive remodelling, low‐attenuation plaques, and spotty calcification, indicated a high‐risk plaque. 10 The segment involvement score (SIS) was calculated as the total number of coronary artery segments exhibiting plaque, irrespective of the degree of luminal stenosis within each segment (minimum = 0; maximum = 16), as previously described. 19
Quantification of pericoronary adipose tissue attenuation
PCAT was defined as adipose tissue located within a radial distance from the outer vessel wall equal to the diameter of the coronary vessel, 6 and adipose tissue was defined as all voxels with an attenuation between −190 and −30 Hounsfield units (HU) (Figure 2 ). PCATA was defined as the average CT attenuation in the HU of adipose tissue within the specified volume of interest. For the analysis, each PCATA analysis of the three main coronary vessels was performed. PCAT analysis was performed using a dedicated workstation (Aquarius iNtuition Edition version 4.4.13. P3; TeraRecon Inc., Foster City, CA, USA). The proximal 40‐mm segments of the LAD and left circumflex coronary artery (LCX) and the proximal 10 to 50‐mm segment of the RCA were traced, as previously described. 7 The CT measurement of the PCATA was fully automated with additional minor manual optimisation.
Figure 2.
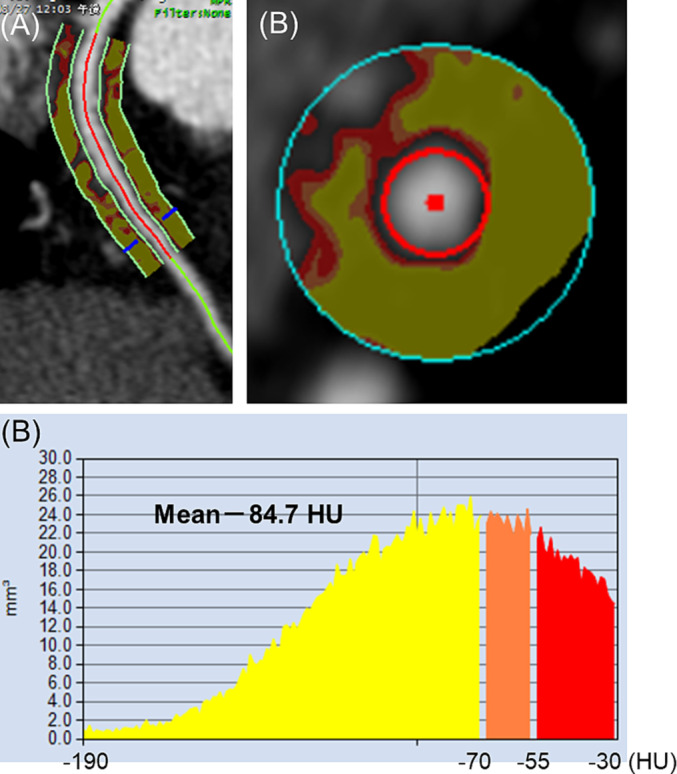
Representative case of pericoronary adipose tissue attenuation (PCATA) measured by coronary computed tomography (CT) angiography. Semi‐automated software measurements showing colour coded PCATA in longitudinal view (A) and axial view (B) around the proximal 10–50 mm of the right coronary artery. PCATA was defined as the mean CT attenuation value (−190 to −30 HU) within a radial distance equal to the diameter of the vessel. Histogram of CT attenuation within the traced area demonstrates that the PCATA in the right coronary artery was −84.7 HU in these patients.
Statistical analysis
The Shapiro–Wilk test was used to determine the normality of continuous variables. Continuous variables are represented as mean ± standard deviation (SD) or median (interquartile range [IQR]) according to the distribution. Categorical variables are presented as numbers (n) and percentages (%). Continuous and categorical variables were compared using the paired Student's t‐test or Mann–Whitney U test and χ 2 or Fisher's exact test, respectively. Correlations between the two variables were assessed using Spearman's correlation analysis. Furthermore, univariate and multivariate logistic regression analyses were performed to evaluate the determinants of HFpEF. The CACS was log‐transformed for the analysis. Receiver operating characteristic (ROC) analysis was performed to identify the optimum cutoff for LAD‐PCATA to differentiate patients with HFpEF using the Youden's J statistic. We performed univariate and multivariate logistic regression analyses to establish the association between PCATA and HFpEF, and the results were reported as odds ratios (ORs) with 95% confidence intervals (CIs). We conducted a multivariate logistic regression analysis including clinically relevant characteristics (age, sex, hypertension, body mass index, dyslipidaemia, diabetes mellitus, chronic kidney disease [CKD], smoking, and atrial fibrillation), medications (use of beta‐blockers, calcium channel blockers, angiotensin‐converting enzyme inhibitors, or angiotensin II receptor blockers, statins, oral antihyperglycaemic drugs, and insulin), and CCTA findings (EAT volume, CACS, high‐risk plaque; SIS) included in the univariate analysis. Finally, we estimated the group differences in the effect of LAD‐PCATA on HFpEF risk using mixed‐effect linear regression models. Statistical significance was set at P < 0.05. All statistical analyses were performed using the statistical package for the social sciences software (version 24; IBM Corp., Armonk, NY, USA) and the R statistical package (version 4.0.2; R Foundation for Statistical Computing, Vienna, Austria).
Results
Patient characteristics
The baseline characteristics of patients with and without HFpEF are presented in Table 1. The median age was 65 years, and 50% of the patients were male. The participants' prevalence rates of current smoking, hypertension, dyslipidaemia, diabetes mellitus, and CKD were 19%, 52%, 40%, 26%, and 24%, respectively. Patients with HFpEF were older and had a significantly higher prevalence of hypertension, CKD, and atrial fibrillation than those without HFpEF. The use of beta‐blockers, calcium channel blockers, angiotensin‐converting enzyme inhibitors, angiotensin II receptor blockers, and insulin was more frequent among patients with HFpEF. With respect to laboratory data, patients with HFpEF had higher levels of brain natriuretic peptide but lower levels of total cholesterol and low‐density lipoprotein cholesterol than those without HFpEF. C‐reactive protein levels did not differ between the two groups. Baseline CCTA and echocardiographic findings in patients with and without HFpEF are presented in Table 2 . Regarding the CCTA findings, patients with HFpEF had higher CACS and EAT volumes than those without HFpEF. The high‐risk plaque and segment involvement scores were not different between the two groups. Regarding echocardiographic findings, patients with HFpEF had higher values of LAVI, LVMI, E/e′, and tricuspid regurgitation peak gradient than those without HFpEF. Meanwhile, no statistically significant differences were observed in RWT, LVEF, and E/A between the two groups.
Table 1.
Clinical characteristics of the study population
| All (n = 607) | HFpEF | P‐value | ||
|---|---|---|---|---|
| Present (n = 180) | Absent (n = 427) | |||
| Age, years | 65 (54, 73) | 70 (62, 75) | 63 (50, 71) | <0.001 |
| Male sex | 302 (50) | 83 (46) | 219 (51) | 0.244 |
| Body mass index | 23.0 (21.0, 26.0) | 23.0 (21.0, 25.0) | 23.0 (21.0, 26.0) | 0.398 |
| Hypertension | 316 (52) | 113 (63) | 203 (48) | <0.001 |
| Dyslipidaemia | 242 (40) | 61 (34) | 181 (42) | 0.051 |
| Diabetes mellitus | 155 (26) | 39 (22) | 116 (27) | 0.156 |
| Chronic kidney disease | 147 (24) | 67 (37) | 80 (19) | <0.001 |
| Current Smoker | 116 (19) | 26 (14) | 90 (21) | 0.058 |
| Atrial fibrillation | 24 (4) | 18 (10) | 6 (1) | <0.001 |
| Beta‐blockers | 102 (17) | 68 (38) | 34 (8) | <0.001 |
| Calcium channel blockers | 168 (28) | 61 (34) | 107 (25) | 0.026 |
| ACE‐Is or ARBs | 192 (32) | 75 (42) | 117 (27) | <0.001 |
| Statins | 150 (25) | 45 (25) | 105 (25) | 0.915 |
| Oral antihyperglycaemic drugs | 77 (13) | 18 (10) | 59 (14) | 0.197 |
| Insulin | 39 (6) | 5 (3) | 34 (8) | 0.017 |
| eGFR, mL/min/1.73 m2 | 71.4 (60.1, 83.1) | 65.7 (52.4, 76.5) | 74.0 (62.4, 84.7) | <0.001 |
| HbA1c, % | 5.8 (5.5, 6.4) | 5.8 (5.5, 6.1) | 5.9 (5.5, 6.5) | 0.083 |
| CRP, mg/dL | 0.09 (0.04, 0.17) | 0.10 (0.05, 0.20) | 0.08 (0.04, 0.17) | 0.130 |
| BNP, pg/mL | 24.1 (11.9, 78.6) | 108.8 (64.2, 196.2) | 14.2 (7.5, 23.0) | <0.001 |
| Total cholesterol, mg/dL | 190.4 ± 36.8 | 185.4 ± 36.9 | 192.6 ± 36.6 | 0.034 |
| HDL‐cholesterol, mg/dL | 57.0 (47.0, 70.0) | 57.0 (48.0, 67.0) | 57.0 (47.0, 71.0) | 0.989 |
| LDL‐cholesterol, mg/dL | 114.3 ± 31.5 | 109.0 ± 30.8 | 116.8 ± 31.6 | 0.010 |
| Triglyceride, mg/dL | 108.0 (77.0, 156.0) | 109.0 (76.0, 144.0) | 108.0 (78.0, 165.0) | 0.375 |
Values other than total and LDL‐cholesterol are expressed as median (interquartile range) or number (%). Total and LDL‐cholesterol values are represented as the mean ± standard deviation.
ACE‐I, angiotensin‐converting enzyme inhibitor; ARB, angiotensin‐receptor blocker; BNP, brain natriuretic peptide; CRP, C‐reactive protein; eGFR, estimated glomerular filtration rate; HbA1c, glycated haemoglobin A1c; HDL, high‐density lipoprotein; HFpEF, heart failure with preserved ejection fraction; LDL, low‐density lipoprotein.
Table 2.
Coronary computed tomography and echocardiographic findings
| All (n = 607) | HFpEF | P‐value | ||
|---|---|---|---|---|
| Present (n = 180) | Absent (n = 427) | |||
| CCTA findings | ||||
| CACS | 0.8 (0, 71) | 15.1 (0, 148.8) | 0 (0, 44.5) | <0.001 |
| EAT, cm2 | 103.4 (73.5, 141.6) | 119.1 (82.5, 149.7) | 96.7 (70.4, 139.4) | 0.002 |
| High‐risk plaque a | 107 (17.6) | 30 (16.7) | 77 (18.0) | 0.687 |
| Positive remodelling | 148 (24.4) | 43 (23.9) | 105 (24.6) | 0.854 |
| Spotty calcification | 127 (20.9) | 47 (26.1) | 80 (18.7) | 0.041 |
| Low attenuation | 89 (14.7) | 21 (11.7) | 68 (15.9) | 0.176 |
| Segment involvement score | 0 (0, 0) | 0 (0, 0) | 0 (0, 0) | 0.059 |
| Echocardiographic findings | ||||
| Left atrial diameter, mm | 37.0 (32.3, 41.0) | 40.0 (37.0, 45.0) | 35.0 (31.0, 39.0) | <0.001 |
| LVDd, mm | 45.0 (42.0, 48.0) | 45.0 (42.0, 48.8) | 45.0 (42.0, 48.0) | 0.170 |
| LVDs, mm | 28.0 (25.0, 31.0) | 28.0 (25.0, 31.0) | 28.0 (26.0, 31.0) | 0.775 |
| LVMI, g/m2 | 80.8 (67.4, 95.2) | 90.1 (72.9, 107.7) | 76.5 (65.6, 91.8) | <0.001 |
| Relative wall thickness | 0.40 (0.35, 0.44) | 0.40 (0.36, 0.45) | 0.39 (0.35, 0.43) | 0.092 |
| LVEDV, mm3 | 92.0 (79.0, 108.0) | 92.0 (79.0, 111.8) | 92.0 (79.0, 108.0) | 0.170 |
| LVESV, mm3 | 30.0 (22.0, 38.0) | 30.0 (22.0, 38.0) | 30.0 (25.0, 38.0) | 0.772 |
| Stroke volume, mm3 | 61.0 (52.0, 70.0) | 64.0 (53.3, 72.0) | 61.0 (52.0, 69.0) | 0.014 |
| LVEF (Simpson) | 66.0 (62.0, 69.0) | 66.0 (62.0, 70.0) | 65.0 (62.0, 69.0) | 0.456 |
| LVAI, mm3/m2 | 35.0 (30.0, 41.0) | 42.0 (37.0, 51.0) | 32.0 (27.0, 36.0) | <0.001 |
| E/A | 0.9 (0.7, 1.3) | 0.9 (0.8, 1.3) | 0.9 (0.7, 1.3) | 0.224 |
| E/e′ | 10.4 (8.1, 13.4) | 13.0 (10.1, 16.5) | 9.6 (7.4, 12.1) | <0.001 |
| TRPG, mmHg | 23.0 (20.0, 28.0) | 28.0 (23.0, 36.0) | 22.0 (18.0, 25.0) | <0.001 |
All values are expressed as medians (interquartile ranges) or numbers (%).
A, late transmitral flow velocity; CACS, coronary artery calcification score; CCTA, coronary computed tomography; E, early diastolic transmitral flow velocity; e′, early diastolic mitral annular velocity; EAT, epicardial adipose tissue; HFpEF, heart failure with preserved ejection fraction; LAD, left atrial dimension; LAVI, left atrial volume index; LVDd, left ventricular end‐diastolic diameter; LVDs, left ventricular end‐systolic diameter; LVEDV, left ventricular end‐diastolic volume; LVEF, left ventricular ejection fraction; LVESV, left ventricular end‐systolic volume; LVMI, left ventricular mass index; TRPG, tricuspid regurgitation peak gradient.
High‐risk plaque is defined as the presence of two or more features (positive remodelling, spotty calcification, and low‐attenuation plaque).
Pericoronary adipose tissue attenuation findings
Figure 3 shows a comparison of the mean PCATA in every single coronary artery between the two groups. Patients with HFpEF had higher PCATA of all coronary arteries than control participants (LAD; −65.2 ± 6.9 HU vs. −68.1 ± 6.7 HU, P < 0.001, LCX; −62.7 ± 6.8 HU vs. −65.4 ± 6.6 HU, P < 0.001, RCA; −63.6 ± 8.5 HU vs. −65.5 ± 7.7 HU, P = 0.003).
Figure 3.

Comparison of pericoronary adipose tissue attenuation (PCATA) between patients who had heart failure with preserved ejection fraction (HFpEF) and control. (A) Comparison of the left anterior descending artery (LAD)‐PCATA between the two groups. LAD‐PCATA in the number of patients with HFpEF (indicated with pink dots) was higher than that in the control (indicated with blue dots). (B) Comparison of the left circumflex coronary artery (LCX)‐PCATA between the two groups. LCX‐PCATA in patients with HFpEF is higher than that in the control. (C) Comparison of the right coronary artery (RCA)‐PCATA between the two groups. RCA‐PCATA in patients with HFpEF is higher than that in the control.
Association between pericoronary adipose tissue attenuation and heart failure with preserved ejection fraction
Logistic regression analysis was performed to evaluate the determinants of HFpEF (Table 3 ). The significant determinants of HFpEF in univariate logistic regression analysis included age; hypertension; CKD; atrial fibrillation; use of beta‐blockers, calcium channel blockers, angiotensin‐converting enzyme inhibitors, or angiotensin II receptor blockers; insulin; EAT volume; and PCATA in each coronary artery.
Table 3.
Factors associated with HFpEF
| Univariate | Multivariate 1 | Multivariate 2 | Multivariate 3 | |||||
|---|---|---|---|---|---|---|---|---|
| Odds ratio (95% CI) | P‐value | Odds ratio (95% CI) | P‐value | Odds ratio (95% CI) | P‐value | Odds ratio (95% CI) | P‐value | |
| Age, per 1 year | 1.051 (1.035–1.067) | <0.001 | 1.039 (1.019–1.060) | <0.001 | 1.036 (1.016–1.057) | <0.001 | 1.041 (1.021–1.062) | <0.001 |
| Male sex (yes, no) | 0.813 (0.573–1.152) | 0.244 | 0.598 (0.367–0.975) | 0.039 | 0.5015 (0.311–0.853) | 0.010 | 0.669 (0.413–1.084) | 0.103 |
| BMI | 0.969 (0.927–1.013) | 0.166 | 0.963 (0.898–1.033) | 0.295 | 0.966 (0.901–1.035) | 0.328 | 0.953 (0.890–1.022) | 0.176 |
| Hypertension (yes, no) | 1.861 (1.302–2.659) | <0.001 | 0.962 (0.539–1.717) | 0.896 | 0.991 (0.555–1.769) | 0.976 | 1.020 (0.572–1.820) | 0.946 |
| Dyslipidaemia (yes, no) | 0.697 (0.484–1.002) | 0.051 | 0.657 (0.377–1.114) | 0.138 | 0.671 (0.383–1.176) | 0.164 | 0.655 (0.376–1.139) | 0.134 |
| Diabetes mellitus (yes, no) | 0.742 (0.490–1.122) | 0.157 | 0.983 (0.511–1.892) | 0.960 | 1.142 (0.590–2.209) | 0.694 | 0.995 (0.515–1.920) | 0.987 |
| CKD (yes, no) | 2.572 (1.745–3.790) | <0.001 | 1.501 (0.929–2.427) | 0.097 | 1.502 (0.925–2.439) | 0.100 | 1.522 (0.943–2.456) | 0.086 |
| Current smoker (yes, no) | 0.632 (0.393–1.018) | 0.059 | 0.773 (0.418–1.428) | 0.411 | 0.809 (0.439–1.490) | 0.495 | 0.825 (0.446–1.523) | 0.538 |
| Rhythm, Af (yes, no) | 7.796 (3.041–19.989) | <0.001 | 4.375 (1.496–12.796) | 0.007 | 5.265 (1.791–15.476) | 0.003 | 4.741 (1.608–13.975) | 0.005 |
| Beta‐blocker (yes, no) | 7.018 (4.421–11.140) | <0.001 | 5.472 (3.185–9.401) | <0.001 | 6.082 (3.515–10.522) | <0.001 | 5.922 (3.442–10.187) | <0.001 |
| Calcium channel blocker (yes, no) | 1.533 (1.050–2.238) | 0.027 | 0.934 (0.549–1.590) | 0.802 | 0.886 (0.520–1.511) | 0.657 | 0.943 (0.554–1.603) | 0.827 |
| ACE‐I or ARB (yes, no) | 1.893 (1.314–2.726) | <0.001 | 1.119 (0.654–1.915) | 0.682 | 1.106 (0.647–1.892) | 0.712 | 1.077 (0.630–1.841) | 0.786 |
| Statin (yes, no) | 1.022 (0.683–1.529) | 0.915 | 0.887 (0.469–1.678) | 0.712 | 0.850 (0.447–1.619) | 0.622 | 0.903 (0.479–1.701) | 0.752 |
| Oral antihyperglycaemic drugs (yes, no) | 0.693 (0.396–1.212) | 0.199 | 0.890 (0.382–2.073) | 0.787 | 0.798(0.339–1.876) | 0.605 | 0.853 (0.366–1.988) | 0.712 |
| Insulin (yes, no) | 0.330 (0.127–0.859) | 0.023 | 0.565 (0.184–1.733) | 0.318 | 0.507 (0.165–1.562) | 0.237 | 0.561 (0.183–1.725) | 0.313 |
| EAT, per mm3 | 1.004 (1.001–1.008) | 0.016 | 1.004 (0.998–1.009) | 0.193 | 1.005 (0.999–1.011) | 0.082 | 1.004 (0.999–1.010) | 0.124 |
| CACS, per 1 index | 1.184 (1.095–1.280) | <0.001 | 0.963 (0.883–1.051) | 0.398 | 0.970 (0.888–1.058) | 0.490 | 0.961 (0.881–1.048) | 0.370 |
| High‐risk plaque (yes, no) | 0.909 (0.572–1.445) | 0.687 | 0.696 (0.393–1.233) | 0.214 | 0.669 (0.373–1.199) | 0.177 | 0.659 (0.372–1.169) | 0.154 |
| SIS, per 1 score | 1.091 (0.973–1.224) | 0.134 | 1.089 (0.966–1.227) | 0.162 | 1.094 (0.970–1.234) | 0.144 | 1.078 (0.955–1.217) | 0.224 |
| PCATA (LAD), per SD | 1.579 (1.309–1.905) | <0.001 | 1.427 (1.132–1.798) | 0.003 | ||||
| PCATA (LCX), per SD | 1.514 (1.257–1.823) | <0.001 | 1.619 (1.270–2.065) | <0.001 | ||||
| PCATA (RCA), per SD | 1.274 (1.067–1.521) | 0.007 | 1.372 (1.091–1.725) | 0.007 | ||||
ACE‐I, angiotensin‐converting enzyme inhibitor; AF, atrial fibrillation; ARB, angiotensin‐receptor blocker; BMI, body mass index; CACS, coronary artery calcification score; CKD, chronic kidney disease; EAT, epicardial adipose tissue; EAT, epicardial adipose tissue; HFpEF, heart failure with preserved ejection fraction; LAD, left anterior descending artery; LCX, left circumflex coronary artery; PCATA, pericoronary adipose tissue attenuation; RCA, right coronary artery; SD, standard deviation; SIS, segment involvement score.
Furthermore, multivariable logistic regression analysis including all variables in the univariate analysis (age; sex; hypertension; body mass index; dyslipidaemia; diabetes mellitus; CKD; smoking; atrial fibrillation; use of beta‐blockers, calcium channel blockers, angiotensin‐converting enzyme inhibitors, or angiotensin II receptor blockers; statins; oral antihyperglycaemic drugs; insulin; EAT volume; and PCATA in every single coronary artery), was performed. In multivariate logistic regression analysis, PCATA in every single coronary artery was associated with HFpEF (LAD: OR, 1.427; 95% CI, 1.132–1.798; LCX: OR, 1.619; 95% CI, 1.270–2.065; RCA: OR, 1.372; 95% CI, 1.091–1.725).
The corresponding optimal cutoff value of LAD‐PCATA for discriminating the presence of HFpEF from the ROC curve was −70.4 HU. Based on this cutoff value, we categorised the patients into two groups (high LAD‐PCATA ≥−70.4 HU and LAD‐PCATA <−70.4 HU). In subgroup analyses, a consistent trend of the association of high vs. low LAD‐PCATA existed with HFpEF across almost all subgroups, except for patients who underwent statin therapy (Figure 4 ).
Figure 4.

The association of pericoronary adipose tissue attenuation (PCATA) in those who had heart failure with preserved ejection fraction (HFpEF) between subgroups. Patients were categorised into two groups based on the cutoff value of LAD‐PCATA of −70.4 HU for discriminating between patients with and without HFpEF. ACE‐I, angiotensin‐converting enzyme inhibitor; ARB, angiotensin‐receptor blocker; BMI, body mass index; LAD, left anterior descending artery.
Correlation between echocardiographic findings and pericoronary adipose tissue attenuation
We assessed the association between echocardiographic findings and the PCATA in each coronary artery. As presented in Table 4 , LVMI and LAVI were significantly correlated with LAD‐PCATA and LCX‐PCATA, whereas only LAVI was correlated with RCA‐PCATA. In addition, the tricuspid regurgitation peak gradient significantly correlated with the PCATA of all three coronary arteries.
Table 4.
Correlation between PCATA and echocardiographic data
| PCATA (LAD) | PCATA (LCX) | PCATA (RCA) | ||||
|---|---|---|---|---|---|---|
| ρ | P‐value | ρ | P‐value | ρ | P‐value | |
| Left atrial diameter | 0.103 | 0.011 | 0.071 | 0.083 | 0.001 | 0.977 |
| LVDd | −0.005 | 0.904 | 0.094 | 0.021 | −0.055 | 0.176 |
| LVDs | 0.010 | 0.803 | 0.066 | 0.102 | 0.003 | 0.936 |
| LVMI | 0.126 | 0.002 | 0.160 | <0.001 | −0.026 | 0.530 |
| Relative wall thickness | 0.057 | 0.174 | −0.052 | 0.217 | −0.063 | 0.131 |
| LVEDV | −0.005 | 0.904 | 0.094 | 0.021 | −0.055 | 0.176 |
| LVESV | 0.010 | 0.800 | 0.066 | 0.103 | 0.003 | 0.935 |
| LVEF (Simpson) | −0.026 | 0.598 | −0.029 | 0.545 | −0.065 | 0.182 |
| Left atrial volume index | 0.243 | <0.001 | 0.234 | <0.001 | 0.132 | 0.002 |
| E/A | 0.025 | 0.556 | 0.071 | 0.089 | 0.151 | <0.001 |
| E/e′ | 0.079 | 0.053 | 0.040 | 0.327 | −0.043 | 0.295 |
| TRPG | 0.205 | <0.001 | 0.126 | 0.003 | 0.195 | <0.001 |
A, late transmitral flow velocity; E, early diastolic transmitral flow velocity; e′, early diastolic mitral annular velocity; LAD, left anterior descending artery; LCX, left circumflex coronary artery; LVDd, left ventricular end‐diastolic diameter; LVDs, left ventricular end‐systolic diameter; LVEDV, left ventricular end‐diastolic volume; LVEF, left ventricular ejection fraction; LVESV, left ventricular end‐systolic volume; LVMI, left ventricular mass index; PCATA, pericoronary adipose tissue attenuation; RCA, right coronary artery; TRPG, tricuspid regurgitation peak gradient.
Discussion
This study revealed that a high PCATA score was associated with the presence of HFpEF. Notably, LAD‐ and LCX‐PCATAs were significantly correlated with echocardiographic parameters, including LVMI and LAVI. These findings imply that inflammation in the PCAT may be involved in the pathogenesis of HFpEF.
In HFpEF, microvascular dysfunction has been proposed as a central mediator linking chronic systemic low‐grade inflammation with myocardial dysfunction. 5 A systemic pro‐inflammatory status causes endothelial damage to the coronary microvessels. In turn, coronary microvascular dysfunction causes an increase in reactive oxygen species and a decrease in nitric oxide production. Consequently, reduced nitric oxide bioavailability leads to impaired nitric oxide/cyclic guanosine monophosphate/protein kinase G signalling, causing vascular endothelial dysfunction, cardiomyocyte hypertrophy, and stiffening. 20 Several clinical studies have demonstrated that PCATA levels are significantly higher in patients with coronary microvascular dysfunction, 8 , 9 suggesting a strong association between PCATA and coronary endothelial dysfunction. Recently, we demonstrated a significant association between increased PCATA levels and peripheral endothelial dysfunction, as assessed by flow‐mediated dilation of the brachial artery. 21 Although flow‐mediated dilation of the brachial artery does not allow for the direct assessment of coronary artery endothelial function, previous studies have revealed a significant correlation between flow‐mediated dilation‐assessed peripheral endothelial function and coronary artery endothelial function. 22 , 23 Therefore, when high PCATA scores are combined, they may reflect coronary microvascular dysfunction, a potential key driver of HFpEF.
Systemic chronic low‐grade inflammation has also been proposed to contribute to HFpEF, independent of microvascular dysfunction. 3 Patients with HFpEF have systemic complications or dysfunctions that cause chronic low‐grade inflammation, including ageing, obesity, diabetes, hypertension, and CKD. 4 Furthermore, patients with HFpEF have higher blood inflammatory cytokine levels, including interleukin (IL)‐6 and tumour necrosis factor‐α. 24 PCATA represents early and chronic inflammation in PCAT, 6 indicating its role as a surrogate measure of coronary focal inflammation. However, a recent study demonstrated a positive association between PCATA and the serum levels of systemic pro‐inflammatory mediators and inflammatory disease activity. In addition, a prospective cohort study showed that biological therapy was associated with decreased PCATA scores in patients with psoriasis. 25 These results suggest that PCATA represents both coronary focal and systemic inflammation.
In our study, LAD‐ and LCX‐PCATAs were associated with LVMI and LAVI, whereas no relationship was observed between RCA‐PCATA and LVMI. Therefore, these findings are reasonable considering the effects of local microvascular dysfunction and local inflammation on the left ventricle. In addition, a previous study demonstrated that in patients without severely obstructive CAD, LAD‐PCATA was inversely associated with coronary flow velocity reserve on the LAD during stress echocardiography. 9 However, the impact of the PCATA and each major coronary artery on left ventricular function is yet to be evaluated. Therefore, further studies are required to clarify the association and impact of PCATA on the development of HFpEF.
Recent studies showed that increased volume of EAT was involved in myocardial circulatory derangements such as myocardial fibrosis and impairments of diastolic filling that are typically seen in HFpEF. 26 However, previous studies have not directly characterised the quantity of EAT in patients with HFpEF. Our study presents a novel finding that inflammation of PCAT is associated with structural and functional derangements of ventricular myocardium in patients with HFpEF. This finding is supported by the fact that the mild systolic dysfunction, which is often observed in patients with HFpEF may be related to the quantity of the EAT. 27 However, because of a significant overlap of the PCATA values between patients with or without HFpEF, the diagnostic value of PCATA in HFpEF is not strong enough to be directly translated into clinical practice without further research.
Many researchers have attempted to develop treatments targeting chronic inflammation; however, anti‐inflammatory therapy is yet to be established as the standard treatment for chronic heart failure. Anakinra, an IL‐1 receptor antagonist, improved maximal oxygen uptake in a pilot study in patients who had HFpEF with increased high‐sensitivity C‐reactive protein. 28 Furthermore, a canakinumab anti‐inflammatory thrombosis outcomes (CANTOS) sub‐study examining the effect of canakinumab on heart failure showed improved maximal oxygen uptake and LVEF after 3 and 12 months, respectively, compared with placebo. 29 However, the number of patients was small; therefore, a larger study is required. Meanwhile, statins, eicosapentaenoic acid, and biological therapies, including anti‐tumour necrosis factor α, anti‐IL 12/23, and anti‐IL‐17, have been shown to lower PCATA. 25 , 30 , 31 In contrast, the impact of changes in PCATA on heart failure is yet to be evaluated. Therefore, further studies are required to assess the association between changes in PCATA and physiological and morphological changes in HFpEF.
This study has certain limitations. First, we could not demonstrate a causal relationship because this was a cross‐sectional study. Second, these results cannot be applied to the general population because all patients in this study were Asian and underwent CCTA for suspected CAD. Therefore, ethnic diversity and its prognostic implications should be investigated in future studies. Finally, this study was conducted retrospectively at a single centre with a limited number of patients.
In conclusion, our study revealed that high PCATA in each major coronary artery was associated with the presence of HFpEF. However, further studies are required to investigate whether the reduction in PCAT inflammation leads to the prevention of HFpEF or the improvement of the condition in HFpEF.
Funding
This study was supported by the Japan Society for the Promotion of Science KAKENHI (grant number JP 19K08558).
Conflict of interest
None declared.
Nishihara, T. , Miyoshi, T. , Nakashima, M. , Ichikawa, K. , Takaya, Y. , Nakayama, R. , Miki, T. , and Ito, H. (2023) Association of perivascular fat attenuation on computed tomography and heart failure with preserved ejection fraction. ESC Heart Failure, 10: 2447–2457. 10.1002/ehf2.14419.
References
- 1. Ziaeian B, Fonarow GC. Epidemiology and aetiology of heart failure. Nat Rev Cardiol. 2016; 13: 368–378. [DOI] [PMC free article] [PubMed] [Google Scholar]
- 2. Dunlay SM, Roger VL, Redfield MM. Epidemiology of heart failure with preserved ejection fraction. Nat Rev Cardiol. 2017; 14: 591–602. [DOI] [PubMed] [Google Scholar]
- 3. van Empel V, Brunner‐La Rocca HP. Inflammation in HFpEF: key or circumstantial? Int J Cardiol. 2015; 189: 259–263. [DOI] [PubMed] [Google Scholar]
- 4. Ho JE, Lyass A, Lee DS, Vasan RS, Kannel WB, Larson MG, Levy D. Predictors of new‐onset heart failure: differences in preserved versus reduced ejection fraction. Circ Heart Fail. 2013; 6: 279–286. [DOI] [PMC free article] [PubMed] [Google Scholar]
- 5. Cuijpers I, Simmonds SJ, van Bilsen M, Czarnowska E, González Miqueo A, Heymans S, Kuhn AR, Mulder P, Ratajska A, Jones EAV, Brakenhielm E. Microvascular and lymphatic dysfunction in HFpEF and its associated comorbidities. Basic Res Cardiol. 2020; 115: 39. [DOI] [PMC free article] [PubMed] [Google Scholar]
- 6. Antonopoulos AS, Sanna F, Sabharwal N, Thomas S, Oikonomou EK, Herdman L, Margaritis M, Shirodaria C, Kampoli AM, Akoumianakis I, Petrou M, Sayeed R, Krasopoulos G, Psarros C, Ciccone P, Brophy CM, Digby J, Kelion A, Uberoi R, Anthony S, Alexopoulos N, Tousoulis D, Achenbach S, Neubauer S, Channon KM, Antoniades C. Detecting human coronary inflammation by imaging perivascular fat. Sci Transl Med. 2017; 9: eaal2658. [DOI] [PubMed] [Google Scholar]
- 7. Oikonomou EK, Marwan M, Desai MY, Mancio J, Alashi A, Hutt Centeno E, Thomas S, Herdman L, Kotanidis CP, Thomas KE, Griffin BP, Flamm SD, Antonopoulos AS, Shirodaria C, Sabharwal N, Deanfield J, Neubauer S, Hopewell JC, Channon KM, Achenbach S, Antoniades C. Non‐invasive detection of coronary inflammation using computed tomography and prediction of residual cardiovascular risk (the CRISP CT study): a post‐hoc analysis of prospective outcome data. Lancet. 2018; 392: 929–939. [DOI] [PMC free article] [PubMed] [Google Scholar]
- 8. Kanaji Y, Sugiyama T, Hoshino M, Misawa T, Nagamine T, Yasui Y, Nogami K, Ueno H, Hirano H, Hada M, Yamaguchi M, Hamaya R, Usui E, Yonetsu T, Sasano T, Kakuta T. Physiological significance of pericoronary inflammation in epicardial functional stenosis and global coronary flow reserve. Sci Rep. 2021; 11: 19026. [DOI] [PMC free article] [PubMed] [Google Scholar]
- 9. Pasqualetto MC, Tuttolomondo D, Cutruzzolà A, Niccoli G, Dey D, Greco A, Martini C, Irace C, Rigo F, Gaibazzi N. Human coronary inflammation by computed tomography: relationship with coronary microvascular dysfunction. Int J Cardiol. 2021; 336: 8–13. [DOI] [PubMed] [Google Scholar]
- 10. Ichikawa K, Miyoshi T, Osawa K, Miki T, Toda H, Ejiri K, Yoshida M, Nakamura K, Morita H, Ito H. Incremental prognostic value of non‐alcoholic fatty liver disease over coronary computed tomography angiography findings in patients with suspected coronary artery disease. Eur J Prev Cardiol. 2022; 28: 2059–2066. [DOI] [PubMed] [Google Scholar]
- 11. Ponikowski P, Voors AA, Anker SD, Bueno H, Cleland JG, Coats AJS, Falk V, González‐Juanatey JR, Harjola VP, Jankowska EA, Jessup M, Linde C, Nihoyannopoulos P, Parissis JT, Pieske B, Riley JP, Rosano GMC, Ruilope LM, Ruschitzka F, Rutten FH, van der Meer P, ESC Scientific Document Group . ESC Guidelines for the diagnosis and treatment of acute and chronic heart failure: The Task Force for the diagnosis and treatment of acute and chronic heart failure of the European Society of Cardiology (ESC) Developed with the special contribution of the Heart Failure Association (HFA) of the ESC. Eur J Heart Fail. 2016; 18: 891–975. [DOI] [PubMed] [Google Scholar]
- 12. Pieske B, Tschöpe C, de Boer RA, Fraser AG, Anker SD, Donal E, Edelmann F, Fu M, Guazzi M, Lam CSP, Lancellotti P, Melenovsky V, Morris DA, Nagel E, Pieske‐Kraigher E, Ponikowski P, Solomon SD, Vasan RS, Rutten FH, Voors AA, Ruschitzka F, Paulus WJ, Seferovic P, Filippatos G. How to diagnose heart failure with preserved ejection fraction: the HFA‐PEFF diagnostic algorithm: a consensus recommendation from the Heart Failure Association (HFA) of the European Society of Cardiology (ESC). Eur Heart J. 2019; 40: 3297–3317. [DOI] [PubMed] [Google Scholar]
- 13. Ichikawa K, Miyoshi T, Osawa K, Miki T, Toda H, Ejiri K, Yoshida M, Nanba Y, Yoshida M, Nakamura K, Morita H, Ito H. Prognostic value of non‐alcoholic fatty liver disease for predicting cardiovascular events in patients with diabetes mellitus with suspected coronary artery disease: a prospective cohort study. Cardiovasc Diabetol. 2021; 20: 8. [DOI] [PMC free article] [PubMed] [Google Scholar]
- 14. Lang RM, Badano LP, Mor‐Avi V, Afilalo J, Armstrong A, Ernande L, Flachskampf FA, Foster E, Goldstein SA, Kuznetsova T, Lancellotti P, Muraru D, Picard MH, Rietzschel ER, Rudski L, Spencer KT, Tsang W, Voigt JU. Recommendations for cardiac chamber quantification by echocardiography in adults: an update from the American Society of Echocardiography and the European Association of Cardiovascular Imaging. J Am Soc Echocardiogr. 2015; 28: 1–39.e14. [DOI] [PubMed] [Google Scholar]
- 15. Nagueh SF, Smiseth OA, Appleton CP, Byrd BF 3rd, Dokainish H, Edvardsen T, Flachskampf FA, Gillebert TC, Klein AL, Lancellotti P, Marino P, Oh JK, Popescu BA, Waggoner AD. Recommendations for the evaluation of left ventricular diastolic function by echocardiography: an update from the American Society of Echocardiography and the European Association of Cardiovascular Imaging. Eur Heart J Cardiovasc Imaging. 2016; 17: 1321–1360. [DOI] [PubMed] [Google Scholar]
- 16. Suruga K, Miyoshi T, Kotani K, Ichikawa K, Miki T, Osawa K, Ejiri K, Toda H, Nakamura K, Morita H, Ito H. Higher oxidised high‐density lipoprotein to apolipoprotein A‐I ratio is associated with high‐risk coronary plaque characteristics determined by CT angiography. Int J Cardiol. 2021; 324: 193–198. [DOI] [PubMed] [Google Scholar]
- 17. Shaw LJ, Blankstein R, Bax JJ, Ferencik M, Bittencourt MS, Min JK, Berman DS, Leipsic J, Villines TC, Dey D, Al'Aref S, Williams MC, Lin F, Baskaran L, Litt H, Litmanovich D, Cury R, Gianni U, van den Hoogen I, van Rosendael A, Budoff M, Chang HJ, Hecht H, Feuchtner G, Ahmadi A, Ghoshajra BB, Newby D, Chandrashekhar YS, Narula J. Society of Cardiovascular Computed Tomography/North American Society of Cardiovascular Imaging ‐ Expert Consensus Document on Coronary CT Imaging of Atherosclerotic Plaque. J Cardiovasc Comput Tomogr. 2021; 15: 93–109. [DOI] [PubMed] [Google Scholar]
- 18. Dey D, Suzuki Y, Suzuki S, Ohba M, Slomka PJ, Polk D, Shaw LJ, Berman DS. Automated quantitation of pericardiac fat from noncontrast CT. Invest Radiol. 2008; 43: 145–153. [DOI] [PubMed] [Google Scholar]
- 19. Min JK, Shaw LJ, Devereux RB, Okin PM, Weinsaft JW, Russo DJ, Lippolis NJ, Berman DS, Callister TQ. Prognostic value of multidetector coronary computed tomographic angiography for prediction of all‐cause mortality. J Am Coll Cardiol. 2007; 50: 1161–1170. [DOI] [PubMed] [Google Scholar]
- 20. Paulus WJ, Tschöpe C. A novel paradigm for heart failure with preserved ejection fraction: comorbidities drive myocardial dysfunction and remodeling through coronary microvascular endothelial inflammation. J Am Coll Cardiol. 2013; 62: 263–271. [DOI] [PubMed] [Google Scholar]
- 21. Ichikawa K, Miyoshi T, Ohno Y, Osawa K, Nakashima M, Nishihara T, Miki T, Toda H, Yoshida M, Ito H. Association between high pericoronary adipose tissue computed tomography attenuation and impaired flow‐mediated dilation of the brachial artery. J Atheroscler Thromb. 2022; 30: 364–376. [DOI] [PMC free article] [PubMed] [Google Scholar]
- 22. Anderson TJ, Uehata A, Gerhard MD, Meredith IT, Knab S, Delagrange D, Lieberman EH, Ganz P, Creager MA, Yeung AC. Close relation of endothelial function in the human coronary and peripheral circulations. J Am Coll Cardiol. 1995; 26: 1235–1241. [DOI] [PubMed] [Google Scholar]
- 23. Takase B, Uehata A, Akima T, Nagai T, Nishioka T, Hamabe A, Satomura K, Ohsuzu F, Kurita A. Endothelium‐dependent flow‐mediated vasodilation in coronary and brachial arteries in suspected coronary artery disease. Am J Cardiol. 1998; 82: 1535–1539 A7. [DOI] [PubMed] [Google Scholar]
- 24. Kalogeropoulos A, Georgiopoulou V, Psaty BM, Rodondi N, Smith AL, Harrison DG, Liu Y, Hoffmann U, Bauer DC, Newman AB, Kritchevsky SB, Harris TB, Butler J, Health ABC Study Investigators . Inflammatory markers and incident heart failure risk in older adults: the Health ABC (Health, Aging, and Body Composition) study. J Am Coll Cardiol. 2010; 55: 2129–2137. [DOI] [PMC free article] [PubMed] [Google Scholar]
- 25. Elnabawi YA, Oikonomou EK, Dey AK, Mancio J, Rodante JA, Aksentijevich M, Choi H, Keel A, Erb‐Alvarez J, Teague HL, Joshi AA, Playford MP, Lockshin B, Choi AD, Gelfand JM, Chen MY, Bluemke DA, Shirodaria C, Antoniades C, Mehta NN. Association of biologic therapy with coronary inflammation in patients with psoriasis as assessed by perivascular fat attenuation index. JAMA Cardiol. 2019; 4: 885–891. [DOI] [PMC free article] [PubMed] [Google Scholar]
- 26. Packer M. Epicardial adipose tissue may mediate deleterious effects of obesity and inflammation on the myocardium. J Am Coll Cardiol. 2018; 71: 2360–2372. [DOI] [PubMed] [Google Scholar]
- 27. Watanabe K, Kishino T, Sano J, Ariga T, Okuyama S, Mori H, Matsushima S, Ohtsuka K, Ohnishi H, Watanabe T. Relationship between epicardial adipose tissue thickness and early impairment of left ventricular systolic function in patients with preserved ejection fraction. Heart Vessels. 2016; 31: 1010–1015. [DOI] [PubMed] [Google Scholar]
- 28. Van Tassell BW, Arena R, Biondi‐Zoccai G, Canada JM, Oddi C, Abouzaki NA, Jahangiri A, Falcao RA, Kontos MC, Shah KB, Voelkel NF, Dinarello CA, Abbate A. Effects of interleukin‐1 blockade with anakinra on aerobic exercise capacity in patients with heart failure and preserved ejection fraction (from the D‐HART pilot study). Am J Cardiol. 2014; 113: 321–327. [DOI] [PMC free article] [PubMed] [Google Scholar]
- 29. Trankle CR, Canada JM, Cei L, Abouzaki N, Oddi‐Erdle C, Kadariya D, Christopher S, Viscusi M, Del Buono M, Kontos MC, Arena R, Van Tassell B, Abbate A. Usefulness of canakinumab to improve exercise capacity in patients with long‐term systolic heart failure and elevated C‐reactive protein. Am J Cardiol. 2018; 122: 1366–1370. [DOI] [PMC free article] [PubMed] [Google Scholar]
- 30. Dai X, Yu L, Lu Z, Shen C, Tao X, Zhang J. Serial change of perivascular fat attenuation index after statin treatment: insights from a coronary CT angiography follow‐up study. Int J Cardiol. 2020; 319: 144–149. [DOI] [PubMed] [Google Scholar]
- 31. Bittner DO, Goeller M, Dey D, Zopf Y, Achenbach S, Marwan M. High levels of eicosapentaenoic acid are associated with lower pericoronary adipose tissue attenuation as measured by coronary CTA. Atherosclerosis. 2021; 316: 73–78. [DOI] [PubMed] [Google Scholar]