

Abstract
Clonal hematopoiesis (CH) increases the risk of atherosclerotic cardiovascular disease possibly due to increased plaque inflammation. Human studies suggest that limitation of interleukin-6 (IL-6) signaling could be beneficial in people with large CH clones, particularly in TET2 CH. Here we show that IL-6 receptor antibody treatment reverses the atherosclerosis promoted by Tet2 CH, with reduction of monocytosis, lesional macrophage burden and macrophage colony-stimulating factor 1 receptor (CSF1R) expression. IL-6 induces expression of Csf1r in Tet2-deficient macrophages through enhanced STAT3 binding to its promoter. In mouse and human Tet2-deficient macrophages, IL-6 increases CSF1R expression and enhances macrophage survival. Treatment with the CSF1R inhibitor PLX3397 reversed accelerated atherosclerosis in Tet2 CH mice. Our study demonstrates the causality of IL-6 signaling in Tet2 CH accelerated atherosclerosis, identifies IL-6-induced CSF1R expression as a critical mechanism and supports blockade of IL-6 signaling as a potential therapy for CH-driven cardiovascular disease.
Introduction
Clonal hematopoiesis (CH) occurs when somatic mutations in hematopoietic stem and progenitor cells (HSPCs) permit clonal expansion of mutant leukocytes in the blood1,2. CH prevalence increases with age such that approximately 10% of people by age 70 years develop CH with a variant allele frequency (VAF) equal to or greater than 2%, also known as CH of indeterminate potential (CHIP)3. Several studies have implicated CH as an independent risk factor for cardiovascular diseases, including myocardial infarction4,5, stroke6 and heart failure7–9, providing a potential explanation for the increased non-cancer mortality in individuals with CH. The most commonly mutated genes in CH mediate epigenetic modifications (TET2, DNMT3A), chromatin accessibility (ASXL1) or cytokine signaling (JAK2)10. Inflammation contributes importantly to cardiovascular diseases. Sentinel clinical studies, including the Canakinumab Anti-inflammatory Thrombosis Outcomes Study (CANTOS), the Colchicine Cardiovascular Outcomes Trial (COLCOT) and low-dose colchicine-2 (LoDoCo2) showed reduced cardiovascular events by inhibition of interleukin-1β (IL-1β) or LoDoCo2 treatment, establishing the contribution of inflammation to human cardiovascular diseases11–13. However, the increased risk of infection in CANTOS and in COLCOT may limit clinical application, indicating a pressing need for alternative anti-inflammatory approaches and for more selective targeting of treatment in patients with increased inflammatory risk. While the detailed mechanisms underlying the increased cardiovascular disease risk for each CH mutant may differ5, pro-inflammatory cytokine levels increase in individuals with TET2, DNMT3A or JAK2V617F CH, suggesting a link between CH, inflammation and increased risk of cardiovascular disease4. Consistently, increased active IL-1β release due to NLRP3 inflammasome activation in Tet2 mutant macrophages or as a result of AIM2 inflammasome activation in Jak2V617F macrophages drives a pro-inflammatory milieu that promotes atherosclerosis in mice14,15.
The pleiotropic cytokine interleukin-6 (IL-6) mediates its cellular effects via direct signaling, trans-signaling and potentially trans-presentation16,17. Elevated levels of IL-6 or its downstream product C-reactive protein (CRP) have been associated with increased atherosclerotic cardiovascular disease (CVD) events in many human studies18–21. Most CH variants are associated with elevated levels of IL-6 (22,23). IL-1β is a key inducer of IL-6 (24); increased signaling through the IL-1β–IL-6 axis may contribute to atherosclerotic CVD. In CANTOS, IL-1β antibody reduced CVD in patients who achieved lower on-treatment IL-6 levels but not in patients who had IL-6 levels above the study median value25. Furthermore, individuals with a common IL-6 receptor (IL-6R) variant, D358A, which limits IL-6 action, displayed both reduced CRP and CVD events26,27. The role of IL-6 signaling in CVD in CH is supported by a study that showed that IL-6RD358A attenuated CVD event risk among participants with large CH clones but not in individuals without CH22. This protective association was detected primarily in TET2 and DNMT3A CH22. In another population, this relationship only pertained to TET2 CH28, whereas a recent study describing results in approximately 430,000 individuals from the UK Biobank (UKB) did not confirm modification of CVD risk in CH by the IL-6RD358A variant29. However, this negative result may have been influenced by inaccurate mutation calling; an independent study using greater sequencing depth in the same population confirmed the protective effect of the IL-6RD358A variant on CVD risk30. Studies in mouse atherosclerosis with reduced IL-6 or IL-6 signaling produced variable results16,31–33, but did not evaluate a setting of increased IL-6 involvement as in CH. These studies highlight the need to assess the causal role of IL-6 signaling in atherosclerosis in a mouse Tet2 CH.
To address these important unresolved issues, we undertook a study of IL-6R antagonism in Tet2 mutant CH mice and found that blockade of IL-6R signaling by a neutralizing antibody reversed accelerated atherosclerosis, thereby pointing to a potential therapeutic approach to reducing CVD risk in TET2 mutant CH.
Results
IL-6R antagonism reduces monocytosis in Tet2 CH
To test whether there is elevated IL-6 expression in atherosclerotic lesions in Tet2-deficient mice, we performed IL-6 immunostaining in aortic root lesions from low-density lipoprotein (LDL) receptor-deficient (Ldlr−/−) mice transplanted with Tet2−/− and littermate control bone marrow and fed a Western diet (WD) for 12 weeks. As reported4, Tet2−/−-transplanted Ldlr−/− mice showed an increased lesion area (Extended Data Fig. 1a). We observed significantly increased IL-6 staining in lesional macrophages of Tet2−/− mice compared to controls (Fig. 1a). Previous studies showed that IL-1β, a product of the NLRP3 inflammasome, induces IL-6 and that pharmacological NLRP3 inflammasome inhibition reduces accelerated atherosclerosis in Tet2 CH mice14. We found that Tet2-deficient macrophages produced higher levels of IL-6 and IL-1β than wild-type (WT) macrophages in response to NLRP3 inflammasome activation (Extended Data Fig. 1b,c), as reported elsewhere4,14. However, IL-1β-blocking antibodies only modestly reduced IL-6 production in control and Tet2-deficient macrophages (Extended Data Fig. 1b). In contrast, IL-1β blocking antibodies significantly reduced IL-1β levels in similar experiments (Extended Data Fig. 1c). This shows that a substantial proportion of IL-6 produced by Tet2-deficient macrophages does not depend on IL-1β signaling, which is consistent with a previous report that Tet2 mediates active repression of IL-6 transcription34. Thus, therapeutic inhibition of IL-6 would not be expected to phenocopy NLRP3 or IL-1β inhibition in Tet2 CH.
Fig. 1 |. Increased monocytosis in Tet2 CH mice is seen with reversal by IL-6R antibody administration.

a, Ldlr−/− male mice were transplanted with WT or Tet2 knockout male mice bone marrow. After 6 weeks of bone marrow reconstitution, WT Ldlr−/− (n = 9) and Tet2 knockout Ldlr−/− (n = 10) mice were fed a WD for 12 weeks. The aortic root sections stained for IL-6 (red) and macrophage marker (anti-Mac2, green) are shown. Scale bar, 50 μm. Two-tailed, unpaired t-test. MFI, mean fluorescence intensity. b, Experimental design and timeline. c, CD45.2+ white blood cells as a percentage of total CD45+ white blood cells, evaluated using flow cytometry. n = 15 mice per group. One-way analysis of variance (ANOVA) followed by Tukey test for multiple comparisons. d, Enzyme-linked immunosorbent assay (ELISA) measurement of plasma SAA. Ctrl + IgG, n = 15; Tet2 CH + IgG, n = 15; Ctrl + anti-IL-6R, n = 13; Tet2 CH + anti-IL-6R, n = 14. One-way ANOVA followed by Tukey test for multiple comparisons. e–g, Circulating Ly6Chi, Ly6Clo and total monocytes (e), neutrophils (f), and CD45.2 or CD45.1 Ly6Chi, Ly6Clo and total monocyte (g) were quantified as the percentage of total CD45+ white blood cells using flow cytometry. n = 15 mice per group. One-way ANOVA followed by Tukey test for multiple comparisons. h, Flow cytometry analysis of aortic CD11b+ cells and macrophages shown as a percentage of CD45+ aortic cells (brachiocephalic artery and descending aorta). Each point contains combined, digested aortic cells from n = 2 or n = 3 mice. One-way ANOVA followed by Tukey test for multiple comparisons. BV421, Brilliant Violet 421 stain. All data are the mean ± s.e.m.
To assess the impact of IL-6 antagonism on atherogenesis, we administered IL-6R-blocking antibody to Ldlr−/− mice with Tet2 CH or controls. To simulate human CH, in which somatic mutation occurs in HSPCs, we transplanted bone marrow from mice with HSPC-selective Tet2 deficiency using inducible SCL-Cre (Tet2loxP/loxP; SCL-Cre-ERT mice) or littermate SCL-Cre− mice (Tet2loxP/loxP). Before transplantation, we treated donor mice with tamoxifen to induce the expression of Cre recombinase together with a Tet2 mutant reporter (tdTomato+). Moreover, significantly increased CVD and protection by the IL-6R variant occurs in individuals with a larger clone size (VAF > 10%)22,23. Thus, we lethally irradiated Ldlr−/− mice and transplanted them with chimeric Tet2-deficient bone marrow cells containing 40% CD45.2 Tet2loxP/loxP; SCL-Cre-ERT cells and 60% CD45.1 WT cells (Tet2 CH). A control group was transplanted with mixed bone marrow consisting of 40% CD45.2 Tet2loxP/loxP and 60% CD45.1 WT cells. Six weeks after bone marrow reconstitution and 2 weeks after commencing the WD, control and Tet2 CH mice were treated with isotype IL-6R-blocking antibody35,36 or an isotype-matched IgG control for another 10 weeks together with a WD (Fig. 1b). The antibody we used effectively inhibited IL-6R signaling in macrophages (Extended Data Fig. 1d). At the end of the study, we did not observe any significant differences in overall counts of white blood cells, red blood cells or platelets among the groups (Extended Data Fig. 1e–g). However, we found that CD45.2 Tet2-deficient cells expanded to approximately 60% of white blood cells compared to approximately 45% CD45.2 control cells in the same setting; IL-6R antibody administration did not alter the burden of Tet2-deficient cells in blood compared to the IgG group (Fig. 1c). Hematopoietic Tet2 deficiency or IL-6R antagonism did not alter body weight, plasma cholesterol or triglyceride levels, or liver weight (Extended Data Fig. 1h–k). However, Tet2 CH increased spleen weight in the IgG group but not in the anti-IL-6R group (Extended Data Fig. 1l). As reported previously14, there was increased caspase 1 cleavage and activation, and elevated mature IL-1β production, in Tet2 CH splenic macrophages and neutrophils indicating inflammasome activation (Extended Data Fig. 1m). However, IL-6R antagonism did not affect inflammasome activation (Extended Data Fig. 1m).
Plasma concentrations of the acute phase reactant serum amyloid A (SAA), an inflammatory marker downstream of IL-6 analogous to CRP in humans37, rose markedly in Tet2 CH mice; IL-6R antagonism abrogated this increase (Fig. 1d). In the absence of IL-6R antagonism, there was a significant expansion of monocytes including Ly6Chi and Ly6Clo subsets (Fig. 1e) without significant change in neutrophil counts (Fig. 1f) in Tet2 CH hyperlipidemic mice. Remarkably, lL-6R antagonism completely reversed monocytosis (Fig. 1e). By further profiling the myeloid cell compartment, we found that expansion of CD45.2 Tet2-deficient cells but not of CD45.1 control cells contributed to monocytosis in Tet2 CH mice (Fig. 1g), indicating a cell autonomous effect of IL-6 in Tet2-deficient cells.
IL-6R blockade reduces atherosclerosis in Tet2 CH mice
Monocytosis, a CVD risk factor in humans38, increases in atherosclerosis-prone mice in response to a high cholesterol diet, contributing to the accumulation of mononuclear phagocytes in atherosclerotic lesions39–41. Consistently, we observed an increase in aortic monocytes and macrophages in Tet2 CH mice that was reversed by IL-6 antibody administration (Fig. 1h). In line with previous reports4,14, analysis of atherosclerotic plaques in aortic roots showed larger lesions in Tet2 CH mice (Fig. 2a). A significant increase in the lesion area in Tet2 CH mice was no longer observed in mice treated with IL-6R antibodies (Fig. 2a). IL-6R antagonism reversed the markedly increased macrophage staining area in the atheroma of Tet2 CH compared to mice WT for Tet2 (Fig. 2b). Furthermore, by evaluating lesional Tet2-deficient macrophages that expressed tdTomato, we found that IL-6R neutralization reduced the Tet2-deficient:control macrophage ratio (Fig. 2c), indicating a disproportionate reduction in Tet2-deficient macrophages. IL-6R antagonism also increased the area of the fibrous cap, a structure implicated in the resistance of human plaques to rupture and thrombosis42, but did not alter this measurement in control Ldlr−/− mice (Fig. 2d). In contrast, Tet2 CH did not significantly increase the necrotic core area, neither did IL-6R administration reduce it (Fig. 2e), suggesting no major impact on necrotic cell death or clearance. Single-cell RNA sequencing (scRNA-seq) has shown several macrophage subtypes in atherosclerotic lesions, including TREM2hi noninflammatory and inflammatory macrophage populations43. Lesional TREM2+ macrophage staining showed no difference among groups (Extended Data Fig. 1n). While there was higher lesional IL-1β expression in Tet2 CH, this was not affected by IL-6R administration (Extended Data Fig. 1o).
Fig. 2 |. IL-6R antagonism ameliorates atherosclerosis in Tet2 CH mice.

a, Hematoxylin and eosin (H&E) staining and quantification of total lesion area in the aortic root. Scale bar, 200 μm. Except for the Ctrl + Control group (n = 14 mice), the other three groups had n = 15 mice per group. One-way ANOVA followed by Tukey test for multiple comparisons. b, Immunofluorescence staining of macrophages (anti-Mac2, green) in aortic roots and quantification of Mac2+ area per section. Scale bar, 250 μm. Except for the Ctrl + Control group (n = 14 mice), the other three groups had n = 15 mice per group. One-way ANOVA followed by Tukey test for multiple comparisons. c, Immunofluorescence staining of tdTomato+ macrophages (anti-red fluorescent protein, red) and quantification as the percentage of total Mac2 area (anti-Mac2, green) with or without IL-6R antibody treatment in Tet2 CH mice. Scale bar, 250 μm. n = 13 mice in the Tet2 CH + Ctrl group, n = 15 mice in the Tet2 CH + anti-IL-6R group. Two-tailed unpaired t-test. d, Aortic root sections were stained with Masson’s trichrome stain for the fibrous cap (red, outlined by the dashed lines). The bar graph shows the quantification. Scale bar, 100 μm. Except for the Ctrl + Control group (n = 13 mice), the other three groups had n = 15 mice per group. One-way ANOVA followed by Tukey test for multiple comparisons. e, H&E staining and quantification of the necrotic core area in the aortic root. Necrotic core regions are indicated by the dashed lines. Scale bar, 100 μm. Except for the Ctrl + Control group (n = 14 mice), the other three groups had n = 15 mice per group. One-way ANOVA followed by Tukey test for multiple comparisons. f, Immunofluorescence staining of macrophage (anti-Mac2, green) CSF1R expression (red) in aortic roots and quantification of macrophage CSF1R MFI in aortic root cross-sections. Scale bar, 50 μm. Ctrl + Control and Tet2 CH + Control, n = 12 mice per group. Ctrl + anti-IL-6R and Tet2 CH + anti-IL-6R, n = 13 per group. One-way ANOVA followed by Tukey test for multiple comparisons. g, The CSF1R expression in monocytes from the bone marrow was assessed using flow cytometry and immunoblotting. n = 6 mice per group. One-way ANOVA followed by Tukey test for multiple comparisons. h, Immunofluorescence staining of macrophages (anti-Mac2, green) proliferation (anti-Ki67, red) in aortic roots and quantification of Ki67+Mac2+ cells per section. Scale bar, 50 μm. Except for the Ctrl + Control group (n = 13 mice), the other three groups had n = 15 mice per group. One-way ANOVA followed by Tukey test for multiple comparisons. i, Immunofluorescence staining of cleaved caspase 3 (anti-cleaved caspase 3, red) and macrophage (anti-Mac2, green) in the aortic roots and quantification of cleaved caspase 3+/Mac2+ cells per section. Scale bar, 50 μm. Except for the Ctrl + Control group (n = 14 mice), the other three groups had n = 15 mice per group. One-way ANOVA followed by Tukey test for multiple comparisons. All data are the mean ± s.e.m.
Multiple studies showed increased macrophage colony-stimulating factor 1 (CSF1) in human and experimental atherosclerotic plaques44,45, and this hematopoietic growth factor promotes macrophage accumulation in mouse lesions46–48. CSF1 promotes monocytosis as well as monocyte to macrophage conversion and profoundly affects plaque area and macrophage burden44,49,50. The changes in monocytosis and prominent macrophage burden in Tet2 CH suggested the possibility of increased CSF1 signaling. Accordingly, Tet2 CH mice showed increased CSF1R staining in lesional macrophages that IL-6R antagonism reversed, with no effect in controls (Fig. 2f). We also found increased CSF1R expression on bone marrow monocytes in Tet2 CH mice, which was decreased by IL-6R antibody administration (Fig. 2g). In addition, monocytes isolated from Tet2+/− mice showed increased CSF1R expression compared to controls (Extended Data Fig. 1p).
To assess the impact of IL-6R antagonism on myelopoiesis, we performed studies on bone marrow HSPC populations (Extended Data Fig. 2a). While the overall number of cells in these populations was not affected by Tet2 CH or IL-6R antibody treatment (Extended Data Fig. 2b), there was increased expression of CSF1R in short-term hematopoietic stem cells, multipotent progenitors, common myeloid progenitors (CMPs) and granulocyte-monocyte progenitors (GMPs) from Tet2 CH mice, which was reversed by IL-6R antibody treatment (Extended Data Fig. 2c–h). These findings suggest that the cell autonomous expansion of Tet2−/− monocytes and its reversal by IL-6R antibodies may be mediated through increased CSF1R expression.
CSF1 signaling can promote both proliferation and survival of macrophages46,51. We did not find a significant difference in macrophage proliferation as determined by Ki67 staining in Tet2 CH compared with control mice with or without IL-6R blockage (Fig. 2h). In contrast, IL-6R antagonism reversed a decline in apoptosis assessed by cleaved caspase 3 in Tet2 CH lesions (Fig. 2i). These findings are reminiscent of previous reports that loss of Tet2 impairs hematopoietic cell apoptosis52,53. Together, these findings suggest that IL-6R antagonism ameliorates atherosclerosis in Tet2 CH, at least in part by annulling the effect of CSF1R signaling on myelopoiesis, monocytosis and on macrophage survival in atherosclerotic plaques.
IL-6 induces Csf1r expression in Tet2-deficient macrophages
To investigate the underlying mechanisms of macrophage expansion in plaques, we carried out in vitro studies using bone marrow-derived macrophages (BMDMs). This showed the synergistic effects of IL-6 and Tet2 deficiency to increase CSF1R levels that were largely reversed by IL-6 antagonism (Fig. 3a). To investigate whether IL-6 regulates Csf1r expression at the transcriptional level, we treated control and Tet2-deficient BMDMs with IL-6 and found a sustained increase of Csf1r mRNA levels in Tet2-deficient cells, whereas Csf1r expression was unchanged in control cells (Fig. 3b). In Tet2−/− macrophages, binding of STAT3 to the Csf1r promoter region was increased after 2 h in response to IL-6 and remained elevated for up to 24 h (Fig. 3c). STAT3 phosphorylation in response to IL-6 is critical in the regulation of STAT3 activation54. However, STAT3 phosphorylation was unaltered in Tet2−/− macrophages compared to controls (Extended Data Fig. 3a), suggesting that mechanisms other than phosphorylation favor STAT3 promoter binding. Besides phosphorylation, reversible acetylation of STAT3 by histone deacetylases (HDACs) also regulates its transcriptional activation in response to IL-6 (refs. 55–58). TET2 can recruit HDACs to target proteins, facilitating deacetylation34. This suggested the hypothesis that Tet2 deficiency might increase binding of STAT3 to the Csf1r promoter by increasing STAT3 acetylation. In support of this hypothesis, we showed an increase of acetylated STAT3 in the nucleus of Tet2−/− BMDMs compared to WT controls (Fig. 3d). To further assess the potential role of reduced deacetylation in IL-6-promoted Csf1r expression in Tet2−/− macrophages, we treated cells with the HDAC inhibitor trichostatin A (TSA). TSA significantly increased the level of STAT3 acetylation in the control macrophage nuclei up to that in the Tet2−/− nuclei (Extended Data Fig. 3b). Importantly, chromatin immunoprecipitation (ChIP) and quantitative PCR (qPCR) analysis showed that TSA treatment enhanced the level of STAT3 binding to the Csf1r promoter (Fig. 3e) and the level of Csf1r mRNA in control macrophages to that in Tet2−/− macrophages (Fig. 3f), paralleling the increased STAT3 acetylation in control macrophages and abrogating the difference between the genotypes.
Fig. 3 |. IL-6 increases CSF1R expression and apoptosis resistance in Tet2-deficient macrophages.

a, BMDMs were treated with IL-6 (25 ng ml−1) with or without IL-6R antibody (100 μg ml−1) for 48 h; CSF1R expression was assessed by immunoblot. n = 5 independent experiments. One-way ANOVA followed by Tukey test for multiple comparisons. b, mRNA level of Csf1r in BMDMs with or without IL-6 (25 ng ml−1) treatment. n = 5 independent experiments. One-way ANOVA followed by Tukey test for multiple comparisons. c, STAT3 binds to the Csf1r promoter area, as shown by ChIP assay after IL-6 (25 ng ml−1) treatment, shown as the percentage of input. n = 3 independent experiments. Two-tailed, unpaired t-test. d, BMDMs were treated with IL-6 (25 ng ml−1) for 2 h and the levels of nuclear STAT3 acetylation and total STAT3 were determined by immunoblot. Lamin A/C is the nuclear protein marker. n = 8 independent experiments. One-way ANOVA followed by Tukey test for multiple comparisons. e, BMDMs were pretreated with TSA (100 nM) or dimethyl sulfoxide (DMSO) for 1 h and then incubated with IL-6 (25 ng ml−1) for 2 h. STAT3 binds to the Csf1r promoter area as shown by the ChIP–qPCR assay, shown as the percentage of the input. n = 4 independent experiments. One-way ANOVA followed by Tukey test for multiple comparisons. f, Ctrl and Tet2 knockout macrophages were pretreated with TSA (100 nM) or DMSO for 1 h and then incubated with or without IL-6 (25 ng ml−1) for 8 h. Csf1r mRNA was quantified by qPCR. n = 4 independent experiments. One-way ANOVA followed by Tukey test for multiple comparisons. g, Quantification of annexin V+ macrophages by flow cytometry with or without IL-6 (25 ng ml−1) in serum-free medium for 48 h. n = 6 independent experiments. One-way ANOVA followed by Tukey test for multiple comparisons. h, Immunoblot of cleaved caspase 3 in macrophages with or without IL-6 (25 ng ml−1) in serum-free medium for 48 h. The bar graph shows the quantification of the immunoblots. n = 6 independent experiments. One-way ANOVA followed by Tukey test for multiple comparisons. i, Immunoblot of p-PI3K, PI3K, p-Akt, Akt and β-actin with or without 30-min treatment with IL-6 (25 ng ml−1). n = 5 independent experiments. One-way ANOVA followed by Tukey test for multiple comparisons. j, Macrophages were treated with or without IL-6 (25 ng ml−1) or the CSF1R inhibitor PLX3397 (1 μM) for 48 h in serum-free medium; the bar graph shows annexin V+ macrophages as a percentage of total macrophages as assessed using flow cytometry. n = 5 independent experiments. One-way ANOVA followed by Tukey test for multiple comparisons. k, Macrophages were pretreated with or without PLX3397 (1 μM) for 1 h followed by another 30 min with or without IL-6 (25 ng ml−1) treatment. Expression of p-PI3K, PI3K, p-Akt, Akt and β-actin was analyzed by immunoblot. n = 5 independent experiments. One-way ANOVA followed by Tukey test for multiple comparisons. All data are the mean ± s.e.m.
TET2 proteins typically decrease promoter DNA methylation and thereby increase promoter activity, while DNA methyltransferases (DNMTs) have the opposite effect59. However, using the methylated DNA immunoprecipitation assay we found reduced Csf1r promoter methylation beginning 4 h after IL-6 administration and continuing for 24 h in Tet2-deficient macrophages (Extended Data Fig. 3c). IL-6 signaling can reduce promoter methylation by reducing expression of DNMTs in target cells60. We found that IL-6 treatment mildly suppressed DNMT3A levels in Tet2-deficient macrophages but not DNMT1 and DNMT3B levels (Extended Data Fig. 3d), suggesting that decreased methylation of the Csf1r promoter may also enable STAT3 binding. However, treatment of the cells with the DNMT inhibitor 5-azacytidine did not reduce the elevated mRNA levels and increased STAT3 binding in Tet2−/− macrophages compared to controls (Extended Data Fig. 3e,f). This suggests that decreased methylation may be secondary to increased transcriptional activity at the Csf1r promoter, which is consistent with increased STAT3 binding to the promoter at 2 h (Fig. 3c) before decreased demethylation (Extended Data Fig. 3c). Consistently, TSA treatment for 4 h abolished the methylation difference between the two groups in response to IL-6 (Extended Data Fig. 3g). Together, these data suggest that TET2 limits Csf1r expression by facilitating STAT3 deacetylation and restricting its binding to the Csf1r promoter in response to IL-6. In Tet2 deficiency, increased STAT3 acetylation and promoter binding may lead to increased Csf1r transcription in association with a secondary reduction of promoter methylation.
Apoptosis resistance in Tet2-deficient macrophages
To determine whether increased CSF1R expression in Tet2-deficient macrophages regulates their survival, we assessed the viability of BMDMs lacking Tet2 compared to control macrophages after serum withdrawal, a method known to cause apoptosis in macrophage61. Indeed, Tet2-deficient BMDMs showed increased cell viability as assessed by annexin V staining in the basal state, with a further increase on IL-6 treatment (Fig. 3g). Tet2-deficient macrophages expressed significantly lower levels of cleaved caspase 3 after IL-6 treatment, indicating reduced apoptotic cell death (Fig. 3h). Tet2+/− macrophages treated with IL-6 also showed increases in CSF1R expression and reduced caspase 3 cleavage (Extended Data Fig. 4). CSF1 enhances macrophage survival by increasing PI3K and Akt signaling62,63. To assess whether these upstream events contribute to the survival of Tet2-deficient macrophages, we performed immunoblotting and found hyperactive p-PI3K and p-Akt in Tet2-deficient cells (Fig. 3i). To assess the causality of CSF1R, PI3K and Akt signaling in apoptosis resistance of Tet2-deficient macrophages, we used pexidartinib (PLX3397), a selective CSF1R inhibitor approved for the treatment of tenosynovial giant cell tumors64. PLX3397 abolished apoptosis resistance in Tet2-deficient macrophages (Fig. 3j) without affecting macrophage survival in controls. This effect of PLX3397 paralleled the selective reversal of elevated PI3K and Akt signaling in Tet2-deficient macrophages (Fig. 3k). Taken together, our data show that the induction of the PI3K–Akt signaling pathway due to increased CSF1R expression in Tet2-deficient macrophages in response to IL-6 is responsible for decreased apoptosis and increased macrophage survival.
CSF1R antagonism reduces atherosclerosis in Tet2 CH
To assess the in vivo role of increased CSF1R activity in accelerated atherosclerosis in Tet2 CH, we treated mice with PLX3397, a potential treatment for atherosclerosis. Tet2 CH mice were fed a WD for 7 weeks followed by another 5 weeks with or without PLX3397-formulated WD feeding (Fig. 4a). Food intake, plasma total cholesterol, body weight and liver weight were unaltered by PLX3397 (Extended Data Fig. 5a–d). The treatment resulted in a slight decrease in spleen weight in control mice and reversed splenomegaly in Tet2 CH mice (Extended Data Fig. 5e). PLX3397 reduced circulating Ly6Chi, Ly6Clo and total monocyte counts in both groups of mice to the same level (Fig. 4b) without affecting neutrophils (Fig. 4b), the burden of Tet2-deficient cells (Fig. 4c) and other cell counts in the blood (Extended Data Fig. 5f). Importantly, CSF1R inhibition completely reversed accelerated atherosclerosis in Tet2 CH mice to the level of controls (Fig. 4d). There was also a modest decrease in atherosclerosis in controls, which is consistent with the known role of CSF1 signaling in promoting atherosclerosis in standard mouse atherosclerosis models46,65,66 (Fig. 4d). After treatment with PLX3397, macrophage staining in atheromas from Tet2 CH and controls was significantly reduced, and the difference between the two groups was eliminated (Fig. 4e). These in vivo results validate that elevated CSF1R is a major downstream effector of IL-6 signaling promoting atherogenesis in Tet2 CH mice.
Fig. 4 |. Accelerated atherosclerosis in Tet2 CH mice is reversed by PLX3397.

a, Experimental design and timeline. Ctrl and Tet2 CH mice were fed a WD for 7 weeks followed by another 5 weeks with or without PLX3397 (200 mg kg−1) formulated WD feeding. b, Circulating Ly6Chi and Ly6Clo, total monocyte and neutrophils were quantified as the percentage of total CD45+ white blood cells using flow cytometry. n = 11 mice in the Ctrl + Control group, n = 12 mice in the Tet2 CH + Control group, n = 13 mice in the Ctrl + PLX3397 group and n = 13 mice in the Tet2 CH + PLX3397 group. One-way ANOVA followed by Tukey test for multiple comparisons. c, CD45.2+ white blood cells as a percentage of total CD45+ white blood cells in the blood, evaluated using flow cytometry. n = 11 mice in the Ctrl + Control group, n = 12 mice in the Tet2 CH + Control group, n = 13 mice in the Ctrl + PLX3397 group and n = 13 mice in the Tet2 CH + PLX3397 group. One-way ANOVA followed by Tukey test for multiple comparisons. d, H&E staining and quantification of the total lesion area in the aortic root. Scale bar, 200 μm. n = 11 mice in the Ctrl + Control group, n = 12 mice in the Tet2 CH + Control group, n = 13 mice in the Ctrl + PLX3397 group and n = 13 mice in the Tet2 CH + PLX3397 group. One-way ANOVA followed by Tukey test for multiple comparisons. e, Immunofluorescence staining of macrophages (anti-Mac2, green) in the aortic roots and quantification of Mac2+ area per section. Scale bar, 250 μm. n = 11 mice in the Ctrl + Control group, n = 12 mice in the Tet2 CH + Control group, n = 13 mice in the Ctrl + PLX3397 group and n = 13 mice in the Tet2 CH + PLX3397 group. One-way ANOVA followed by Tukey test for multiple comparisons. All data are the mean ± s.e.m.
TET2−/− macrophages show higher CSF1R and resist apoptosis
To test the human relevance of our finding, we used a TET2-deficient human embryonic stem cell (ESC) line (TET2−/−) previously generated by CRISPR–Cas9-mediated gene editing67. We induced differentiation of this line along with an isogenic control TET2+/+ ESC line into HSPCs (Fig. 5a). Relative to control HSPCs, TET2−/− HSPCs showed slightly higher levels of CSF1R expression both in the basal state and after IL-6 treatment (Fig. 5b,c). Increased CSF1R expression was more pronounced in TET2−/− lineage-committed cells (CD34+CD45+) compared to their TET2+/+ counterparts (Fig. 5d). After differentiation into macrophages, there was a similar expression of CD68, CD16, CD14 and CD86, and a small increase in HLA-DR in TET2−/− macrophages compared to controls (Extended Data Fig. 6a), suggesting no major effect of TET2 deficiency on the differentiation process per se. In contrast, CSF1R expression markedly increased along the differentiation process into macrophages; the increased expression of CSF1R in TET2−/− relative to TET2+/+ macrophages was even more pronounced compared to that in lineage-committed cells (Fig. 5e,f). Additionally, IL-6 treatment increased CSF1R mRNA and protein levels in TET2−/− but not control macrophages (Fig. 5g,h), as we had observed in mouse BMDMs (Fig. 3a,b). CSF1R protein levels were also higher in the basal state in TET2−/− macrophages (Fig. 5h).
Fig. 5 |. Human ESC-derived TET2-deficient macrophages show increased CSF1R expression and resistance to apoptosis after IL-6 treatment.

a, Schematic summary of the human ESC line phenotypic marker from progenitors to macrophages. b, Gating strategy and verification of CD34+ control and TET2−/− progenitors or lineage-committed CD34+CD45+ cells. c,d, Control and TET2−/− human ESC CD34+ progenitors (c) or CD34+/CD45+ cells (d) were treated with or without human IL-6 (25 ng ml−1) for 48 h. Representative histograms showing CSF1R expression, with statistics showing the CSF1R MFI. n = 3 independent experiments. One-way ANOVA followed by Tukey test for multiple comparisons. e, Gating strategy and verification of control and TET2−/− human ESC-derived macrophages. f, Control and TET2−/− human ESC-derived macrophages were treated with or without human IL-6 (25 ng ml−1). Representative histogram showing CSF1R expression as quantified using flow cytometry. n = 3 independent experiments. One-way ANOVA followed by Tukey test for multiple comparisons. g, Control and TET2−/− human ESC-derived macrophages were treated with human IL-6 (25 ng ml−1) for 8 h; Csf1r mRNA levels were determined using qPCR. n = 3 independent experiments. One-way ANOVA followed by Tukey test for multiple comparisons. h, Control and TET2−/− human ESC-derived macrophages were treated with or without human IL-6 (25 ng ml−1). CSF1R expression was assessed using immunoblotting. C, control; T, TET2−/−. n = 3 independent experiments. One-way ANOVA followed by Tukey test for multiple comparisons. i, Control and TET2−/− human ESC-derived macrophages were treated with or without oxidized LDL (50 μg ml−1), acetylated LDL (50 μg ml−1) or cholesterol crystals (100 μg ml−1) overnight and then challenged with LPS (20 ng ml−1) for 4 h with fresh medium. The secreted IL-6 level was quantified using ELISA. n = 6 independent experiments. Two-tailed, unpaired t-test. j, Annexin V+ human ESC-derived macrophage percentage of total macrophages as assessed using flow cytometry and immunoblotting of cleaved caspase 3 treated with or without human IL-6 (25 ng ml−1) for 48 h. n = 3 independent experiments. One-way ANOVA followed by Tukey test for multiple comparisons. k, Immunoblot and quantification of p-PI3K, PI3K, p-Akt, Akt and β-actin. n = 3 independent experiments. One-way ANOVA followed by Tukey test for multiple comparisons. l, Human TET2 CH (n = 6) and Control (n = 8) peripheral blood mononuclear cell (PBMC) CSF1R RNA was quantified in CD16+ monocytes using scRNA-seq. Two-tailed, unpaired t-test. All data are the mean ± s.e.m.
As found in mouse macrophages4,14, lipopolysaccharide (LPS) stimulation significantly increased IL-6 secretion in TET2−/− macrophages (Fig. 5i); the effect of LPS was amplified by adding atherogenic ligand pretreatment (Fig. 5i). Similar results were found in mouse macrophages (Extended Data Fig. 5g). The markedly increased plasma SAA levels, reversed by IL-6R antibody treatment (Fig. 1d), indicated increased systemic IL-6 signaling in Tet2 CH. While no single ‘athero-relevant’ stimulus has been identified, taken together these data indicate that atherosclerosis-relevant stimuli in combination can elicit IL-6 expression.
TET2−/− macrophages resisted cell death under basal conditions and after IL-6 treatment (Fig. 5j); this improved the survival associated with increased phosphorylation of PI3K and Akt signaling and decreased cleaved caspase 3 levels (Fig. 5j,k). Interestingly, increased p-PI3K was only observed after the addition of IL-6, while increased p-Akt was also seen in the basal state, indicating an additional factor contributing to macrophage survival (Fig. 5k).
To extend these findings to TET2 haploinsufficiency, we generated TET2 haploinsufficient and isogenic control-induced pluripotent stem cells (iPSCs) using CRISPR–Cas9-mediated gene editing68. We observed similar phenotypes in TET2+/− cells to those of TET2−/− compared to controls, including modestly increased CSF1R expression in HSPCs and lineage-committed cells (Extended Data Fig. 6b,c), which were augmented by IL-6 treatment (Extended Data Fig. 6b,c). After 24 d of differentiation, the expression of differentiation markers in TET2+/− cells was similar to that of control cells, with the exception of a modest increase in HLA-DR expression (Extended Data Fig. 6d). Additionally, IL-6 treatment increased CSF1R protein levels in TET2+/− but not control macrophages (Extended Data Fig. 6e,f), and atherogenic ligand pretreatment enhanced LPS-induced IL-6 production in TET2+/− macrophages (Extended Data Fig. 6g), as we observed in TET2−/− macrophages. Finally, in individuals with TET2 CH (n = 6), we found a 1.58-fold higher CSF1R expression among CD16+ monocytes (log2 fold change = 0.66, P = 0.0002), the major monocyte subset expressing CSF1R in humans69, compared to healthy individuals (n = 8); the proportion of CD16+ monocytes expressing CSF1R was elevated in TET2 CH (59% versus 29%) (Fig. 5l), confirming human relevance. In summary, ESC- and iPSC-derived isogenic human macrophages show that TET2 deficiency and IL-6 increase CSF1R levels and promote macrophage survival, with overall similarity to findings in mice. However, there are differences in basal CSF1R protein levels and Akt phosphorylation, perhaps suggesting a species difference.
Discussion
Our study demonstrates a critical role of IL-6 signaling in the development of atherosclerosis in Tet2 CH, suggesting a precision medicine approach that involves targeting IL-6 or IL-6R in TET2 CH. Moreover, we defined a new mechanism in which IL-6 signaling increases acetylation and binding of STAT3 to the Csf1r promoter, resulting in increased expression. Given the profound impact of CSF1 on atherosclerosis46,48,51, which increases monocyte production, monocyte to macrophage conversion, macrophage proliferation and survival46, increased CSF1R is a plausible major mechanism underlying increased atherosclerosis in Tet2 CH mice. This was confirmed by treating mice with the CSF1R inhibitor PLX3397, which suggested an approach to treating accelerated atherosclerosis in Tet2 CH. We showed similar increases in CSF1R in human monocytes and macrophages containing TET2 mutations, suggesting translational relevance. In mice fed an atherogenic diet, IL-6 signaling increased CSF1R expression on bone marrow myeloid progenitors explaining increased production of Tet2−/− monocytes, which is consistent with the role of IL-6 in increasing myelopoiesis in the context of atherosclerosis70. This suggests that IL-6 has both direct atherogenic effects in the vessel wall and indirect effects in the bone marrow (Extended Data Fig. 7).
Earlier studies showed the importance of NLRP3 inflammasome activation and probably IL-1β in promoting atherosclerosis in the Tet2 CH mouse models14. Our study suggests that increased IL-6 production may be in large part independent of IL-1β in Tet2-deficient BMDMs, implying a different therapeutic impact of IL-6 versus IL-1β inhibition in TET2 CH. Moreover, we showed complex changes in Tet2 CH plaque, in addition to increases in lesion area; there were also prominent changes in macrophage burden and fibrous cap thickness. While IL-6R antagonism only modestly affected the plaque area, the treatment completely reversed increased macrophage burden and decreased fibrous cap thickness, parameters implicated in the propensity of human plaques to provoke thrombosis71,72. Interestingly, unlike Jak2V617F CH mice treated with IL-1β antibodies15, there were no changes in the necrotic core area, probably because increased macrophage survival involved decreased apoptosis rather than necrotic cell death.
Previous mouse studies revealed variable effects of IL-6 signaling on atherosclerosis. In part, this may be related to the complexity of the IL-6 pathway: IL-6 promotes direct signaling through the IL-6R in hepatocytes and macrophages. In addition, cleavage of IL-6R leads to release of a soluble fragment that circulates and promotes inflammatory IL-6 trans-signaling in various cell types expressing the signal transducing receptor subunit gp130. Studies showed that IL-6 trans-signaling is proatherogenic73. IL-6 injections worsen mouse atherosclerosis31, whereas IL-6 deficiency either had no impact32,33 or worsened atherosclerosis in atherosclerosis-prone apolipoprotein E-deficient mice32. In the latter study, increased hyperlipidemia may have exacerbated atherosclerosis. IL-6R antagonism reduced lesions in a model with artificially enhanced IL-6 signaling74 but the clinical relevance of this model is uncertain and the effects of IL-6R antagonism in Ldlr−/− mice were variable. Importantly, previous studies were not conducted in a setting where IL-6 levels were specifically increased as a result of an underlying pro-inflammatory mutation. In our study, we found no significant impact of IL-6 antagonism on lesion development in control mice, in striking contrast to the Tet2 CH model with markedly enhanced IL-6 and IL-6R signaling. In our setting, IL-6R antagonism would probably reduce direct and trans-signaling and potentially trans-presentation35,36.
Population studies showed elevated plasma IL-6 in TET2, DNMT3A and ASXL1 clonal hematopoiesis of indeterminate potential (CHIP)23 whereas IL-1β increased only in TET2 CHIP23. In CANTOS, which targeted IL-1β specifically, benefit related to IL-6 levels and participants with TET2 CHIP25 showed greater event reduction than those without CHIP, which is consistent with the results of our study. IL-6 production but not interleukin-1 or inflammasome activation is also increased in Dnmt3a−/− macrophages75,76. This result suggests that antagonizing IL-6 may have a broader spectrum in limiting aggravated atherosclerotic risk due to CHIP than targeting IL-1β. Tocilizumab, an IL-6R antibody, did not significantly alter CVD risk in ENTRACTE, a randomized open-label clinical trial comparing tocilizumab with the tumor necrosis factor receptor antagonist etanercept in patients with rheumatoid arthritis77. However, tocilizumab treatment produces significant elevations in LDL cholesterol and triglyceride levels, which may offset a potential benefit. The strong positive results in the present study probably reflect the underlying increase in IL-6 and its signaling in Tet2 CH. In addition, our use of Ldlr−/− mice obviates the accentuated hyperlipidemia that in humans probably results from IL-6-induced reduction in LDLR78. Our findings emphasize the importance of targeting IL-6 in clinical settings where IL-6 is increased, such as in CHIP or chronic kidney disease79, and the importance of rigorous control of hyperlipidemia in such studies.
Methods
Mice
Tet2loxP/loxP; SCL-Cre-ERT mice, Tet2loxP/+; SCL-Cre-ERT and Cre− littermate mice were originally provided by R. Levine. Tet2 knockout (strain no. 023359), B6 CD45.1 (strain no. 002014) and Ldlr−/− (strain no. 002207) mice were obtained from The Jackson Laboratory. In the PLX3397 treatment cohort, PLX3397 was purchased from MedChemExpress (catalog no. HY-16749) and formulated in WD (no. TD.88137, Envigo) at 200 mg kg−1. Experiments were conducted with recipient mice between the ages of 8 and 26 weeks, depending on the duration of the study. All donor and recipient mice were male and aged between 6 and 10 weeks. All mice used were on a C57BL/6J background and housed in a specific pathogen-free facility under a temperature of approximately 23 °C with a 12-h light–dark cycle. Cages and water were changed every 14–21 d. All animal experiments were conducted in accordance with the Institutional Animal Care and Use Committee of Columbia University (protocol no. AABG0561).
Bone marrow transplantation and antibody administration
Before transplantation, Tet2loxP/loxP; SCL-Cre-ERT mice and Cre− littermates were treated with a tamoxifen dose of 200 mg kg−1 per day twice via oral gavage. Two weeks after administration of the last dose of tamoxifen, whole bone marrow cells were isolated from the femur, hip and tibia by centrifugation at 8,000g for 1 min. For the Tet2 knockout mice and WT littermates, bone marrow cells were directly collected without any treatment. Male recipient mice aged 8–12 weeks (Ldlr−/− mice) were lethally irradiated once with 10.5 Gy from a cesium gamma source. Within 24 h of irradiation, bone marrow was collected from donor mice aged 6–10 weeks old with the indicated genotypes and the total bone marrow cell number was quantified. Irradiated mice were randomized to treatment groups and then received six million total bone marrow cells (via intravenous injection). In the IL-6R treatment cohort, isotype control IgG (10 mg kg−1, catalog no. BE0090, Bio X cell) and IL-6R antibody (10 mg kg−1, catalog no. BE0047, Bio X Cell) were diluted using in vivo dilution buffer (catalog no. IP0070, Bio X Cell). Control and Tet2 CH mice were injected intraperitoneally three times per week for 10 weeks.
Human ESCs and iPSCs
TET2−/− HUES8 human ESCs were previously generated through CRISPR–Cas9 gene editing67. TET2+/− iPSCs were generated through CRISPR-Cas9 gene editing deleting exons 3–11 of one TET2 allele (spanning most of the TET2 coding region) in the WT N-2.12 iPSC line68. Human HUES8 (NIHhESC-09-0021) and MEL-1 (NIHhESC-11-0139) ESCs were cultured on mitotically inactivated mouse embryonic fibroblasts with human ESC medium supplemented with 6 ng ml−1 fibroblast growth factor 2, as described80. Hematopoietic lineage specification was performed according to a previously described spin embryoid body-based protocol to generate hematopoietic progenitor cells through a hemogenic endothelium intermediate80. On day 10 cells were transferred to a macrophage differentiation culture consisting of StemPro-34 serum-free medium with 1% nonessential amino acids, 1 mM l-glutamine and 0.1 mM β-mercaptoethanol, supplemented with 100 ng ml−1 macrophage colony-stimulating factor (M-CSF) and 25 ng ml−1 interleukin-3 for 11 d with media changes every 2 d. Before treatment, differentiated macrophages were resting in M-CSF-free medium for another 24 h before human IL-6 (catalog no. 200–06, PeproTech) treatment.
BMDMs
Bone marrow cells from either male or female 8–12-week-old mice were cultured in DMEM supplemented with 10% heat-inactivated FCS, 100 mg ml−1 streptomycin, 10 U ml−1 penicillin and 20% L-929 fibroblast-CM for 5 d to induce macrophage differentiation.
Atherosclerosis lesion analysis and metabolic profiling
Heart tissue was isolated from Ldlr−/− mice after WD feeding and fixed with 10% formalin solution for 48 h. Fixed heart tissue was embedded in paraffin and then serially sectioned. Six sections per mouse were stained with H&E for total lesion and necrotic core area quantification. Staining of smooth muscle fiber and collagen content was performed using the Masson trichrome staining kit (catalog no. HT15, Sigma-Aldrich) according to the manufacturer’s instructions. Total plasma cholesterol and triglyceride were measured using kits from Wako diagnostics.
Complete blood counts
Complete blood counts were performed using whole blood collected from facial vein bleeding in an EDTA-coated tube and then analyzed with the Forcyte Veterinary Hematology Analyzer (Oxford Science).
Immunofluorescence staining
Paraffin-embedded slides were deparaffinized and rehydrated in Trilogy (catalog no. 920P-09, Cell Marque). The antibodies used for staining included: anti-Mac-2 (1:10,000 dilution, catalog no. CL8942AP, Cedarlane Labs); anti-Ki67 (1:100 dilution, catalog no. ab15580, Abcam); anti-IL-6 (1:100 dilution, catalog no. AF-406-NA, R&D Systems); anti-RPF (1:100 dilution, catalog no. 600-401-379, Rockland); anti-cleaved caspase 3 (1:100 dilution, catalog no. 9661s, Cell Signaling Technology); anti-CSFR (1:100 dilution, catalog no. 3152s, Cell Signaling Technology); anti-TREM2 (1:100 dilution, catalog no. 13483-1-AP, Proteintech); and anti-IL-1β (1:200 dilution, catalog no. ab9722, Abcam). The sections were TREM2-incubated with primary antibodies overnight at 4 °C then incubated with secondary antibodies for 30 min. Secondary antibodies used included: goat anti-rabbit Alexa Fluor 488 (1:200 dilution, catalog no. A-11008, Invitrogen); goat anti-rabbit Alexa Fluor 488 (1:200 dilution, catalog no. A-11012, Invitrogen); and goat anti-rat Alexa Fluor 488 (1:200 dilution, catalog no. A-11006, Invitrogen). Sections were mounted using 4,6-diamidino-2-phenylindole (DAPI). In all immunofluorescence staining, isotype-matched normal IgG was used as the negative control. Data were collected using the Lecia Advanced Fluorescence software v.2.6.0.7266.
Flow cytometry
Flow cytometry was used to characterize PBMC profiles and BMDMs or bone marrow HSPC profiles as described previously81 or human ESC and iPSC cells. For the PBMC profiles and BMDMs, lysed white blood cells or BMDMs were labeled with allophycocyanin/cyanine 7 LIVE/DEAD (catalog no. MP34955, Invitrogen); anti-CD45 (1:100 dilution, catalog no. 103116, BioLegend); anti-CD11b (1:100 dilution, catalog no. 101216, BioLegend); anti-Gr-1 (1:100 dilution, catalog no. 108445, BioLegend); and anti-CD115 (1:50 dilution, catalog no. 135510, BioLegend). For the HSPC profiles, bone marrow cells from mouse femurs and tibias were stained with a cocktail of antibodies to lineage-committed cells (anti-CD45R, CD19, CD11b, CD3e, TER-119, CD2, CD8, CD4 and Ly-6C/G, all FITC-conjugated; 1:100 dilution, catalog no. 22-7770-72, Thermo Fisher Scientific); anti-Sca-1 (1:100 dilution, catalog no. 108120, BioLegend) and anti-c-Kit (1:100 dilution, catalog no.105826, BioLegend) were used to identify LSK and HPC cells. Furthermore, anti-CD48 (1:100 dilution, catalog no. 103441; BioLegend) and anti-CD150 (1:100 dilution, catalog no. 115929, BioLegend) were used to define the LSK subpopulation. Additionally, another set of antibodies including a cocktail of antibodies to lineage-committed and LSK cells (the same as mentioned above) and anti-CD16/CD32 (1:100 dilution, catalog no. 101337, BioLegend) and anti-CD34 (1:100, catalog no. 152216, BioLegend) were used to identify progenitor cell populations including CMPs and GMPs. For the human ESC and iPSC cells, anti-CD45 (1:100 dilution, catalog no. 304006, BioLegend), anti-CD34 (1:100 dilution, catalog no. 343512, BioLegend), anti-CD68 (1:100 dilution, catalog no. 333810, BioLegend), anti-CSF1R (1:100 dilution, catalog no. 347303, BioLegend), anti-CD16 (1:100 dilution, catalog no. 302039, BioLegend), anti-CD14 (1:100 dilution, catalog no. 301813, BioLegend), anti-CD86 (1:100 dilution, catalog no. 305431, BioLegend) and anti-HLA-DR (1:100 dilution, catalog no. 307617, BioLegend) were used to characterize the cells. Flow cytometry was performed using the LSR II flow cytometer (v.1.2.0.142, BD Biosciences) and data were analyzed with the FlowJo software (v.9, BD Biosciences). Isotype-matched normal IgG was used as the control in each flow cytometry assay.
Immunoblotting
Macrophage or human ESCs were lysed in radioimmunoprecipitation buffer containing protease inhibitor on ice for 10 min and then centrifuged at 14,000g for 5 min to generate protein lysates. Nuclear protein lysates were extracted using the kit from Abcam (catalog no. ab113474). Protein concentration was determined by bicinchoninic assays and then mixed with 4× Laemmli buffer and heated at 95 °C for 5 min. Protein was separated by 4–20% gradient SDS–polyacrylamide gel electrophoresis and transferred onto nitrocellulose membranes. Then the membranes were blocked with 5% nonfat milk in Tris-buffered saline with 0.1% Tween 20 and immunostained with primary antibodies: anti-p-AKT (1:1,000 dilution, catalog no. 4060s, Cell Signaling Technology); anti-Akt (1:1,000 dilution, catalog no. 4685, Cell Signaling Technology); anti-p-PI3K (1:1,000 dilution, catalog no. 4228, Cell Signaling Technology); anti-PI3K (1:1,000 dilution, catalog no. 4292s, Cell Signaling Technology); anti-CSFR (1:1,000, catalog no. 3152s, Cell Signaling Technology); anti-caspase 3 (1:1,000 dilution, catalog no. 9661s, Cell Signaling Technology); anti-acetyl-STAT3 (1:1,000 dilution, catalog no. 2523, Cell Signaling Technology); anti-lamin A/C (1:1,000 dilution, catalog no. 4777, Cell Signaling Technology); and β-actin (1:5,000 dilution, catalog no. 4970s, Cell Signaling Technology) at 4 °C overnight and detected using horseradish peroxidase (HRP)-conjugated secondary antibodies including HRP-linked anti-rabbit IgG (1:10,000 dilution, catalog no. 7074S, Cell Signaling Technology), HRP-linked anti-mouse IgG (1:10,000 dilution, catalog no. 7076S, Cell Signaling Technology) and HRP-linked anti-rat IgG (1:10,000, catalog no. 7077S, Cell Signaling Technology).
ChIP–qPCR assay
BMDMs were treated with IL-6 (25 ng ml−1) for the indicated hours. Then macrophages were collected and DNA was isolated using the PureLink Genomic DNA Kit (catalog no. K182001, Thermo Fisher Scientific) according to the manufacturer’s instructions. ChIP-purified chromatin DNA and input DNA were normalized to identical concentrations for qPCR validation and enrichment analysis. Anti-STAT3 (catalog no. 9319, Cell Signaling Technology) was used for chromatin precipitation. Amplification and detection by qPCR were performed on an ABI PRISM 7000 analyzer (Applied Biosystems) with an initial step of 10 min at 95 °C, followed by 40 cycles of 15 s at 95 °C and 1 min at 60 °C. The following qPCR primers were used: Csf1r promoter region: forward, TGTTCCCTTTCAGGCAACCT; reverse, TGTGAGGACGGGAACAGATG. Data were collected using the StepOne software (v.2.2, Thermo Fisher Scientific).
Methylated DNA capture
Control and Tet2 knockout BMDMs were treated with or without IL-6 for 8 h. Then macrophages were collected and DNA was isolated using the PureLink Genomic DNA Kit. Next, using 1 μg of DNA from each sample, methylated DNA was captured and detected using antibodies in the Methylamp Methylated DNA Capture Kit (EpigenTek); then purification of methylated DNA was done according to the manufacturer’s protocol. PCR was conducted using primers targeting the STAT3 binding region in the promoter of Csf1r as describe above; data were quantified as the fold enrichment of methylated DNA in the Control Csf1r promoter. The IgG antibody supplied in the kit was used as the negative control, which does not recognize methylated DNA. Data were collected using the StepOne software.
Primary patient samples
All patients in this study consented to the study procedures under the Vanderbilt University Medical Center (VUMC) institutional review board-approved research protocols (nos. 210022 and 201583) in accordance with the Declaration of Helsinki (2013 version). Patients were recruited via referrals from VUMC clinics based on concern for CH. All patients were confirmed to be without active hematological malignancy at the time of enrollment and sampling. Fresh PBMCs were isolated using Ficoll separation. After low-speed centrifugation, pelleted cells were resuspended in freezing medium (88% FCS and 12% DMSO) and aliquoted into cryotubes. Samples were initially stored at −80 °C for 24–48 h and then placed in liquid nitrogen.
Human sample DNA extraction and CH variant calling
All enrolled patients underwent targeted sequencing to evaluate the presence of CH mutations. DNA was extracted from whole blood using the QIAGEN Mini Kits (catalog no. 27104) according to the manufacturer’s recommendations. We batch-sequenced samples using a custom-made capture panel designed to tile known CH genes on an Illumina NovaSeq 6000. Somatic mutations were called using publicly available methods in workflow description language in Mutect2 on the Broad Institute’s Terra Platform (https://terra.bio/). A putative variant list was formulated and then cross-referenced with a list of known CH driver mutations. Variants were then filtered for read quality, including sequencing depth and minimum alternate allele read depth. Sex was determined based on self-report and findings are applicable to both sexes. There were 8 women and 15 men in this study. Population-level studies of CH do not indicate a sex-specific effect; thus, the study design was not powered to pursue these analyses. Patient mean age was 72 at the time of sampling. CHIP mutations were determined via targeted capture panel, resulting in eight TET2 and six control patients. There were no treatments as a part of this study.
scRNA-seq library preparation
Samples were prepared as described previously82. Briefly, cryopreserved PBMCs from patients with CH and donors were thawed at 37 °C and washed with complete Roswell Park Memorial Institute (RPMI) medium (+10% FCS + 1% PS, complete RPMI) to remove freezing medium. Samples were rested in RPMI for 1 h at 37 °C and 5% CO2. PBMCs from each sample (0.5 million) were plated and pooled after staining with unique hashtag antibody–oligonucleotide conjugates (30 min) as per the manufacturer’s recommendations (TotalSeq-B, BioLegend). Pooled samples were diluted to the manufacturer’s recommended concentration and immediately run on a 10X Chromium Controller after preparation with a 10X Chromium 3′ Library Preparation Kit (10X Genomics) to create the scRNA-seq libraries.
10X scRNA-seq and data preparation
Next-generation 150-nt paired-end sequencing was conducted on an Illumina NovaSeq 6000. The template switch oligonucleotide sequence was trimmed from the 5′ end and the poly(A) tail was trimmed from the 3′ end. Cell Ranger Count (10X Genomics) was used to filter low-quality reads and align to the GRCh38 reference genome using STAR as described elsewhere83. The resulting files from the Cell Ranger pipeline were then converted to Seurat objects84. Demultiplexing was performed using the HTODemux function in the R package Seurat, applying a positive quantile value of 0.99. Cells containing 15% or more reads mapping to the mitochondrial genome were filtered. Similarly, we filtered cells with less than 250 genes and 500 unique molecular identifiers, respectively. Any remaining doublets not removed as part of the HTO demultiplexing were removed with the R package DoubletFinder85, using the first ten principal components. The doublet formation rate was set to 5%, based on standardized doublet rate expectations published by 10X Genomics (https://assets.ctfassets.net/an68im79xiti/6gDArDPBTOg4IIkYEO2Sis/803be2286bba5ca67f353e6baf68d276/CG000148_10x_Technical_Note_Resolving_Cell_Types_as_Function_of_Read_Depth_Cell_Number_RevA.pdf). Individual datasets were integrated with batch correction using a weighted nearest-neighbor approach. Supervised cell annotation was performed using the R package Azimuth using standard parameters and reference uniform manifold approximation and projection (https://zenodo.org/record/4546839#.Ytlg9uzMLS4) yielding expected cell types across all samples.
scRNA-seq differential expression analysis and data visualization
To determine cell state differences in TET2 CH patients and controls, differential expression was calculated using the FindMarkers function from the R package Seurat (v.4.1.1). Differences between cases and controls were quantified using the Wilcoxon rank-sum test. Genes with an absolute log2 fold change greater than 0.25 and adjusted P < 0.05 were considered statistically significant. Ribosomal and mitochondrial genes were excluded. Data analysis was completed using R v.4.1.2 on the Terra cloud platform (https://app.terra.bio). Data visualization was performed using several R packages, including Seurat83,84 and ggplot2 v.3.3.6.
Statistics
Data that passed the normality test were analyzed using a Student’s t-test for two groups, a one-way ANOVA with Tukey’s post hoc analysis for more than two groups or a two-way ANOVA with Šidák’s post hoc analysis for two factors. Data that were not normally distributed were analyzed using the nonparametric Mann–Whitney U test or, for more than two groups, using a Kruskal–Wallis test with post hoc analysis using the Dunn test. Outliers were removed with the Grubb’s test (Prism). P < 0.05 was considered significant. Statistical analyses were conducted and analyzed with Microsoft Excel (v.16.29) and Prism v.8 (GraphPad Software).
Reporting summary
Further information on research design is available in the Nature Portfolio Reporting Summary linked to this article.
Extended Data
Extended Data Fig. 1 |.

a. Ldlr−/− male mice were transplanted with WT or Tet2KO male mice bone marrow; after 6 weeks reconstitution, WT→Ldlr−/− (n = 9) and Tet2KO→Ldlr−/− (n = 10) mice were fed a western diet for 12 weeks. Bar graph shows total lesion area in the aortic root. Two-tailed unpaired t-test. b-c. WT and Tet2KO macrophage were pretreated with or without IL-1β (100 μg/ml) blocking antibodies for 1 hr, then treated with LPS (20 ng/ml) for 4 hours followed by nigericin (5 μg/ml) for another 30 mins. Secreted IL-1β and IL-6 were determined by ELISA. n = 5 independent experiments. One-way ANOVA followed by Tukey’s multiple-comparison test. d. Bone marrow derived macrophages were pre-incubated with IL-6R blocking antibodies (100 μg/ml) for 1 hour and then challenged with or without IL-6 (25 ng/ml). qPCR was used to measure the mRNA level of Socs3 expression. n = 3 independent experiments. One-way ANOVA followed by Tukey’s multiple-comparison test. e-g. Peripheral blood white blood cells counts, RBC counts and platelet counts after 12 weeks western diet. n = 15 mice per group. One-way ANOVA followed by Tukey’s multiple-comparison test. h-l. Body weight, plasma cholesterol and triglycerides, liver/body weight ratio, spleen/body weight ratio after 12 weeks western diet. m. Immunoblot of isolated splenic monocytes and neutrophil Caspase1, cleaved IL-1β and β-actin after 12 weeks western diet. n = 6 mice per group. One-way ANOVA followed by Tukey’s multiple-comparison test or two-tailed unpaired t-test. n. Immunofluorescence staining of macrophage (anti-Mac2, Green), TREM2 (Red) in aortic roots and quantification of TREM2+Mac2+ cells as the percentage of total Mac2+ cells per lesion area in aortic root cross-sections. Scale Bar, 50μm. n = 15 mice per group. One-way ANOVA followed by Tukey’s multiple-comparison test. o. Immunofluorescence staining of macrophage (anti-Mac2, Green), IL-1β expression (Red) in aortic roots and quantification of IL-1β mean fluorescence intensity per lesion area in aortic root cross-sections. Scale Bar, 50μm. n = 15 mice per group. One-way ANOVA followed by Tukey’s multiple-comparison test. p. Quantification of CSF1R expression in monocytes of Ctrl and Tet2+/− mice. n = 5 mice in ctrl group. n = 6 mice in Tet2 +/− group. Two-tailed unpaired t-test. All the Data are Mean ± SEM.
Extended Data Fig. 2 |.

a. Gating strategy for LSK cells and Hematopoietic progenitor cells (HPC, the first row), LSK (Sca1+c-Kit+) subpopulation (middle row) and HPC (Sca1−c-Kit+) subpopulation (the third row). For the LSK subpopulation, CD150+CD48−, CD150−CD48−, CD150−CD48+ LSK fractions are long term HSC (LT-HSC), short term HSC (ST-HSC) and multipotent progenitors (MPP) respectively. For the HPC subpopulation, the cells are defined as common myeloid progenitors (Lin−Sca1−c-Kit+CD34+CD16/32int; CMP), granulocyte and macrophage progenitors (Lin−Sca1−c-Kit+CD34+CD16/32hi, GMP). b. Hematopoietic stem and progenitor cells in BM. n = 12 mice per group. One-way ANOVA followed by Tukey’s multiple-comparison test. c-h. CSF1R expression on stem and progenitor cells as determined by flow cytometry shown as mean fluorescence intensity and percentage of positive cells. n = 12 mice per group. One-way ANOVA followed by Tukey’s multiple-comparison test. All the Data are Mean ± SEM.
Extended Data Fig. 3 |.

a. Immunoblot and quantification of p-STAT3/STAT3 with or without IL-6 (25 ng/ml). n = 3 independent experiments. Two-tailed unpaired t-test. b. BMDMs were pretreated with trichostatin A (TSA, 100 nM) or DMSO for 1 hour and then incubated with IL-6 (25 ng/ml) for 2 hours. The level of nuclear STAT3 acetylation was determined by western blot. n = 3 independent experiments. One-way ANOVA followed by Tukey’s multiple-comparison test. c. BMDMs were incubated with IL-6 (25 ng/ml) for indicated time. Methylation levels of the STAT3 binding site in the Csf1r promoter region of macrophages were analyzed. n = 3 independent experiments. Two-tailed unpaired t-test. d. Immunoblot and quantification of DNMT1, DNMT3A and DNMT3B expression in BMDMs with or without IL-6 (25 ng/ml) treatment for 4 hours. n = 5 independent experiments. One-way ANOVA followed by Tukey’s multiple-comparison test. e. BMDMs were pretreated with 5-Azacytidine (5-aza, 1 μM) or DMSO for 1 hour and then incubated with or without IL-6 (25 ng/ml) for 8 hours. mRNA level of Csf1r was tested by qPCR. n = 4 independent experiments. One-way ANOVA followed by Tukey’s multiple-comparison test. f. BMDMs were pretreated with 5-aza (1 μM) or DMSO for 1 hour and then incubated with IL-6 (25 ng/ml) for 4 hours. STAT3 binds to the Csf1r promoter area was revealed by ChIP-qPCR assay. Shown is percentage of input. n = 4 independent experiments. One-way ANOVA followed by Tukey’s multiple-comparison test. g. BMDMs were pretreated with TSA (100 nM) or DMSO for 1 hour and then incubated with (25 ng/ml) for 4 hours. Methylation levels of the STAT3 binding site in the Csf1r promoter region of macrophages. n = 5 independent experiments. One-way ANOVA followed by Tukey’s multiple-comparison test. All the Data are Mean ± SEM.
Extended Data Fig. 4 |. Immunoblot of CSF1R and cleaved Caspase 3 in macrophage with or without IL-6 (25 ng/ml) treatment for 48 hours.

Bar graph shows the quantification of immunoblots. n = 5 mice per group. One-way ANOVA followed by Tukey’s multiple-comparison test. All the Data are Mean ± SEM.
Extended Data Fig. 5 |. Ctrl and Tet2CH mice were fed a western diet for 7 weeks followed by another 5 weeks with or without PLX3397 (200 mg/kg) formulated WD feeding.

a. Food intake per day per mouse during 5 weeks PLX3397 WD feeding period. n = 3 independent cages per group. One-way ANOVA followed by Tukey’s multiple-comparison test. b. Plasma cholesterol levels. n = 11 mice in Ctrl+Control group, n = 12 mice in Tet2CH+Control group, n = 13 mice in Ctrl+PLX3397 group, n = 13 mice in Tet2CH + PLX3397 group. One-way ANOVA followed by Tukey’s multiple-comparison test. c-f. Body weight, liver/body weight ratio, spleen/body weight ratio and peripheral blood white blood cells counts, RBC counts and platelet counts after 12 weeks western diet. n = 11 mice in Ctrl+Control group, n = 12 mice in Tet2CH+Control group, n = 13 mice in Ctrl+PLX3397 group, n = 13 mice in Tet2CH + PLX3397 group. One-way ANOVA followed by Tukey’s multiple-comparison test. g. Control and Tet2KO BMDMs were treated with or without oxidized LDL (oxLDL, 50 μg/ml), acetylated LDL (acLDL, 50 μg/ml) or cholesterol crystal (CHO-C,100 μg/ml) overnight and then challenged with LPS (20 ng/ml) for 4 hours with fresh media. Secreted IL-6 level was quantified by ELISA. n = 4 independent experiments. Two-tailed unpaired t-test. All the Data are Mean ± SEM.
Extended Data Fig. 6 |.

a. Flow cytometric analysis of cell surface molecular expression on human embryonic stem cell-derived TET2 deficient macrophages and its isogenic control in day 24. n = 3 independent experiments. Two-tailed unpaired t-test. b. Strategy for gating and confirmation of induced pluripotent stem cell (iPSC) with TET2 haploinsufficiency (TET+/−) and isogenic control for the progenitors (CD34+) and lineage-committed (CD34 + CD45+) cells differentiation on Day1. c. Control and TET2+/− iPSCs were treated with or without hIL-6 (25 ng/ml) for 48 hours. CSF1R expression was analyzed by flow cytometry. n = 3 independent experiments. One-way ANOVA followed by Tukey’s multiple-comparison test. d. Flow cytometric analysis of cell surface molecular expression on iPSC derived TET+/− and isogenic control macrophage after 24 days of differentiation. n = 3 independent experiments. Two-tailed unpaired t-test. e. Control and TET2+/− iPSC-derived macrophages were treated with or without hIL-6 (25 ng/ml) for 48 hours. CSF1R expression was quantified by flow cytometry. n = 3 independent experiments. One-way ANOVA followed by Tukey’s multiple-comparison test. f. Immunoblot and quantification of CSF1R and cleaved Caspase 3 in control and TET2+/− iPSC-derived macrophages with or without hIL-6 (25 ng/ml) treatment for 48 hours. n = 3 independent experiments. One-way ANOVA followed by Tukey’s multiple-comparison test. g. TET2+/− and its isogenc control iPSCs were treated with or without oxidized LDL (oxLDL, 50 μg/ml), acetylated LDL (acLDL, 50 μg/ml) or cholesterol crystal (CHO-C,100 μg/ml) overnight and then challenged with LPS (20 ng/ml) for 4 hours with fresh media. Secreted IL-6 level was quantified by ELISA. n = 4 independent experiments. Two-tailed unpaired t-test. All the Data are Mean ± SEM.
Extended Data Fig. 7 |. A schematic summary of the main findings.
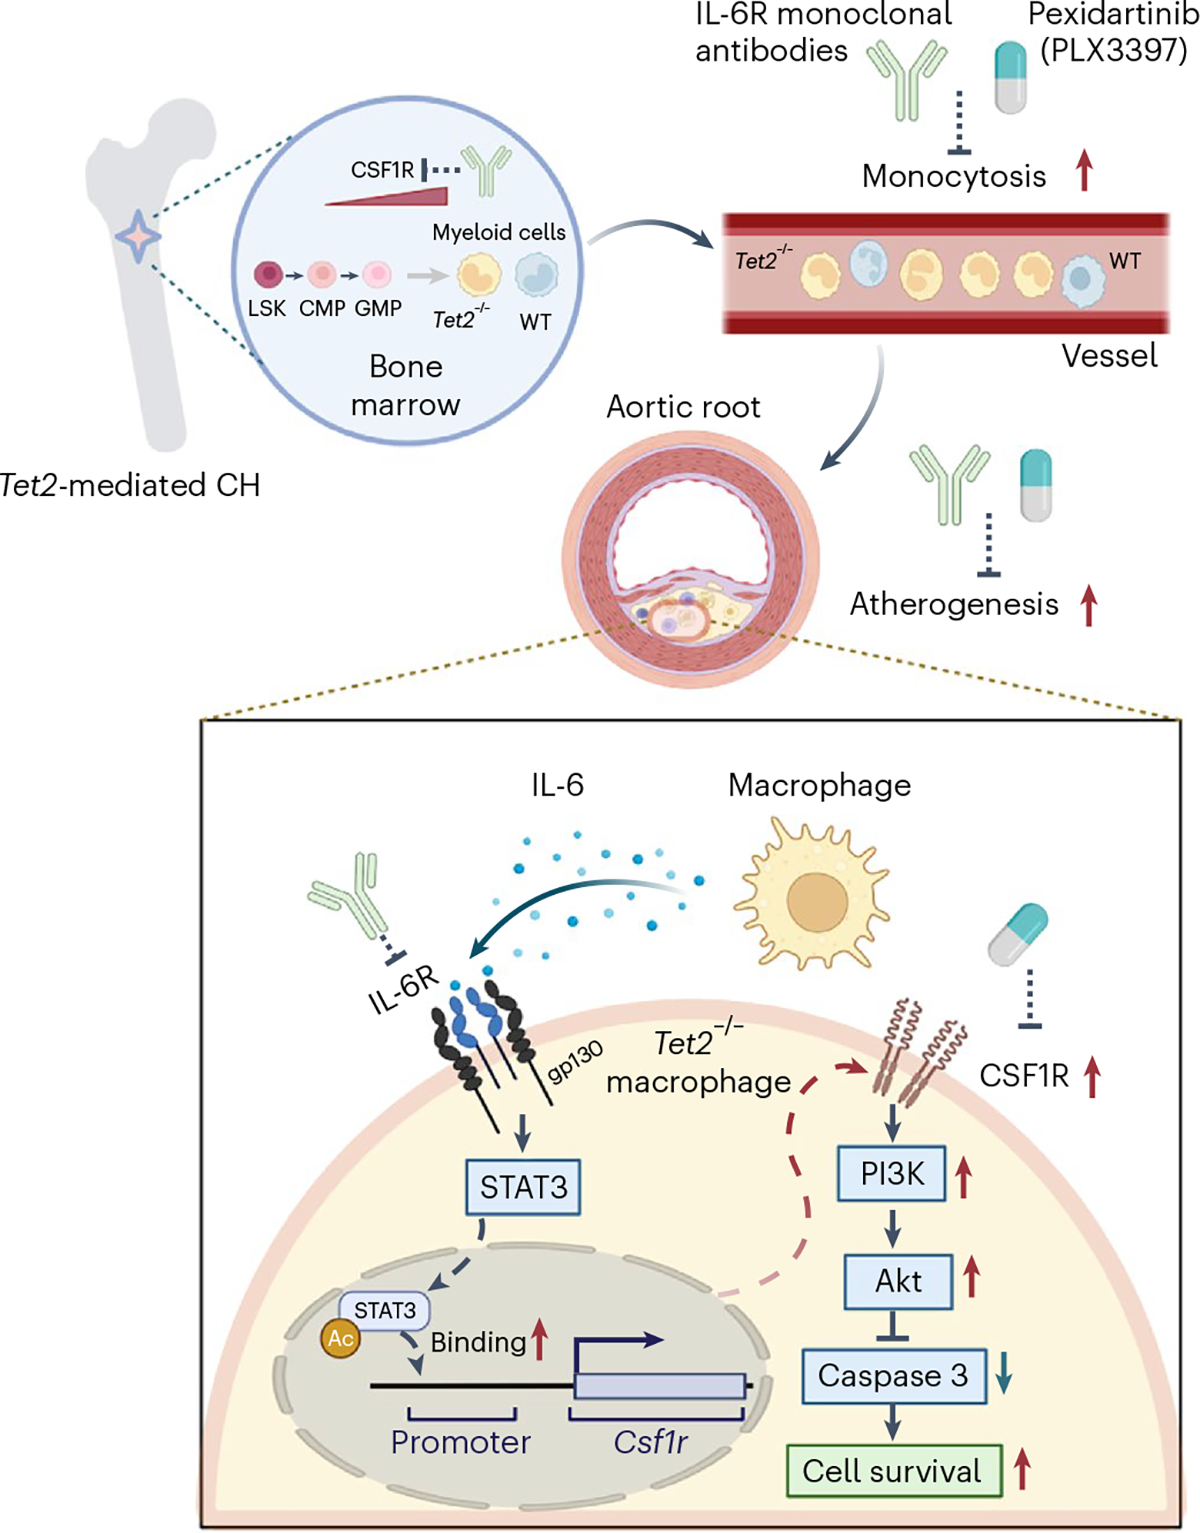
The schema illustrating proposed mechanisms underlying the benefit of IL-6R or CSF1R inhibition in Tet2 CH-accelerated atherosclerosis.
Supplementary Material
Acknowledgements
This work was supported by grants from the National Institutes of Health (nos. HL-118567 and HL-148071 to N.W.; no. HL155431 to A.R.T.) and the Leducq Foundation (no. TNE-18CVD04 to A.R.T.). P.L. receives funding support from the National Heart, Lung, and Blood Institute (nos. 1R01HL134892 and 1R01HL163099-01), the RRM Charitable Fund and the Simard Fund.
Footnotes
Competing interests
A.R.T. is a consultant for Amgen, CSL Behring, AstraZeneca and Foresite Laboratories, and is on the scientific advisory board of Staten Biotechnology, Fortico Biotech and Beren Therapeutics. P.L. is an unpaid consultant to, or involved in clinical trials for Amgen, AstraZeneca, Baim Institute, Beren Therapeutics, Esperion Therapeutics, Genentech, Kancera, Kowa Pharmaceuticals, MedImmune, Merck, Moderna, Novo Nordisk, Novartis, Pfizer and Sanofi Regeneron. P.L. is a member of the scientific advisory board for Amgen, Caristo Diagnostics, Cartesian Therapeutics, CSL Behring, DalCor Pharmaceuticals, Dewpoint Therapeutics, Elucid Bioimaging, Kancera, Kowa Pharmaceuticals, Olatec Therapeutics, MedImmune, Novartis, PlaqueTec, TenSixteen Bio, Soley Thereapeutics and XBiotech. His laboratory has received research funding in the last 2 years from Novartis, Novo Nordisk and Genentech. P.L. is on the board of directors of XBiotech. He has a financial interest in XBiotech, a company developing therapeutic human antibodies, in TenSixteen Bio, a company targeting somatic mosaicism and CHIP to discover and develop new therapeutics to treat age-related diseases, and in Soley Therapeutics, a biotechnology company that is combining artificial intelligence with molecular and cellular response detection to discover and develop new drugs, currently focusing on cancer therapeutics. His interests were reviewed and are managed by Brigham and Women’s Hospital and Mass General Brigham in accordance with their conflict-of-interest policies. The other authors declare no competing interests.
Additional information
Supplementary information The online version contains supplementary material available at https://doi.org/10.1038/s44161-023-00281-3.
Springer Nature or its licensor (e.g. a society or other partner) holds exclusive rights to this article under a publishing agreement with the author(s) or other rightsholder(s); author self-archiving of the accepted manuscript version of this article is solely governed by the terms of such publishing agreement and applicable law.
Data availability
The data supporting the findings of this study are available within the paper and its supplementary information. Data regarding the single cell RNA sequence of CSF1R expression can be accessed at https://zenodo.org/record/7876218#.ZEvhOHbMIVA. Source data are provided with this paper.
References
- 1.Genovese G et al. Clonal hematopoiesis and blood-cancer risk inferred from blood DNA sequence. N. Engl. J. Med. 371, 2477–2487 (2014). [DOI] [PMC free article] [PubMed] [Google Scholar]
- 2.Busque L et al. Recurrent somatic TET2 mutations in normal elderly individuals with clonal hematopoiesis. Nat. Genet. 44, 1179–1181 (2012). [DOI] [PMC free article] [PubMed] [Google Scholar]
- 3.Steensma DP et al. Clonal hematopoiesis of indeterminate potential and its distinction from myelodysplastic syndromes. Blood 126, 9–16 (2015). [DOI] [PMC free article] [PubMed] [Google Scholar]
- 4.Jaiswal S et al. Clonal hematopoiesis and risk of atherosclerotic cardiovascular disease. N. Engl. J. Med. 377, 111–121 (2017). [DOI] [PMC free article] [PubMed] [Google Scholar]
- 5.Tall AR & Fuster JJ Clonal hematopoiesis in cardiovascular disease and therapeutic implications. Nat. Cardiovasc. Res. 1, 116–124 (2022). [DOI] [PMC free article] [PubMed] [Google Scholar]
- 6.Bhattacharya R et al. Clonal hematopoiesis is associated with higher risk of stroke. Stroke 53, 788–797 (2022). [DOI] [PMC free article] [PubMed] [Google Scholar]
- 7.Dorsheimer L et al. Association of mutations contributing to clonal hematopoiesis with prognosis in chronic ischemic heart failure. JAMA Cardiol. 4, 25–33 (2019). [DOI] [PMC free article] [PubMed] [Google Scholar]
- 8.Pascual-Figal DA et al. Clonal hematopoiesis and risk of progression of heart failure with reduced left ventricular ejection fraction. J. Am. Coll. Cardiol. 77, 1747–1759 (2021). [DOI] [PubMed] [Google Scholar]
- 9.Yu B et al. Supplemental association of clonal hematopoiesis with incident heart failure. J. Am. Coll. Cardiol. 78, 42–52 (2021). [DOI] [PMC free article] [PubMed] [Google Scholar]
- 10.Jaiswal S et al. Age-related clonal hematopoiesis associated with adverse outcomes. N. Engl. J. Med. 371, 2488–2498 (2014). [DOI] [PMC free article] [PubMed] [Google Scholar]
- 11.Ridker PM et al. Antiinflammatory therapy with canakinumab for atherosclerotic disease. N. Engl. J. Med. 377, 1119–1131 (2017). [DOI] [PubMed] [Google Scholar]
- 12.Tardif J-C et al. Efficacy and safety of low-dose colchicine after myocardial infarction. N. Engl. J. Med. 381, 2497–2505 (2019). [DOI] [PubMed] [Google Scholar]
- 13.Nidorf SM et al. Colchicine in patients with chronic coronary disease. N. Engl. J. Med. 383, 1838–1847 (2020). [DOI] [PubMed] [Google Scholar]
- 14.Fuster JJ et al. Clonal hematopoiesis associated with TET2 deficiency accelerates atherosclerosis development in mice. Science 355, 842–847 (2017). [DOI] [PMC free article] [PubMed] [Google Scholar]
- 15.Fidler TP et al. The AIM2 inflammasome exacerbates atherosclerosis in clonal haematopoiesis. Nature 592, 296–301 (2021). [DOI] [PMC free article] [PubMed] [Google Scholar]
- 16.Ridker PM & Rane M Interleukin-6 signaling and anti-interleukin-6 therapeutics in cardiovascular disease. Circ. Res. 128, 1728–1746 (2021). [DOI] [PubMed] [Google Scholar]
- 17.Heink S et al. Trans-presentation of IL-6 by dendritic cells is required for the priming of pathogenic TH17 cells. Nat. Immunol. 18, 74–85 (2017). [DOI] [PMC free article] [PubMed] [Google Scholar]
- 18.Tipping C C-reactive protein concentration and risk of coronary heart disease, stroke, and mortality: an individual participant meta-analysis. Lancet 375, 132–140 (2010). [DOI] [PMC free article] [PubMed] [Google Scholar]
- 19.Ridker PM, Hennekens CH, Buring JE & Rifai N C-reactive protein and other markers of inflammation in the prediction of cardiovascular disease in women. N. Engl. J. Med. 342, 836–843 (2000). [DOI] [PubMed] [Google Scholar]
- 20.Ridker PM, Rifai N, Stampfer MJ & Hennekens CH Plasma concentration of interleukin-6 and the risk of future myocardial infarction among apparently healthy men. Circulation 101, 1767–1772 (2000). [DOI] [PubMed] [Google Scholar]
- 21.Volpato S et al. Cardiovascular disease, interleukin-6, and risk of mortality in older women: the women’s health and aging study. Circulation 103, 947–953 (2001). [DOI] [PubMed] [Google Scholar]
- 22.Bick AG et al. Genetic interleukin 6 signaling deficiency attenuates cardiovascular risk in clonal hematopoiesis. Circulation 141, 124–131 (2020). [DOI] [PMC free article] [PubMed] [Google Scholar]
- 23.Bick AG et al. Inherited causes of clonal haematopoiesis in 97,691 whole genomes. Nature 586, 763–768 (2020). [DOI] [PMC free article] [PubMed] [Google Scholar]
- 24.Tosato G & Jones KD Interleukin-1 induces interleukin-6 production in peripheral blood monocytes. Blood 75, 1305–1310 (1990). [PubMed] [Google Scholar]
- 25.Ridker PM et al. Modulation of the interleukin-6 signalling pathway and incidence rates of atherosclerotic events and all-cause mortality: analyses from the Canakinumab Anti-Inflammatory Thrombosis Outcomes Study (CANTOS). Eur. Heart J. 39, 3499–3507 (2018). [DOI] [PubMed] [Google Scholar]
- 26.Swerdlow DI et al. The interleukin-6 receptor as a target for prevention of coronary heart disease: a Mendelian randomisation analysis. Lancet 379, 1214–1224 (2012). [DOI] [PMC free article] [PubMed] [Google Scholar]
- 27.Scheller J & Rose-John S The interleukin 6 pathway and atherosclerosis. Lancet 380, 338 (2012). [DOI] [PubMed] [Google Scholar]
- 28.Nachun D et al. Clonal hematopoiesis associated with epigenetic aging and clinical outcomes. Aging Cell 20, e13366 (2021). [DOI] [PMC free article] [PubMed] [Google Scholar]
- 29.Kessler MD et al. Common and rare variant associations with clonal haematopoiesis phenotypes. Nature 612, 301–309 (2022). [DOI] [PMC free article] [PubMed] [Google Scholar]
- 30.Vlasschaert C, Heimlich JB, Rauh MJ, Natarajan P & Bick AG Interleukin-6 receptor polymorphism attenuates clonal hematopoiesis-mediated coronary artery disease risk among 451 180 individuals in the UK Biobank. Circulation 147, 358–360 (2023). [DOI] [PMC free article] [PubMed] [Google Scholar]
- 31.Huber SA, Sakkinen P, Conze D, Hardin N & Tracy R Interleukin-6 exacerbates early atherosclerosis in mice. Arterioscler. Thromb. Vasc. Biol. 19, 2364–2367 (1999). [DOI] [PubMed] [Google Scholar]
- 32.Schieffer B et al. Impact of interleukin-6 on plaque development and morphology in experimental atherosclerosis. Circulation 110, 3493–3500 (2004). [DOI] [PubMed] [Google Scholar]
- 33.Song L & Schindler C IL-6 and the acute phase response in murine atherosclerosis. Atherosclerosis 177, 43–51 (2004). [DOI] [PubMed] [Google Scholar]
- 34.Zhang Q et al. Tet2 is required to resolve inflammation by recruiting Hdac2 to specifically repress IL-6. Nature 525, 389–393 (2015). [DOI] [PMC free article] [PubMed] [Google Scholar]
- 35.Piconese S et al. Mast cells counteract regulatory T-cell suppression through interleukin-6 and OX40/OX40L axis toward Th17-cell differentiation. Blood 114, 2639–2648 (2009). [DOI] [PubMed] [Google Scholar]
- 36.Tsukamoto H, Senju S, Matsumura K, Swain SL & Nishimura Y IL-6-mediated environmental conditioning of defective Th1 differentiation dampens antitumour immune responses in old age. Nat. Commun. 6, 6702 (2015). [DOI] [PMC free article] [PubMed] [Google Scholar]
- 37.Busque L et al. High-sensitivity C-reactive protein is associated with clonal hematopoiesis of indeterminate potential. Blood Adv. 4, 2430–2438 (2020). [DOI] [PMC free article] [PubMed] [Google Scholar]
- 38.Welsh C et al. Association of total and differential leukocyte counts with cardiovascular disease and mortality in the UK Biobank. Arterioscler. Thromb. Vasc. Biol. 38, 1415–1423 (2018). [DOI] [PubMed] [Google Scholar]
- 39.Murphy AJ et al. ApoE regulates hematopoietic stem cell proliferation, monocytosis, and monocyte accumulation in atherosclerotic lesions in mice. J. Clin. Invest. 121, 4138–4149 (2011). [DOI] [PMC free article] [PubMed] [Google Scholar]
- 40.Randolph GJ The fate of monocytes in atherosclerosis. J. Thromb. Haemost. 7, 28–30 (2009). [DOI] [PMC free article] [PubMed] [Google Scholar]
- 41.Swirski FK et al. Ly-6Chi monocytes dominate hypercholesterolemia-associated monocytosis and give rise to macrophages in atheromata. J. Clin. Invest. 117, 195–205 (2007). [DOI] [PMC free article] [PubMed] [Google Scholar]
- 42.Libby P Collagenases and cracks in the plaque. J. Clin. Invest. 123, 3201–3203 (2013). [DOI] [PMC free article] [PubMed] [Google Scholar]
- 43.Cochain C et al. Single-cell RNA-seq reveals the transcriptional landscape and heterogeneity of aortic macrophages in murine atherosclerosis. Circ. Res. 122, 1661–1674 (2018). [DOI] [PubMed] [Google Scholar]
- 44.Clinton SK et al. Macrophage colony-stimulating factor gene expression in vascular cells and in experimental and human atherosclerosis. Am. J. Pathol. 140, 301–316 (1992). [PMC free article] [PubMed] [Google Scholar]
- 45.Rosenfeld ME et al. Macrophage colony-stimulating factor mRNA and protein in atherosclerotic lesions of rabbits and humans. Am. J. Pathol. 140, 291–300 (1992). [PMC free article] [PubMed] [Google Scholar]
- 46.Sinha SK et al. Local M-CSF (macrophage colony-stimulating factor) expression regulates macrophage proliferation and apoptosis in atherosclerosis. Arterioscler. Thromb. Vasc. Biol. 41, 220–233 (2021). [DOI] [PMC free article] [PubMed] [Google Scholar]
- 47.Rajavashisth T et al. Heterozygous osteopetrotic (op) mutation reduces atherosclerosis in LDL receptor-deficient mice. J. Clin. Invest. 101, 2702–2710 (1998). [DOI] [PMC free article] [PubMed] [Google Scholar]
- 48.Dutta P et al. Macrophages retain hematopoietic stem cells in the spleen via VCAM-1. J. Exp. Med. 212, 497–512 (2015). [DOI] [PMC free article] [PubMed] [Google Scholar]
- 49.Qiao JH et al. Role of macrophage colony-stimulating factor in atherosclerosis: studies of osteopetrotic mice. Am. J. Pathol. 150, 1687–1699 (1997). [PMC free article] [PubMed] [Google Scholar]
- 50.Robbins CS et al. Local proliferation dominates lesional macrophage accumulation in atherosclerosis. Nat. Med. 19, 1166–1172 (2013). [DOI] [PMC free article] [PubMed] [Google Scholar]
- 51.Hume DA & MacDonald KPA Therapeutic applications of macrophage colony-stimulating factor-1 (CSF-1) and antagonists of CSF-1 receptor (CSF-1R) signaling. Blood 119, 1810–1820 (2012). [DOI] [PubMed] [Google Scholar]
- 52.Cai Z et al. Inhibition of inflammatory signaling in Tet2 mutant preleukemic cells mitigates stress-induced abnormalities and clonal hematopoiesis. Cell Stem Cell 23, 833–849 (2018). [DOI] [PMC free article] [PubMed] [Google Scholar]
- 53.Cai Z et al. Hyperglycemia cooperates with Tet2 heterozygosity to induce leukemia driven by proinflammatory cytokine-induced lncRNA Morrbid. J. Clin. Invest. 131, e140707 (2021). [DOI] [PMC free article] [PubMed] [Google Scholar]
- 54.Zhong Z, Wen Z & Darnell JE Jr. Stat3: a STAT family member activated by tyrosine phosphorylation in response to epidermal growth factor and interleukin-6. Science 264, 95–98 (1994). [DOI] [PubMed] [Google Scholar]
- 55.Zhuang S Regulation of STAT signaling by acetylation. Cell. Signal. 25, 1924–1931 (2013). [DOI] [PMC free article] [PubMed] [Google Scholar]
- 56.Yuan Z-L, Guan Y-J, Chatterjee D & Chin YE Stat3 dimerization regulated by reversible acetylation of a single lysine residue. Science 307, 269–273 (2005). [DOI] [PubMed] [Google Scholar]
- 57.Wang R, Cherukuri P & Luo J Activation of Stat3 sequence-specific DNA binding and transcription by p300/CREB-binding protein-mediated acetylation. J. Biol. Chem. 280, 11528–11534 (2005). [DOI] [PubMed] [Google Scholar]
- 58.Ray S, Lee C, Hou T, Boldogh I & Brasier AR Requirement of histone deacetylase1 (HDAC1) in signal transducer and activator of transcription 3 (STAT3) nucleocytoplasmic distribution. Nucleic Acids Res. 36, 4510–4520 (2008). [DOI] [PMC free article] [PubMed] [Google Scholar]
- 59.Shi Y et al. Epigenetic regulation in cardiovascular disease: mechanisms and advances in clinical trials. Signal Transduct. Target. Ther. 7, 200 (2022). [DOI] [PMC free article] [PubMed] [Google Scholar]
- 60.Hegde M, Guruprasad KP, Ramachandra L, Satyamoorthy K & Joshi MB Interleukin-6-mediated epigenetic control of the VEGFR2 gene induces disorganized angiogenesis in human breast tumors. J. Biol. Chem. 295, 12086–12098 (2020). [DOI] [PMC free article] [PubMed] [Google Scholar]
- 61.Wei J, Sun Z, Chen Q & Gu J Serum deprivation induced apoptosis in macrophage is mediated by autocrine secretion of type I IFNs. Apoptosis 11, 545–554 (2006). [DOI] [PubMed] [Google Scholar]
- 62.Lee AW-M & States DJ Colony-stimulating factor-1 requires PI3-kinase-mediated metabolism for proliferation and survival in myeloid cells. Cell Death Differ. 13, 1900–1914 (2006). [DOI] [PubMed] [Google Scholar]
- 63.Linton MF, Moslehi JJ & Babaev VR Akt signaling in macrophage polarization, survival, and atherosclerosis. Int. J. Mol. Sci. 20, 2703 (2019). [DOI] [PMC free article] [PubMed] [Google Scholar]
- 64.Tap WD et al. Pexidartinib versus placebo for advanced tenosynovial giant cell tumour (ENLIVEN): a randomised phase 3 trial. Lancet 394, 478–487 (2019). [DOI] [PMC free article] [PubMed] [Google Scholar]
- 65.Di Gregoli K & Johnson JL Role of colony-stimulating factors in atherosclerosis. Curr. Opin. Lipidol. 23, 412–421 (2012). [DOI] [PubMed] [Google Scholar]
- 66.Singhal A & Subramanian M Colony stimulating factors (CSFs): complex roles in atherosclerosis. Cytokine 122, 154190 (2019). [DOI] [PubMed] [Google Scholar]
- 67.Verma N et al. TET proteins safeguard bivalent promoters from de novo methylation in human embryonic stem cells. Nat. Genet. 50, 83–95 (2018). [DOI] [PMC free article] [PubMed] [Google Scholar]
- 68.Kotini AG et al. Functional analysis of a chromosomal deletion associated with myelodysplastic syndromes using isogenic human induced pluripotent stem cells. Nat. Biotechnol. 33, 646–655 (2015). [DOI] [PMC free article] [PubMed] [Google Scholar]
- 69.Ancuta P et al. Transcriptional profiling reveals developmental relationship and distinct biological functions of CD16+ and CD16− monocyte subsets. BMC Genomics 10, 403 (2009). [DOI] [PMC free article] [PubMed] [Google Scholar]
- 70.Rohde D et al. Bone marrow endothelial dysfunction promotes myeloid cell expansion in cardiovascular disease. Nat. Cardiovasc. Res. 1, 28–44 (2022). [DOI] [PMC free article] [PubMed] [Google Scholar]
- 71.Randolph GJ Mechanisms that regulate macrophage burden in atherosclerosis. Circ. Res. 114, 1757–1771 (2014). [DOI] [PMC free article] [PubMed] [Google Scholar]
- 72.Li Z-Y, Howarth SPS, Tang T & Gillard JH How critical is fibrous cap thickness to carotid plaque stability? A flow–plaque interaction model. Stroke 37, 1195–1199 (2006). [DOI] [PubMed] [Google Scholar]
- 73.Schuett H et al. Transsignaling of interleukin-6 crucially contributes to atherosclerosis in mice. Arterioscler. Thromb. Vasc. Biol. 32, 281–290 (2012). [DOI] [PubMed] [Google Scholar]
- 74.Akita K et al. An interleukin-6 receptor antibody suppresses atherosclerosis in atherogenic mice. Front. Cardiovasc. Med. 4, 84 (2017). [DOI] [PMC free article] [PubMed] [Google Scholar]
- 75.Kim PG et al. Dnmt3a-mutated clonal hematopoiesis promotes osteoporosis. J. Exp. Med. 218, e20211872 (2021). [DOI] [PMC free article] [PubMed] [Google Scholar]
- 76.Agrawal M et al. TET2-mutant clonal hematopoiesis and risk of gout. Blood 140, 1094–1103 (2022). [DOI] [PMC free article] [PubMed] [Google Scholar]
- 77.Giles JT et al. Cardiovascular safety of tocilizumab versus etanercept in rheumatoid arthritis: a randomized controlled trial. Arthritis Rheumatol. 72, 31–40 (2020). [DOI] [PubMed] [Google Scholar]
- 78.Gierens H et al. Interleukin-6 stimulates LDL receptor gene expression via activation of sterol-responsive and Sp1 binding elements. Arterioscler. Thromb. Vasc. Biol. 20, 1777–1783 (2000). [DOI] [PubMed] [Google Scholar]
- 79.Dawoud AAZ, Gilbert RD, Tapper WJ & Cross NCP Clonal myelopoiesis promotes adverse outcomes in chronic kidney disease. Leukemia 36, 507–515 (2022). [DOI] [PMC free article] [PubMed] [Google Scholar]
- 80.Kotini AG et al. Stage-specific human induced pluripotent stem cells map the progression of myeloid transformation to transplantable leukemia. Cell Stem Cell 20, 315–328 (2017). [DOI] [PMC free article] [PubMed] [Google Scholar]
- 81.Wang W et al. Macrophage inflammation, erythrophagocytosis, and accelerated atherosclerosis in Jak2V617F mice. Circ. Res. 123, e35–e47 (2018). [DOI] [PMC free article] [PubMed] [Google Scholar]
- 82.Heimlich JB et al. Mutated cells mediate distinct inflammatory responses in clonal hematopoiesis. Preprint at bioRxiv 10.1101/2022.12.01.518580 (2022). [DOI] [Google Scholar]
- 83.Stuart T et al. Comprehensive integration of single-cell data. Cell 177, 1888–1902 (2019). [DOI] [PMC free article] [PubMed] [Google Scholar]
- 84.Hao Y et al. Integrated analysis of multimodal single-cell data. Cell 184, 3573–3587 (2021). [DOI] [PMC free article] [PubMed] [Google Scholar]
- 85.McGinnis CS, Murrow LM & Gartner ZJ DoubletFinder: doublet detection in single-cell RNA sequencing data using artificial nearest neighbors. Cell Syst. 8, 329–337 (2019). [DOI] [PMC free article] [PubMed] [Google Scholar]
Associated Data
This section collects any data citations, data availability statements, or supplementary materials included in this article.
Supplementary Materials
Data Availability Statement
The data supporting the findings of this study are available within the paper and its supplementary information. Data regarding the single cell RNA sequence of CSF1R expression can be accessed at https://zenodo.org/record/7876218#.ZEvhOHbMIVA. Source data are provided with this paper.