

SUMMARY
Understanding tumor microenvironment (TME) reprogramming in gastric adenocarcinoma (GAC) progression may uncover novel therapeutic targets. Here, we performed single-cell profiling of precancerous lesions, localized and metastatic GACs, identifying alterations in TME cell states and compositions as GAC progresses. Abundant IgA+ plasma cells exist in the premalignant microenvironment, whereas immunosuppressive myeloid and stromal subsets dominate late-stage GACs. We identified six TME ecotypes (EC1–6). EC1 is exclusive to blood, while EC4, EC5, and EC2 are highly enriched in uninvolved tissues, premalignant lesions, and metastases, respectively. EC3 and EC6, two distinct ecotypes in primary GACs, associate with histopathological and genomic characteristics, and prognosis. Extensive stromal remodeling occurs in GAC progression. High SDC2 expression in cancer-associated fibroblasts (CAFs) is linked to aggressive phenotypes and poor survival, and SDC2 overexpression in CAFs contributes to tumor growth. Our study provides a high-resolution GAC TME atlas and underscores potential targets for further investigation.
Graphical Abstract

eTOC Blurb
Wang et al. conduct a comprehensive characterization of the tumor microenvironment (TME) across gastric adenocarcinoma (GAC) progression stages, which uncovers TME ecotypes linked with GAC phenotypic progression and outcomes. The study also highlights the role of SDC2-overexpressing CAFs in disease progression, suggesting them as potential therapeutic targets for future investigations.
INTRODUCTION
Gastric adenocarcinoma (GAC) remains one of the most lethal cancers worldwide due to rapid progression, treatment resistance, and a high metastasis rate1. There is a need for strategies to treat GAC in its early or premalignant stages, but our understanding of the cellular and molecular mechanisms from early tumorigenesis to metastases is lacking. The evolution from precancerous conditions like chronic atrophic gastritis (CAG) and intestinal metaplasia (IM) to primary GAC and then metastases is not well understood. Peritoneal carcinomatosis (PC), a common form of metastases, occurs in ~45% of patients and accounts for 60% of all recurrences2–6. Patients with PC experience progressive symptoms and a rapid clinical decline, with most succumbing within 6 months7. HER2-directed therapy can produce modest improvements in a limited population8,9 and immune checkpoint blockade, combined with chemotherapy, has benefited a subset of patients with advanced or metastatic GAC10. Therapy development may greatly benefit from a detailed exploration of the constantly evolving tumor microenvironment (TME), which might unveil various immune suppression mechanisms and potential therapeutic targets. It is thus critical to understand the complexities of the TME11–14, and such a research trajectory would be a departure from the traditional approaches where enormous efforts have mainly focused on GAC tumor cells15–20. However, to date, only a handful of studies, including ours, have explored the immune and stromal subtypes of GAC. While these studies provided valuable insights, they either relied on bulk expression level20–23 or were constrained by their scope, cohort size, or depth of analysis24–27. A recent single-cell study characterized GAC TME in 31 patients28, but primarily focused on primary GACs, with only 3 metastatic patients included. The evolution of various immune and stromal cell subsets during GAC progression remains poorly understood.
In this study, we obtained single-cell RNA sequencing (scRNA-seq) data from precancerous lesions, primary, and metastatic tissues, along with uninvolved normal and peripheral blood samples. We characterized diverse immune and stromal cell populations in the TME across GAC stages, including their transcriptional states, cellular compositions, developmental trajectories, cell interactions, as well as cellular ecotypes. This study provides a detailed view of immune and stromal cell evolution within GAC progression and reveals potential targets for further investigation, while also providing valuable resources for future research.
RESULTS
Single-Cell TME Landscapes in Different Stages of GACs
We obtained scRNA-seq data on immune and stromal cells from 68 samples collected from 43 subjects. These included tissues and cells from patients at various stages of GAC development, such as precancerous conditions (CAG and IM), localized GACs, and metastases in the peritoneal cavity, ovary, and liver (Figure 1A; Table S1). We collected matched, non-neoplastic tumor-adjacent tissue (NAT), normal gastric tissue (NGT), and peripheral blood monocyte cells (PBMCs) from a subset of patients. We also included PBMCs collected from two healthy donors. After rigorous quality filtering, we retained a total of 77,392 high-quality cells for subsequent analyses. We assessed and corrected batch effects (Methods), and performed unsupervised clustering analyses, which revealed 10 distinct lineages split into 3 major cell compartments including lymphoid (77%, e.g., T, B, NK, and plasma cells), myeloid (13%, e.g., pDCs, mast cells, other myeloid cells), and stromal cells (10%, e.g., fibroblasts, endothelial and mesothelial cells) (Figure 1B).
Figure 1. Single-Cell Landscape of Immune and Stromal Cells at Different Stages of GACs.
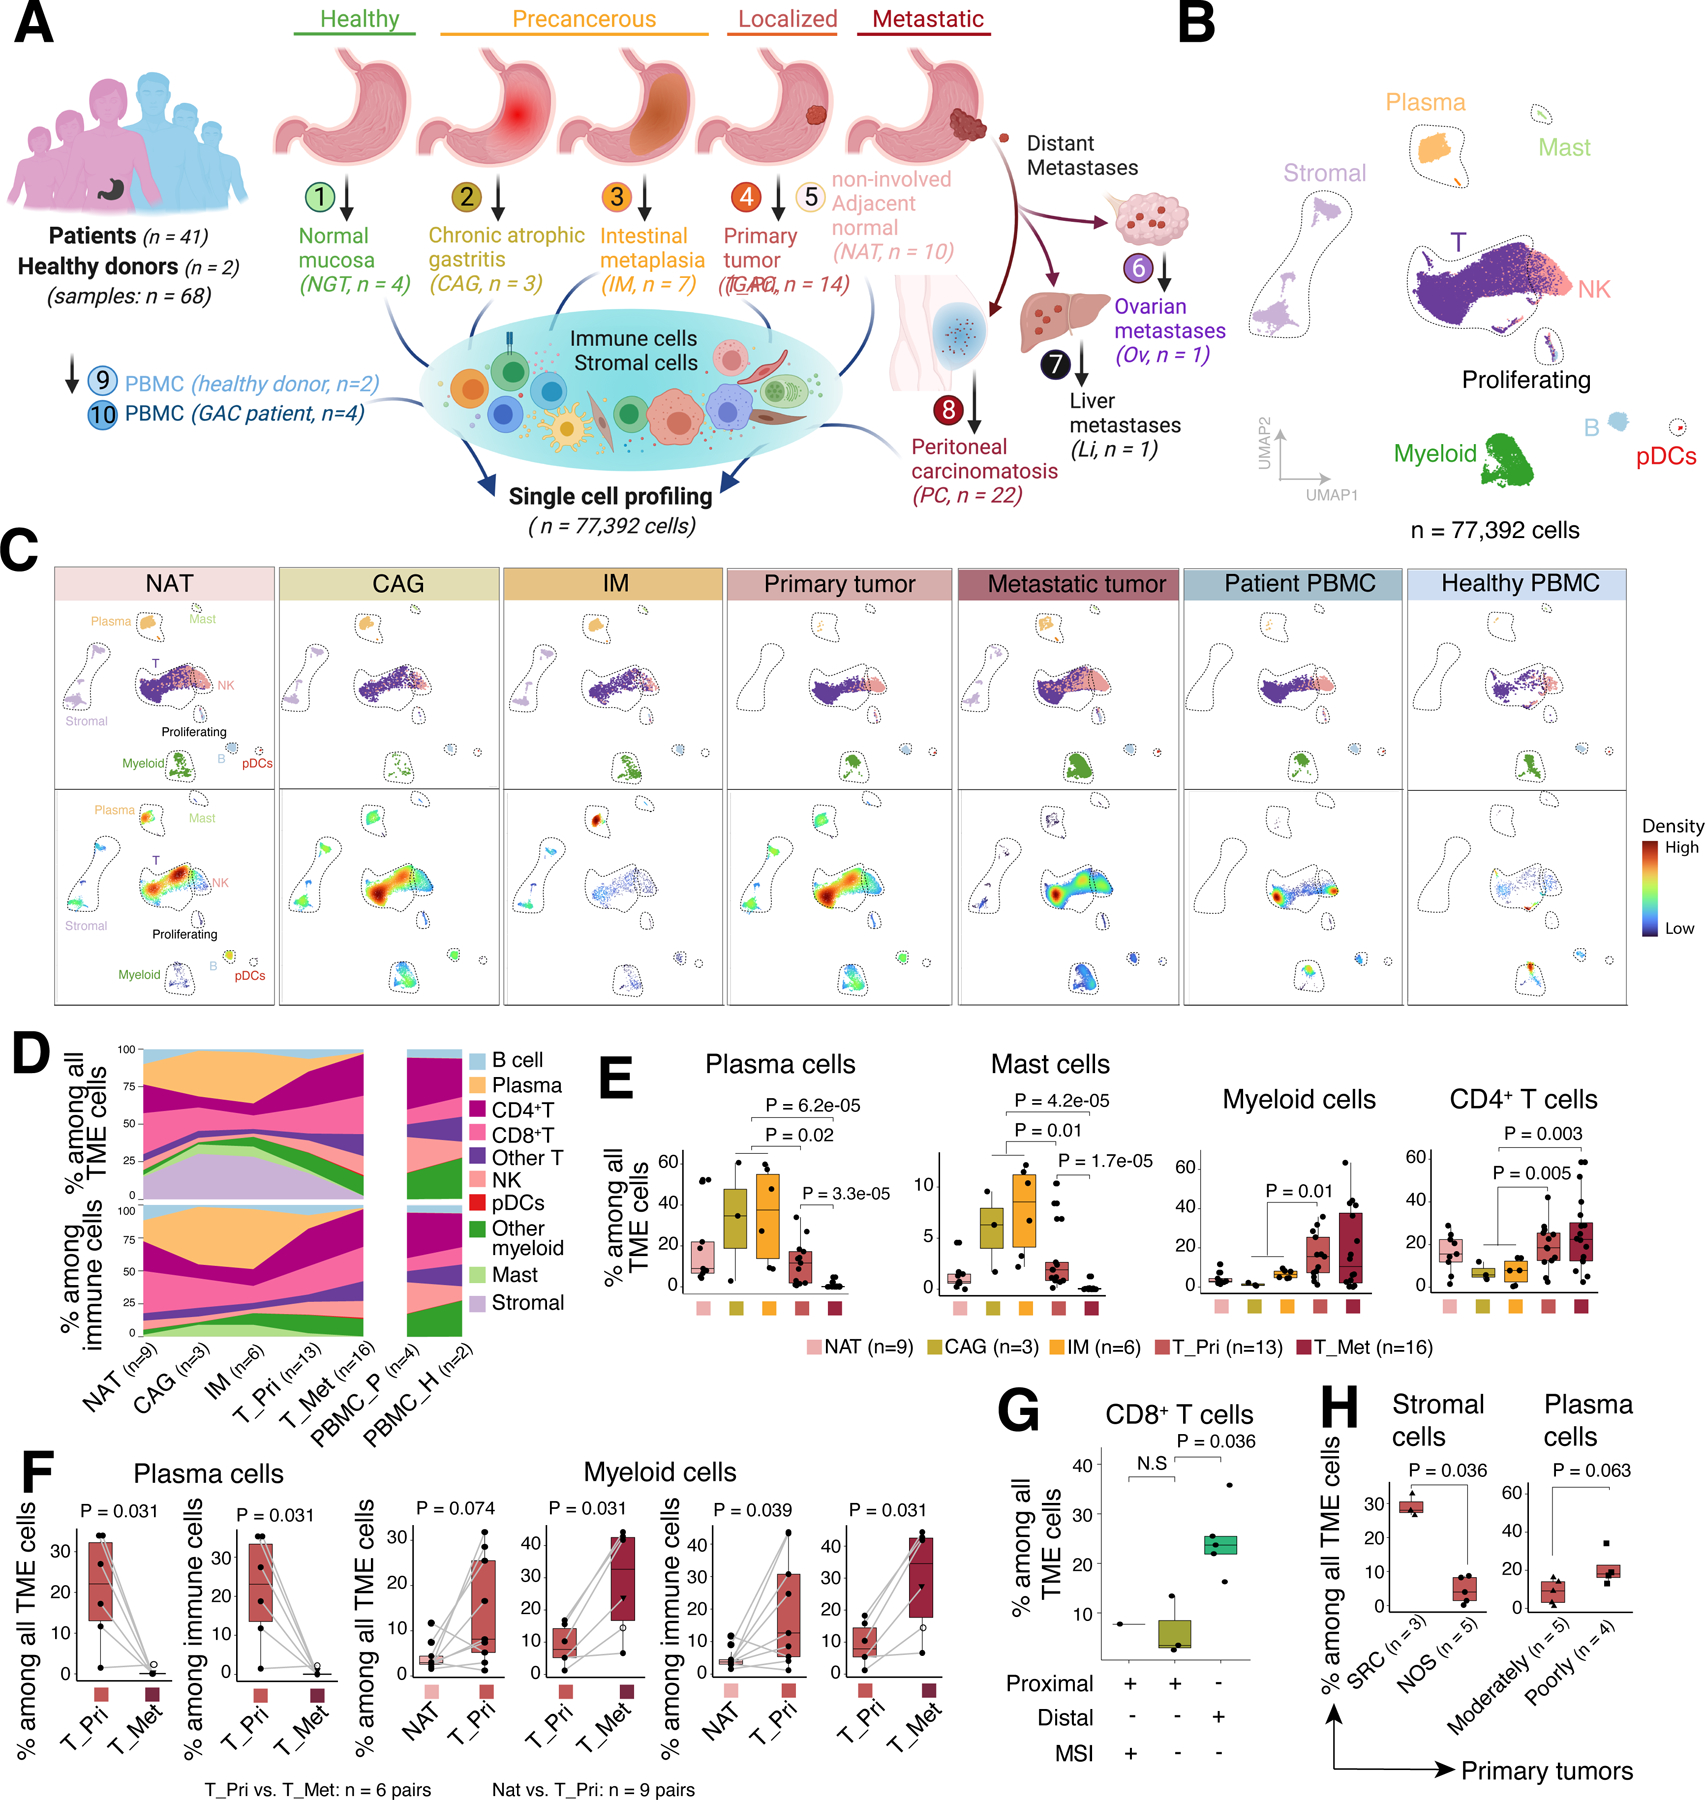
(A) Schematic depicting the study design, created with BioRender.com.
(B) UMAP view of major cell lineages.
(C) UMAP plots, as in (B), showing TME cell clusters (upper panels) and cell density (lower panels) across tissue groups.
(D) Compositions of total TME cells (upper panels) and immune cells (lower panels) across tissue groups. Only samples with ≥ 200 TME cells and groups with ≥ 2 samples were included. T_Pri, primary GAC; T_Met, metastatic GAC; PBMC_P, PBMCs from patients; PBMC_H, PBMCs from healthy donors.
(E) The proportions of four representative cell types across tissue groups. Only samples with ≥ 200 TME cells were included.
(F) Paired comparisons of cell proportions of plasma cells and myeloid cells among paired samples from the same patients (linked by grey lines). Triangle denotes ovarian metastasis and open circle denotes liver metastasis. P values were calculated by paired two-sided Wilcoxon rank sum test.
(G) Box plots comparing the proportions of CD8+ T cells across defined sample groups.
(H) The proportions of representative cell types among all TME (left) or immune cells (right) between defined sample groups.
Box, median +/− interquartile range. Whiskers, minimum and maximum. For (E, G, H), P values were calculated by two-sided Wilcoxon rank sum test.
Among all TME cells, 1.8% were at the G2M or S phase with a high expression of cell proliferation markers29. Down-sampling analysis suggested that the clustering results were reproducible and not influenced by the total number of cells from each tissue type (Figure S1A). Further subclustering analysis identified a total of 62 cell transcriptional states (Figures 2–3; S2–4; Table S2).
Figure 2. Characterization of T cell States.

(A) UMAP view of 7 CD4+ T cell clusters.
(B) UMAP view of 10 CD8+ T cell clusters.
(C) Expression levels and frequencies of selected markers across CD8+ T cell clusters.
(D) Heatmap showing tissue prevalence estimated by the ratio of observed to expected cell numbers with the chi-square test (Ro/e) for each CD4+ (upper panels) and CD8+ (lower panels) T cell subsets. Top bar plot showing cell composition and right bar plot showing tissue composition.
(E) The cellular proportions of representative CD4+/CD8+ T cell subsets across tissue groups for this study. Only samples with ≥ 50 total CD4+ or CD8+ T cells were included.
(F) Same as in (E) showing the single-cell cohort from Kumar et al.
(G) Monocle trajectory inference of CD8+ T cells, colored by their corresponding pseudotime.
(H) Same as in (G) but displayed by tissue origins.
(I) Cell density plots for CD8+ T cell subsets along the pseudotime.
(J) Expression dynamics of representative genes in different tissues (color coded), along the pseudotime. (E, F) P values were calculated by one-way Kruskal-Wallis rank sum test. Box, median +/− interquartile range. Whiskers, minimum and maximum.
Figure 3. Characterization of Myeloid, B, and stromal cell populations.

(A) UMAP view of myeloid cell clusters.
(B) Expression levels and frequencies of genes composing the M1-like, M2-like, angiogenesis, phagocytosis signatures, and checkpoint genes across myeloid cell clusters. Only genes (expressed in ≥ 20% cells in at least one of the myeloid cell subsets) are shown.
(C) Expression levels of 4 gene signatures across myeloid cell clusters.
(D) The proportions of 2 myeloid cell subsets across tissue groups. Only samples with ≥ 50 cells were included. P values across different tissues were calculated by one-way Kruskal-Wallis rank sum test and P values between T_pri and T_Met were calculated by two-sided Wilcoxon rank sum test.
(E) The odds ratios and P values based on transcriptome similarity with their corresponding cell subsets from primary GACs or PBMCs, indicating the likely origins of myeloid cells in PC ascites samples. P values were calculated by two-sided Fisher’s exact test.
(F) UMAP view of B and plasma cell clusters.
(G) Heatmap showing tissue prevalence estimated by Ro/e score for each B/plasma cell subsets. Top bar plots showing cell compositions and right bar plot showing tissue compositions.
(H) The cellular proportions of IgA+ plasma cells across tissue groups with available H. pylori status. Only samples with ≥ 50 total TME cells were included. Number of samples (from left to right): 3, 7, 4, 3, respectively.
(I) UMAP view of stromal cell clusters.
(J) Tissue prevalence estimated by Ro/e score for each stromal cell subset.
(K) Correlation coefficient between cell proportions of Endo_C7 and other TME cell subsets. Only statistically significant (P < 0.05) positive (red) and negative (green) correlations are shown. Correlation coefficient and P values were calculated by Spearman’s correlation test.
(L) Expression of 4 representative immune checkpoint genes across tissue groups.
Box, median +/− interquartile range. Whiskers, minimum and maximum. See also Figures S3, S4 and Tables S2, S3.
To better understand the TME landscapes, we examined the cellular abundances and compositions of major lineages across different tissue groups (Figures 1C–E; S1B). We observed substantial changes in the proportions of plasma cells and mast cells over GAC progression with a significant increase in precancerous conditions (CAG and IM), followed by a sharp decline in primary GACs, while both populations were largely absent in metastases (Figures 1D–E). This observation aligns with the etiology of CAG/IM, which is suggested to result from chronic inflammatory injury of the gastric mucosa due to Helicobacter pylori (H. pylori) infection30,31. In contrast, the cellular abundance of myeloid and CD4+ T cells showed a distinct pattern, with a major shift from premalignant lesions to primary GACs and remained at high levels in metastases (Figures 1C–E). To further examine changes in cellular compositions during disease progression, we analyzed matched NAT-primary GACs (n = 9 pairs) and primary-metastatic GACs (n = 6 pairs) collected from the same patients (Figure 1F). Although small in sample size, paired comparisons showed a significant decrease in the fractions of plasma cells and an increase in myeloid cells as GAC progressed. These coincided with the patterns that emerged from analyses using all samples.
Next, we sought to correlate major clinical and histopathological features (Table S1) with TME cell characteristics. The CD8+ T cell fractions among all TME (or immune) cells were significantly higher in distal compared to proximal GACs in microsatellite-stable tumors (Figure 1G), consistent with the poor prognosis of patients with proximal GAC. Although TME cell heterogeneity based on primary GAC location has not been described, our data will need validation in a larger cohort. Additionally, we observed that stromal cell fractions were significantly higher in signet-ring cell carcinoma (SRC) compared to non-signet ring cell carcinoma (NOS), and plasma cells tended to be more abundant in poorly versus moderately differentiated GACs (Figure 1H). While CD8+ T cell fractions significantly decreased and myeloid cell fractions increased in primary GACs compared to NAT tissues, no difference was observed between GACs with and without microsatellite instability (MSI, Figure S1C), likely due to the small cohort size.
Changes in T cell States as GAC Progresses
Unsupervised clustering analyses of T/NK cells (Figure S2) identified 7 major cell types including CD4+ T, CD8+ T, NK, double-negative T (DNT), gamma delta T (γδT), NKT, and proliferating cells (Figure S2A; Table S2). Further subclustering analyses revealed 7 CD4+ T cell states and 10 CD8+ T cell states (Figures 2A–B, S2B–C; Table S2). Among CD4+ T cells, we identified naïve (TN, C0), regulatory (TREG, C3), follicular helper (TFH, C6), memory (TMEM, C1)32,33, Th17-like (C5)34, stress response (TSTR, C2), and notably the understudied cytotoxic T cells (CTL, C4)35. Among them, the TFH, TREG, Th17-like, CTL, and TSTR subpopulations were more abundant in tissue samples, and TREG was specifically enriched in primary GACs (Figures 2D–F; S2C–E).
Among CD8+ T cells (Figures 2B–C, S2B–C; Table S2), we identified naïve (TN, C3), cytotoxic (CTL, C6), memory (TMEM, C1), central memory (TCM, C9), and stress response (TSTR, C4) CD8+ T cells35. We also identified a CD8+ subset displaying high expression of interferon-stimulated genes (ISGs) (TISG, C7) and a cluster of transitional effector CD8+ T cells (TTE, C0) that showed high expression of GZMK36, MHC class II genes and KLRG1, similar to the previously described GZMK+ CD8+ T cells37,38; a plastic exhaustion state (TPEX, C2) and a terminal exhaustion state (TEX, C8) characterized by the highest expression of exhaustion related markers39–43 (Figure 2C). In addition, cells of C5 demonstrated high expression of the semi-variable T cell receptor (TCR) gene TRAV1–2, SLC4A10, and KLRB1, matching the phenotypes of CD8+ mucosal-associated invariant T (MAIT) cells44. Among these CD8+ states, the TSTR, TPEX, and TEX subsets were nearly exclusive to tissues or PC samples and rarely seen in PBMCs. The TMEM, TISG, and CTL subpopulations were also highly abundant in tissues or PC samples (Figures 2D; S2C–E). The C8 TEX and C6 CTL, although small subsets, showed high enrichment in primary GACs. The C0 TTE and C2 TPEX subsets gradually increased as GACs progressed and were most abundant in metastatic GACs, which was corroborated using scRNA-seq data from an independent cohort28 (Figures 2D–F).
Next, we applied Monocle 345–47 to infer the differentiation trajectory of CD8+ T cells (Figures 2G–J). This analysis showed a trajectory that started with CD8+ TN, which then segregated into two major branches (Figures 2B, 2G). Branch 1 connected with C0 TTE, followed by C6 CTL, C1 TMEM, and ended in C4 TSTR. Branch 2 passed through C0 TTE, followed by C2 TPEX, and reached C8 TEX. Intriguingly, CD8+ T cells from NAT samples were mainly aligned along branch 1, while CD8+ T cells from metastatic GACs were mostly aligned along branch 2, and CD8+ T cells from the primary GACs spread on both branches (Figure 2H), indicating diverse CD8+ T cell differentiation trajectories that were possibly shaped by local contexts. We further examined the expression dynamics of immune regulatory genes along the pseudotime axis. Expression of transcription factors associated with T cell exhaustion (e.g., BATF, TOX) gradually increased along the pseudotime axis during the transition from CD8+ TTE to TPEX mainly in the primary GACs, and expression of inhibitory immune checkpoint genes (e.g., CTLA4, HAVCR2, and LAYN) upregulated subsequently and peaked in the primary GACs (Figures 2I–J). Expression dynamics of ENTPD1 (CD39), TNFRSF9 (4–1BB), and CXCL13 showed a similar pattern, suggesting that these exhausted CD8+ T cells were likely TME-specific.
Immunosuppressive Myeloid Subsets Dominated in Tumors at Advanced Stages
We then characterized the heterogeneous myeloid cell subsets. In addition to pDCs and mast cells (Figure 1B), we identified 11 other myeloid cell states, including 3 clusters for monocytes, 4 clusters for tumor-associated macrophages (TAMs), and 4 clusters for DCs (Figures 3A; S3A; Table S2). Overall, TAM and DC cluster cells showed high expression of phagocytosis gene signature (Figures 3B–C, S3B). TAM clusters highly expressed M2-like, angiogenesis-related gene signatures, and inhibitory immune checkpoint genes (Figures 3B–C, S3B–C), suggesting an immunosuppressive phenotype. TAMs and DCs were predominantly present in tissue and PC samples, while monocytes mainly originated from PBMCs (Figures 3D, S3D–E).
Within the TAM clusters, TAM_C0, which displayed the most substantial expression of M2-like gene signature and immunosuppressive genes (e.g., HAVCR2, SIRPA, and LAIR1), was abundant in precancerous lesions, primary, and metastatic GACs (Figures 3B–C, S3C, S3D). TAM_C3, characterized by the highest expression of IL1B, MMP19, CCL20, VEGFA, was most prevalent in primary GACs (Figures 3B, 3D, S3C–E). TAM_C7, specifically enriched in metastatic GACs, exhibited the highest expression of genes involved in angiogenesis48 and FN1, which encodes fibronectin, a core component of the tumor matrisome that sustains proliferative signaling and promotes metastatic spread of malignant cells49, alongside high expression of immunosuppressive genes such as SPP150, LAIR1, SIRPA, HAVCR2, TGFB1, and MARCO (Figures 3B–D, S3B–E).
In addition, we identified four DC subsets, including the classical CLEC9A+ cDC1 (C14), CD1C+ cDC2 (C5), MKI67+ proliferating DC (C9), and a LAMP3+ mature cDC subset (C13)48,51 (Figures 3A, S3A; Table S2). Among them, cDC1, exhibiting the highest expression of the antigen-presenting cell (APC) gene signature and the lowest expression of M2-like gene signature, was dominant in NAT and IM but less abundant in primary and metastatic GACs (Figures 3B–C, S3B, S3D). Similarly, proliferating DCs were highly enriched in the precancerous lesions but their fractions decreased in primary and metastatic GACs (Figures S3D–E). Conversely, LAMP3+ DCs, displaying the highest expression of CD274 (PD-L1), IDO1, and TIGIT signaling genes (e.g., NECTIN2 and PVR), were enriched in IM and most abundant in primary GACs (Figures S3C–E). When inferring the likely origins of these myeloid cells in PC (Figure 3E), we found that LAMP3+ DCs and M2-like TAM_C0 were more closely related to myeloid cells from primary GACs, while the three monocyte clusters were transcriptomically similar to myeloid cells from PBMCs. Together, myeloid cells were abundant in the TME with diverse lineages, transcriptional states, and altered cell compositions, transitioning from immune-stimulating to immunosuppressive states as GAC progressed.
Highly Enriched IgA+ Plasma Cells in Precancerous Lesions
To better delineate the tumor-infiltrating B and plasma cells, we performed subclustering analysis and identified B cell clusters (C2, C3), IgG+ (C4) and IgA+ plasma cells (C0, C1) (Figures 3F, Table S2). C3 B cells were CD20+CD38−CD27−IgD+ with high expression levels of IRF4 and markers associated with B cell activation such as CD69, CD8352, and DUSP253, thus aligning with the phenotype of antigen-activated B cells. Both C2 and C3 displayed TGFB1 expression, a marker of regulatory B cells (Bregs)54. However, we couldn’t detect other Breg-related markers such as IL10, CD274, FASL, IL35, HAVCR1 (TIM-1).
The absolute abundance of B and plasma cells varied across tissues and the relative B/plasma cell proportions also showed significant differences, with plasma cells of various isotypes present in specific tissues. In CAG/IM, B cells were nearly eliminated, while the relative proportions of IgA+ plasma cells were the highest (Figures 3G, S4A). IgG+ plasma cells were most prevalent in primary GACs but had low frequencies in other tissues. The proportions of B cell subsets were high in both metastatic GACs and PBMCs (Figures 3G, S4A). In our study, we had access to the H. pylori status for 30 samples from 22 patients. We compared the proportions of plasma cells between H. pylori-negative and positive samples and observed a trend of increased IgA+ plasma cell in H. pylori-positive (versus H. pylori-negative) samples, both in CAG/IM (median: 50.5% vs. 25.8%) and primary GACs (median: 11.5% vs. 4.7%) (Figure 3H). However, these differences did not reach statistical significance, likely due to the small cohort size.
Stromal Cell Remodeling in GAC Progression
We identified 4 major stromal cell lineages and 13 clusters, comprising 5 fibroblast, 4 endothelial cell, 2 vascular smooth muscle cell (VSMCs), and 2 mesothelial cell clusters (Figures 3I, S4B; Table S2). These fibroblasts displayed distinct tissue distribution (Figure 3J). To better characterize the heterogeneous states of cancer-associated fibroblasts (CAFs), we quantified the expression of gene signatures of inflammatory CAF (iCAF) and myofibroblastic CAF (myCAF)55. Fibroblast C6 showed high IFNγ-iCAF signature expression, while clusters C2 and C9 displayed dominant myCAF signatures (Figure S4C). C2/C9 cells also highly expressed INHBA (Figure S4E), linked with CAFs and poor prognosis28. C9 fibroblasts were enriched in IM, and C2 fibroblasts were abundant in primary GACs in both this study and the scRNA-seq cohort from Kumar et al.28 (Figures 3J, S4D). Notably, a combined C2/C9 gene signature was associated with unfavorable survival outcomes in 4 large cohorts of localized GACs, encompassing over 1,300 patients (Figure S4F), with expression levels strongly linked to the risk of developing local recurrences and metastases (Figure S4G).
Endothelial cluster C7, expressing ESM1 and VWF that regulate angiogenesis56, and C13, expressing RGS5, abundant in endothelial cells of tumor vessels57,58, were enriched in primary GACs (Figures 3J, S4B, and S4H). VSCM C14 was prevalent in IM, and both mesothelial clusters, C12 and C8, were highly abundant in metastatic GACs corresponding to PC (Figure 3J). Additionally, we found that endothelial C7 population frequency negatively correlated with proportions of CD4/CD8/NK cell subsets, and positively correlated with proportions of other stromal, TAMs, and plasma cell subsets (Figure 3K). Further validation in large cohorts and mechanistic studies are necessary to better understand the complex interplay between stromal cells and T/NK cell infiltration in the TME.
We next examined the expression of 67 functionally characterized inhibitory immune checkpoint genes (Table S3)59,60 and found 10 genes expressed in ≥ 20% of cells in at least 1 stromal cell subset (Figure S4I). Among them, NECTIN2, CD276 (B7-H3), CD200, and SIRPA were expressed by stromal cells, especially endothelial and mesothelial subsets, with the highest expression in metastatic GACs (Figure 3L). Together, our results highlight considerable stromal changes along GAC progression, potentially driving tumor angiogenesis and immunosuppressive signaling pathways. Upregulated inhibitory immune checkpoint genes could be potential therapeutic targets, requiring further validation studies.
Phenotypic Relationships and Population Abundance of 62 TME Cell Subsets
After individually exploring the distinct cell types/states for each major TME compartment (Figures 2–3, S2–4), we next investigated the relative abundance and phenotypic relationships of these 62 TME cell subsets (Methods). We quantified their transcriptomic similarity by conducting unsupervised hierarchical clustering, which revealed two primary groups (Figure 4A, top): one mainly composed of lymphoid cells, which was further divided into 5 branches dominated by proliferating, B/plasma, NK/NKT, CD8+ T, and CD4+ T cells; the other composed of myeloid and stromal cells in two distinct branches. Overall, different cell populations of the same major lineages clustered together with a few exceptions. Within the lymphoid compartment cluster, as expected, plasmacytoid dendritic cells (pDCs) that resemble plasma cells61 grouped with B/plasma cells; CD8+ TN cells were more similar to CD4+ TN cells than other CD8+ subsets; and proliferating cells, regardless of their origins, clustered together, possibly due to their unique expression of cell proliferative markers. Mast cells and DNT cells clustered together within the lymphoid branch, possibly due to their expression of inflammation-related genes. VSMCs were more closely related to fibroblasts, likely due to their joint role in angiogenesis62.
Figure 4. Phenotypic relationships and population abundance of 62 TME cell subpopulations.

(A) Unsupervised hierarchical clustering of 62 TME cell subsets. The heatmap shows the expression of inflammation and cytokine gene signatures (top panels), tissue prevalence estimated by Ro/e score (middle panels), and their prognostic significance in 4 primary GAC cohorts (bottom panels) as evaluated by univariable Cox regression analysis.
(B) Correlation among 62 TME cell subsets in 58 samples, based on their relative population abundance among all TME cells. P values were calculated by Spearman correlation test with Benjamini–Hochberg correction for multiple comparisons.
We then compared global trends in cluster enrichment (Figure 4A, middle). As expected, stromal, plasma, and mast cell subsets were mainly in tissue samples, highly abundant in CAG/IM, while monocytes clusters were enriched in PBMCs and PC samples. DC and TAM clusters, showing high inflammatory and cytokine signature expression, tended to be enriched in IM, primary, and metastatic GACs. Primary GACs showed enrichment of proliferative lymphoid cells, CD4+ TREG, CD4/CD8+ TSTR and CD8+ TEX, while metastatic GACs had increased levels of innate immune cells (e.g., NK/NKT, MAIT, γδT), CD4+/CD8+ TN and CTL, demonstrating distinct TME landscapes between primary and metastatic niches. We next examined whether the presence of a particular cell subset in the TME of primary GACs was associated with prognosis by deconvoluting the bulk expression data using our single-cell-derived gene signatures. We found the abundance of stromal cell subsets to be the most strongly associated with shorter patient survival (Figure 4A, bottom).
We also examined sample-level correlation between the population frequencies of these 62 subpopulations (Figure 4B). We observed negative correlations between fibroblasts, endothelial cells, TAMs, and plasma cells with CD4+/CD8+ T, NK, and B cell subsets, and a positive correlation between stromal and plasma subsets. Consistent with this, previous studies have shown that stromal cells recruit plasma cells in other cancer types63–65 and influence the ability of TILs to infiltrate tumor beds66–68. Collectively, our results revealed evolving TME landscapes as GAC progressed and suggested potential interactions between tumor-associated stromal and immune cells.
Ecotypes of TME Cells and Their Clinical Significance
To understand how these phenotypically diverse immune and stromal cell subsets form cohesive cellular “ecosystems” in the TME and how these ecosystems change across GAC progression, we quantified the cellular compositions of 58 samples (≥ 150 cells). Using unsupervised clustering analysis based on relative cellular abundance (Tables S4–5), we inferred cellular relationships and co-association patterns (Methods). Our analysis identified 3 distinct cellular ecosystems (i.e., EC1/2, EC3/4, EC5/6) and 6 ecotypes (hereafter referred to as EC1–6) (Figures 5A–B), which were confirmed through independent approaches, including the Jaccard similarity index of cell population co-existence (Figure 5B; Table S6).
Figure 5. Ecotypes of TME cells and their clinical relevance.

(A) Six ecotypes (EC1–6) inferred based on TME cell compositions in the 58 samples.
(B) Network plots based on the Jaccard similarity index of cell population co-existence.
(C) Representative histology images for various tissue groups.
(D) The composition of detected ecotypes in primary GACs.
(E) Deconvolution analysis of TCGA STAD cohort. Heatmap on the left shows the identification of EC3-like and EC6-like ecotypes. The alluvial plots in the middle depict relationships between the two cellular ecotypes and Lauren’s histology types, as well as previously defined molecular subtypes. The Kaplan–Meier plots on the right display survival correlations of the two cellular ecotypes in all GACs, CIN subtype GACs, and diffuse type GACs, respectively.
(F) The same as in (E), showing deconvolution analyses of another primary GAC cohort. See also Figure S5 and Tables S4–S6.
Each ecosystem/ecotype was dominated by specific cell types/states, showing unique cellular compositions and co-habitation patterns. This supports the notion that the discovered ecosystems/ecotypes can collectively capture the landscape of TME transcriptional heterogeneity across these tissue types. Intriguingly, the ecotypes appeared to be context-dependent (Figures 5A–C), with EC1 comprising all PBMC samples and dominated by monocytes, NK cells, and CD4+/CD8+ TN cells, EC2 enriched in metastatic GACs, EC4 prevalent in NAT, EC5 most common in premalignant lesions, and primary GACs dominated by EC3 and EC6 with drastically different cellular compositions (Figures 5A–B and 5D). EC3 was mainly composed of CD4+ and CD8+ T cells, NK/MAIT, and DCs, whereas EC6 was comprised mostly of stromal cell subsets, proliferative B cells, and IgG+ plasma cells.
We then examined the clinical relevance of EC3 and EC6 in primary GACs (n = 13). No statistically significant difference was observed, likely due to the small sample size. We then employed a deconvolution approach (Methods) to infer the presence of EC3-like and EC6-like ecotypes in three large-scale primary GAC cohorts with available gene expression and clinical data69–71. Both EC3-like and EC6-like ecotypes were present in all cohorts (Figures 5E–F and S5A). Notably, the EC6-like gene signature outperformed the previously described fibrotic microenvironment subtype (subtype F) signature72 in identifying stromalenriched tumors (Figures S5B–C). Moreover, analysis of the inferred ecotypes revealed significant correlations with previously defined histology, genomics, molecular subtypes, and clinical outcomes (Figures 5E–F and S5B). Consistently across all three cohorts, the EC3-like ecotype was highly enriched in intestinal-type GACs, whereas the EC6-like ecotype was dominant in the aggressive diffuse-type GACs (Figures 5E–F and S5B). In the TCGA primary GAC cohort (Figure 5E), the EC3-like ecotype was prevalent in Epstein-Barr virus (EBV)-positive tumors (two-sided Fisher’s exact test, P = 0.038), and the genomically stable (GS) tumors were primarily EC6-like ecotype (two-sided Fisher’s exact test, P = 1.1e-11). Patients with tumors harboring the EC6-like ecotype showed significantly shorter survival when compared to those with the EC3-like ecotype (P = 0.017). The most frequent chromosomal instability (CIN) subtype was composed of both EC3-like and EC6-like ecotypes at a similar frequency, but interestingly, survival analysis within tumors of the CIN subtype demonstrated that patients with EC6-like ecotype had shorter overall survival than those with EC3-like ecotype (P = 0.0062). Within the CIN group, compared to the EC3 subtype, tumors of the EC6 subtype exhibited a significantly increased stromal cell fraction, elevated TGF-β response score, a lower fraction of genome altered, and decreased proliferation score (Figure S5D). Moreover, survival analysis within the diffuse-subtype GACs showed that the survival of patients with EC6-like ecotype appeared to be worse than those with EC3-like ecotype (P = 0.077).
Consistently, in the other primary GAC cohort69 (Figure 5F), the EC3-like ecotype was significantly associated with the proliferative molecular subtype (P = 2.6e-15), and the EC6-like ecotype was enriched in the invasive molecular subtype (P = 7.6e-21) defined by the original study. Again, patients with the EC6-like ecotype had significantly shorter survival when compared to those with the EC3-like ecotype (P = 0.015); and the significance was retained with stratified analysis performed within GACs of the metabolic subtype. In the third primary GAC cohort70 (Figure S5B), the EC6-like ecotype was significantly enriched in the MSS/TP53− tumors (P = 0.04) and tumors with epithelial-to-mesenchymal transition (EMT) features (P = 1.2e-4). Overall, we did not observe a significant correlation between the ecotypes and tumor stage in these cohorts (Figure S5E). Inhibitory immune checkpoints such as PDCD1LG2 (PD-L2), LILRB2, HAVCR2, and LAIR1 had higher expression levels in EC6-like tumors compared to EC3-like tumors in all three cohorts (Figure S5F). In conclusion, the non-genetic, cellular ecotype-based classification of primary GACs correlated with their genomic, histopathological, and clinical features.
SDC2 Upregulation in Tumor Stroma Associates with Aggressive Phenotype and Poor Survival
To identify potential targets in the immune and stromal TME components, we performed integrative analysis on a curated list of 157 genes, including immune checkpoint genes and other known/emerging viable immunomodulatory targets (Table S3). We screened for genes expressed in at least 20% of cells in one or more TME cell subsets, identifying 50 genes (Figure S6). Among them, 45 genes were highly expressed in tumor versus NAT samples, and 21 genes showed a significant association with survival outcomes in public GAC cohorts (Figure 6A). Among them, SDC2 (Syndecan 2), ITGB1, and TGFB1 showed a significant association with survival in ≥3 GAC cohorts. SDC2 and ITGB1 exhibited the highest expression in cancer-associated stromal cells, whereas TGFB1 was most abundant in myeloid cells (Figure 6A). Dysregulated TGF-β signaling has been extensively studied in GAC and other cancer types. However, little is known about SDC2 or ITGB1 overexpression in stromal cells in GAC, and their roles in oncoprogression of GAC remain elusive.
Figure 6. SDC2 Upregulation in Tumor Stromal Cells.

(A) Bubble plots (upper panel) show expression levels and proportions of immunomodulatory genes across TME cell clusters. The heatmap (lower panel) depict their prognostic significance in 4 primary GAC cohorts using univariable Cox regression model.
(B) SDC2 expression levels across different cell subsets in 3 independent single-cell cohorts.
(C-D) SDC2 expression levels across fibroblast subsets in this study (C) and the Kumar et al. cohort (D).
(E) Correlations between the proportions of SDC2+ fibroblasts and expression levels of CAF signature scores. P values were calculated by Spearman correlation tests.
(F) Expression of SDC2 in fibroblasts and VSMCs across tissue groups in this study. P values were calculated by one-way Kruskal-Wallis rank sum test.
(G) SDC2 expression in fibroblasts of normal and primary tumor samples in the scRNA-seq data from Kumar et al.
(H) Dual immunofluorescent staining of SDC2 and Vimentin. Representative images of intestinal and diffuse type of GAC tissues are shown.
(I) SDC2 expression in EC3-like (n=232) and EC6-like (n=177) groups identified in Figure 6E. Box, median +/− interquartile range. Whiskers, minimum and maximum.
(J-K) Increased SDC2 expression in diffuse (vs. intestinal) type of GAC tissues in this study (J) and the Kumar et al. cohort (K).
(L) SDC2 expression in fibroblasts between matched peritoneal metastases (implants) and ascites cells obtained from the same GAC patients (n = 13).
(C-D, G, I, J-K) P values were calculated by two-sided Wilcoxon rank sum test. See also Figures S6, S7, and Table S3.
Subsequent analysis of 3 scRNA-seq datasets, including both cancer and TME cells, confirmed SDC2 enrichment in stromal cells (Figure 6B). Consistently across all 3 datasets, SDC2 showed the highest expression in stromal cell populations but its expression in epithelial or immune cells was low or undetectable. Within the fibroblast subsets, SDC2 was highly expressed in clusters C9 and C2, both displaying the highest expression of myCAF signatures (Figures 6C and S7A). This observation was further validated in an independent scRNA-seq cohort28 (Figure 6D). Consistently, the fractions of SDC2+ cells among fibroblasts showed a negative correlation with normal-like fibroblast signatures and a strong positive correlation with myCAF signatures (Figure 6E). In addition, SDC2 expression in stromal cells of premalignant and malignant tissues were significantly higher than that of NAT samples (Figures 6F–G), supporting our discovery that SDC2 was predominantly expressed in CAFs. ITGB1 was highly abundant in all stromal cell populations across 3 datasets, and it was also expressed at lower levels in immune or tumor cells (Data not shown). However, unlike SDC2, NAT stromal cells also showed considerable levels of ITGB1 expression (Figure S7B), leading us to focus on SDC2.
To validate SDC2 expression at the protein level, we next performed double immunofluorescence staining of primary GAC tissues, which demonstrated intense SDC2 positivity in stromal cells (vimentin+) (Figure 6H). High SDC2 protein expression in GAC stromal cells was also confirmed by the SDC2 IHC staining data from the Human Protein Atlas (Figure S7C). In the TCGA primary GAC cohort, SDC2 expression was significantly higher in EC6-like compared to EC3-like GACs (Figure 6I). Notably, SDC2 expression was significantly higher in diffuse-type GACs, known for poor prognosis, compared to intestinal-type GACs (Figure 6J). We also validated this observation using scRNA-seq data from Kumar et al.28 (Figure 6K). Together, SDC2 expression in fibroblasts correlated with the aggressive phenotype of the disease.
We further evaluated the clinical significance of SDC2 upregulation in GAC cohorts. SDC2 upregulation correlated with significantly shorter survival in all four primary GAC cohorts (Figure 7A). To validate its clinical relevance at the protein level, we conducted additional analyses in an independent large-scale primary GAC cohort consisting of 359 patients. Tissue microarrays (TMAs) were used to analyze SDC2 protein expression (Figure 7B). SDC2 was mainly localized in the cytoplasm and membrane of stromal and tumor cells (Figure S7D). SDC2 expression was detected in 270 (75.2%) of 359 GAC tumor tissues, which was significantly higher than in normal stomach tissues (30.9%, two-sided Fisher’s exact test, P < 2.2e-16) (Figure 7C, left). SDC2 expression was significantly correlated with tumor stage. Compared to early-stage GACs (stage I/II, 45/84, 53.6%), the frequency of SDC2 positivity significantly increased in GACs at advanced stages (stage III/IV, 186/261, 71.3%) (two-sided Fisher’s exact test, P = 0.0034) (Figure 7C, right). Consistently, high SDC2 expression in GAC tissues was associated with significantly shorter survival (P = 0.01) (Figure 7D), and the prognostic significance was retained after adjusting for other potential covariates (e.g., tumor stage) in a multivariable Cox regression model (Figure 7E). In conclusion, SDC2 expression was upregulated at both gene and protein levels in tumor stroma, and its upregulation was significantly associated with tumor progression and poor survival, independent of other clinical or histopathological variables.
Figure 7. Prognostic Significance of SDC2 Upregulation in GAC Cohorts and the Effect of SDC2 Overexpression in CAFs on Tumor Growth in Mouse Models.

(A) Kaplan–Meier plots illustrating prognostic significance of SDC2 upregulation across 4 primary GAC cohorts. P values were calculated by log-rank test.
(B) Schematic depicting the study design of an independent primary GAC cohort to validate clinical relevance of SDC2 overexpression at protein level.
(C) Composition of patients with SDC2-positive or SDC2-negative statuses as determined by IHC staining of normal and tumor tissues (left), and early (stage I or II) or late stages (stage III or IV) (right). P values were calculated by two-sided Fisher’s exact tests.
(D) The prognostic significance of SDC2 staining positivity in this cohort. P values were calculated by log-rank test.
(E) Univariate and multivariate Cox proportional regression outcomes for this validation cohort, with age, gender, differentiation status, Lauren’s type, tumor stage, and SDC2 IHC included. CI, confidence interval; TNM, tumor, node, metastases.
(F-J) Effect of SDC2-overexpressed CAF in the xenografted mice. In vivo tumor growth of co-subcutaneous injection of patient-derived PC tumor cells (GA0518) and cancer-associated fibroblasts (CAFs) with SDC2-overexpression (OE) as GF0818-SDC2 is shown. GA0518 cells labeled with mCherry-Luciferase (GA0518-mCh2) as tumor cells plus GF0818-SDC2 or corresponding empty vector transfected GF0818 cells (GF0818-EV) as CAFs were subcutaneously co-injected into five female SCID mice with two injection sites per mice.
(F) Bioluminescent images by luciferase in representative mice at three time points post-injection.
(G) Quantification of tumor size expressed as total bioluminescence intensity of injection sites at each time points. Box, median +/− interquartile range. Whiskers, minimum and maximum.
(H) Tumor growth measured twice a week with a digital caliper over time.
(I) Macro images of the excised subcutaneous tumor mass upon sacrifice. No tumors were observed in four injection sites of the EV control group and one injection site of SDC2 group at endpoint. One mouse in the SDC2 group was euthanized because of tumor ulceration before endpoint.
(J) Tumor weights of the extracted subcutaneous tumors at the endpoint. Data represent mean ± SD from five mice. *, P < 0.05; **, P < 0.01; ***, P < 0.001 vs. empty vector control (two-sided Wilcoxon rank sum test)
See also Figure S7.
Finally, to assess SDC2 expression in stromal cells across various cancer types, we examined 7 additional scRNA-seq cohorts spanning 5 cancer types: pancreatic73,74, colorectal75, bladder, breast cancer76,77, and clear cell renal cell carcinoma (ccRCC). Our analysis consistently revealed that SDC2 expression was predominantly elevated in stromal cell subsets (Figure S7E), with negligible or undetectable levels in epithelial and immune cells. Consistent with our observations in GACs, in 3 datasets with matched normal tissues73,75,77, we observed significantly higher SDC2 expression levels in stromal cells from tumor samples compared to adjacent normal tissues. In breast cancer patients77, SDC2 expression in fibroblasts exhibited a progressive increase from precancerous lesions to primary tumors (Figure S7E). In summary, SDC2 expression is consistently elevated in stromal cells across various cancer types, indicating its potential role in tumor progression.
SDC2 Upregulation in CAFs Contributes to Tumor Growth in vivo in Xenograft Models
Lastly, we sought to assess the functional effect of SDC2 expression in CAFs on tumor growth in vivo. We first established an SDC2-overexpressing CAF cell line (GF0818-SDC2) by transfecting patient-derived CAFs (GF0818) with the plasmid pcDNA3.1-SDC2. We successfully validated SDC2 overexpression in GF0818-SDC2 cells using q-PCR. A significant increase was observed in SDC2 expression in GF0818-SDC2 cells compared to the corresponding vector control (GF0818-EV) (Figure S7F). Next, we examined the in-vivo tumorigenesis of GF0818-SDC2 in SCID mouse xenograft models by subcutaneously co-injecting PC patient-derived cancer cells (GA0518)78 mixed with GF0818-SDC2 or GF0818-EV, respectively (Methods). As shown in Figures 7F–H, the growth rate of tumors co-implanted with patient-derived tumor cells with GF0818-SDC2 was significantly higher than those co-implanted with GA0518 and GF0818-EV, as evidenced by bioluminescence imaging. We resected the subcutaneous tumors at the endpoint (Figure 7I) and measured their weights. The final weights of the tumors also demonstrated that tumors co-injected with GF0818-SDC2 were significantly heavier than those with GF0818-EV (Figure 7J). These in vivo data suggest that upregulation of SDC2 expression in CAFs promotes tumor growth under immunodeficient conditions.
DISCUSSION
GAC has long been considered a disease characterized by genomic/epigenetic alterations and chromosomal instability71. However, the role of immune and stromal cells within the TME is now increasingly recognized21,22,25,26,28. In this study, we conducted a comprehensive characterization of the complex TME landscapes along the evolutionary trajectory of GAC, demonstrating the TME features and properties associated with GAC’s phenotypic progression. We discovered unique TME ecotypes linked to GAC progression and outcomes, and pinpointed potential biomarkers and therapeutic targets. Our findings were orthogonally validated using both bulk RNA-seq and scRNA-seq datasets and functionally confirmed in mouse models. Our data can serve as a valuable resource to spur future novel discoveries.
A recent single-cell study described GAC premalignant lesions, but the analysis was limited to epithelial cells within a small cohort79. In our study, we found a striking prevalence of primarily IgA+ plasma cells in CAG/IM, with a trend towards increased presence in H. pylori-positive premalignant lesions. These observations align well with existing knowledge. Firstly, H. pylori infection stimulates strong H. pylori-specific IgA antibody production in gastric mucosa80,81. Documented evidence shows that IgA competes with IgG for bacteria binding82, facilitating bacterial adherence to evade immune recognition83,84. Additionally, IgA actively contributes to the initiation of inflammation54,85,86. Secondly, IgA+ plasma cells have been reported to exert inhibitory effects on T cells, DCs, and other immune subsets through FcαRI receptor activation, induction of IL-10 production, and regulation of proinflammatory cytokines54, fostering a “permissive” microenvironment promoting malignant transformation. Consistent with this, we found that IgA+ plasma cells express high levels of LGALS3 (Galectin-3) and VISTA, known for their contributions to immunosuppression87,88. We also showed that the proportions of IgA+ plasma cells negatively correlated with CD4+/CD8+ T cells, pDCs, and NK cells, while positively correlated stromal cells. Moreover, our cell ecotype analysis discovered EC5, a unique ecotype primarily observed in tissues composed of IgA+ plasma cells and stromal cells, suggesting their co-existence and interaction in premalignant TME. Collectively, our observations suggest an immunopathological role for IgA+ plasma cells in early tumorigenesis. Future studies should consider integrating B cell receptor (BCR) sequencing to enhance our understanding of the BCR repertoire and plasma cell clonal expansion. Investigating cytokines known to induce IgA class switching and provide survival signal for IgA+ plasma cells, along with conducting functional studies, is crucial for gaining a mechanistic understanding of the factors influencing plasma cell differentiation and antibody production in the premalignant microenvironment and GAC TME.
This study highlights extensive TME remodeling during GAC progression. We observed increased proportions of immunosuppressive CD4+ Tregs, LAMP3+ cDCs48, TGFB1+ B cells54, CD8+ TEX cells, as well as pro-angiogenic TAMs48, myCAFs55, and endothelial cells. These findings suggest progressive immunosuppression and tumor stroma remodeling favoring angiogenesis and tumor cell adaptations. Moreover, we demonstrated that the TME in patients with PC represents a distinct microenvironment characterized by a higher proportion (vs. primary GACs) of naïve CD4+/CD8+ T, CD8+ TPEX, NK/NKT cells, monocytes, DCs, and TAMs. This is accompanied by diminished fractions of CD4+ TFH, Th17-like cells, B/plasma cells, and decreased or absent co-stimulatory signals involved in T cell activation/function, implying a skewed TME and unfavorable microenvironment that hampers the host’s capacity to mount an effective anti-tumor immune response. Our computational lineage tracing analysis revealed that some cell subsets in primary GACs, such as M2-like TAMs, tended to accumulate in the ascites. This finding suggests that the TME of primary GAC may possess the potential to shape the immune response of metastatic niches, as previously described in hepatocellular carcinoma51. However, further investigation into the migration behavior and routes of TME cells in paired primary-metastatic tumors would be of significant interest.
Utilizing unbiased approaches, we detailed the cellular heterogeneity within the TME and uncovered 3 major TME “ecosystems” and 6 ecotypes present at various stages of GAC progression. Genomically-independent, ecotype-based clustering effectively segregated samples, highlighting the evolutionary remodeling of TME compositions during GAC development and progression. Notably, two primary ecotypes−the immune-enriched EC3 and stroma-enriched EC6−were recurrently observed in primary GACs across multiple cohorts69–71. Our analysis revealed that the EC6-like ecotype was significantly associated with more aggressive histological, genomic, and molecular subtypes and worse prognosis compared with the EC3-like ecotype. While many published single-cell studies have focused on characterizing the heterogeneity of each individual cell compartment, our study integrates divergent cell ecotypes to elucidate their population relationships, cohabitation patterns, and cell interaction networks. This approach offers a valuable methodology that could potentially be applied to other cancer studies.
Interestingly, our fundings revealed that the EC3 and EC6 ecotypes strongly correlated with the two primary histological subtypes of GAC–the intestinal and diffuse types, supporting the notion that TME phenotypes may closely tie into GAC pathogenesis. Additionally, the robust correlation between the EC3/EC6 ecotypes and the GAC genotypes89, as well as the molecular subtypes70 combined with oncogenic attributes69, underscores the complexity of GAC carcinogenesis and progression is reliant on the intricate interplay between preneoplastic/neoplastic cells and the TME. To our knowledge, this study is the first to characterize cellular ecosystems and ecotypes, and their genomic correlates at single-cell resolution, across GAC devlopment and progression. This has advanced our understanding of TME heterogeneity and dynamics with greater granularity, and with further research, may facilitate potential therapeutic exploitations. As such, innovative technologies like spatially resolved transcriptomics, bioimaging, and approaches for characterizing physically interacting cells would complement and expand on the insights we have described.
Stromal components within the TME play crucial roles in tumor initiation, progression, and metastases90. Our study found that the prevalence of stromal cells negatively correlated with immune cells such as CD4+/CD8+ T and NK cells. In particular, GACs with stroma-rich EC6 ecotype often exhibited a paucity of these immune cells. Previous studies have demonstrated that CAFs can release immunosuppressive factors, like TGFβ, leading to T cell exclusion from the tumor core91,92. Our identification of numerous immune-regulatory genes within stromal cells, including TIGIT ligands NECTIN2 and PVR (CD155), SIRPA, NT5E (CD73), CD276 (B7-H3), CD200, and SDC2, might indicate the activation of multiple distinct immunosuppressive signaling pathways in the tumor stroma. To date, cancer treatment strategies have rarely focused on modulating stromal components, especially in GAC patients. Some of these genes have already been characterized as immune checkpoints or are emerging immunomodulatory therapeutic targets59,60. Importantly, our study has identified SDC2 as a potential target worthy of further investigation.
SDC2 overexpression in mesenchymal/cancer cells has been observed in epithelial origin-tumors, including breast, lung, pancreatic, colorectal, and gastric cancers, where SDC2 appears to promote the invasiveness and migration of cancer cells by activating and regulating various oncogenic signaling pathways93. However, the landscape of SDC2 expression across various TME cell types/states, along with their cellular interactions remains to be explored. Additionally, previous studies on GAC were limited by small cohort sizes94 and did not assess its prognostic significance. In this study, we discovered that SDC2 is primarily abundant in CAFs in both premalignant and malignant tissues. We confirmed this finding in independent cohorts across various solid tumor types at single-cell resolution. SDC2 overexpression was also validated at the protein level in tumor-associated stromal cells using several methods. Given our observations of high SDC2 expression in aggressive GAC phenotypes, advanced stages, and its strong association with unfavorable survival outcomes, it suggests a role in driving disease progression and serves as a potential biomarker of poor prognosis.
There is mounting evidence demonstrating that stromal and immune cells actively engage in crosstalk within the TME90. However, the impact of SDC2 upregulation on TME remains poorly understood. Previous studies have reported an upregulation of SDC2 in human CD4+ T cells during in vitro activation, where it inhibits T cell activation95. Our cell-cell interaction analysis shed light on its potential immunomodulatory roles. We noted increased crosstalk between SDC2+ stromal cell populations (vs. their SDC2− counterparts) and CD4+/CD8+ T and NK cells via TIGIT-NECTIN3, TGFB1-TGFBR3, EGFR-TGFB1, LGALS9-HAVCR2, and FAS-FASLG ligand-receptor interactions. These interactions are associated with various immunosuppressive signaling pathways96–99. Further in vivo functional studies using SCID models validated our hypothesis that SDC2 overexpression in CAFs promotes tumor growth. Collectively, these findings suggest that therapeutic targeting SDC2-overexpressing CAFs could be beneficial in GAC, with potential for broad application in solid tumors. However, our current results in the SCID model reflect the impact of SDC2 in the absence of an immune system. Thus, future research should focus on the role of SDC2 in immuno-competent models for GAC and other types of cancer.
Limitations of the study
First, although we collected a subset of the NAT, primary, and metastatic GAC from the same patients, the precancerous and cancer specimens were not matched, as they are extremely challenging to obtain clinically. Second, a comprehensive assessment of the GAC continuum would ideally require untreated samples. However, collecting treatment-naïve primary GACs from patients with PC is practically infeasible in a clinic setting. As most stage-IV GACs were exposed to treatment, the TME cell landscape we observed may be influenced by prior therapy. Further investigations in more refined patient cohorts are needed to better understand TME remodeling in various therapeutic contexts. Third, paired single-cell TCR/BCR-seq data was available for only a small subset of samples, limiting the integrative analysis of the TCR/BCR repertoire. Fourth, despite H. pylori infection being widely regarded as the strongest risk factor for GAC100–102, its relevance was not deeply explored in this study due to sample size limitations, and information on H. pylori treatment was not available. Fifth, our analysis mainly focused on PC; liver and ovarian metastases were not equally represented. Additionally, we could not study how genomic alterations might contribute to TME reprogramming due to a lack of genomic data. Lastly, the absence of tumor cells and spatial data may limit our ability to fully capture the interplay between cancer cells and the TME.
STAR METHODS
RESOURCE AVAILABILITY Lead contact
Further information and requests for resources and reagents should be directed to and will be fulfilled by the Lead Contact, Dr. Linghua Wang (LWang22@mdanderson.org).
Materials availability
This study did not generate any new unique reagents or models.
Data and code availability
The scRNA-seq data generated on samples of Cohort #1 can be downloaded from Gene Expression Omnibus database (GEO, https://www.ncbi.nlm.nih.gov/geo/) under the accession numbers GSE234129. The scRNA-seq data generated on PC ascites cells (Cohort #2) can be downloaded from EGA (European Genome-phenome Archive, https://ega-archive.org) via accession number EGAS00001004443. The raw scRNA-seq data for healthy PBMCs can be obtained from EGAS00001005019. The processed feature-barcode matrices generated on NAT, CAG, IM, primary GAC, and PBMC samples in the Cohort #325 were available from https://dna-discovery.stanford.edu. The raw scRNA-seq data generated on NGT, CAG, IM, and primary GAC in the Cohort #479 were available from Gene Expression Omnibus (GEO: GSE134520). The data can also be accessed through the online Single Cell Data Portal (https://singlecell.mdanderson.org/GastricTME), an interactive web-based tool we have developed for visualizing our scRNA-seq data. In addition, four public datasets can be obtained from NCI’s Genomic Data Commons (TCGA-STAD) and the Gene Expression Omnibus database (GEO, https://www.ncbi.nlm.nih.gov/geo/) under the accession numbers GSE6225425, GSE1545969, and GSE84437. All codes used for analysis and cell annotation are available from https://github.com/ruipwang/GastricTME/. The data that support the main findings of this study are provided in Tables S2–6, and additional information are also available from the corresponding author upon request.
EXPERIMENTAL MODEL AND STUDY PARTICIPANT DETAILS
Human specimens
This study follows the principles according to the Declaration of Helsinki, with written informed consents obtained from all patients before sample collection. A total of 68 samples collected from 41 patients and 2 healthy donors were included in this study (Table S1). Among them, 18 patients (Pt10–27) were enrolled and diagnosed at The University of Texas MD Anderson Cancer Center (MDACC) (Houston, USA). This study was approved by an Institutional Review Board (IRB) approved protocol (#LAB01–543). Independent review was conducted by experienced pathologists and radiologists to confirm disease diagnosis and samples collection (n = 20) was conducted under the approved IRB infrastructure as described in our recent study103. Six patients (Pt1–5, Pt9) were enrolled and diagnosed at Zhejiang Cancer Hospital (Hangzhou, China) and the study was approved by the ethics committee of the Cancer Hospital of the University of Chinese Academy of Sciences (Zhejiang Cancer Hospital). Diagnosis was confirmed by experienced gastrointestinal pathologists and radiologists and fresh biopsies (primary tumors, ovarian or liver metastases, n = 17) were obtained from each patient, with adjacent normal tissue or peripheral blood as controls. The primary tumor tissues and adjacent non-neoplastic tissues were collected by gastroscopy. The ascites samples were collected when patients required a therapeutic paracentesis and cells were isolated for scRNA-seq. The liver metastatic tissues were collected when patients required needle aspiration biopsy during the diagnostic procedure and the ovary metastatic tissues were collected when patients required cytoreductive surgery. None of these six patients were treated with chemotherapy or radiotherapy prior to sample collection. The remaining 31 samples from 17 patients were from two published studies25,79. Based on the Lauren’s classification, 6 out of 14 primary tumors were intestinal type, 3 were diffuse type, and 2 were mixed type. Lauren’s classification for the rest 3 primary tumors were not available. The detailed information is summarized in Table S1.
For the SDC2 validation cohort (n = 388), primary tumor tissues were collected from a total of 388 patients underwent total or subtotal gastrectomy with lymphadenectomy between January 2009 and December 2014 in the Department of Surgical Oncology of the first affiliated hospital of China Medical University. None of these patients had received chemotherapy of radiotherapy prior to surgical procedure. We received written informed consent from all patients, and the study was approved by the ethics committee of China Medical University. The detailed postoperative pathological diagnosis reports were gained and included age, sex, tumor size, differentiation status, Lauren’s type, invasion depth, lymph node metastasis, distant organ metastasis, TNM stage. We used the TNM classification system for gastric carcinoma from the 8th AJCC staging manual. All the patients were followed up via telephone inquiry or questionnaires. And the follow-up time ranged from 2 to 80 months (median = 48 months).
Cell lines
The patient ascites cells (IP-039–1 for GF1026, and IP-024–1 for GF0818) were pelleted and washed twice with PBS and then resuspended in 80 μl of MACS buffer [1:20 diluted autoMACS rinsing solution (Miltenyi Biotech, Gaithersburg, MD. Cat#130–091-222) with PBS per 107 total cells. A 20 μl of human anti-fibroblast microbeads (Miltenyi, order no. 130–050-601) per 107 cells was mixed to the cells and incubated at room temperature for 30 min followed by washing once with MACS buffer. The cells were resuspended in 0.5ml of MACS buffer and applied to the separation column and magnetic separator. After washing with MACS buffer, the cells from microbeads were flushed out from the microbeads and cultured with DMEM. Cells were passed twice and followed by immortalization with lentiviral infection that express hTERT (pHIV7-CNPO-Tert) and SV40 large-T (pHIV7-CNPO-Tag) (a gift from Dr. Jiing-Kuan Yee, City of Hope). The immortalized CAF cells were authenticated and recharacterized in the cell line core facility of UT MD Anderson Cancer Center every 6 months. Western blot was used to confirm the expression of the fibroblast marker positives (aSMA and FAP), while epithelial marker EpCAM negative in these cells every 6 months. Cells were cultured in DMEM supplemented with 7% fetal bovine serum (FBS) and antibiotics (100 mg/mLstreptomycin and 100 IU/mL of penicillin).
Mice
All animal procedures were conducted under a peer-reviewed Institutional Animal Care and Use Committee (IACUC)-approved protocol (#00000232-RN03). The IACUC at MD Anderson Cancer Center (MDACC) approved all animal experiments in accordance with NIH guidelines. NOD.Cg-Prkdcscid/J (SCID) mice (The Jackson Laboratory, #001303) were bred and maintained in the North MDACC Mouse Facility in accordance with institutional requirements. Female SCID mice aged nine weeks were used in this study. The investigators did not perform any experiments blindly. Mice were monitored for signs of morbidity, which included excessive tumor volume (maximum size permitted by the IACUC), hunched posture, ruffled hair, weight loss, paralysis, dyspnea, inability to reach food and water, as well as lack of grooming. Mice exhibiting these signs prior to reaching the endpoints were euthanized.
METHOD DETAILS
Sample processing
For patients (Pt1–5, Pt9) in cohort #1, the fresh tissues were stored in the tissue storage solution (MACS Media) and dissociated into single cell suspensions for scRNA-seq. The ascites were spun down for 10 minutes at 1500 rpm, then pelleted cells were collected and stored in Bambanker (Nippon Genetics, no.392014681) for scRNA-seq. PBMCs were separated from peripheral blood according to standardized procedure. Red blood cells were lysed and singlets were counted by Trypan Blue Exclusion before loading on 10X Chromium microfluidic chips. All sample were processed using the same protocol and by the same research assistant. For patients (Pt10–27) in cohort #2, the details of sample processing were described in our recent study103.
scRNA-seq library preparation and sequencing
For Cohort #1 samples, scRNA-seq including single cell separation, complementary DNA (cDNA) amplification, and library construction was performed on the 10× Genomics Chromium Platform. Briefly, the single cell suspensions were counted using Countstar® Rigel S2 (Countstar) and loaded on a Chromium Controller to generate single-cell gel bead-in-emulsions (GEMs). The scRNA-seq libraries were constructed using the Chromium Single Cell 5ʹ Library & Gel Bead Kit (PN: 220112, 10× Genomics). The single-cell GEMs were used to generate 10× Barcoded cDNA through reverse-transcription PCR and the cDNA was purified using Dynabeads MyOne SILANE magnetic beads (PN: 2000048, 10× Genomics). The Amplification Master Mix kit (PN: 220125, 10× Genomics) was used for cDNA amplification, and the Beckman Coulter SPRIselect reagent was used for cDNA purification and target enrichment. The Agilent Bioanalyzer High Sensitivity kit was used for determination of concentrations of cDNA libraries as well as the quality control of libraries. 50 ng of each sample library in 20 uL were mixed with 30 uL Fragmentation Mix (PN: 220108, 220107/220130, 10× Genomics) for pooling. The barcoded libraries were sequenced on the NovaSeq 6000 (Illumina) platform using S2 flow cell (100 cycles) in a 26 (read 1) × 8 (index) × 91 (read 2) configuration. For Cohort #2 samples, the details of scRNA-seq library preparation and sequencing were described in our recent study103. For samples included in Cohorts #2, #3, and #4, the Chromium Single Cell 3′ Library & Gel Bead Kit v2 (PN-120237, 10x Genomics) were used to construct the scRNA-seq libraries as descripted in their original studies25,79,103.
Microsatellite instability (MSI) testing
Four patients in this study were reported as MSI (Table S1). And 18 patients in this study were reported as microsatellite stability (MSS). For Cohort #1, MSI testing was performed for all 6 patients. Among them, 3 patients were found as MSS and one patient was reported as MSI. Representative sections of the primary GACs from each patient were deparaffinized and dehydrated, washed in water, pretreated for heat-induced epitope retrieval in citrate buffer (pH = 6.0), and cooled for 10 min. Immunohistochemistry (IHC) staining with antibodies against hMLH1 (ZM-0154, ZSBG-BIO), hMSH2 (ZM-0622, ZSBG-BIO), hMSH6 (ZA-0541, ZSBG-BIO), and hPMS2 (ZA-0542, ZSBG-BIO) was performed. To interpret IHC staining, the non-neoplastic gastric mucosa was used as a control for MLH1, MSH2, MSH6, and PMS2 staining. When tumor nuclei stained positive with the same intensity as the control tissue, staining was regarded as positive. When more than 10% of tumor cells showed loss of expression or reduced expression of these markers, the tumor was regarded as negative for expression. Based on the IHC staining results, a negative expression of ≥1 of 4 mismatch Repair (MMR) proteins was considered as MSI. Positive expression of all of them was considered as MSS. For Cohort #2, 12 out of 18 patients were accessed for MSI using clinical assay or whole-exome sequencing (WES), and all 12 patients were reported as MSS. The details of MSI testing and analysis for Cohort #2 were described in our recent study103. Three patients from Cohort #3 were defined as MSS and 4 patients from Cohort #3 were defined as MSI as descripted in their original study25,79.
Multi-color immunofluorescence (mIF) staining
Human GAC tissue sections were immunostained overnight with Vimetin (SC6260, Santa Cruz,1:200) and SDC2 (710813, Invitrogen,1:200) followed by secondary antibodies. Slides were then mounted with DAPI-containing Vectashield Mounting Medium (Vector Laboratories) and visualized under the confocal laser scanning microscope.
SDC2 Immunohistochemistry (IHC) assay
FFPE tissue microarrays (TMAs) composed of primary GAC tissues from a total of 388 patients underwent total or subtotal gastrectomy were created. Tissue sections in 5-μm thickness were deparaffinized in xylene, followed by dehydration in an ethanol series. The slides were incubated in H2O2 for 15 min at room temperature and subjected to high temperature and high pressure for antigen retrieval, Tris-EDTA(PH = 9.0) were used as retrieval buffer. Subjected to dropwise addition of the corresponding primary antibody followed by incubation at 4 °C overnight, rinsed with phosphate buffered saline (PBS), and subjected to dropwise addition of secondary antibody, Avidin and Biotinylated HRP. A DAB solution was added to visualize the antibody binding, after which the sections were rinsed with distilled water, counterstained with haematoxylin, dehydrated with an ethanol gradient, and fixed with xylene and gelatin. Rabbit anti-human SDC2 polyclonal antibody (Cat. Ab205884) was purchased from Abcam, USA. A secondary rabbit antibody (Cat. BA5000) was purchased from Vector Laboratories, Inc. Avidin and Biotinylated HRP reagent (Cat. ZG0312) were purchased from Vector Laboratories, Inc.
Evaluation of IHC staining results
Two pathologists were blinded to patients’ outcomes independently interpreted the IHC staining results using a semi-quantitative scoring system. Immunostaining reactions were evaluated based on staining intensity (0 for no staining, 1 for weak staining, 2 for moderate staining, 3 for strong staining) and the percentage of the staining cells (0 for <5%, 1 for 6%~25%, 2 for 26%~50%, 3 for 51%~75%, and 4 for >76%). Then the score of staining intensity and the percentage of stained cells were multiplied to generate the immunoreactivity scores (IS). A cut-off value (0.5) was determined by a ROC curve. IS < 0.5 was defined as SDC2 low and IS > 0.5 was defined as SDC2 high.
SDC2 cDNA subcloing
Human SDC2 cDNA was amplified from GA0518 with high fidelity enzyme Q5 (New England Biolabs, Ipswich, MA) using primers hSDC2.F1.PacI and hSDC2.R1.NheI, and the PCR product was subcloned into pLoc.tGFP.3Flag.MCS1, which was modified from Horizon Discovery’s (Cambridge, UK) pLoc.tGFP vector. The resultant lentiviral plasmid was verified by sequencing, and was called pLoc.tGFP.3Flag.SDC2, in which SDC2 cDNA (stop codon removed) was fused with 3xFlag, the empty vector (EV) is pLoc.tGFP.3Flag.MCS1.
Lentiviral vector generation and transfection
HEK293T (ATCC, Manassas, VA) cells were grown in exponential growth condition before lentiviral transformation. Lentivirus of both SDC2 and EV were generated in HEK293 using 20ul JetPrime (Polyplus, France) together with packaging vector pCMV.Dr8.2 and envelope vector pCMV.VSV.G in a 5 ug: 5 ug: 0.5 ug ratio in a 10-cm plate, the supernatant was filtrated with 0.22um filter and then was used to transduce target CAF1026 cell line. The transduced cells were sorted by GFP marker in our institutional flow cytometry core, and the sorted cells were used for experiments and in vivo mouse studies.
Quantitative real time-PCR (qRT-PCR) analysis
Total RNA extraction: When each cell line growing in a 10-cm plate reaches 70–90% confluence, medium was aspired, cells were harvested using 1 ml Trizol (Ambion, Austin, TX) directly added into plates, after vortexing vigorously and incubation at room temperature for ~15min, 200 μl chloroform was added to each 1 ml Trizol, vortex vigorously again, and the mixture sit at room temperature for ~15 min. Spun the mixture at maximum speed (~15000 rpm) for 10 min, supernatant was transferred to a new tube, the supernatant was added 2 volumes of ethanol for one volume of clear supernatant, gently vortexed the tube, then the tube was spun at maximum speed (~15000 rpm) for ~10 min, a pellet was seen at the bottom, and gently washed with 70% ethanol, spun at maximum speed for ~5 min, supernatant was aspired, and air-dried. Re-dissolve the pellet with appropriate volume of 1x TE pH8.0 according to the size of the pellet. Total RNA concentration was measured in a Nandrop 1000 machine (Thermo Scientific, Wilmington, DE).
Reverse transcription and cDNA synthesis: We used NEB’s (Ipswich, MA) LunaScript RT SuperMix Kit (E3010), followed the manufacturer’s protocol. Briefly, in a 20 μl reaction, LunaScript RT SuperMix (5X) 4 μl was added to a tube with extracted total RNAs, up to 1μg, the 1st strand cDNA synthesis reaction goes on a PCR machine with primer annealing 25°C for 2 min, then followed by cDNA Synthesis for 55°C 30 min, and heat inactivation 95°C for 1 min. The reactions are diluted with H2O to 200 ul in total volume.
Quantitative real-time qPCR (qRT-PCR) for mRNA gene expression: For the qPCR reaction, a 20 μl total volume includes 10 μl (2x) of SYBR Green Supermix from ABI (Applied Biosystems, Carlsbad, CA) with addition of 2.5 μl of the above generated 1st strand cDNA, and PCR quantitation was performed on the Applied Biosystems’ (ABI, Waltham MA) QuantiStudio 3 machine. Thermocycles are set at 95 C for 2 min, followed by 30 cycles of 95C 10 sec, and 60C 30 sec. Analysis of expression uses GAPDH as the house keeping gene. Data are presented using Microsoft Excel or GraphPad Prism. Reference gene GAPDH primers and the target gene SDC2 primers104 are listed in the key resources table.
Key resources table
| REAGENT or RESOURCE | SOURCE | IDENTIFIER |
|---|---|---|
| Antibodies | ||
| Mouse monoclonal anti-Vimentin | Santa Cruz Biotechnology | Cat: SC6260, RRID:AB_628437 |
| Rabbit polyclonal anti-Syndecan 2 | Thermo Fisher Scientific | Cat: 710183, RRID:AB_2532608 |
| Rabbit anti-human SDC2 polyclonal antibody | Abcam, USA | Cat: Ab205884 |
| rabbit antibody | Vector Laboratories, Inc | Cat: BA5000 |
| Avidin and Biotinylated HRP reagent | Vector Laboratories, Inc | Cat: ZG0312 |
| Biological samples | ||
| GAC primary tumor samples | Zhejiang Cancer Hospital | See Table S1 for details |
| GAC metastatic tumor samples | MD Anderson Cancer Center | See Table S1 for details |
| Peripheral blood samples from GAC patients | Zhejiang Cancer Hospital | See Table S1 for details |
| Non-neoplastic adjacent tissues from GAC patients | Zhejiang Cancer Hospital | See Table S1 for details |
| Peripheral blood from healthy donors | Zhejiang Cancer Hospital | See Table S1 for details |
| Critical commercial assays | ||
| JetPRIME | Polyplus | Cat: 101000046 |
| SYBR Green Master Mix | Applied Biosystems | Cat: 4367659 |
| LunaScript RT SuperMix Kit | New England BioLabs | Cat: E3010 |
| TRIzol Reagent | Thermo Fisher Scientific | Cat: 15596018 |
| Quanto studio3 Real Time PCR system | Thermo Fisher Scientific | N/A |
| Deposited data | ||
| Data files for scRNA-seq (Cohort #1) (processed data) | This paper | GSE234129 |
| Data files for scRNA-seq (Cohort #2) (raw data) | This paper | EGAS00001004443;EGAS00001005019 (healthy PBMCs) |
| Expression matrix for scRNA-seq (Cohort #3) (processed data) | Sathe et al.25 | https://dna-discovery.stanford.edu |
| Expression matrix for scRNA-seq (Cohort #4) (raw data) | Zhang et al.79 | GSE134520 |
| Expression matrix for scRNA-seq (Validation cohort) (raw data) | Kumar et al.28 | GSE183904 |
| Expression matrix for bulk RNA sequencing (processed) | TCGA | https://gdc.cancer.gov |
| Expression matrix for microarray experiments (processed) | Cristescu et al.70 | GSE62254 |
| Expression matrix for microarray experiments (processed) | Ooi et al.69 | GSE15459 |
| Expression matrix for microarray experiments (processed) | Cheong et al. | GSE84437 |
| Experimental models: Cell lines | ||
| HEK293T | ATCC | CRL-1573 |
| GA0518 | Song et al.78 | N/A |
| GF0818 | This paper | N/A |
| GF1026 | This paper | N/A |
| Experimental models: Organisms/strains | ||
| Mouse: NOD.Cg-Prkdcscid/J | The Jackson Laboratory | Jax:001303 |
| Mouse: Xenogen IVIS200 | Perkin Elmer | #124262 |
| Oligonucleotides | ||
| Primers: hSDC2.mRNA.F: 5’ TGGAAACCACGACGCTGAATA 3’ hSDC2.mRNA.R: 5’ ATAACTCCACCAGCAATGACAG 3’ |
This paper | NM_002998 |
| hGAPDH-5: 5’ ACCCAGAAGACTGTGGATGG 3’ hGAPDH-3: 5’ TCTAGACGGCAGGTCAGGTC 3’ |
Mani et al.104 | N/A |
| hSDC2.F1.PacI 5’ ccTTAATTAAGCCGCGACCGTCATGCGGCG 3’ hSDC2.R1.NheI 5’ aaGCTAGCCGCATAAAACTCCTTAGTAGG 3’ |
This paper | NM_002998 |
| Recombinant DNA | ||
| SDC2–3xFlag fusion protein | This paper | NM_002998 |
| Plasmid: pLoc.tGFP | Horizon Discovery, Cambridge, UK | N/A |
| Plasmid: pLoc.tGFP.3Flag.SDC2 | This paper | N/A |
| Plasmid: pLoc.tGFP.3Flag.MCS1 | This paper | N/A |
| Plasmid: pHIV7-CNPO-Tert | Gift from Dr. Jiing-Kuan Yee, City of Hope | N/A |
| Plasmid: pHIV7-CNPO-TAg | Gift from Dr. Jiing-Kuan Yee, City of Hope | N/A |
| Software and algorithms | ||
| Cell Ranger 3.1.0 | 10x Genomics | https://10xgenomics.com/ |
| Seurat 3.1.1 | Butler et al.107 | https://satijalab.org/seurat/articles/get_started.html |
| Harmony 1.0 | Korsunsky et al.109 | https://portals.broadinstitute.org/harmony/articles/quickstart.html |
| Monocle3 0.2.0 | N/A | (http://cole-trapnell-lab.github.io/monocle-release/monocle3/ |
| Scrublet 0.2.1 | Wolock et al.111 | https://github.com/swolock/scrublet |
| kBET | Büttner et al.108 | https://github.com/theislab/kBET |
| GSVA 1.40.1 | Hänzelmann et al.113 | http://bioconductor.org/packages/release/bioc/html/GSVA.html |
| ROUGE | Liu et al.112 | https://github.com/PaulingLiu/ROGUE |
| R 4.0.0 | N/A | https://www.r-project.org |
| survcomp 1.6.0 | N/A | https://www.bioconductor.org/packages//2.10/bioc/html/survcomp.html |
| Survminer 0.4.9 | N/A | https://cran.r-project.org/web/packages/survminer/index.html |
| Survival 3.2–11 | N/A | https://cran.r-project.org/web/packages/survival/index.html |
| pheatmap 1.0.12 | N/A | https://cran.r-project.org/web/packages/pheatmap/ |
| BioRender | BioRender.com | https://www.biorender.com |
In-vivo tumorigenesis of SDC2-CAFs in mice
Nine-week-old SCID mice were randomly divided into 2 groups. Each group received a subcutaneous injection of GA0518-G2-mCh2 and CAFs, GF0818, suspended in 100 ul PBS into both lateral flanks of the mice. The ratio of tumor cells to CAFs was 2:1, and the number of GA0518-G2-mCh2 cells in each injection was 1×10⁶. Tumor size was measured twice per week using a digital caliper, and tumor volume was calculated with the formula: volume = (Width2 ×Length)/2. Tumor growth was also weekly monitored by bioluminescence imaging. D-luciferin, a substrate of luciferase (150 ug/kg) was injected via intraperitoneal injection in mice. 10 minutes after injection, the converted D-luciferin was measured in the value of emitted photons. Mice were sacrificed 4 weeks after injection. All the tumors were collected and weighted.
QUANTIFICATION AND STATISTICAL ANALYSIS
scRNA-seq data processing
The raw scRNA-seq data were pre-processed (demultiplex cellular barcodes, read alignment, and generation of gene count matrix) using Cell Ranger Single Cell Software Suite (version 3.1.0) provided by 10x Genomics. Detailed QC metrics were generated and evaluated, samples and cells were carefully and rigorously filtered to obtain high-quality data for downstream analyses. Multiple filters were applied using similar approaches as described in our recent studies103,105,106. Briefly, for basic quality filtering, cells with low complexity libraries (in which detected transcripts are aligned to less than 200 genes) were filtered out and excluded from subsequent analyses. This step aimed to remove cell debris, empty drops, and low-quality cells. Likely dying or apoptotic cells where >15% of transcripts derived from the mitochondria were also excluded. We further removed the outliers, cells with >6,500 genes expressed (the top 1%) in the distribution of gene detected per cell. Following the initial clustering, we removed likely cell doublets and multiplets (see Doublet detection and removal). In addition, genes expression in fewer than 3 cells were removed from the expression matrix. Library size normalization was then performed in Seurat107 on the filtered gene-cell matrix to obtain the normalized UMI count.
Batch effect evaluation and correction
Statistical assessment of possible batch effects was performed using the R package k-BET (a robust and sensitive k-nearest neighbor batch-effect test)108. k-BET was run on cells from all samples, and on major lymphoid cell types including CD4 T cells, CD8 T cells, myeloid cells, B cells, and stromal cells separately with default parameters. Each cell type was down sampled to 500 cells, and the k input value was chosen ranging from 1% to 100% of the sample size. In each run, the number of tested neighborhoods was 10% of the sample size. The mean and maximum rejection rates were then calculated based on a total of 100 repeated k-BET runs. Following estimation of sample processing- or sequencing-related batch effects using k-BET, we employed Harmony109 for actual batch effect correction. Harmony was run with default parameters to remove batch effects in the PCA space when clustering of major cell lineages (e.g., CD4+ T, CD8+ T, myeloid, B cells, plasma cells and stroma) before any clustering analysis or cell type identification/annotation was performed. We carefully evaluated the performance of Harmony in terms of its ability to integrate batches while maintaining cell type separation. Harmony was run on all cells to firstly identify major cell types. It was also run on each of the three major cell types (i.e., T cells, Myeloid cells, stromal cells) for subclustering analysis to further identify different cell states. Harmony results showed a clear separation of major cell lineages and known T cell subsets such as CD4 TREG, CD4 TFH, CD4+/CD8+ TN, CD4+/CD8+ TMEM, CD8+ TEX, pDC, cDC2 and 3 additional rare DC subpopulations including cDC1, LAMP3+ DC, proliferating DC, as well as the 4 types of stromal cell lineages indicates an excellent performance of batch effect correction in this study. To quantify the performance of Harmony, we further used k-BET and compared the rejection rate (reflecting batch effect) before and after Harmony. The data after Harmony showed a low rejection rate, indicating an excellent performance of batch effect correction in this study.
Moreover, we also applied the local inverse Simpson’s Index (LISI) to assess the performance of Harmony. As descried previously109, the ‘integration LISI’ (iLISI) measures the degree of mixing among datasets (batches), ranging from 1 in an unmixed space to the number of datasets (batches) in a well-mixed space. And the ‘cell-type LISI’ (cLISI) measures integration accuracy using the same formulation but computed on cell-type labels instead. An accurate embedding has a cLISI close to 1 for every neighborhood, reflecting separation of different cell types. Before batch correction with Harmony, cells were mainly grouped by dataset (iLISI is around 1) and cells from different cell types were mixed (cLISI is far from 1). After batch correction with Harmony, iLISI and cLISI were re-computed in the Harmony embedding. iLISI is around 3, indicating a high degree of mixing among different datasets, and cLISI is very close to 1, reflecting excellent separation of different cell types while remain the well-mixed space.
Unsupervised clustering
Seurat (version 3.1.0)107 was applied to the normalized gene-cell matrix to identify highly variable genes (HVGs) for unsupervised cell clustering. Principal component analysis (PCA) was performed on the top 2000 HVGs. The elbow plot was generated with the ElbowPlot function of Seurat and based on which, the number of significant principal components (PCs) were determined. The FindNeighbors function of Seurat was used to construct the Shared Nearest Neighbor (SNN) Graph, based on unsupervised clustering performed with Seurat function FindClusters. Different resolution parameters for unsupervised clustering were then examined, and cluster marker genes were checked to determine the optimal number of clusters with distinct transcriptional profiles. For visualization, the dimensionality was further reduced using Uniform Manifold Approximation and Projection (UMAP) method110 with Seurat function RunUMAP. The PCs used to calculate the embedding were the same as those used for clustering.
We performed sub-clustering analysis of CD4+ T cells and CD8+ T cells with and without TCR genes and compared the results. We computed Ro/e (See Quantification of tissue enrichment) to quantify the correlation between without-TCR-clustering and with-TCR-clustering derived cell clusters. If Ro/e > 1, it suggested that cells of a without-TCR clustering were more frequently observed than random expectations in a specific with-TCR cluster, i.e., enriched. If Ro/e < 1, it suggested that cells of a without-TCR -clustering were observed with less frequency than random expectations in a specific with-TCR clustering. Overall, we observed a high degree of consistency between the two clustering approaches (Table S7).
Doublet detection and removal
Likely doublets or multiplets were identified and carefully removed through a multi-step approach as described in our recent studies103,105,106. Briefly, doublets or multiplets were identified by the following methods: 1) library complexity: cells with high-complexity libraries in which detected transcripts are aligned to > 6500 genes (the top 1% outliers) were removed. 2) Cluster distribution and marker gene expression: some doublets or multiplets can form distinct clusters with hybrid expression features and exhibit an aberrantly high gene count. We carefully reviewed cluster marker genes, and also checked the expression levels and proportions of canonical lineage-related marker genes in each Seurat identified cluster.
Clusters co-expressing discrepant lineage markers (e.g., cells in the T-cell cluster showed expression of epithelial cell markers; cells in the B cell cluster showed expression of T or myeloid cell lineage markers) were identified and removed. 3) Doublet detection algorithms: we applied Scrublet111, an algorithm to predict doublets in scRNA-seq data, to further clean doublets. The proportion of expected doublets were based on the number of cells used for scRNA-seq library construction. Scrublet predicted doublets were carefully checked before they were removed. 4) Cluster marker gene expression: some doublets or multiplets do not form separate cell clusters, instead they can spread all over the place on the UMAP plots. To further identify and clean doublets that could have been missed in the above steps, we generated UMAP plots and carefully reviewed canonical marker genes expression in defined cell clusters. Cells co-expressing discrepant lineage-specific markers were further cleaned. The above steps 2) and 4) were repeated to ensure that we have filtered out majority of barcodes associated with cell doublets. After doublets removal, a total of 77,392 cells were retained for downstream analyses.
Differential gene expression (DEG) analysis
Differentially expressed genes (DEGs) were identified for each cluster using the FindMarkers function in Seurat R package107 and DEGs were filtered with the following criteria: the gene should expressed in 20% or more cells in the more abundant group; expression fold change >1.5; and FDR q-value <0.05. The top 30 DEGs for each cluster of the major cell type/lineage including CD4+ T, CD8+ T, B/plasma, myeloid, and stromal cells were provided in Table S2.
Cell type and state identification
Cell type identification was performed on Harmony-defined clusters following batch effect correction. Two rounds of unsupervised clustering analysis (clustering and subclustering) were performed to first identify major cell types (e.g., CD4+ T cells, CD8+ T cells, innate T cells), and then distinguish cell transcriptional states within CD4+ T cells, CD8+ T cells, innate T cells, respectively. In both rounds, 30-nearest neighbors of each cell were determined based on 30 PCs to construct shared nearest neighbor (SNN) graphs. To annotate the cell type and state, differentially expressed genes (DEGs) were identified for each cell cluster using the FindAllMarkers function in the Seurat R package, and the top 30 most significant DEGs were reviewed. In parallel, feature plots and bubble plots were generated for the top 30 DEGs as well as a curated list of canonical immune cell markers and gene signatures, as described in previous reports38,48,55,106, and these results were carefully reviewed by our team including two T-cell immunologists (Y.L. and C.Y.). T cell states were then inferred, and annotations were added to each cluster based on integrated information from the top-ranked DEGs, the expression of canonical marker genes and signatures. To determine whether cells are overclustered, we checked for each cell type if multiple subclusters represent the same cell state without showing any unique features. To determine whether cells are underclustered, we quantified the cellular transcriptional heterogeneity of each cluster using ROUGE112, an entropy-based metric for assessing the purity of single cell populations and subclustering analysis was performed for low-purity clusters suggested by ROUGE. We employed an independent scRNA-seq cohort GSE18390428 to validate the cell types we identified in our datasets by FindTransferAnchors and MapQuery functions in Seurat.
Signature score analysis
To infer the functional states of myeloid and fibroblast cell subsets, we collected a list of curated gene signatures including the M1, M2, angiogenesis, and phagocytosis-associated gene signatures obtained from a recent study by Cheng et al48, as well as the normal-like, iCAF, IFNγ-iCAF, myCAF, wound healing-myCAF, ecm-myCAF, and TGFβ-myCAF gene signatures defined by Kieffer et al55. In addition, we also included the cancer hallmark gene sets for glycolysis, oxidative phosphorylation (OXPHOS), antigen presenting (APC) pathways downloaded from the Molecular Signature Database (MSigDB, http://software.broadinstitute.org/gsea/msigdb/index.jsp). The signature scores of these genes signatures and pathways in cells of each myeloid and fibroblast cell subsets were calculated using the ssgsea method in GSVA software package113, similarly as described in our recent studies103,106.
Quantification of tissue enrichment
The immune and stromal cell subsets exhibited different tissue preferences. To quantify the tissue enrichment of each TME cell subsets and determine whether cells of a certain cluster are enriched or depleted in a specific tissue, we calculated the ratio of observed to expected cell numbers in each cluster across different tissues using the same approach as described in recent studies103,114. For a given cell cluster, Ro/e > 1 suggests that cells of this cluster are more frequently observed than random expectations in a specific tissue (i.e., enriched), and Ro/e < 1 indicates that cells of this cluster are observed with less frequency than random expectations in a specific tissue (i.e., depleted).
Single-cell trajectory inference
To interrogate and constrict the differentiation trajectory of identified CD8+ T cell subsets, we applied the Monocle3 (version 0.2.0) algorithm47 to 9 CD8+ T cell subsets. We excluded the unconventional CD8+ T cell subset, MAIT cells (C5), from trajectory analysis. The filtered gene-cell count matrix was normalized and preprocessed using preprocess_cds. Batch effects were corrected using function align_cds. UMAP dimensionality reduction was performed on the ‘aligned’ matrix using function reduce_dimension with default parameters. The function cluster_cells and plot_cells were used for unsupervised clustering and visualization of the Monocle clustering results. The function learn_graph was run with default parameters and the CD8+ TN cell cluster was designed as the root to build the CD8+ T cell trajectory.
Quantification of cell similarities
For cells of a certain cell type/state found in PC samples, to infer their likely origins, i.e., whether they were transcriptomically more similar to the corresponding cell type/state of the PBMCs or primary GACs, we performed transcriptome similarity analysis to quantify their transcriptome similarities across different tissues, using same approach as previously described in single-cell analysis of hepatocellular carcinoma51. Briefly, in this study, transcriptome similarity analysis was focused on T and myeloid cell subsets that were abundant in PC samples and their similarities with corresponding cell types/states from primary GACs and PBMCs were examined. First, we obtained the low-dimensional PC space using function Embeddings with parameter reduction = ‘harmony’. For each cell detected in the PC samples, we queried for its nearest neighbor using the R function queryKNN() among cells of primary GACs and PBMCs in the low-dimensional space spanned by the top 50 PCs. The potential origin of each cell was then inferred by the tissue origin of its nearest neighbor cell. To determine the statistical significance of tissue origin for each cell type in PC samples, we performed permutation test by randomly shuffling the tissue labels (primary GACs or PBMCs) for all the nearest neighbor cells 1,000 times as previously described51.
Hierarchical relationships among TME subsets
To examine the transcriptome similarity and phenotypic relationships among these 62 TME subsets identified in this study, we performed unsupervised hierarchical cluster analysis. The dendrogram was drawn based on computed Pearson correlation coefficients with average PCA space (Seurat function RunPCA) for each subset using the R package denextend.
Identification of cell ecotypes
To examine how these different immune and stromal cell subpopulations in the TME form cohesive cellular “ecosystems”, we perform unsupervised analysis to infer cellular relationships and their co-association patterns. First, we calculated the cellular fractions of these 61 TME cell populations (except one ambiguous cell state “DNT”) in each of the 58 samples that had ≥ 150 cells and quantified their cellular compositions. We then computed the relative cellular abundance of these TME subsets by scaling the sample-cell proportion matrix by cell type/state (Tables S4–5). Unsupervised hierarchical clustering analysis was then performed on the scaled sample-cell proportion matrix to infer their co-existence patterns across these 58 samples from 5 different tissue groups. The 3 unique cellular ecosystems (i.e., EC1/EC2, EC3/EC4, EC5/EC6) were 3 major branches of the dendrogram from hierarchical clustering analysis, and the 3 cell ecosystems were further split into 6 distinct cellular ecotypes (i.e., EC1–6) based on their tissue distribution. To validate the cellular co-habitation patterns of each defined cellular ecotype using independent approaches, we employed Jaccard similarity index, which is a measure of set (here refers to cell subset) co-existence. It defines two sets (cell subsets A and B) as the ratio of the size of their intersection (samples had both subsets A and B >0.5 in terms of the relative cellular abundance) over the size of their union (all samples had either subset A or B >0.5) (see the equation below):
For each cellular subset, sample with its relative cellular abundance > 0.5 was represented as the set Pi = {c1, c2, …cn}. The Jaccard index was computed between a pair of cellular subsets A and B as J(A, B).
Bulk RNA-seq data analysis
To validate the presence of EC3-like and EC6-like ecotypes in primary GACs in large-scale primary GAC cohorts with available expression and clinical data, we perform ecotypes deconvolution analysis using bulk RNA sequencing (RNA-seq) datasets. We downloaded the normalized bulk RNA-seq data generated by The Cancer Genome Atlas (TCGA) on primary stomach adenocarcinoma (STAD) from NCI Cancer Genomic Data Commons (NCI-GDC: https://gdc.cancer.gov). The RNA-seq data was processed and normalized by the NCI-GDC bioinformatics team using their transcriptome analysis pipeline. The clinical annotation of TCGA-STAD cohort and molecular subtypes defined by TCGA analysis working groups were downloaded from a recent PanCanAtlas study89. In addition, we downloaded 3 additional large-scale primary GAC datasets (GSE62254, GSE15459 GSE84437) from the Gene Expression Omnibus database (GEO, https://www.ncbi.nlm.nih.gov/geo/) (see KEY RESOURCES TABLE and Data and code availability). The raw gene expression values from microarray experiments were preprocessed (background corrected and log2 transformed) and quantile normalized using the Robust Multi-array Average (RMA) algorithm115. For each sample, the expression measurements of all probes corresponding to the same Gene ID were averaged to obtain a single measurement. For datasets GSE62254 and GSE15459, the clinical, histopathological and survival data as well as molecular subtypes defined by their original studies69,70,116 were downloaded and used for correlation analysis.
In order to assign phenotypes, we first constructed a cell type-specific gene expression signature matrix for TME cell populations using the CIBERSORTx web portal (https://cibersortx.stanford.edu/runcibersortx.php)117 selecting the “Create Signature Matrix” module. The top 30 DEGs for each scRNA-seq defined cell cluster were used as the input. Next, we employed the “Impute Cell Fractions” module of CIBERSORTx to infer the abundance of TME cell populations in bulk RNA-seq data with default parameters (B-mode batch correction). We then performed unsupervised hierarchical clustering analysis to identify EC3-like and EC6-like groups. The cutoff was determined by silhouette score.
Statistical analyses
In addition to the algorithms described above, all other basic statistical analysis was performed in the R statistical environment (v4.0.0). One-way Kruskal-Wallis rank sum test was used to compare the cell proportions across different tissue groups. The two-sided Wilcoxon rank sum test was used to compare the cell proportions of a certain cell type (among all TME cells or cells of a major compartment) between two tissue groups and paired two-sided Wilcoxon rank sum test was used for paired comparisons among matched samples from the same patients. Wilcoxon rank sum test was also used to compare other continuous variables such as gene expression levels. When comparing the cellular proportions of major cell types (Figure 1), samples with ≥ 200 cells were included in the analyses, and when comparing the cellular proportions of cell subtypes/states, samples with ≥ 50 cells were included in the analyses. The Spearman’s correlation coefficient was calculated to assess the association between two continuous variables (e.g., the cellular proportions) at sample level. The correlation matrix in Figure 4B was computed using the cor function from the R package ‘spearman’. Samples with ≥ 200 cells were included in the analysis. Two-sided Fisher’s exact test was used to examine the relationships between the two cellular ecotypes and the Lauren’s histology types as well as previously defined molecular subtypes.
For survival analysis including overall survival (OS), we used the log-rank test to calculate P values between groups, and the Kaplan-Meier method to plot survival curves. For the TCGA dataset, the clinical annotation and the times calculated for OS were downloaded from the PanCanAtlas study89. For other large-scale primary GAC datasets downloaded from GEO, the OS was downloaded from their corresponding published studies. The hazard ratios were calculated using the multivariate Cox proportional hazards model. The prognostic significance of clinical and pathologic characteristics was determined using univariate Cox regression analysis. To assess the presence of possible confounding variables, a Cox regression model for multivariate analysis was applied for factors that achieved significance in univariate analysis.
All statistical significance testing in this study was two sided. To control for multiple hypothesis testing, we applied the Benjamini-Hochberg method to correct P values and the false discovery rates (FDR q-values) were calculated. Results were considered statistically significant at P value or FDR q-value < 0.05.
Supplementary Material
Table S1. Data summary of subjects in this study. Related to Figure 1.
Table S4. Relative abundance of each of the 61 cell populations across 58 samples. Related to Figure 5.
Table S5. Absolute abundance of each of the 61 cell populations across 58 samples. Related to Figure 5.
Table S6. Jaccard index of relative cellular abundance among 58 Samples. Related to Figure 5.
Table S7. Chi-squared tests showing the distribution of clustering with TCR genes across clustering without TCR genes in CD4+ and CD8+ T cells. Related to STAR Methods.
Highlights.
Extensive TME remodeling and altered TME ecotypes occur as GAC progresses
Plasma cells, primarily IgA+ plasma cells, are abundant in precancerous lesions
Two ecotypes in GAC correlate with histological, genomic and clinical features
SDC2 overexpression in CAFs correlates with aggressive phenotypes and poor survival
ACKNOWLEDGEMENTS
We appreciate all the patients who generously provided their samples for this research. L.W. was supported in part by the NIH/NCI grant R01CA266280, the start-up research fund, and the University Cancer Foundation via the Institutional Research Grant (IRG) Program at the University of Texas MD Anderson Cancer Center, and the Andrew Sabin Family Foundation Fellowship. J.A.A. acknowledges support from the DOD team grant (CA160445), the Stupid Strong Foundation, the Schecter Private Foundation, the Rivercreek Foundation, the V Foundation, John Armstrong Fund, Golfers Against Cancer, Zeus Immunology Research Fund, the Kevin Fund, Myer Fund, Dio Fund, and Milrod Fund, as well as the Caporella, Dallas, Sultan, Park, Smith, Frazier, Oaks, Vanstekelenberg, Planjery, McNeil, Moran, Hyland, Weede, and Cantu families. This study was also supported by the NCI P50 core grant CA016672.
Footnotes
Publisher's Disclaimer: This is a PDF file of an unedited manuscript that has been accepted for publication. As a service to our customers we are providing this early version of the manuscript. The manuscript will undergo copyediting, typesetting, and review of the resulting proof before it is published in its final form. Please note that during the production process errors may be discovered which could affect the content, and all legal disclaimers that apply to the journal pertain.
DECLARATION OF INTERESTS
The authors declare no competing interests.
REFERENCES
- 1.Bray F, Ferlay J, Soerjomataram I, Siegel RL, Torre LA, and Jemal A (2018). Global cancer statistics 2018: GLOBOCAN estimates of incidence and mortality worldwide for 36 cancers in 185 countries. CA Cancer J Clin 68, 394–424. 10.3322/caac.21492. [DOI] [PubMed] [Google Scholar]
- 2.Tan HL, Chia CS, Tan GHC, Choo SP, Tai DWM, Chua CWL, Ng MCH, Soo KC, and Teo MCC (2019). Metastatic gastric cancer: Does the site of metastasis make a difference? Asia-Pacific Journal of Clinical Oncology 15, 10–17. [DOI] [PubMed] [Google Scholar]
- 3.Sugarbaker PH (2019). Prevention and treatment of peritoneal metastases: a comprehensive review. Indian Journal of Surgical Oncology 10, 3–23. [DOI] [PMC free article] [PubMed] [Google Scholar]
- 4.Hirao M, Yamada T, Michida T, Nishikawa K, Hamakawa T, Mita E, Mano M, and Sekimoto M (2018). Peritoneal seeding after gastric perforation during endoscopic submucosal dissection for gastric cancer. Digestive surgery 35, 457–460. [DOI] [PubMed] [Google Scholar]
- 5.Yoshida M, Sugino T, Kusafuka K, Nakajima T, Makuuchi R, Tokunaga M, Tanizawa Y, Bando E, Kawamura T, and Terashima M (2016). Peritoneal dissemination in early gastric cancer: importance of the lymphatic route. Virchows Archiv 469, 155–161. [DOI] [PubMed] [Google Scholar]
- 6.Sugarbaker PH (2018). Peritoneal metastases from gastrointestinal cancer. Current oncology reports 20, 62. [DOI] [PubMed] [Google Scholar]
- 7.Gill RS, Al-Adra DP, Nagendran J, Campbell S, Shi X, Haase E, and Schiller D (2011). Treatment of gastric cancer with peritoneal carcinomatosis by cytoreductive surgery and HIPEC: a systematic review of survival, mortality, and morbidity. Journal of surgical oncology 104, 692–698. [DOI] [PubMed] [Google Scholar]
- 8.Shitara K, Bang YJ, Iwasa S, Sugimoto N, Ryu MH, Sakai D, Chung HC, Kawakami H, Yabusaki H, Lee J, et al. (2020). Trastuzumab Deruxtecan in Previously Treated HER2-Positive Gastric Cancer. N Engl J Med 382, 2419–2430. 10.1056/NEJMoa2004413. [DOI] [PubMed] [Google Scholar]
- 9.Janjigian YY, Kawazoe A, Yanez P, Li N, Lonardi S, Kolesnik O, Barajas O, Bai Y, Shen L, Tang Y, et al. (2021). The KEYNOTE-811 trial of dual PD-1 and HER2 blockade in HER2-positive gastric cancer. Nature 600, 727–730. 10.1038/s41586-021-04161-3. [DOI] [PMC free article] [PubMed] [Google Scholar]
- 10.Janjigian YY, Shitara K, Moehler M, Garrido M, Salman P, Shen L, Wyrwicz L, Yamaguchi K, Skoczylas T, Campos Bragagnoli A, et al. (2021). First-line nivolumab plus chemotherapy versus chemotherapy alone for advanced gastric, gastro-oesophageal junction, and oesophageal adenocarcinoma (CheckMate 649): a randomised, open-label, phase 3 trial. Lancet 398, 27–40. 10.1016/S0140-6736(21)00797-2. [DOI] [PMC free article] [PubMed] [Google Scholar]
- 11.Davidson S, Efremova M, Riedel A, Mahata B, Pramanik J, Huuhtanen J, Kar G, Vento-Tormo R, Hagai T, Chen X, et al. (2020). Single-Cell RNA Sequencing Reveals a Dynamic Stromal Niche That Supports Tumor Growth. Cell Rep 31, 107628. 10.1016/j.celrep.2020.107628. [DOI] [PMC free article] [PubMed] [Google Scholar]
- 12.Maman S, and Witz IP (2018). A history of exploring cancer in context. Nat Rev Cancer 18, 359–376. 10.1038/s41568-018-0006-7. [DOI] [PubMed] [Google Scholar]
- 13.Spranger S, and Gajewski TF (2018). Impact of oncogenic pathways on evasion of antitumour immune responses. Nat Rev Cancer 18, 139–147. 10.1038/nrc.2017.117. [DOI] [PMC free article] [PubMed] [Google Scholar]
- 14.Zhang Y, and Zhang Z (2020). The history and advances in cancer immunotherapy: understanding the characteristics of tumor-infiltrating immune cells and their therapeutic implications. Cell Mol Immunol 17, 807–821. 10.1038/s41423-020-0488-6. [DOI] [PMC free article] [PubMed] [Google Scholar]
- 15.Cho SY, Park JW, Liu Y, Park YS, Kim JH, Yang H, Um H, Ko WR, Lee BI, and Kwon SY (2017). Sporadic early-onset diffuse gastric cancers have high frequency of somatic CDH1 alterations, but low frequency of somatic RHOA mutations compared with late-onset cancers. Gastroenterology 153, 536–549. e526. [DOI] [PMC free article] [PubMed] [Google Scholar]
- 16.Choi J-H, Kim Y-B, Ahn JM, Kim MJ, Bae WJ, Han S-U, Woo HG, and Lee D (2018). Identification of genomic aberrations associated with lymph node metastasis in diffuse-type gastric cancer. Experimental & molecular medicine 50, 1–11. [DOI] [PMC free article] [PubMed] [Google Scholar]
- 17.Kakiuchi M, Nishizawa T, Ueda H, Gotoh K, Tanaka A, Hayashi A, Yamamoto S, Tatsuno K, Katoh H, and Watanabe Y (2014). Recurrent gain-of-function mutations of RHOA in diffuse-type gastric carcinoma. Nature genetics 46, 583–587. [DOI] [PubMed] [Google Scholar]
- 18.Nishizawa T, Nakano K, Harada A, Kakiuchi M, Funahashi S-I, Suzuki M, Ishikawa S, and Aburatani H (2018). DGC-specific RHOA mutations maintained cancer cell survival and promoted cell migration via ROCK inactivation. Oncotarget 9, 23198. [DOI] [PMC free article] [PubMed] [Google Scholar]
- 19.Wang K, Yuen ST, Xu J, Lee SP, Yan HH, Shi ST, Siu HC, Deng S, Chu KM, and Law S (2014). Whole-genome sequencing and comprehensive molecular profiling identify new driver mutations in gastric cancer. Nature genetics 46, 573–582. [DOI] [PubMed] [Google Scholar]
- 20.Hao D, He S, Harada K, Pizzi MP, Lu Y, Guan P, Chen L, Wang R, Zhang S, and Sewastjanow-Silva M (2020). Integrated genomic profiling and modelling for risk stratification in patients with advanced oesophagogastric adenocarcinoma. Gut. [DOI] [PMC free article] [PubMed] [Google Scholar]
- 21.Zeng D, Li M, Zhou R, Zhang J, Sun H, Shi M, Bin J, Liao Y, Rao J, and Liao W (2019). Tumor Microenvironment Characterization in Gastric Cancer Identifies Prognostic and Immunotherapeutically Relevant Gene Signatures. Cancer Immunol Res 7, 737–750. 10.1158/2326-6066.CIR-18-0436. [DOI] [PubMed] [Google Scholar]
- 22.Ren Q, Zhu P, Zhang H, Ye T, Liu D, Gong Z, and Xia X (2020). Identification and validation of stromal-tumor microenvironment-based subtypes tightly associated with PD-1/PD-L1 immunotherapy and outcomes in patients with gastric cancer. Cancer Cell Int 20, 92. 10.1186/s12935-020-01173-3. [DOI] [PMC free article] [PubMed] [Google Scholar]
- 23.Li Z, Gao X, Peng X, May Chen MJ, Li Z, Wei B, Wen X, Wei B, Dong Y, Bu Z, et al. (2020). Multi-omics characterization of molecular features of gastric cancer correlated with response to neoadjuvant chemotherapy. Sci Adv 6, eaay4211. 10.1126/sciadv.aay4211. [DOI] [PMC free article] [PubMed] [Google Scholar]
- 24.Hirata Y, Noorani A, Song S, Wang L, and Ajani JA (2023). Early stage gastric adenocarcinoma: clinical and molecular landscapes. Nat Rev Clin Oncol. 10.1038/s41571-023-00767-w. [DOI] [PMC free article] [PubMed] [Google Scholar]
- 25.Sathe A, Grimes SM, Lau BT, Chen J, Suarez C, Huang RJ, Poultsides G, and Ji HP (2020). Single-Cell Genomic Characterization Reveals the Cellular Reprogramming of the Gastric Tumor Microenvironment. Clin Cancer Res 26, 2640–2653. 10.1158/1078-0432.CCR-193231. [DOI] [PMC free article] [PubMed] [Google Scholar]
- 26.Fu K, Hui B, Wang Q, Lu C, Shi W, Zhang Z, Rong D, Zhang B, Tian Z, Tang W, et al. (2020). Single-cell RNA sequencing of immune cells in gastric cancer patients. Aging (Albany NY) 12, 2747–2763. 10.18632/aging.102774. [DOI] [PMC free article] [PubMed] [Google Scholar]
- 27.Lee HK, Ang KS, Chevrier M, Goh M, Ling J, Koh V, Zhang X, Tan JC, Lee N, Erdal Irac S, et al. (2020). Single cell RNA-seq reveals immunosuppressive gastric stem-like cancer cells as a poor prognostic factor. bioRxiv, 2020.2010.2023.351726. 10.1101/2020.10.23.351726. [DOI] [Google Scholar]
- 28.Kumar V, Ramnarayanan K, Sundar R, Padmanabhan N, Srivastava S, Koiwa M, Yasuda T, Koh V, Huang KK, Tay ST, et al. (2022). Single-Cell Atlas of Lineage States, Tumor Microenvironment, and Subtype-Specific Expression Programs in Gastric Cancer. Cancer Discov 12, 670–691. 10.1158/2159-8290.CD-21-0683. [DOI] [PMC free article] [PubMed] [Google Scholar]
- 29.Jerby-Arnon L, Shah P, Cuoco MS, Rodman C, Su MJ, Melms JC, Leeson R, Kanodia A, Mei S, Lin JR, et al. (2018). A Cancer Cell Program Promotes T Cell Exclusion and Resistance to Checkpoint Blockade. Cell 175, 984–997 e924. 10.1016/j.cell.2018.09.006. [DOI] [PMC free article] [PubMed] [Google Scholar]
- 30.Zullo A, Hassan C, Romiti A, Giusto M, Guerriero C, Lorenzetti R, Campo SM, and Tomao S (2012). Follow-up of intestinal metaplasia in the stomach: When, how and why. World J Gastrointest Oncol 4, 30–36. 10.4251/wjgo.v4.i3.30. [DOI] [PMC free article] [PubMed] [Google Scholar]
- 31.Mukai K, Tsai M, Saito H, and Galli SJ (2018). Mast cells as sources of cytokines, chemokines, and growth factors. Immunol Rev 282, 121–150. 10.1111/imr.12634. [DOI] [PMC free article] [PubMed] [Google Scholar]
- 32.Weatherly K, Bettonville M, Torres D, Kohler A, Goriely S, and Braun MY (2015). Functional profile of S100A4-deficient T cells. Immun Inflamm Dis 3, 431–444. 10.1002/iid3.85. [DOI] [PMC free article] [PubMed] [Google Scholar]
- 33.Ciucci T, Vacchio MS, Gao Y, Tomassoni Ardori F, Candia J, Mehta M, Zhao Y, Tran B, Pepper M, Tessarollo L, et al. (2019). The Emergence and Functional Fitness of Memory CD4(+) T Cells Require the Transcription Factor Thpok. Immunity 50, 91–105 e104. 10.1016/j.immuni.2018.12.019. [DOI] [PMC free article] [PubMed] [Google Scholar]
- 34.Fergusson JR, Fleming VM, and Klenerman P (2011). CD161-expressing human T cells. Front Immunol 2, 36. 10.3389/fimmu.2011.00036. [DOI] [PMC free article] [PubMed] [Google Scholar]
- 35.Chu Y, Dai E, Li Y, Han G, Pei G, Ingram DR, Thakkar K, Qin JJ, Dang M, Le X, et al. (2023). Pan-cancer T cell atlas links a cellular stress response state to immunotherapy resistance. Nat Med. 10.1038/s41591-023-02371-y. [DOI] [PMC free article] [PubMed] [Google Scholar]
- 36.Wang Y, Wang R, Zhang S, Song S, Jiang C, Han G, Wang M, Ajani J, Futreal A, and Wang L (2019). iTALK: an R package to characterize and illustrate intercellular communication. BioRxiv, 507871. [Google Scholar]
- 37.Zheng L, Qin S, Si W, Wang A, Xing B, Gao R, Ren X, Wang L, Wu X, Zhang J, et al. (2021). Pan-cancer single-cell landscape of tumor-infiltrating T cells. Science 374, abe6474. 10.1126/science.abe6474. [DOI] [PubMed] [Google Scholar]
- 38.Guo X, Zhang Y, Zheng L, Zheng C, Song J, Zhang Q, Kang B, Liu Z, Jin L, Xing R, et al. (2018). Global characterization of T cells in non-small-cell lung cancer by single-cell sequencing. Nat Med 24, 978–985. 10.1038/s41591-018-0045-3. [DOI] [PubMed] [Google Scholar]
- 39.Blank CU, Haining WN, Held W, Hogan PG, Kallies A, Lugli E, Lynn RC, Philip M, Rao A, Restifo NP, et al. (2019). Defining ‘T cell exhaustion’. Nat Rev Immunol 19, 665–674. 10.1038/s41577-019-0221-9. [DOI] [PMC free article] [PubMed] [Google Scholar]
- 40.Scott AC, Dundar F, Zumbo P, Chandran SS, Klebanoff CA, Shakiba M, Trivedi P, Menocal L, Appleby H, Camara S, et al. (2019). TOX is a critical regulator of tumour-specific T cell differentiation. Nature 571, 270–274. 10.1038/s41586-019-1324-y. [DOI] [PMC free article] [PubMed] [Google Scholar]
- 41.Philip M, Fairchild L, Sun L, Horste EL, Camara S, Shakiba M, Scott AC, Viale A, Lauer P, Merghoub T, et al. (2017). Chromatin states define tumour-specific T cell dysfunction and reprogramming. Nature 545, 452–456. 10.1038/nature22367. [DOI] [PMC free article] [PubMed] [Google Scholar]
- 42.Leavy O (2010). Exhaustion through BATF. Nat Rev Immunol 10, 747. 10.1038/nri2881. [DOI] [PubMed] [Google Scholar]
- 43.Quigley M, Pereyra F, Nilsson B, Porichis F, Fonseca C, Eichbaum Q, Julg B, Jesneck JL, Brosnahan K, Imam S, et al. (2010). Transcriptional analysis of HIV-specific CD8+ T cells shows that PD-1 inhibits T cell function by upregulating BATF. Nat Med 16, 1147–1151. 10.1038/nm.2232. [DOI] [PMC free article] [PubMed] [Google Scholar]
- 44.Park D, Kim HG, Kim M, Park T, Ha H-H, Lee DH, Park K-S, Park SJ, Lim HJ, and Lee CH (2019). Differences in the molecular signatures of mucosal-associated invariant T cells and conventional T cells. Sci Rep 9, 7094–7094. 10.1038/s41598-019-43578-9. [DOI] [PMC free article] [PubMed] [Google Scholar]
- 45.Trapnell C, Cacchiarelli D, Grimsby J, Pokharel P, Li S, Morse M, Lennon NJ, Livak KJ, Mikkelsen TS, and Rinn JL (2014). The dynamics and regulators of cell fate decisions are revealed by pseudotemporal ordering of single cells. Nature Biotechnology 32, 381–386. 10.1038/nbt.2859. [DOI] [PMC free article] [PubMed] [Google Scholar]
- 46.Qiu X, Mao Q, Tang Y, Wang L, Chawla R, Pliner HA, and Trapnell C (2017). Reversed graph embedding resolves complex single-cell trajectories. Nature Methods 14, 979–982. 10.1038/nmeth.4402. [DOI] [PMC free article] [PubMed] [Google Scholar]
- 47.Cao J, Spielmann M, Qiu X, Huang X, Ibrahim DM, Hill AJ, Zhang F, Mundlos S, Christiansen L, Steemers FJ, et al. (2019). The single-cell transcriptional landscape of mammalian organogenesis. Nature 566, 496–502. 10.1038/s41586-019-0969-x. [DOI] [PMC free article] [PubMed] [Google Scholar]
- 48.Cheng S, Li Z, Gao R, Xing B, Gao Y, Yang Y, Qin S, Zhang L, Ouyang H, Du P, et al. (2021). A pan-cancer single-cell transcriptional atlas of tumor infiltrating myeloid cells. Cell 184, 792–809 e723. 10.1016/j.cell.2021.01.010. [DOI] [PubMed] [Google Scholar]
- 49.Efthymiou G, Saint A, Ruff M, Rekad Z, Ciais D, and Van Obberghen-Schilling E (2020). Shaping Up the Tumor Microenvironment With Cellular Fibronectin. Front Oncol 10, 641. 10.3389/fonc.2020.00641. [DOI] [PMC free article] [PubMed] [Google Scholar]
- 50.Wei T, Bi G, Bian Y, Ruan S, Yuan G, Xie H, Zhao M, Shen R, Zhu Y, Wang Q, et al. (2020). The Significance of Secreted Phosphoprotein 1 in Multiple Human Cancers. Front Mol Biosci 7, 565383. 10.3389/fmolb.2020.565383. [DOI] [PMC free article] [PubMed] [Google Scholar]
- 51.Zhang Q, He Y, Luo N, Patel SJ, Han Y, Gao R, Modak M, Carotta S, Haslinger C, Kind D, et al. (2019). Landscape and Dynamics of Single Immune Cells in Hepatocellular Carcinoma. Cell 179, 829–845 e820. 10.1016/j.cell.2019.10.003. [DOI] [PubMed] [Google Scholar]
- 52.Krzyzak L, Seitz C, Urbat A, Hutzler S, Ostalecki C, Gläsner J, Hiergeist A, Gessner A, Winkler TH, Steinkasserer A, and Nitschke L (2016). CD83 Modulates B Cell Activation and Germinal Center Responses. J Immunol 196, 3581–3594. 10.4049/jimmunol.1502163. [DOI] [PubMed] [Google Scholar]
- 53.Jeffrey KL, Brummer T, Rolph MS, Liu SM, Callejas NA, Grumont RJ, Gillieron C, Mackay F, Grey S, Camps M, et al. (2006). Positive regulation of immune cell function and inflammatory responses by phosphatase PAC-1. Nat Immunol 7, 274–283. 10.1038/ni1310. [DOI] [PubMed] [Google Scholar]
- 54.Shalapour S, and Karin M (2021). The neglected brothers come of age: B cells and cancer. Semin Immunol, 101479. 10.1016/j.smim.2021.101479. [DOI] [PMC free article] [PubMed] [Google Scholar]
- 55.Kieffer Y, Hocine HR, Gentric G, Pelon F, Bernard C, Bourachot B, Lameiras S, Albergante L, Bonneau C, Guyard A, et al. (2020). Single-Cell Analysis Reveals Fibroblast Clusters Linked to Immunotherapy Resistance in Cancer. Cancer Discov 10, 1330–1351. 10.1158/2159-8290.CD-19-1384. [DOI] [PubMed] [Google Scholar]
- 56.Rocha SF, Schiller M, Jing D, Li H, Butz S, Vestweber D, Biljes D, Drexler HC, Nieminen-Kelhä M, Vajkoczy P, et al. (2014). Esm1 modulates endothelial tip cell behavior and vascular permeability by enhancing VEGF bioavailability. Circ Res 115, 581–590. 10.1161/circresaha.115.304718. [DOI] [PubMed] [Google Scholar]
- 57.Furuya M, Nishiyama M, Kimura S, Suyama T, Naya Y, Ito H, Nikaido T, and Ishikura H (2004). Expression of regulator of G protein signalling protein 5 (RGS5) in the tumour vasculature of human renal cell carcinoma. J Pathol 203, 551–558. 10.1002/path.1543. [DOI] [PubMed] [Google Scholar]
- 58.Manzur M, Hamzah J, and Ganss R (2009). Modulation of g protein signaling normalizes tumor vessels. Cancer Res 69, 396–399. 10.1158/0008-5472.Can-08-2842. [DOI] [PubMed] [Google Scholar]
- 59.Auslander N, Zhang G, Lee JS, Frederick DT, Miao B, Moll T, Tian T, Wei Z, Madan S, Sullivan RJ, et al. (2018). Robust prediction of response to immune checkpoint blockade therapy in metastatic melanoma. Nat Med 24, 1545–1549. 10.1038/s41591-018-0157-9. [DOI] [PMC free article] [PubMed] [Google Scholar]
- 60.Rumpret M, Drylewicz J, Ackermans LJE, Borghans JAM, Medzhitov R, and Meyaard L (2020). Functional categories of immune inhibitory receptors. Nat Rev Immunol 20, 771–780. 10.1038/s41577-020-0352-z. [DOI] [PubMed] [Google Scholar]
- 61.Uhlen M, Karlsson MJ, Zhong W, Tebani A, Pou C, Mikes J, Lakshmikanth T, Forsström B, Edfors F, Odeberg J, et al. (2019). A genome-wide transcriptomic analysis of protein-coding genes in human blood cells. Science 366. 10.1126/science.aax9198. [DOI] [PubMed] [Google Scholar]
- 62.Weis SM, and Cheresh DA (2011). Tumor angiogenesis: molecular pathways and therapeutic targets. Nat Med 17, 1359–1370. 10.1038/nm.2537. [DOI] [PubMed] [Google Scholar]
- 63.Ammirante M, Luo JL, Grivennikov S, Nedospasov S, and Karin M (2010). B-cell-derived lymphotoxin promotes castration-resistant prostate cancer. Nature 464, 302–305. 10.1038/nature08782. [DOI] [PMC free article] [PubMed] [Google Scholar]
- 64.Ammirante M, Kuraishy AI, Shalapour S, Strasner A, Ramirez-Sanchez C, Zhang W, Shabaik A, and Karin M (2013). An IKKα-E2F1-BMI1 cascade activated by infiltrating B cells controls prostate regeneration and tumor recurrence. Genes Dev 27, 1435–1440. 10.1101/gad.220202.113. [DOI] [PMC free article] [PubMed] [Google Scholar]
- 65.Shalapour S, Font-Burgada J, Di Caro G, Zhong Z, Sanchez-Lopez E, Dhar D, Willimsky G, Ammirante M, Strasner A, Hansel DE, et al. (2015). Immunosuppressive plasma cells impede T-cell-dependent immunogenic chemotherapy. Nature 521, 94–98. 10.1038/nature14395. [DOI] [PMC free article] [PubMed] [Google Scholar]
- 66.Salmon H, Franciszkiewicz K, Damotte D, Dieu-Nosjean MC, Validire P, Trautmann A, Mami-Chouaib F, and Donnadieu E (2012). Matrix architecture defines the preferential localization and migration of T cells into the stroma of human lung tumors. J Clin Invest 122, 899–910. 10.1172/jci45817. [DOI] [PMC free article] [PubMed] [Google Scholar]
- 67.Carrega P, Morandi B, Costa R, Frumento G, Forte G, Altavilla G, Ratto GB, Mingari MC, Moretta L, and Ferlazzo G (2008). Natural killer cells infiltrating human nonsmall-cell lung cancer are enriched in CD56 bright CD16(-) cells and display an impaired capability to kill tumor cells. Cancer 112, 863–875. 10.1002/cncr.23239. [DOI] [PubMed] [Google Scholar]
- 68.Castriconi R, Carrega P, Dondero A, Bellora F, Casu B, Regis S, Ferlazzo G, and Bottino C (2018). Molecular Mechanisms Directing Migration and Retention of Natural Killer Cells in Human Tissues. Front Immunol 9, 2324. 10.3389/fimmu.2018.02324. [DOI] [PMC free article] [PubMed] [Google Scholar]
- 69.Ooi CH, Ivanova T, Wu J, Lee M, Tan IB, Tao J, Ward L, Koo JH, Gopalakrishnan V, Zhu Y, et al. (2009). Oncogenic pathway combinations predict clinical prognosis in gastric cancer. PLoS Genet 5, e1000676. 10.1371/journal.pgen.1000676. [DOI] [PMC free article] [PubMed] [Google Scholar]
- 70.Cristescu R, Lee J, Nebozhyn M, Kim KM, Ting JC, Wong SS, Liu J, Yue YG, Wang J, Yu K, et al. (2015). Molecular analysis of gastric cancer identifies subtypes associated with distinct clinical outcomes. Nat Med 21, 449–456. 10.1038/nm.3850. [DOI] [PubMed] [Google Scholar]
- 71.Cancer Genome Atlas Research, N. (2014). Comprehensive molecular characterization of gastric adenocarcinoma. Nature 513, 202–209. 10.1038/nature13480. [DOI] [PMC free article] [PubMed] [Google Scholar]
- 72.Bagaev A, Kotlov N, Nomie K, Svekolkin V, Gafurov A, Isaeva O, Osokin N, Kozlov I, Frenkel F, Gancharova O, et al. (2021). Conserved pan-cancer microenvironment subtypes predict response to immunotherapy. Cancer Cell 39, 845–865 e847. 10.1016/j.ccell.2021.04.014. [DOI] [PubMed] [Google Scholar]
- 73.Steele NG, Carpenter ES, Kemp SB, Sirihorachai VR, The S, Delrosario L, Lazarus J, Amir ED, Gunchick V, Espinoza C, et al. (2020). Multimodal Mapping of the Tumor and Peripheral Blood Immune Landscape in Human Pancreatic Cancer. Nat Cancer 1, 1097–1112. 10.1038/s43018-020-00121-4. [DOI] [PMC free article] [PubMed] [Google Scholar]
- 74.Raghavan S, Winter PS, Navia AW, Williams HL, DenAdel A, Lowder KE, GalvezReyes J, Kalekar RL, Mulugeta N, Kapner KS, et al. (2021). Microenvironment drives cell state, plasticity, and drug response in pancreatic cancer. Cell 184, 6119–6137 e6126. 10.1016/j.cell.2021.11.017. [DOI] [PMC free article] [PubMed] [Google Scholar]
- 75.Pelka K, Hofree M, Chen JH, Sarkizova S, Pirl JD, Jorgji V, Bejnood A, Dionne D, Ge WH, Xu KH, et al. (2021). Spatially organized multicellular immune hubs in human colorectal cancer. Cell 184, 4734–4752 e4720. 10.1016/j.cell.2021.08.003. [DOI] [PMC free article] [PubMed] [Google Scholar]
- 76.Wu SZ, Al-Eryani G, Roden DL, Junankar S, Harvey K, Andersson A, Thennavan A, Wang C, Torpy JR, Bartonicek N, et al. (2021). A single-cell and spatially resolved atlas of human breast cancers. Nat Genet 53, 1334–1347. 10.1038/s41588-021-00911-1. [DOI] [PMC free article] [PubMed] [Google Scholar]
- 77.Pal B, Chen Y, Vaillant F, Capaldo BD, Joyce R, Song X, Bryant VL, Penington JS, Di Stefano L, Tubau Ribera N, et al. (2021). A single-cell RNA expression atlas of normal, preneoplastic and tumorigenic states in the human breast. EMBO J 40, e107333. 10.15252/embj.2020107333. [DOI] [PMC free article] [PubMed] [Google Scholar]
- 78.Song S, Xu Y, Huo L, Zhao S, Wang R, Li Y, Scott AW, Pizzi MP, Wang Y, Fan Y, et al. (2021). Patient-derived cell lines and orthotopic mouse model of peritoneal carcinomatosis recapitulate molecular and phenotypic features of human gastric adenocarcinoma. J Exp Clin Cancer Res 40, 207. 10.1186/s13046-021-02003-8. [DOI] [PMC free article] [PubMed] [Google Scholar]
- 79.Zhang P, Yang M, Zhang Y, Xiao S, Lai X, Tan A, Du S, and Li S (2019). Dissecting the Single-Cell Transcriptome Network Underlying Gastric Premalignant Lesions and Early Gastric Cancer. Cell Rep 27, 1934–1947 e1935. 10.1016/j.celrep.2019.04.052. [DOI] [PubMed] [Google Scholar]
- 80.Srivastava R, Kashyap A, Kumar M, Nath G, and Jain AK (2013). Mucosal IgA & IL-1beta in Helicobacter pylori Infection. Indian J Clin Biochem 28, 19–23. 10.1007/s12291-012-0262-3. [DOI] [PMC free article] [PubMed] [Google Scholar]
- 81.Matsukura N, Onda M, Tokunaga A, Matsuda N, and Yamashita K (1995). Mucosal IgA antibody against Helicobacter pylori in chronic gastritis and intestinal metaplasia detected by the Tes-Tape method in resection specimens after gastrectomy for gastric cancer. Cancer 75, 1472–1477. 10.1002/1097-0142(19950315)75:6+<1472::aid-cncr2820751515>3.0.co;2-8. [DOI] [PubMed] [Google Scholar]
- 82.Russell MW, Reinholdt J, and Kilian M (1989). Anti-inflammatory activity of human IgA antibodies and their Fab alpha fragments: inhibition of IgG-mediated complement activation. Eur J Immunol 19, 2243–2249. 10.1002/eji.1830191210. [DOI] [PubMed] [Google Scholar]
- 83.Akhiani AA, Schon K, Franzen LE, Pappo J, and Lycke N (2004). Helicobacter pylori-specific antibodies impair the development of gastritis, facilitate bacterial colonization, and counteract resistance against infection. J Immunol 172, 5024–5033. 10.4049/jimmunol.172.8.5024. [DOI] [PubMed] [Google Scholar]
- 84.Weiser JN, Bae D, Fasching C, Scamurra RW, Ratner AJ, and Janoff EN (2003). Antibody-enhanced pneumococcal adherence requires IgA1 protease. Proc Natl Acad Sci U S A 100, 4215–4220. 10.1073/pnas.0637469100. [DOI] [PMC free article] [PubMed] [Google Scholar]
- 85.Hansen IS, Baeten DLP, and den Dunnen J (2019). The inflammatory function of human IgA. Cell Mol Life Sci 76, 1041–1055. 10.1007/s00018-018-2976-8. [DOI] [PMC free article] [PubMed] [Google Scholar]
- 86.Gommerman JL, Rojas OL, and Fritz JH (2014). Re-thinking the functions of IgA(+)plasma cells. Gut Microbes 5, 652–662. 10.4161/19490976.2014.969977. [DOI] [PMC free article] [PubMed] [Google Scholar]
- 87.Yuan L, Tatineni J, Mahoney KM, and Freeman GJ (2021). VISTA: A Mediator of Quiescence and a Promising Target in Cancer Immunotherapy. Trends Immunol 42, 209–227. 10.1016/j.it.2020.12.008. [DOI] [PMC free article] [PubMed] [Google Scholar]
- 88.Farhad M, Rolig AS, and Redmond WL (2018). The role of Galectin-3 in modulating tumor growth and immunosuppression within the tumor microenvironment. Oncoimmunology 7, e1434467. 10.1080/2162402X.2018.1434467. [DOI] [PMC free article] [PubMed] [Google Scholar]
- 89.Liu J, Lichtenberg T, Hoadley KA, Poisson LM, Lazar AJ, Cherniack AD, Kovatich AJ, Benz CC, Levine DA, Lee AV, et al. (2018). An Integrated TCGA Pan-Cancer Clinical Data Resource to Drive High-Quality Survival Outcome Analytics. Cell 173, 400–416 e411. 10.1016/j.cell.2018.02.052. [DOI] [PMC free article] [PubMed] [Google Scholar]
- 90.Turley SJ, Cremasco V, and Astarita JL (2015). Immunological hallmarks of stromal cells in the tumour microenvironment. Nat Rev Immunol 15, 669–682. 10.1038/nri3902. [DOI] [PubMed] [Google Scholar]
- 91.Tauriello DVF, Palomo-Ponce S, Stork D, Berenguer-Llergo A, Badia-Ramentol J, Iglesias M, Sevillano M, Ibiza S, Canellas A, Hernando-Momblona X, et al. (2018). TGFbeta drives immune evasion in genetically reconstituted colon cancer metastasis. Nature 554, 538–543. 10.1038/nature25492. [DOI] [PubMed] [Google Scholar]
- 92.Mariathasan S, Turley SJ, Nickles D, Castiglioni A, Yuen K, Wang Y, Kadel EE III, Koeppen H, Astarita JL, Cubas R, et al. (2018). TGFbeta attenuates tumour response to PD-L1 blockade by contributing to exclusion of T cells. Nature 554, 544–548. 10.1038/nature25501. [DOI] [PMC free article] [PubMed] [Google Scholar]
- 93.Mytilinaiou M, Nikitovic D, Berdiaki A, Kostouras A, Papoutsidakis A, Tsatsakis AM, and Tzanakakis GN (2017). Emerging roles of syndecan 2 in epithelial and mesenchymal cancer progression. IUBMB Life 69, 824–833. 10.1002/iub.1678. [DOI] [PubMed] [Google Scholar]
- 94.Wang J, Lu C, Chen J, Chen X, Wang S, Lu X, and Tang X (2017). Expression of Syndecan-2 in gastric adenocarcinoma and its effect on tumorigenesis in vitro. Translational Cancer Research 6. [Google Scholar]
- 95.Teixe T, Nieto-Blanco P, Vilella R, Engel P, Reina M, and Espel E (2008). Syndecan-2 and -4 expressed on activated primary human CD4+ lymphocytes can regulate T cell activation. Mol Immunol 45, 2905–2919. 10.1016/j.molimm.2008.01.033. [DOI] [PubMed] [Google Scholar]
- 96.Lakins MA, Ghorani E, Munir H, Martins CP, and Shields JD (2018). Cancer-associated fibroblasts induce antigen-specific deletion of CD8 (+) T Cells to protect tumour cells. Nat Commun 9, 948. 10.1038/s41467-018-03347-0. [DOI] [PMC free article] [PubMed] [Google Scholar]
- 97.Luo J, Chen XQ, and Li P (2019). The Role of TGF-beta and Its Receptors in Gastrointestinal Cancers. Transl Oncol 12, 475–484. 10.1016/j.tranon.2018.11.010. [DOI] [PMC free article] [PubMed] [Google Scholar]
- 98.Batlle E, and Massague J (2019). Transforming Growth Factor-beta Signaling in Immunity and Cancer. Immunity 50, 924–940. 10.1016/j.immuni.2019.03.024. [DOI] [PMC free article] [PubMed] [Google Scholar]
- 99.Yeo J, Ko M, Lee DH, Park Y, and Jin HS (2021). TIGIT/CD226 Axis Regulates Anti-Tumor Immunity. Pharmaceuticals (Basel) 14. 10.3390/ph14030200. [DOI] [PMC free article] [PubMed] [Google Scholar]
- 100.Diaz P, Valenzuela Valderrama M, Bravo J, and Quest AFG (2018). Helicobacter pylori and Gastric Cancer: Adaptive Cellular Mechanisms Involved in Disease Progression. Front Microbiol 9, 5. 10.3389/fmicb.2018.00005. [DOI] [PMC free article] [PubMed] [Google Scholar]
- 101.Correa P, and Piazuelo MB (2011). Helicobacter pylori Infection and Gastric Adenocarcinoma. US Gastroenterol Hepatol Rev 7, 59–64. [PMC free article] [PubMed] [Google Scholar]
- 102.Navashenaq JG, Shabgah AG, Banach M, Jamialahmadi T, Penson PE, Johnston TP, and Sahebkar A (2021). The interaction of Helicobacter pylori with cancer immunomodulatory stromal cells: New insight into gastric cancer pathogenesis. Semin Cancer Biol. 10.1016/j.semcancer.2021.09.014. [DOI] [PubMed] [Google Scholar]
- 103.Wang R, Dang M, Harada K, Han G, Wang F, Pool Pizzi M, Zhao M, Tatlonghari G, Zhang S, Hao D, et al. (2021). Single-cell dissection of intratumoral heterogeneity and lineage diversity in metastatic gastric adenocarcinoma. Nat Med 27, 141–151. 10.1038/s41591-020-1125-8. [DOI] [PMC free article] [PubMed] [Google Scholar]
- 104.Mani SA, Guo W, Liao MJ, Eaton EN, Ayyanan A, Zhou AY, Brooks M, Reinhard F, Zhang CC, Shipitsin M, et al. (2008). The epithelial-mesenchymal transition generates cells with properties of stem cells. Cell 133, 704–715. 10.1016/j.cell.2008.03.027. [DOI] [PMC free article] [PubMed] [Google Scholar]
- 105.Deng Q, Han G, Puebla-Osorio N, Ma MCJ, Strati P, Chasen B, Dai E, Dang M, Jain N, Yang H, et al. (2020). Characteristics of anti-CD19 CAR T cell infusion products associated with efficacy and toxicity in patients with large B cell lymphomas. Nat Med. 10.1038/s41591020-1061-7. [DOI] [PMC free article] [PubMed] [Google Scholar]
- 106.Sinjab A, Han G, Treekitkarnmongkol W, Hara K, Brennan PM, Dang M, Hao D, Wang R, Dai E, Dejima H, et al. (2021). Resolving the spatial and cellular architecture of lung adenocarcinoma by multiregion single-cell sequencing. Cancer Discov. 10.1158/2159-8290.CD-20-1285. [DOI] [PMC free article] [PubMed] [Google Scholar]
- 107.Butler A, Hoffman P, Smibert P, Papalexi E, and Satija R (2018). Integrating single-cell transcriptomic data across different conditions, technologies, and species. Nat Biotechnol 36, 411–420. 10.1038/nbt.4096. [DOI] [PMC free article] [PubMed] [Google Scholar]
- 108.Buttner M, Miao Z, Wolf FA, Teichmann SA, and Theis FJ (2019). A test metric for assessing single-cell RNA-seq batch correction. Nat Methods 16, 43–49. 10.1038/s41592-018-0254-1. [DOI] [PubMed] [Google Scholar]
- 109.Korsunsky I, Millard N, Fan J, Slowikowski K, Zhang F, Wei K, Baglaenko Y, Brenner M, Loh PR, and Raychaudhuri S (2019). Fast, sensitive and accurate integration of single-cell data with Harmony. Nat Methods 16, 1289–1296. 10.1038/s41592-019-0619-0. [DOI] [PMC free article] [PubMed] [Google Scholar]
- 110.McInnes L, Healy J, and Melville J (2020). UMAP: Uniform Manifold Approximation and Projection for Dimension Reduction.
- 111.Wolock SL, Lopez R, and Klein AM (2019). Scrublet: Computational Identification of Cell Doublets in Single-Cell Transcriptomic Data. Cell Syst 8, 281–291 e289. 10.1016/j.cels.2018.11.005. [DOI] [PMC free article] [PubMed] [Google Scholar]
- 112.Liu B, Li C, Li Z, Wang D, Ren X, and Zhang Z (2020). An entropy-based metric for assessing the purity of single cell populations. Nat Commun 11, 3155. 10.1038/s41467-020-16904-3. [DOI] [PMC free article] [PubMed] [Google Scholar]
- 113.Hanzelmann S, Castelo R, and Guinney J (2013). GSVA: gene set variation analysis for microarray and RNA-seq data. BMC Bioinformatics 14, 7. 10.1186/1471-2105-14-7. [DOI] [PMC free article] [PubMed] [Google Scholar]
- 114.Zhang L, Yu X, Zheng L, Zhang Y, Li Y, Fang Q, Gao R, Kang B, Zhang Q, Huang JY, et al. (2018). Lineage tracking reveals dynamic relationships of T cells in colorectal cancer. Nature 564, 268–272. 10.1038/s41586-018-0694-x. [DOI] [PubMed] [Google Scholar]
- 115.Irizarry RA, Bolstad BM, Collin F, Cope LM, Hobbs B, and Speed TP (2003). Summaries of Affymetrix GeneChip probe level data. Nucleic Acids Res 31, e15. 10.1093/nar/gng015. [DOI] [PMC free article] [PubMed] [Google Scholar]
- 116.Lei Z, Tan IB, Das K, Deng N, Zouridis H, Pattison S, Chua C, Feng Z, Guan YK, Ooi CH, et al. (2013). Identification of molecular subtypes of gastric cancer with different responses to PI3-kinase inhibitors and 5-fluorouracil. Gastroenterology 145, 554–565. 10.1053/j.gastro.2013.05.010. [DOI] [PubMed] [Google Scholar]
- 117.Newman AM, Steen CB, Liu CL, Gentles AJ, Chaudhuri AA, Scherer F, Khodadoust MS, Esfahani MS, Luca BA, Steiner D, et al. (2019). Determining cell type abundance and expression from bulk tissues with digital cytometry. Nat Biotechnol 37, 773–782. 10.1038/s41587-019-0114-2. [DOI] [PMC free article] [PubMed] [Google Scholar]
Associated Data
This section collects any data citations, data availability statements, or supplementary materials included in this article.
Supplementary Materials
Table S1. Data summary of subjects in this study. Related to Figure 1.
Table S4. Relative abundance of each of the 61 cell populations across 58 samples. Related to Figure 5.
Table S5. Absolute abundance of each of the 61 cell populations across 58 samples. Related to Figure 5.
Table S6. Jaccard index of relative cellular abundance among 58 Samples. Related to Figure 5.
Table S7. Chi-squared tests showing the distribution of clustering with TCR genes across clustering without TCR genes in CD4+ and CD8+ T cells. Related to STAR Methods.
Data Availability Statement
The scRNA-seq data generated on samples of Cohort #1 can be downloaded from Gene Expression Omnibus database (GEO, https://www.ncbi.nlm.nih.gov/geo/) under the accession numbers GSE234129. The scRNA-seq data generated on PC ascites cells (Cohort #2) can be downloaded from EGA (European Genome-phenome Archive, https://ega-archive.org) via accession number EGAS00001004443. The raw scRNA-seq data for healthy PBMCs can be obtained from EGAS00001005019. The processed feature-barcode matrices generated on NAT, CAG, IM, primary GAC, and PBMC samples in the Cohort #325 were available from https://dna-discovery.stanford.edu. The raw scRNA-seq data generated on NGT, CAG, IM, and primary GAC in the Cohort #479 were available from Gene Expression Omnibus (GEO: GSE134520). The data can also be accessed through the online Single Cell Data Portal (https://singlecell.mdanderson.org/GastricTME), an interactive web-based tool we have developed for visualizing our scRNA-seq data. In addition, four public datasets can be obtained from NCI’s Genomic Data Commons (TCGA-STAD) and the Gene Expression Omnibus database (GEO, https://www.ncbi.nlm.nih.gov/geo/) under the accession numbers GSE6225425, GSE1545969, and GSE84437. All codes used for analysis and cell annotation are available from https://github.com/ruipwang/GastricTME/. The data that support the main findings of this study are provided in Tables S2–6, and additional information are also available from the corresponding author upon request.