

Abstract
Microglia play a critical role in brain homeostasis and disease progression. In neurodegenerative conditions, microglia acquire the neurodegenerative phenotype (MGnD), whose function is poorly understood. MicroRNA-155 (miR-155), enriched in immune cells, critically regulates MGnD. However, its role in Alzheimer’s disease (AD) pathogenesis remains unclear. Here, we report that microglial deletion of miR-155 induces a pre-MGnD activation state via interferon-γ (IFNγ) signaling and blocking IFNγ signaling attenuates MGnD induction and microglial phagocytosis. Single-cell RNAseq analysis of microglia from an AD mouse model identifies Stat1 and Clec2d as pre-MGnD markers. This phenotypic transition enhances amyloid plaque compaction, reduces dystrophic neurites, attenuates plaque-associated synaptic degradation, and improves cognition. Our study demonstrates a miR-155-mediated regulatory mechanism of MGnD and the beneficial role of IFNγ-responsive pre-MGnD in restricting neurodegenerative pathology and preserving cognitive function in an AD mouse model, highlighting miR-155 and IFNγ as potential therapeutic targets for AD.
Introduction
Alzheimer’s disease (AD) is one of the most prevalent neurodegenerative disorders. Recent genome-wide association studies have identified multiple AD risk genes associated with the regulation of innate immune pathways1–3. Microglia are brain resident innate immune cells that play an essential role in supporting homeostatic central nervous system (CNS) function4, but may also contribute to neurodegeneration via pro-inflammatory and phagocytic functions5. We have classified microglia as homeostatic (M0)6 and neurodegenerative microglia (MGnD)7, also referred to as disease associated microglia (DAM)8 that are regulated by the reciprocal suppression of transforming growth factor β (TGFβ)6, 9 and induction of triggering receptor expressed on myeloid cells 2 (Trem2) – apolipoprotein E (ApoE) signaling in neurodegenerative models including AD6, 7. Surface expression of Trem2 on microglia senses phosphatidylserine10 expressed on apoptotic or damaged cells, triggering APOE signaling and inducing an MGnD phenotype in a cell-autonomous manner7, 11. TREM2 deficiency in mice and humans has been shown to impair microglial compaction of Aβ plaques and increase dystrophic neurites12, 13. TREM2 appears to have a protective function during the early phases of AD pathology. Several studies using TREM2-agonistic antibodies have shown beneficial effects on plaque pathology and neuritic dystrophy14–18. However, recent studies suggested that TREM2 activation and MGnD worsen Aβ-induced tau pathology, indicating a model-specific and disease-stage-specific role of TREM219, 20. Microglial phagocytosis and the complement cascade have also been linked to synaptic pruning, a process which can become abnormally activated in AD, resulting in the uptake of viable synapses from the brain21–23. Therefore, augmenting microglia-mediated plaque compaction while limiting neurotoxic processes such as synaptic pruning, tau spreading, and inflammatory cytokine secretion represents a promising strategy for AD therapeutic development.
miR-155 plays a crucial role in various physiological and pathological processes, primarily innate immune activation and inflammation24, 25. We have previously shown that miR-155 was activated by TREM2-APOE signaling in MGnD microglia7. Genetic and pharmacological ablation of miR-155 reversed the abnormal microglial signature and ameliorated disease progression in an amyotrophic lateral sclerosis (ALS) mouse model expressing superoxide dismutase 1 (SOD1) mutant26, 27. However, systemic deletion of miR-155 accelerated the accumulation of amyloid-β (Aβ) deposits in APP/PS1 mice28. Conversely, deletion of microglial miR-155 increased Aβ1–42 fibrils in lysosomal compartments, suggesting that miR-155 expression can modulate the degradation of Aβ29. Thus, the role of microglial miR-155 in AD pathogenesis remains poorly understood.
In this study, we investigated the role of miR-155 in the regulation of MGnD and disease progression in APP/PS1 mice. We found that microglial miR-155 deletion induced an early MGnD response via interferon-γ (IFNγ) signaling and enhanced phagocytotic function, resulting in enhanced compaction of Aβ plaques, reduced dystrophic neurites, increased synaptic protection, and improved cognition.
Results
Targeting microglial miR-155 enhances the MGnD phenotype
To address the role of microglial miR-155 in APP/PS1 mice, we crossed miR-155fl/fl mice30 with Cx3cr1CreERT2/+ 31 and APP/PS1 mice32. We induced Cre-recombinase mediated miR-155 deletion by administering tamoxifen (TAM) at 1.5 months and analyzed brains at 4 and 8 months of age (Fig. 1a). Microglia were isolated as previously described7 (Extended Data Fig. 1a), using microglia-specific marker selection and meningeal removal to exclude CNS-associated macrophages (CAM). To rule out the effect of miR-155 deletion on CAM, we performed miRNAscope to detect miR-155 in CD206+ CAM33 and Iba1+ cells in APP/PS1 mice (Extended Data Fig. 1b). miR-155 signal was detected exclusively in Iba1+ cells in 8-month-old APP/PS1 mouse brain (Extended Data Fig. 1b,c). Deletion of miR-155 in microglia from Cx3cr1CreERT2/+:miR-155fl/fl:APP/PS1 (APP/PS1:miR-155 cKO) mice compared to age-matched Cx3cr1+/+:miR-155fl/fl:APP/PS1 (APP/PS1) mice at 4 months of age was validated by quantitative real-time reverse transcription polymerase chain reaction (qPCR) (Fig. 1b). miR-155 was highly expressed in microglia from APP/PS1 mice at 4 and 8 months of age, but significantly reduced in APP/PS1:miR-155 cKO (Fig. 1b and Extended Data Fig. 2a). We used Smartseq2 RNA sequencing (RNAseq) to detect transcriptional changes caused by the deletion of microglial miR-155. To measure the effect of miR-155 ablation in the non-disease state, we analyzed differentially expressed genes (DEGs) between wildtype mice (WT) and miR-155 ablation (miR-155 cKO). We identified a significant reduction of M0 homeostatic genes including the reduction of Tgfbr2, Mafb, Bin1, Egr1, and Sipa1 in 8-month-old miR-155 cKO mice, particularly in female mice, as compared to WT controls (Extended Data Fig. 3a–d and Supplementary Table 1). Ingenuity Pathway Analysis (IPA) showed that TGFβ signaling, STAT3 pathway, phagosome formation, and integrin signaling were suppressed in female miR-155 cKO mice (Extended Data Fig. 3e). Interestingly, we observed a significant induction of MGnD genes, such as Apoe, Axl, Cst7, Clec7a, and suppression of M0 genes, such as Egr1 and Jun, in APP/PS1:miR-155 cKO microglia compared to APP/PS1 controls at 4 months of age (Fig. 1c and Supplementary Table 1). The top-20 upregulated MGnD genes in APP/PS1 mice compared to WT mice were substantially more elevated in APP/PS1:miR-155 cKO mice (Fig. 1d and Supplementary Table 1). These changes were more robust in APP/PS1:miR-155 cKO male mice (Fig. 1e, Extended Data Fig. 4a–c, and Supplementary Table 1), including higher number of DEGs and more strongly upregulated or downregulated genes from male mice as compared to female mice (Extended Data Fig. 4a,b).
Fig. 1. Targeting microglial miR-155 enhances MGnD signature in APP/PS1 mice.
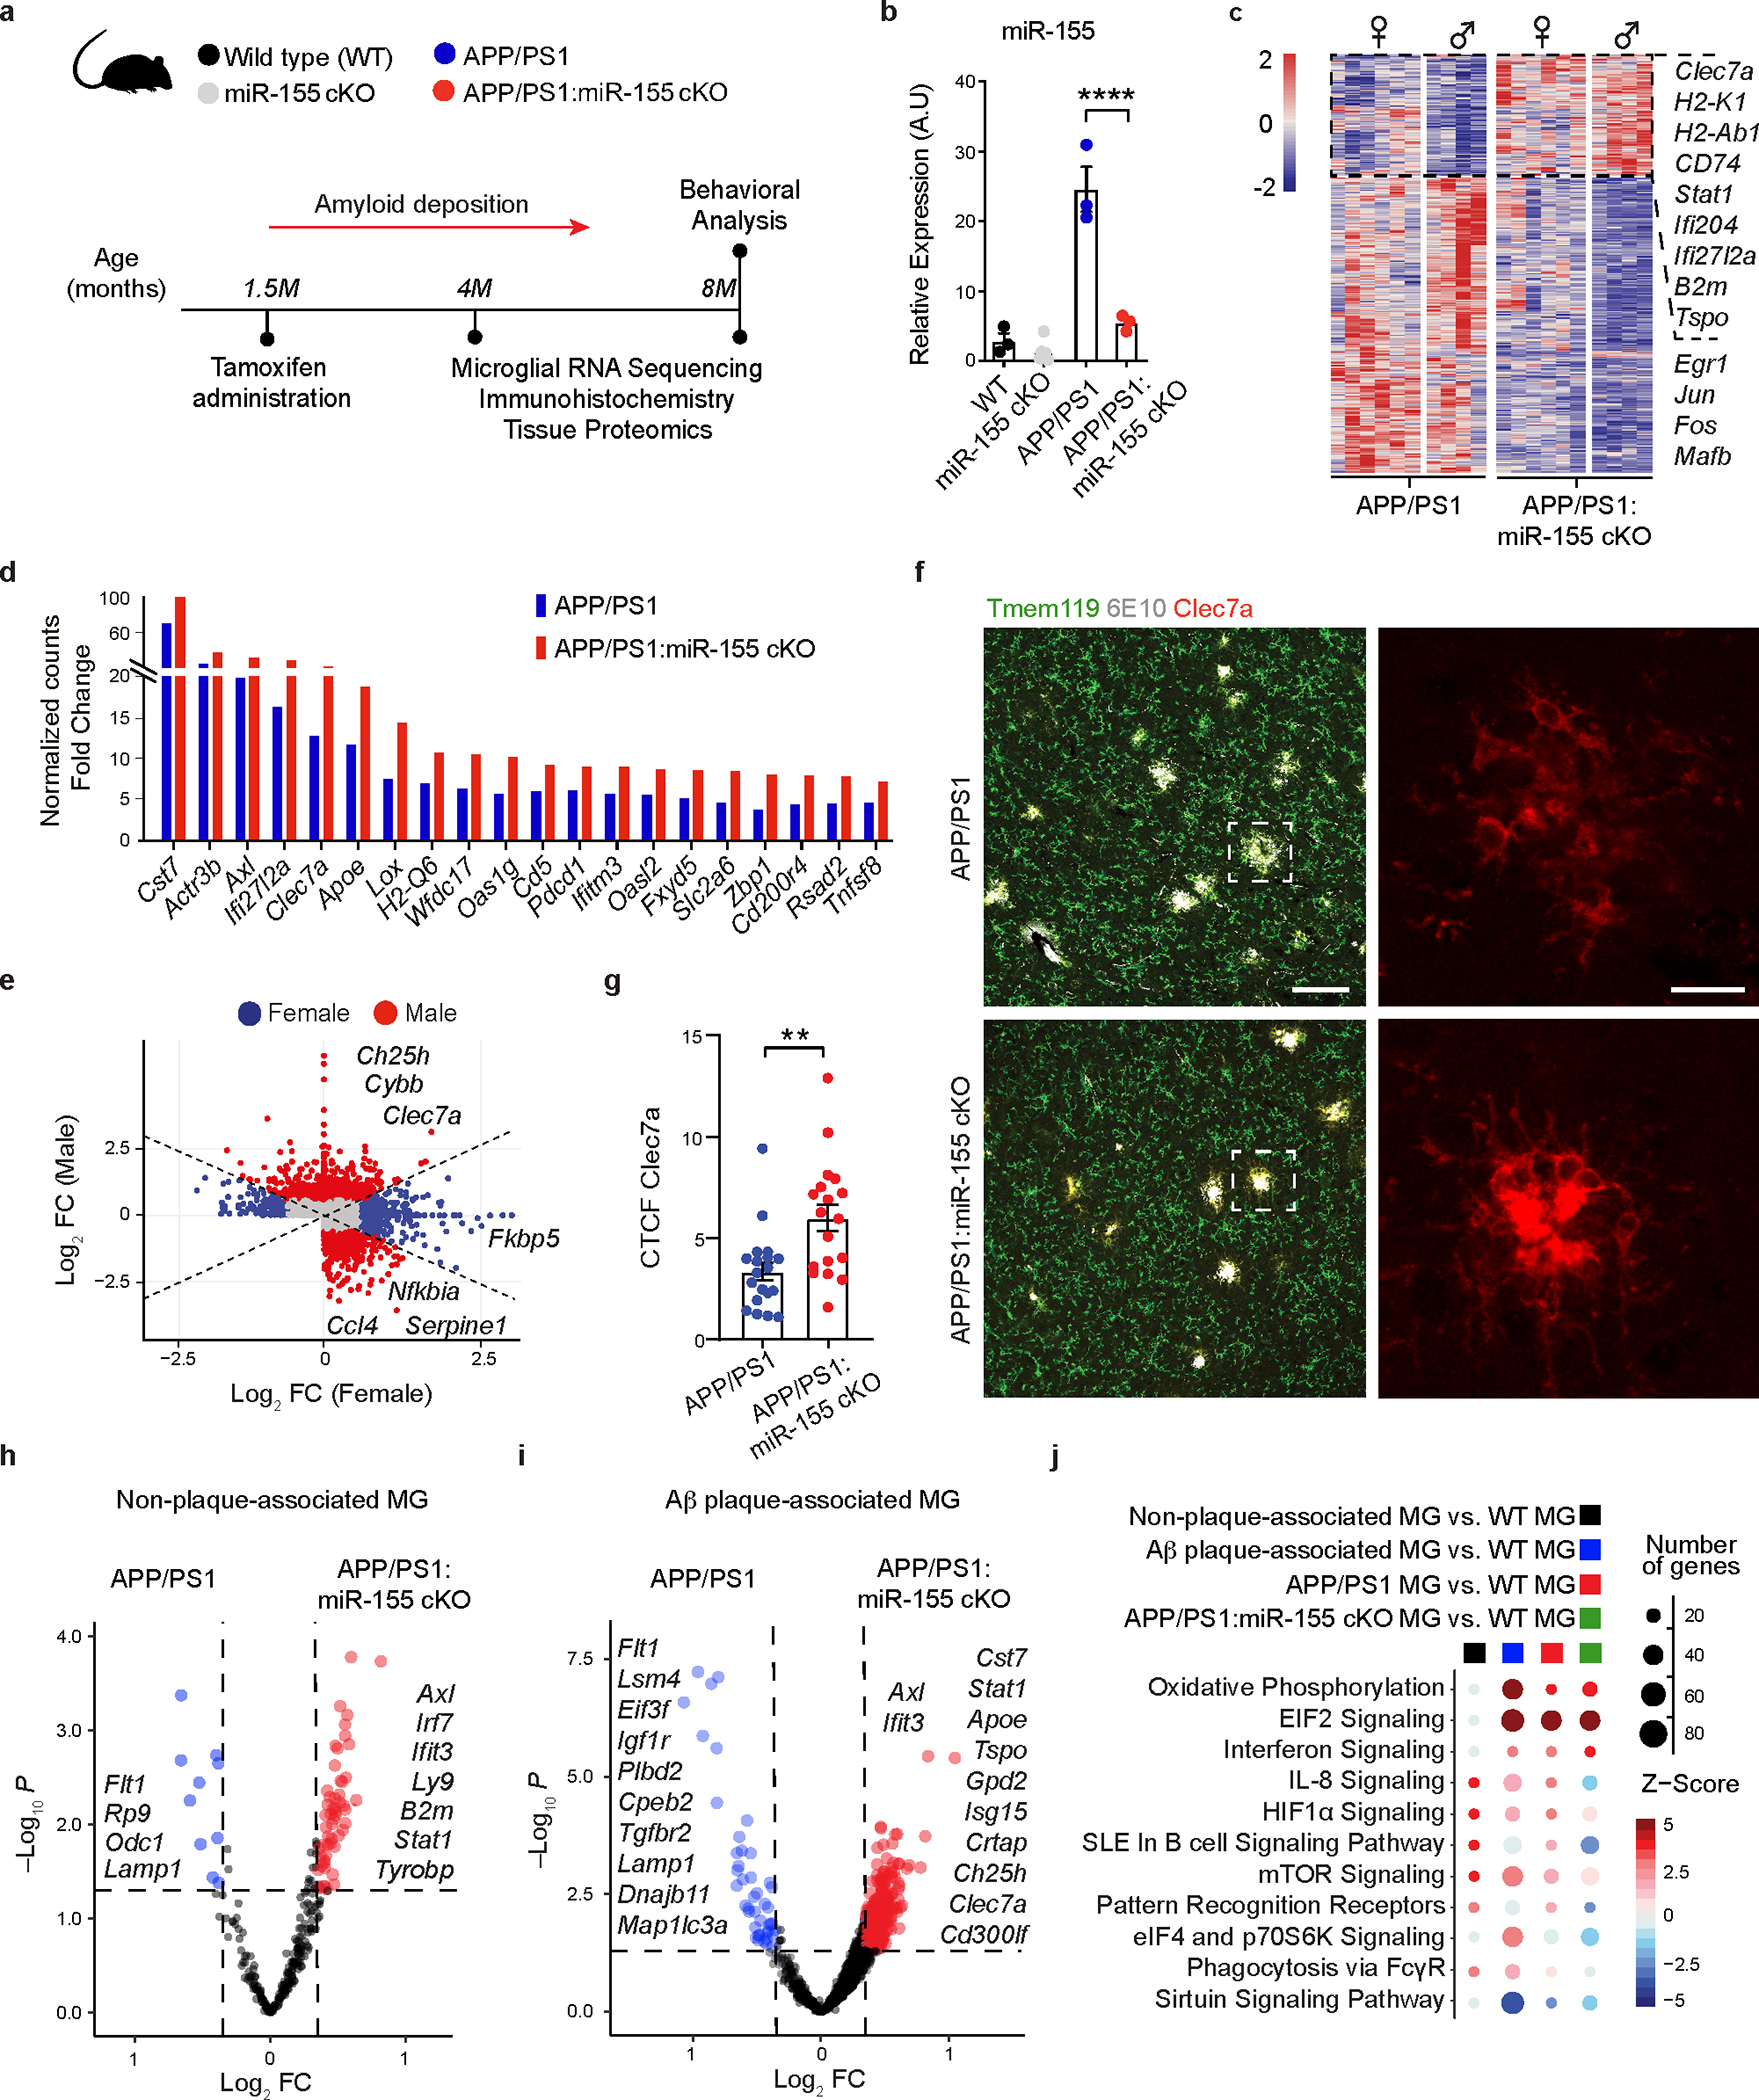
a, Experimental design. b, qPCR of miR-155 expression of 4-month-old mice showing the efficiency of tamoxifen treatment using one-way ANOVA, P < 0.0001 by one-way ANOVA with Tukey’s post hoc test (n = 6 mice for miR-155 cKO group; n = 3 mice for the other three groups). c, Heatmap of DEGs identified in APP/PS1:miR-155 cKO microglia, compared to APP/PS1 microglia using DESeq2 analysis. FDR-corrected P < 0.05, sex-specific DEGs removed (n = 4–6 mice per sex/group). d, Top-20 upregulated genes with the fold changes (FC) between APP/PS1 vs. WT group and APP/PS1:miR-155 cKO vs. WT group. e, Scatter plot showing DEGs of male and female samples from APP/PS1:miR-155 cKO group, compared to APP/PS1 mice (DEGs with Log2FC higher than the absolute value as 0.58 were labeled depending on preferential change in one sex). f, Representative confocal images of Clec7a+ MGnD and Aβ (6E10) in the brain of APP/PS1:miR-155 cKO (n = 6) and APP/PS1 (n = 6) mice. Data were obtained from one independent experiment. Scale bars: 50 μm, 15 μm. g, Quantification of the expression of Clec7a+ MGnD surrounding 6E10+ Aβ plaques by corrected total cell fluorescence (CTCF) using two-tailed unpaired Student’s t-test, P = 0.002, 19 plaques from APP/PS1 (n = 6) mice and 18 plaques from APP/PS1:miR-155 cKO (n = 6) mice. h, Volcano plots using common DEGs of APP/PS1:miR-155 cKO microglia and non-plaque-associated microglia (two-tailed P < 0.05, Wald test) or (i) plaque-associated microglia datasets, compared to WT microglia (two-tailed P < 0.05, Wald test). j, Top-affected pathways from IPA analysis based on four different comparisons: non-plaque-associated microglia (MG) vs. WT MG, Aβ plaque-associated MG vs. WT MG, APP/PS1 MG vs. WT MG, and APP/PS1:miR-155 cKO vs. WT MG (Z-Score absolute ≥ 2). Data were presented as mean values ± s.e.m. See also Extended Data Figs. 1–5, and Supplementary Table 1.
We validated the RNAseq results by immunostaining for Clec7a, a marker of MGnD microglia7. The intensity of the Clec7a signal within the area of plaque lesions was higher in APP/PS1:miR-155 cKO mice (Fig. 1f,g). Previously, we used Clec7a+ and Clec7a− microglia isolated from APP/PS1 mice to define plaque-associated and non-plaque-associated microglia, resepctively7. We identified the overlap in the molecular signature between the two datasets by comparing 1) differentially upregulated genes from Clec7a+ (plaque-associated) and Clec7a− (non-plaque-associated) microglia from APP/PS1 mice vs. WT microglia7 and 2) DEGs from APP/PS1:miR-155 cKO microglia vs. APP/PS1 microglia. Shared DEGs from both datasets were associated with enhanced IFN signaling, indicating the IFN pathway as an early response in microglia reacting to remote pathological changes7, 34 (Fig 1h,i). We also observed increased induction of genes in plaque and non-plaque associated microglia in males compared to female mice (Extended Data Fig. 4d). Upregulated DEGs in APP/PS1:miR-155 cKO microglia related to IFN signaling, including Isg15, Ifitm3, and Stat1, were associated with the induction of Clec7a+ Aβ plaque-associated MGnD microglia (Fig. 1h,i and Extended Data Fig. 4d). Gene set enrichment analysis (GSEA), gene ontology (GO) enrichment analysis, and IPA canonical pathway analysis showed that IFN signaling pathway was enhanced in APP/PS1:miR-155 cKO microglia (Fig. 1j and Extended Data Fig. 5a,b). Moreover, GO analysis revealed that significantly upregulated genes in APP/PS1:miR-155 cKO group were related to phagocytosis, antigen presentation pathways, and cellular response to IFNγ (Extended Data Fig. 5b). Transcription factor activity analysis predicted Stat1, a key transcription factor regulating IFNγ signaling, as most enriched factor in APP/PS1:miR-155cKO microglia. Other enriched transcription factors included Irf1, Irf9 and Stat2, which are critical regulators of IFNγ signaling (Extended Data Fig. 5c).
We next analyzed microglia from 8-month-old mice using SmartSeq2 RNAseq and found less DEGs affected in APP/PS1:miR-155 cKO mice as compared to 4-month-old mice (Extended Data Fig. 2b and Supplementary Table 1). Principal component analysis (PCA) revealed marginal distinction between APP/PS1 and APP/PS1:miR-155 cKO microglia (Extended Data Fig. 2c) and the overlap of DEGs was minimal involving only 9 genes, none of which were canonical MGnD genes (Extended Data Fig. 2d).
Furthermore, we conducted miR-155 targetome analysis to extract the putative genome-wide miR-155 targets in our datasets (Extended Data Fig. 5d,e). We identified Stat1 as a commonly upregulated target following miR-155 deletion in 4- and 8-month-old APP/PS1 mice (Extended Data Fig. 5f). Taken together, these data show that miR-155 deletion enhanced MGnD signature in APP/PS1:miR-155 cKO microglia and enriched IFN signaling and phagocytic pathways at 4 months of age.
miR-155 ablation primes microglia to pre-MGnD via IFNγ
To determine the role of miR-155 in the regulation of microglial clusters, we performed single-cell RNAseq (scRNAseq) of CD45+/CD11b+ myeloid cells isolated from 4-month-old APP/PS1 and APP/PS1:miR-155 cKO mouse brains of both sexes (Extended Data Fig. 6a). We isolated and analyzed 15,429 cells from 2 female APP/PS1 and 2 female APP/PS1:miR-155 cKO mice and 43,667 cells from 3 male APP/PS1 and 3 male APP/PS1:miR-155 cKO mice. Unsupervised clustering revealed 17 clusters in the female dataset (Extended Data Fig. 6b). 12 of these clusters were grouped into 3 major clusters based on homeostatic and MGnD gene expression levels, which we labeled M07, pre-MGnD and MGnD7 (Fig. 2a and Supplementary Table 2). Analysis of male samples also identified 3 major clusters (Extended Data Fig. 6g). The pre-MGnD cluster was defined by the intermediate expression of both Tmem119 and Clec7a. Non-microglia myeloid cells were not included in our analysis. Proliferating cells (clusters 8 and 9) showed expanded G2/M or S cell cycle phase, indicating active cell proliferation (Extended Data Fig. 6c,d). There was no difference in the percentage of proliferative cells between APP/PS1:miR-155 cKO and APP/PS1 mice. However, deletion of microglial miR-155 upregulated the expression of MGnD genes, such as Clec7a, Tyrobp and Lpl, and suppressed the level of homeostatic genes, such as Tmem119, in the proliferating microglia clusters (Clusters 8 and 9, Extended Data Fig. 6e). Interestingly, the pre-MGnD cluster size was expanded in APP/PS1:miR-155 cKO compared to APP/PS1 mice (Extended Data Figs. 6f,o) and the mean Z-score for the pre-MGnD signature, including Ifit3, Isg15, Stat1, Clec2d, and Ifitm2, was significantly higher in APP/PS1:miR-155cKO mice of both sexes (Fig. 2a–c, Extended Data Fig. 6g–i, and Supplementary Table 2). Gene expression differences between APP/PS1 and APP/PS1:miR-155 cKO clusters were examined using IPA, which showed upregulated pathways related to immune cell functions such as IL-3 and IL-6 signaling, JAK/STAT signaling, phagosome formation, integrin signaling, and the unfolded protein response primarily in the pre-MGnD cluster (Fig. 2d and Extended Data Fig. 6j). These data demonstrate that miR-155 ablation expands the number of microglia in the pre-MGnD cluster and augments the immune pathway enrichment within this cluster.
Fig. 2. miR-155 ablation primes microglial transition to the pre-MGnD cluster through IFN-γ signaling.
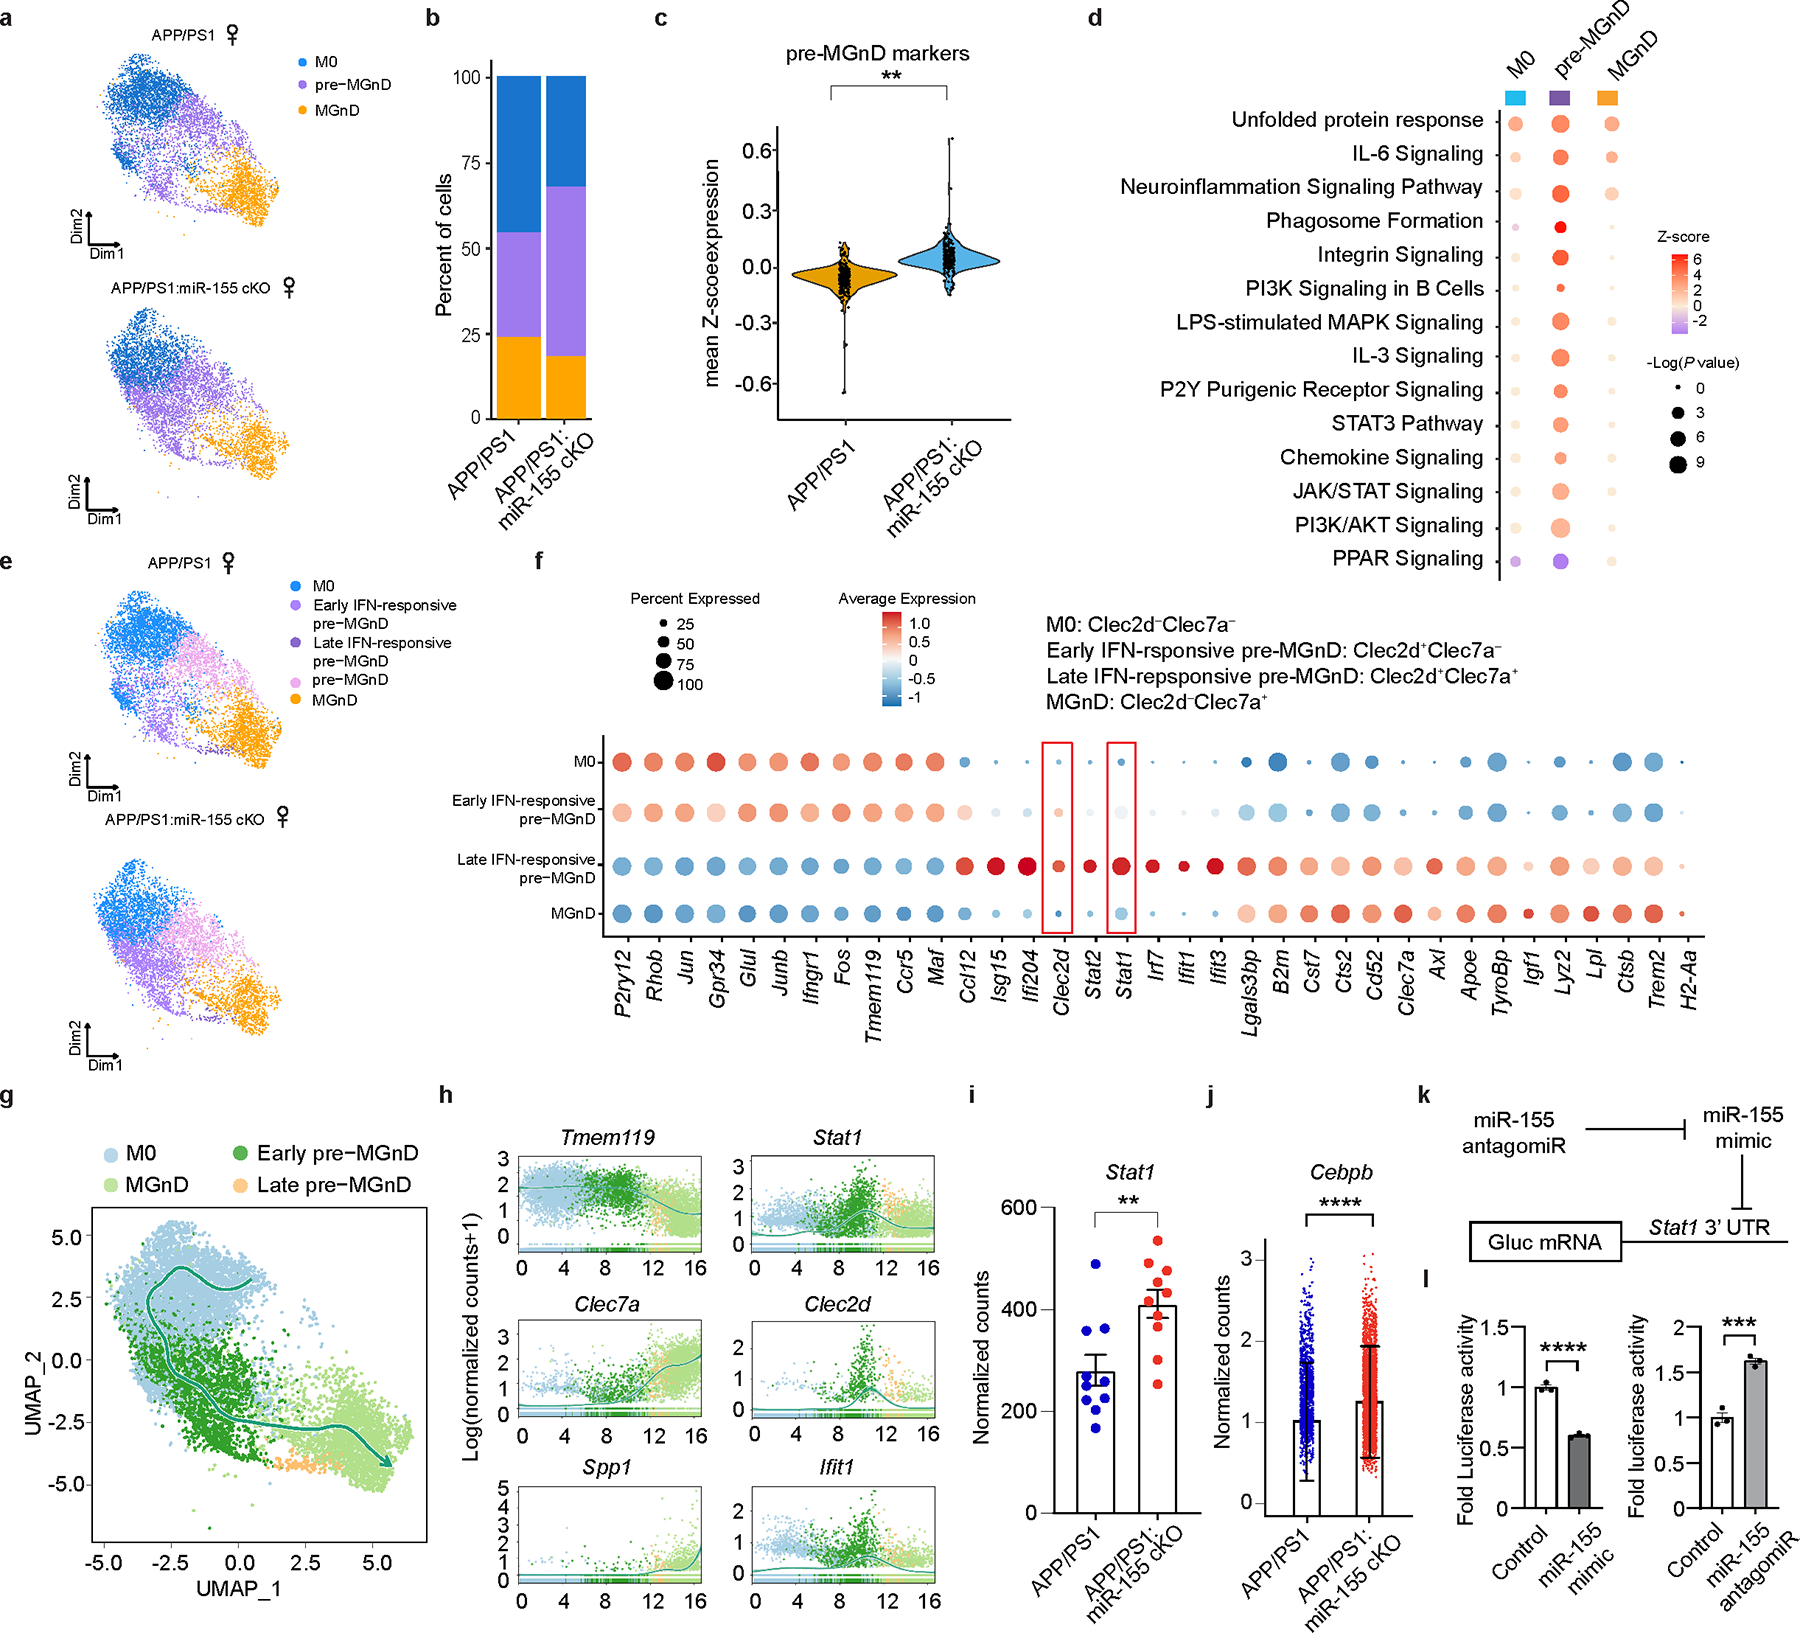
a, UMAP plots of major microglia clusters identified in female APP/PS1 and APP/PS1:miR-155 cKO mice (n = 2 mice per group). b, Bar charts showing relative amounts of each cluster in the experimental and control groups. c, Violin plots showing the mean Z-score of pre-MGnD markers in all the cells from APP/PS1 and APP/PS1:miR-155 cKO mice; P = 6.829469e-12 by Kruskal-Wallis test, FDR corrected using Benjamini Hochberg. d, Top-affected pathways from IPA analysis of all three clusters based on the comparison of APP/PS1:miR-155 cKO microglia vs. APP/PS1 microglia at 4 months of age, Z-Score absolute ⩾ 2 (DEGs were identified with FDR-corrected P < 0.05, Wilcox test). e, UMAP plots analysis of microglia clusters identified in female APP/PS1 and APP/PS1:miR-155 cKO microglia including subclusters of pre-MGnD. f, Dot plot showing top markers for major microglia clusters (M0, early IFN-responsive pre-MGnD, late IFN-responsive pre-MGnD, MGnD). g, Trajectory analysis showing the transition from M0 to MGnD via IFN-responsive pre-MGnD clusters. h, Dynamic plots showing the expression of selected genes in all four major microglia clusters. i, Stat1 normalized counts from bulk microglia RNA sequencing; P = 0.0012 by two-sided Wald test, FDR corrected using Benjamini Hochberg (n = 10 mice per group). j, Comparison of Cebpb expression within the pre-MGnD cluster between APP/PS1 and APP/PS1:miR-155 cKO mice; P = 2.858552e-39 by Kruska-Wallis test, FDR corrected using Benjamini Hochberg (n = 2 mice per group). k, Scheme depicting relationship between miR-155 antagomir, mimic and Gaussia luciferase mRNA with Stat1 3’UTR. l, STAT1 3’ UTR luciferase activity in miR-155 mimic and antagomir transfected cells. Fold changes were calculated as compared to control mimic or antagomir using Student’s unpaired t-test; P < 0.0001 for control vs. miR-155 mimic; P = 0.0006 for control vs. miR-155 antagomiR (n = 3). Data are representative of 2 independent experiments and show biologically independent replicates (l). Data were presented as mean values ± s.e.m. See also Extended Data Figs. 6,7, and Supplementary Table 2.
To further understand the gene signature of each cluster, we measured the expression levels of M0 genes, IFN response genes and MGnD genes within each cluster. The M0 cluster was enriched in homeostatic microglial genes including P2ry12, Tmem119, and Junb (Fig. 2f, Extended Data Fig. 6l, and Supplementary Table 2). Detailed analysis of the pre-MGnD cluster revealed two IFN-responsive early- and late- pre-MGnD clusters showing upregulation of genes including Stat1, Isg15, Ifi204, Irf7, Ifit1, and Ifit3, which strongly resembled the previously determined Interferon Response Microglia (IRM)35 (Fig. 2e,f and Extended Data Fig. 6k,l). Moreover, C-Type Lectin-Receptor-2d (Clec2d), which has been shown to recognize histones released upon necrotic cell death and to mediate inflammation36, was enriched in both early and late pre-MGnD clusters. Interestingly, the early pre-MGnD cluster retained a high expression of M0 genes and low expression of MGnD genes (Fig. 2f and Extended Data Fig. 6l), whereas the late pre-MGnD cluster preferentially expressed several MGnD genes including Clec7a, Apoe, and Axl, and had reduced expression of homeostatic microglial genes. Clec2d and IFN signaling genes, such as Isg15, Ifi204, Stat2, Stat1, Irf7, Ifit1, and Ifit3, were strongly induced in the late pre-MGnD cluster, as compared to early pre-MGnD (Fig. 2f, Extended Data Fig. 6l, and Supplementary Table 2). The MGnD cluster was strongly enriched in MGnD genes including Clec7a, Apoe, Trem2 as compared to the M0, early and late IFN-responsive pre-MGnD clusters, but significantly reduced the expression of Clec2d and IFN-responsive genes (Fig. 2f, Extended Data Fig. 6l, and Supplementary Table 2). We identified Stat1 and Clec2d as the top candidates for IFN-responsive pre-MGnD markers. To validate the effect of microglial miR-155 deletion on the expression of Stat1 and Clec2d, we quantified the amount of Stat1+Iba1+ cells in the cortex of APP/PS1 mice by immunohistochemistry. We found significantly more Stat1+Iba1+ cells in APP/PS1:miR-155 cKO mice as compared to APP/PS1 mice at 4 months of age (Extended Data Fig. 7a,b). We also confirmed that Clec2d is significantly upregulated in isolated APP/PS1 microglia as compared to WT microglia (Extended Data Fig. 7c). Using flow cytometry, we assessed changes in proportion of Clec2d−Clec7a− (M0), Clec2d+Clec7a− (early pre-MGnD), Clec2d+Clec7a+ (late pre-MGnD), and Clec2d−Clec7a+ (MGnD) microglia (Extended Data Fig. 7d) and detected a higher percentage of early and late pre-MGnD in APP/PS1 mice as compared to WT mice (Extended Data Fig. 7e). In addition, the percentage of early and late pre-MGnD were increased in APP/PS1 mice during aging (Extended Data Fig. 7e). Furthermore, qPCR analysis showed a significant upregulation of Clec2d and downregulation of P2ry12 in the early- and late-pre-MGnD clusters (Extended Data Fig. 7f). Taken together, we identified Stat1 and Clec2d as markers for pre-MGnD clusters.
To confirm whether homeostatic microglia transitioned towards mature MGnD via IFN-responsive early- and late-pre-MGnD, we applied pseudo time analysis to M0, IFN-sensitive pre-MGnD and MGnD cells. We found that homeostatic microglia progressed towards mature MGnD via the early and late pre-MGnD clusters, in both sexes (Fig. 2g and Extended Data Fig. 6m). Dynamic expression plots confirmed that Stat1, Clec2d, and Ifit1 were temporarily expressed in early- and late-pre-MGnD along pseudo time lineage from M0 to MGnD (Fig. 2h and Extended Data Fig. 6n). Taken together, these data demonstrate that microglia transition from homeostatic to MGnD via an IFN-responsive intermediate state, and that miR-155 ablation enhances the size and immune response features of this pre-MGnD state.
IFNγ is regulated by miR-155 and induces pre-MGnD signature
We next investigated how IFNγ signaling regulates the transition from M0 to pre-MGnD and MGnD microglia. miR-155 regulates IFN signaling in CD8+ human T cells and STAT1 expression37. We determined increased Stat1 expression in bulk RNAseq data and pre-MGnD in scRNAseq data from APP/PS1:miR-155 cKO microglia (Figs. 1c, 2f and i). In addition to Stat1, we also observed increased expression of CCAT Enhancer Binding Protein Beta (Cebpb) in pre-MGnD cluster microglia from APP/PS1:miR-155 cKO mice, compared to APP/PS1 microglia (Fig. 2j). C/EBP-β encodes a pleiotropic transcription factor which regulates IFNγ signaling and is a target of human miR-15538, 39. To verify whether miR-155 targets Stat1, we generated a plasmid encoding Gaussia luciferase (Gluc) with the 3’UTR of Stat1 and transfected this construct into murine N9 microglial cells with miR-155 mimic or antagomir (Fig. 2k and Extended Data Fig. 8a). We observed marked repression of Gluc signal when the Gluc plasmid was co-transfected with miR-155 mimic and induction of Gluc signal when co-transfected with miR-155 antagomir. There is no effect on the control Gluc plasmid or a Gluc construct carrying the mutated 3’UTR of Stat1 (Fig. 2l and Extended Data Fig. 8b,c). We also co-transfected non-mutated 3’UTR of Stat1 with a non-targeting miRNA, miR-18, which showed no effect on luciferase activity (Extended Data Fig. 8d). Taken together, the results indicate that miR-155 targets the 3’UTR of Stat1 to repress mRNA expression and implicates de-repression of IFNγ−related transcription factors by miR-155 ablation as a potential mechanism for enhanced IFN response in miR-155 cKO microglia.
Next, we investigated how IFNγ signaling was involved in transition from M0 to pre-MGnD and MGnD microglia in acute neurodegeneration using our previously described MGnD paradigm7. We injected fluorescently labeled apoptotic neurons into the cortex and hippocampus of Cx3cr1CreERT2/+:Ifngr1fl/fl (Ifngr1 cKO) mice treated with TAM one month prior to the injection of apoptotic neurons. Phagocytic and non-phagocytic microglia were isolated 16hr post-injection for Smartseq2 RNAseq. We observed reduced expression of MGnD genes in phagocytic Ifngr1 cKO microglia (Fig. 3a,b and Supplementary Table 3). We cross referenced genes that were downregulated in Ifngr1 cKO phagocytic microglia with upregulated DEGs in APP/PS1:miR-155 cKO mice (Fig. 1c and Extended Data Fig. 8e) and identified a substantial overlap (Extended Data Fig. 8f). To verify that IFNγ signaling is directly involved in the effect of miR-155 deletion on microglia phenotype, we treated WT and miR-155 cKO mice with anti-IFNγ blocking antibody40 or IgG isotype control, followed by stereotaxic injection of apoptotic neurons in the cortex and hippocampus, and detected concordant transcriptomic changes of isolated microglia by bulk RNAseq (Fig. 3c). Furthermore, we observed enhanced mean fluorescence intensity (MFI) of phagocytic microglia in miR-155 cKO mice compared to WT phagocytic microglia, which was suppressed by IFNγ blocking antibody (Fig. 3d). In the IgG control group, miR-155 cKO phagocytic microglia showed enhanced gene signature associated with IFN response, antigen presentation and phagocytosis (Fig. 3e). We cross-compared the enhanced gene cluster in miR-155 cKO phagocytic microglia with upregulated MGnD genes in APP/PS1:miR-155 cKO microglia as compared to APP/PS1 microglia. Interestingly, the common DEGs were associated with IFN signaling, antigen presentation, and phagocytosis (Fig. 3f), which were suppressed by the administration of IFNγ blocking antibody (Fig. 3g). Taken together, these data demonstrate that there is a significant overlap in genes affected by miR-155 cKO and IFNγ manipulation, and that IFNγ blockade suppresses microglial phagocytosis and microglial response to MGnD induction in miR-155 cKO mice.
Fig. 3. Targeting IFNγ signaling abolishes the beneficial effect of miR-155 deletion in response to phagocytic stress.
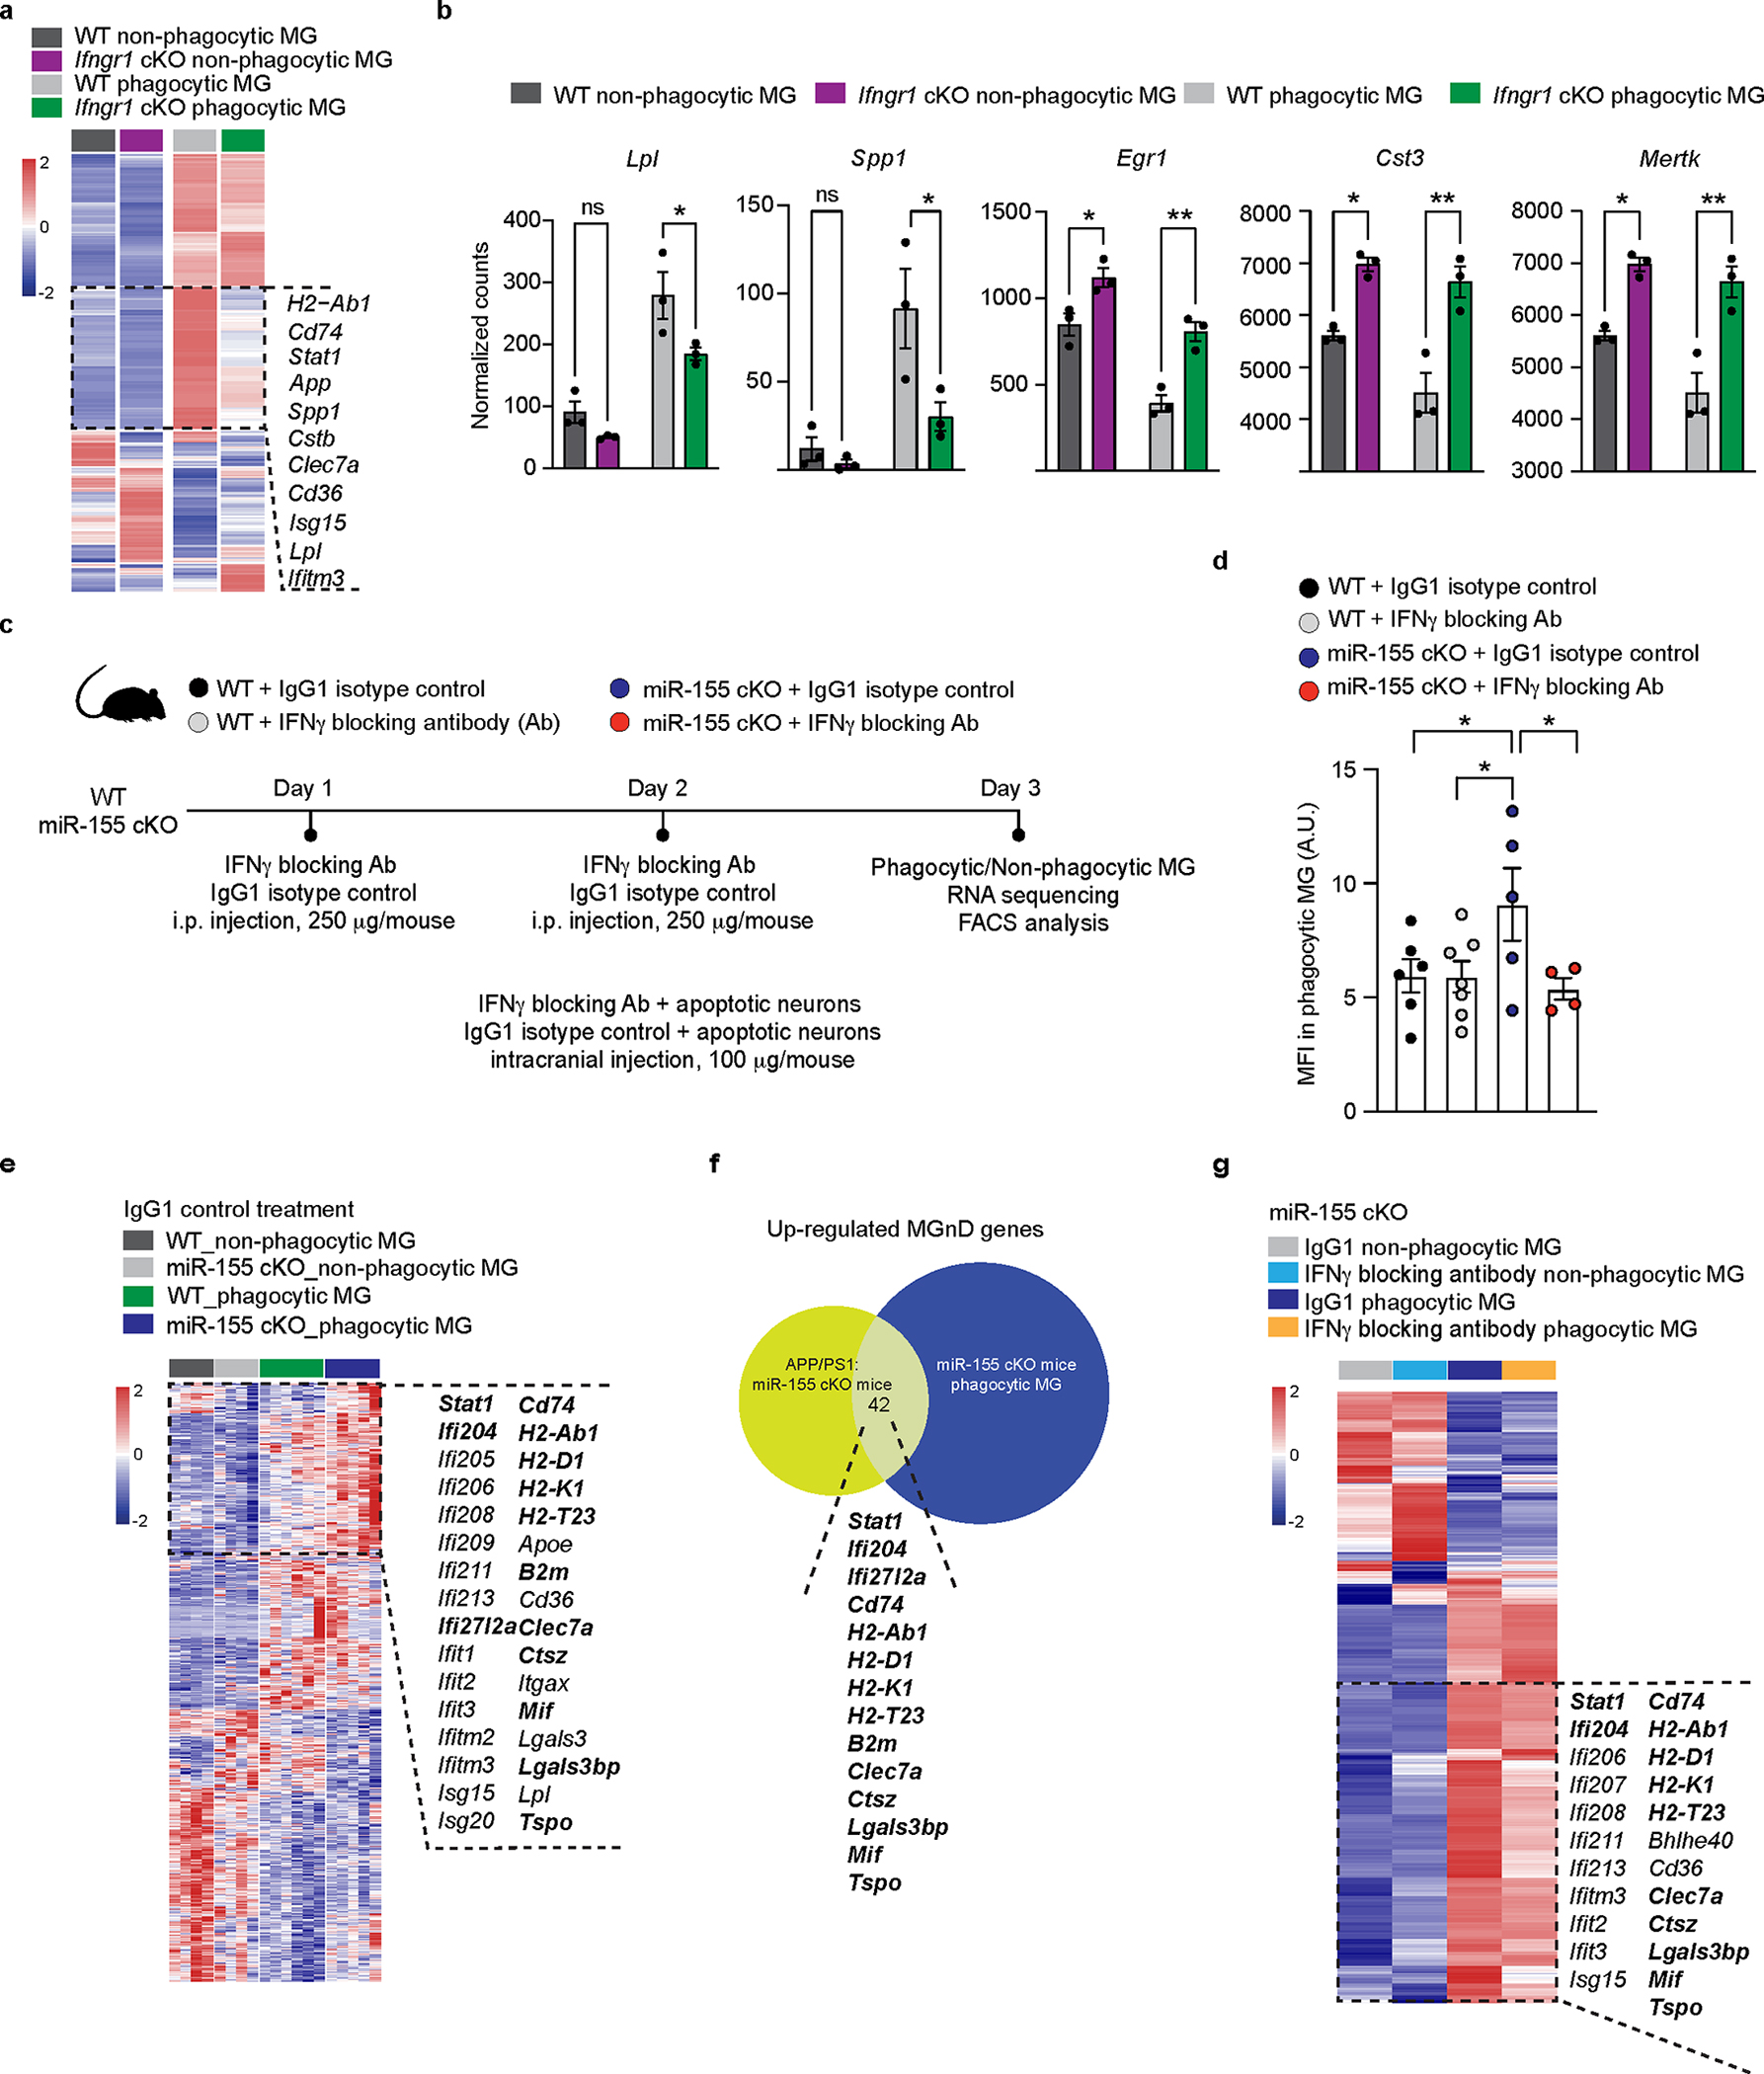
a, Heatmap of DEG in phagocytic and non-phagocytic microglia isolated from WT and Ifngr1 cKO mice using DESeq2 analysis. Two-sided LRT statistical test with an FDR-corrected P < 0.05, n = 3 mice per group. b, Bar graphs depicting expression levels of select genes from (a) using two-way ANOVA with Holm-Sidak post hoc analysis, P = 0.042 for Lpl, P = 0.0331 for Spp1, P = 0.0031 for Egr1, P = 0.0018 for Cst3 and Mertk (n = 3 mice). c, Experimental design. d, FACS analysis showing decreased MFI of phagocytic microglia in the IFNγ blocker group as compared to IgG group in miR-155 cKO mice using One-way ANOVA; P = 0.0235 using One-way ANOVA (n = 6 mice for WT + IgG1 group; n = 7 mice for WT + IFNγ Ab group; n = 5 mice for miR-155 cKO + IgG1 group; n = 4 mice for miR-155 cKO + IFNγ Ab group). e, Heatmap showing enhanced response to apoptotic neurons after the deletion of miR-155. DEGs were identified using DESeq2 analysis with FDR-corrected P < 0.05 (n = 4–6 mice per group). f, Common genes between DEGs from top cluster shown in e and upregulated DEGs from APP/PS1:miR-155 cKO vs. APP/PS1 mice (Fig. 1c). g, Heatmap of decreased genes caused by IFNγ blocker overlapping with the genes shown in f using DESeq2 analysis with two-sided LRT, FDR-corrected P < 0.05 (n = 4–7 mice per group). The common gene among e, f and g were labeled in bold. Data were presented as mean values ± s.e.m. See also Extended Data Fig. 8, and Supplementary Table 3.
miR-155 deficient microglia restrict Aβ pathology
Next, we tested the differences in Aβ-plaque load between APP/PS1 and APP/PS1:miR-155 cKO mice. We observed a significant reduction in 6E10+ Aβ plaque number and area in APP/PS1:miR-155 cKO brains at 4 months (Extended Data Fig. 9a,b), but not at 8 months (Extended Data Fig. 9c). At 4 and 8 months of age, there is no difference in the area occupied by thioflavin-S staining between the two groups (Extended Data Fig. 9d–f). It has been previously reported that global miR-155 knockout leads to enhanced plaque formation in APP/PS1 mice28. To determine whether increased plaque deposition leads to enhanced MGnD signature observed in bulk and scRNAseq data, we measured the area of Thioflavin-S+ compact plaques and HJ3.4B+ amyloid plaques at 2.5 months of age. No difference in plaque load was detected between APP/PS1:miR-155 cKO and APP/PS1 mice (Extended Data Fig. 9g–j). To determine if miR-155 cKO microglia have enhanced phagocytic capacity, we induced MGnD and measured microglial phagocytosis of apoptotic neurons in vivo (Extended Data Fig. 9k). We injected apoptotic neurons into 8-months-old WT and miR-155 cKO mouse brains and isolated microglia after 16hr. We found a significantly enhanced uptake of apoptotic neurons in miR-155 cKO microglia (Extended Data Fig. 9l). Furthermore, we assessed the amount of internalized 6E10+ Aβ in Clec7a+ MGnD microglia using Imaris Bitplane 3D surface renderings. We found enhanced phagocytosis of Aβ by Clec7a+ microglia in 4-month-old APP/PS1:miR-155 cKO mice compared to controls (Fig. 4a,f), which was not detected in 8-month-old mice (Fig. 4f). To assess microglia migration to plaque lesions, we evaluated the area of Tmem119 signal within the plaque lesion area. We found an increase in the amount of Tmem119 signal in APP/PS1:miR-155 cKO mice (Fig. 4b,g). Taken together, these data demonstrate that APP/PS1:miR-155 cKO microglia are more responsive to Aβ plaques at early disease stage.
Fig. 4. miR-155 deficient microglia restrict Aβ pathology.
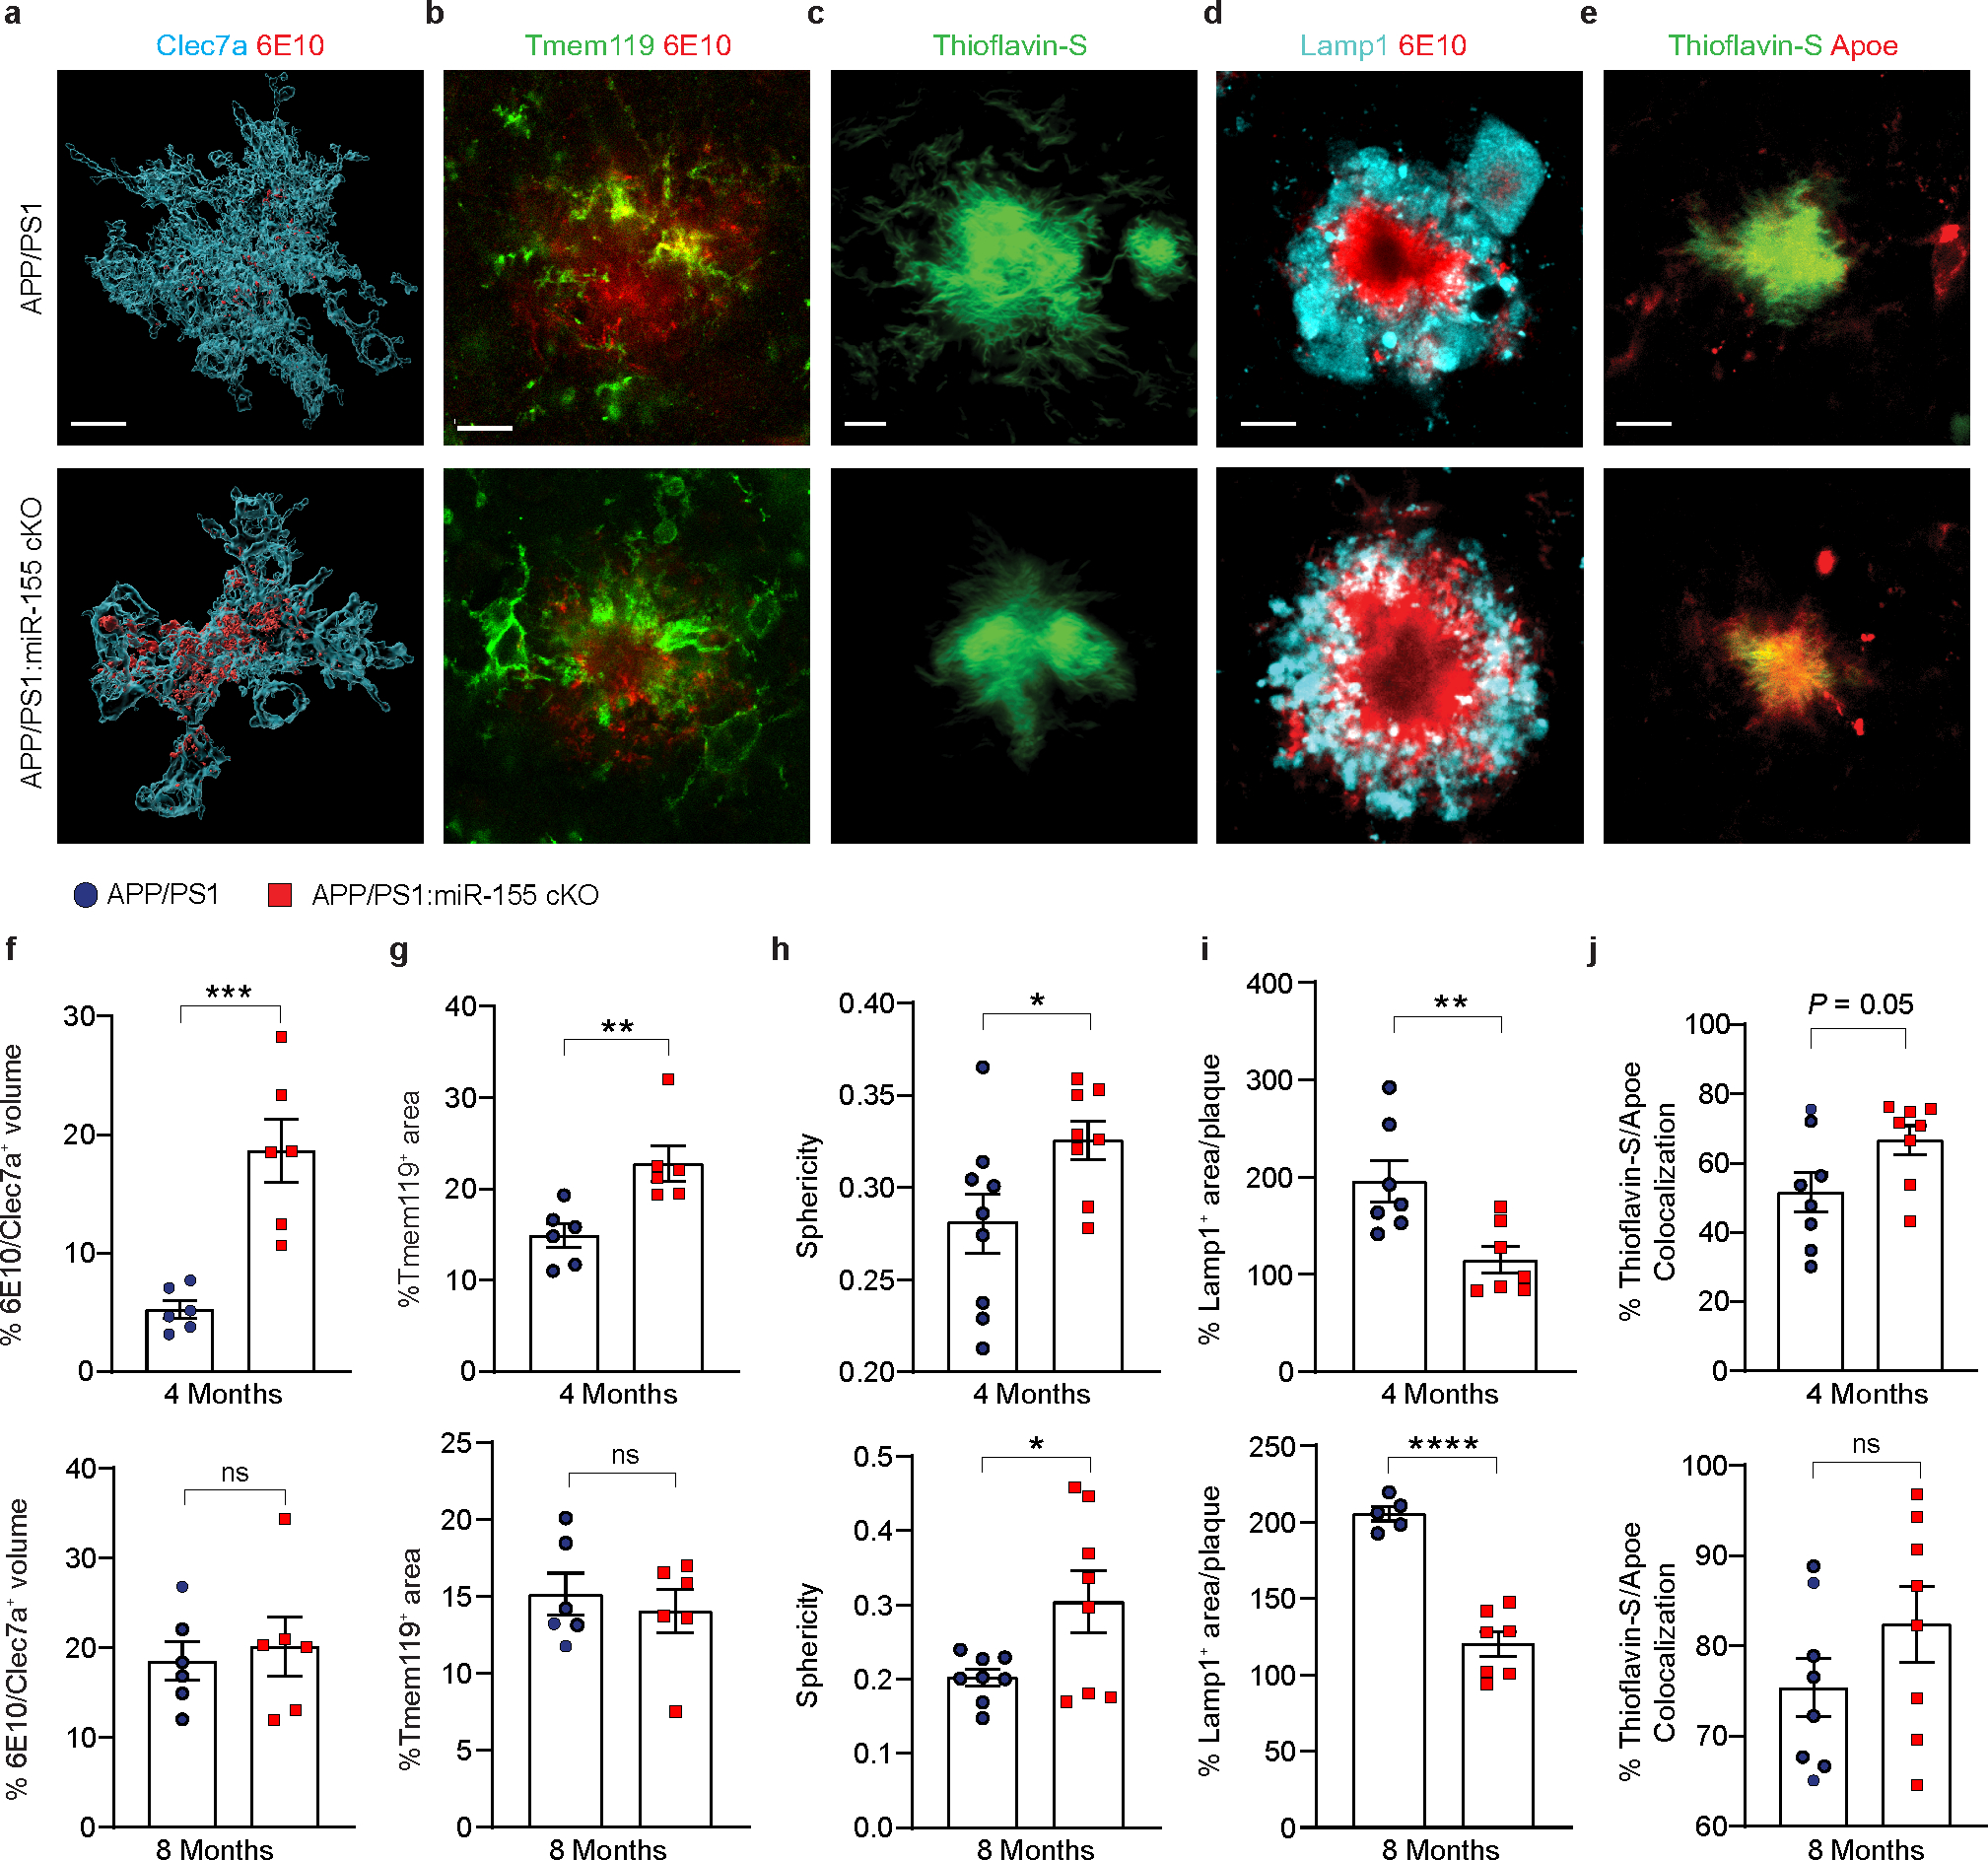
a, Imaris 3D renderings of Clec7a positive microglia and 6E10 at 4 months of age. Scale bar: 20 μm. b, IHC of Tmem119 and 6E10 showing microglial migration to plaque lesions. Scale bar: 10 μm. c, High-resolution image of Thioflavin-S+ plaques in 4-month-old APP/PS1 and APP/PS1:miR-155 cKO mice. Scale bar: 15 μm. d, Representative images of 6E10/Lamp1 co-staining in APP/PS1 and APP/PS1:miR-155 cKO mice. Scale bar: 20 μm. e, Representative images of Thioflavin-S and ApoE co-staining. Scale bar: 15 μm. f, Quantification of % 6E10/Celc7a volume at 4 (P = 0.0007 by two-tailed Students unpaired t-test test) and 8 months of age (P = 0.6876 by two-tailed Student’s unpaired t-test), n = 6 mice per group. g, Quantification of Tmem119 positive area/plaque in 4-month-old (P = 0.0063 by two-tailed Student’s unpaired t-test) and 8-month-old mice (P = 0.5687 by two-tailed Student’s unpaired t-test), n = 6 mice per group. h, Quantification of sphericity in 4-month-old (P = 0.0360 by two-tailed Student’s unpaired t-test) and 8-month-old mice (P = 0.0342 by two-tailed Student’s unpaired t-test) APP/PS1 and APP/PS1:miR-155 cKO mice. n = 9 APP/PS1, n = 8 APP/PS1:miR-155 cKO at 4 months old; n = 8 mice per group at 8 months old. i, Quantification of 6E10-associated Lamp1 in 4-month-old (P = 0.0079 by two-tailed Student’s unpaired t-test) and 8-month-old (P < 0.0001 by two-tailed Student’s unpaired t-test) groups. n = 7 mice per group at 4 months old; n = 5 mice for APP/PS1 group; n = 7 mice for APP/PS1:miR-155 cKO group at 8 months old. j, Quantification of plaque associated ApoE at 4 and 8 months of age using two-tailed Mann-Whitney test (n = 8 mice per group). Data were presented as mean values ± s.e.m. See also Extended Data Fig. 9.
We next investigated the morphological changes in the Aβ plaques of APP/PS1:miR-155 cKO mice. Since Trem2 is essential for inducing the transformation to MGnD/DAM7, 8, we reasoned that MGnD may be involved in plaque compaction and barrier formation, and that this process is enhanced in APP/PS1:miR-155 cKO mice. To measure dense-core plaque sphericity, we used Imaris Bitplane 3D surface renderings to measure plaque sphericity (Fig. 4c). We observed a significant increase in the sphericity of Thioflavin-S+ compact plaques in APP/PS1:miR-155 cKO mice at both 4 and 8 months of age (Fig. 4h). Plaque sphericity has been shown to correlate with dystrophic neurites, which can be visualized by Lamp1 staining12, 13. We found a decrease in plaque associated dystrophic neurites in APP/PS1:miR-155 cKO mice at 4 and 8 months, validating that plaque sphericity corresponded with changes in dystrophic neurites (Fig. 4d,i).
Trem2 function has also been tied directly to the level of plaque-associated ApoE41. ApoE can be secreted, attach directly to Aβ plaques, and is a major component of amyloid plaques41. To determine the level of plaque-associated ApoE in APP/PS1:miR-155 cKO mice, we took confocal images of ApoE co-localized with Aβ-plaques (Fig. 4e). We masked ApoE signal in non-plaque region and found a trend towards increased number of co-localized ApoE+/Thioflavin-S+ voxels in plaques at 4 months (P = 0.05) (Fig. 4j). Taken together, these data indicate that miR-155 deficient microglia restrict Aβ induced brain damage by increasing plaque sphericity and compaction.
Enhanced synaptic preservation in APP/PS1:miR-155 cKO mice
To investigate the effect of microglial miR-155 on the brain milieu, we utilized the whole brain tissue from all four male groups at 4 and 8 months of age for tandem mass-tag quantitative proteomics (Fig. 5a–c, Extended Data Fig. 10, and Supplementary Table 4). GO analysis of differentially expressed proteins (DEPs) showed suppressed synaptic signaling in APP/PS1 mice compared to WT mice, such as chemical synaptic signaling and regulation of synaptic plasticity (Fig. 5b). These effects on synaptic signaling were reversed in APP/PS1:miR-155 cKO mice to the levels of WT mice (Fig. 5b). IPA canonical pathway analysis of DEPs showed that synaptogenesis signaling was enhanced in the brain milieu of APP/PS1:miR-155 cKO mice at both ages, compared to APP/PS1 mice (Fig. 5d). We validated these findings by immunohistochemistry of synaptic molecules and found significantly more synapses preserved in cortical peri-plaque regions in 8-month-old APP/PS1:miR-155 cKO mice as compared to APP/PS1 mice (Fig. 5e,f). These results show that deletion of microglial miR-155 enhanced synaptic preservation in the brain milieu of APP/PS1 mice.
Fig. 5. Deletion of microglial miR-155 enhanced synaptic functions in the brain milieu of APP/PS1 mice at 4 and 8 months of age.
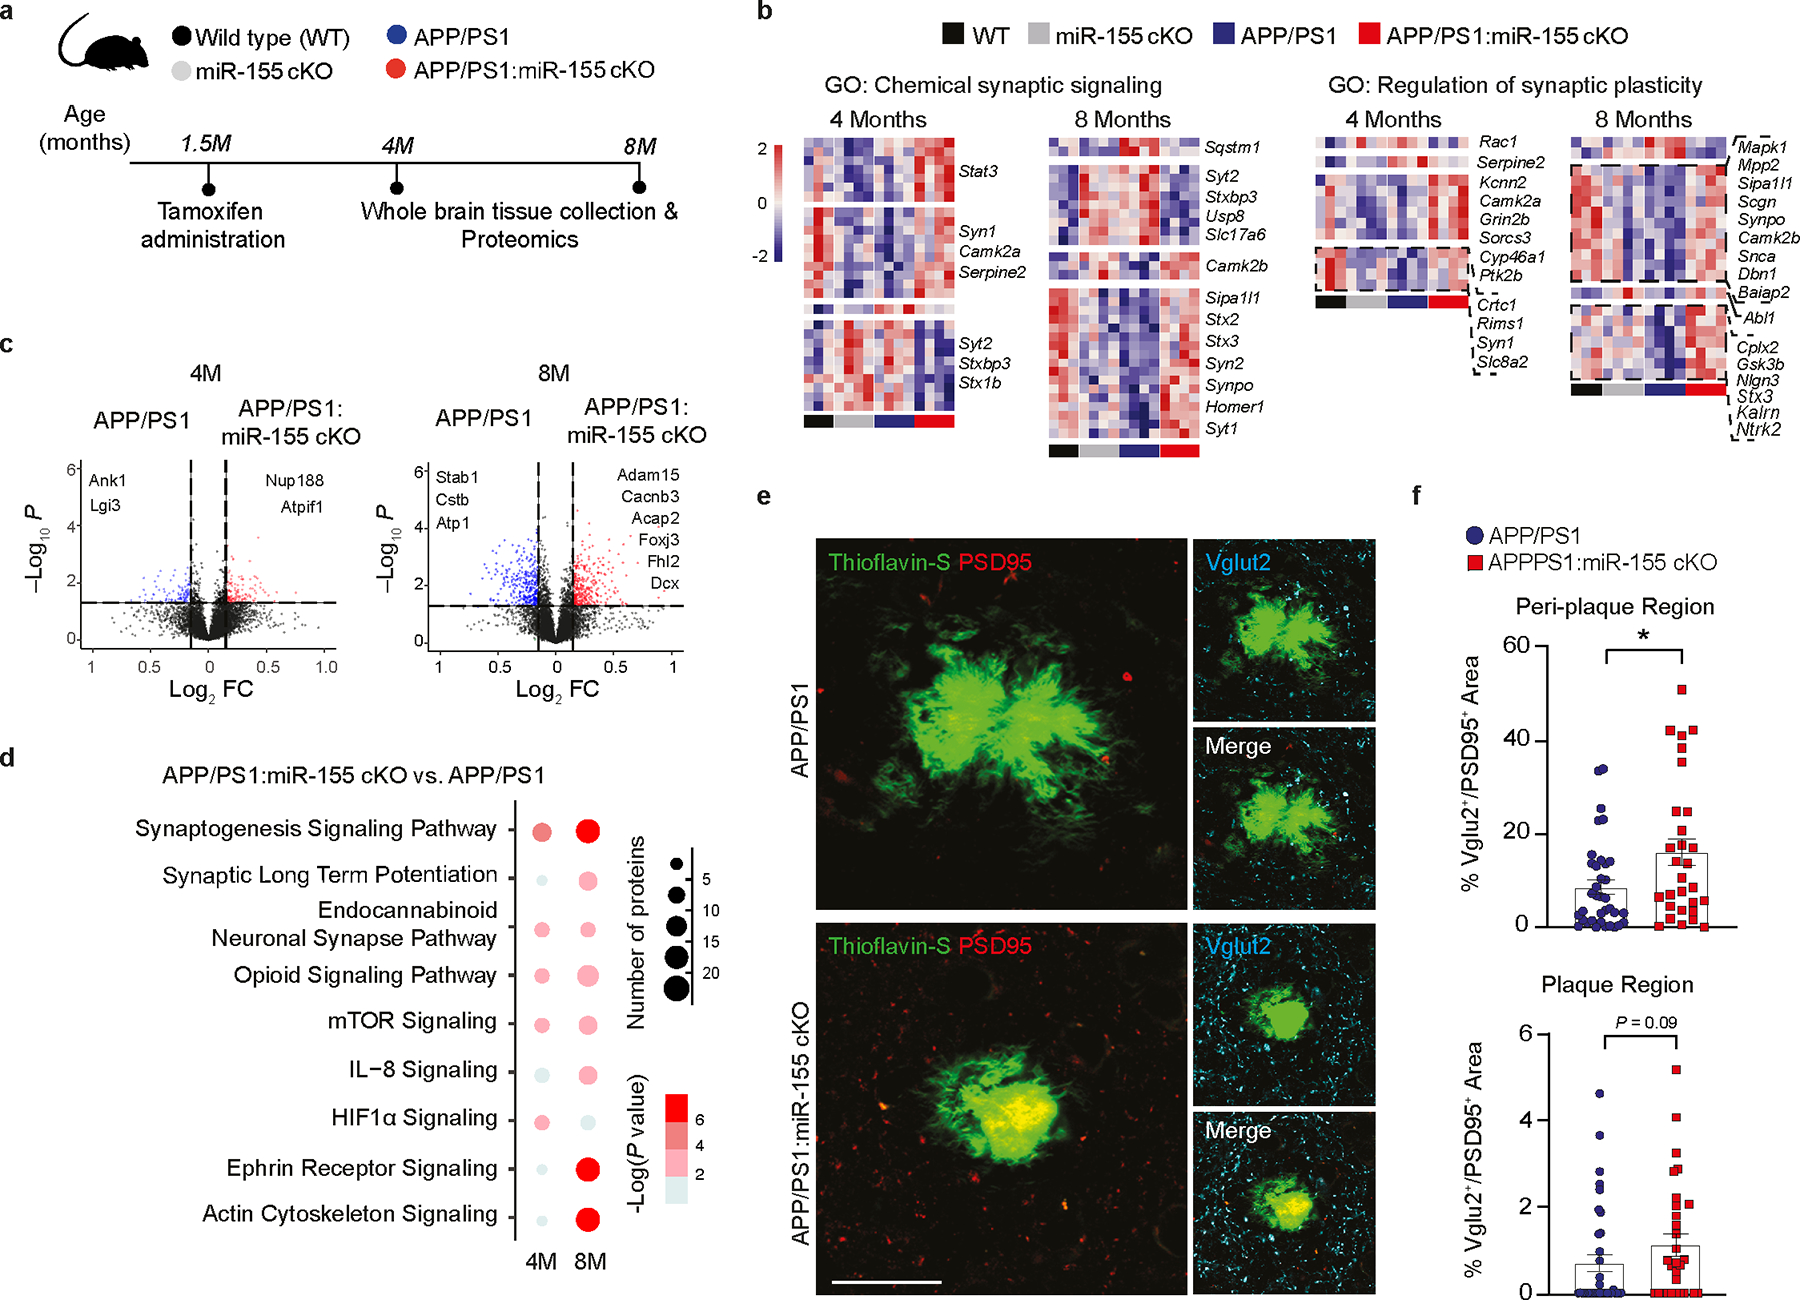
a, Proteomic analysis of whole-brain tissue experimental design. b, Heatmaps of DEPs from GO terms using one-way ANOVA (n = 3–4 male mice per group). c, Volcano plots of DEPs between APP/PS1:miR-155 cKO and APP/PS1 whole brain tissue, P < 0.05 using two-sided Wald test. d, Selected pathways from IPA analysis on DEPs between APP/PS1:miR-155 and APP/PS1 whole-brain tissue (Z-Score absolute ≥ 2). e, Representative images of synaptic proteins PSD95, Vglut2, and Thioflavin-S in cortex plaques of 8-month-old APP/PS1:miR-155 cKO and APP/PS1 mice. Scale bar: 20 μm. f, Quantification of the percentage of colocalized area of Vglut2/Psd95 in the plaque and peri-plaque regions of 8-month-old mice compared using two-tailed Mann-Whitney test, P = 0.0275, 36 plaques from APP/PS1 (n = 6) mice and 29 plaques from APP/PS1:miR-155 cKO (n = 5) mice. Data were presented as mean values ± s.e.m. See also Extended Data Fig. 10 and Supplementary Table 4.
miR-155 ablation rescues behavioral deficits in APP/PS1 mice
Previous studies have found that APP/PS1 mice exhibit cognitive impairment beginning at 7–8 months of age32, 42. APP/PS1 mice at 8 months of age showed reduced spontaneous alternation (SA) compared to non-transgenic mice in the Y-maze task (Fig. 6a,c), indicating an impairment in visuospatial working memory. Notably, APP/PS1:miR-155 cKO mice showed rescued performance in the SA task, and miR-155 cKO had no effect in non-transgenic mice. To confirm the beneficial effect of microglia-specific miR-155 deletion on a separate domain of the cognitive function, we employed the forced alternation (FA) task to assess spatial recognition memory. APP/PS1 mice at 8 months of age did not demonstrate a significant preference to enter the novel arm, indicating an impairment in recognition memory (Fig. 6b,d). In contrast, APP/PS1:miR-155 cKO mice exhibited a preference for the novel arm over the familiar arms, confirming restoration of functional recognition memory. The total number of arm entries was not significantly different between APP/PS1 and APP/PS1:miR-155 cKO mice. While both APP/PS1 and APP/PS1 miR-155 cKO mice showed greater distance traveled compared to WT controls, APP/PS1:miR-155 cKO mice did not differ from APP/PS1 mice in baseline locomotor activity or the amount of time spent in the center zone in the open field task (Fig. 6e,f). While these results indicate that improved performance was not attributed to differences in locomotor activity or anxiety status, functional recognition memory was restored APP/PS1:miR-155 cKO mice.
Fig. 6. Microglia specific miR-155 ablation rescues cognitive function in APP/PS1 mice.
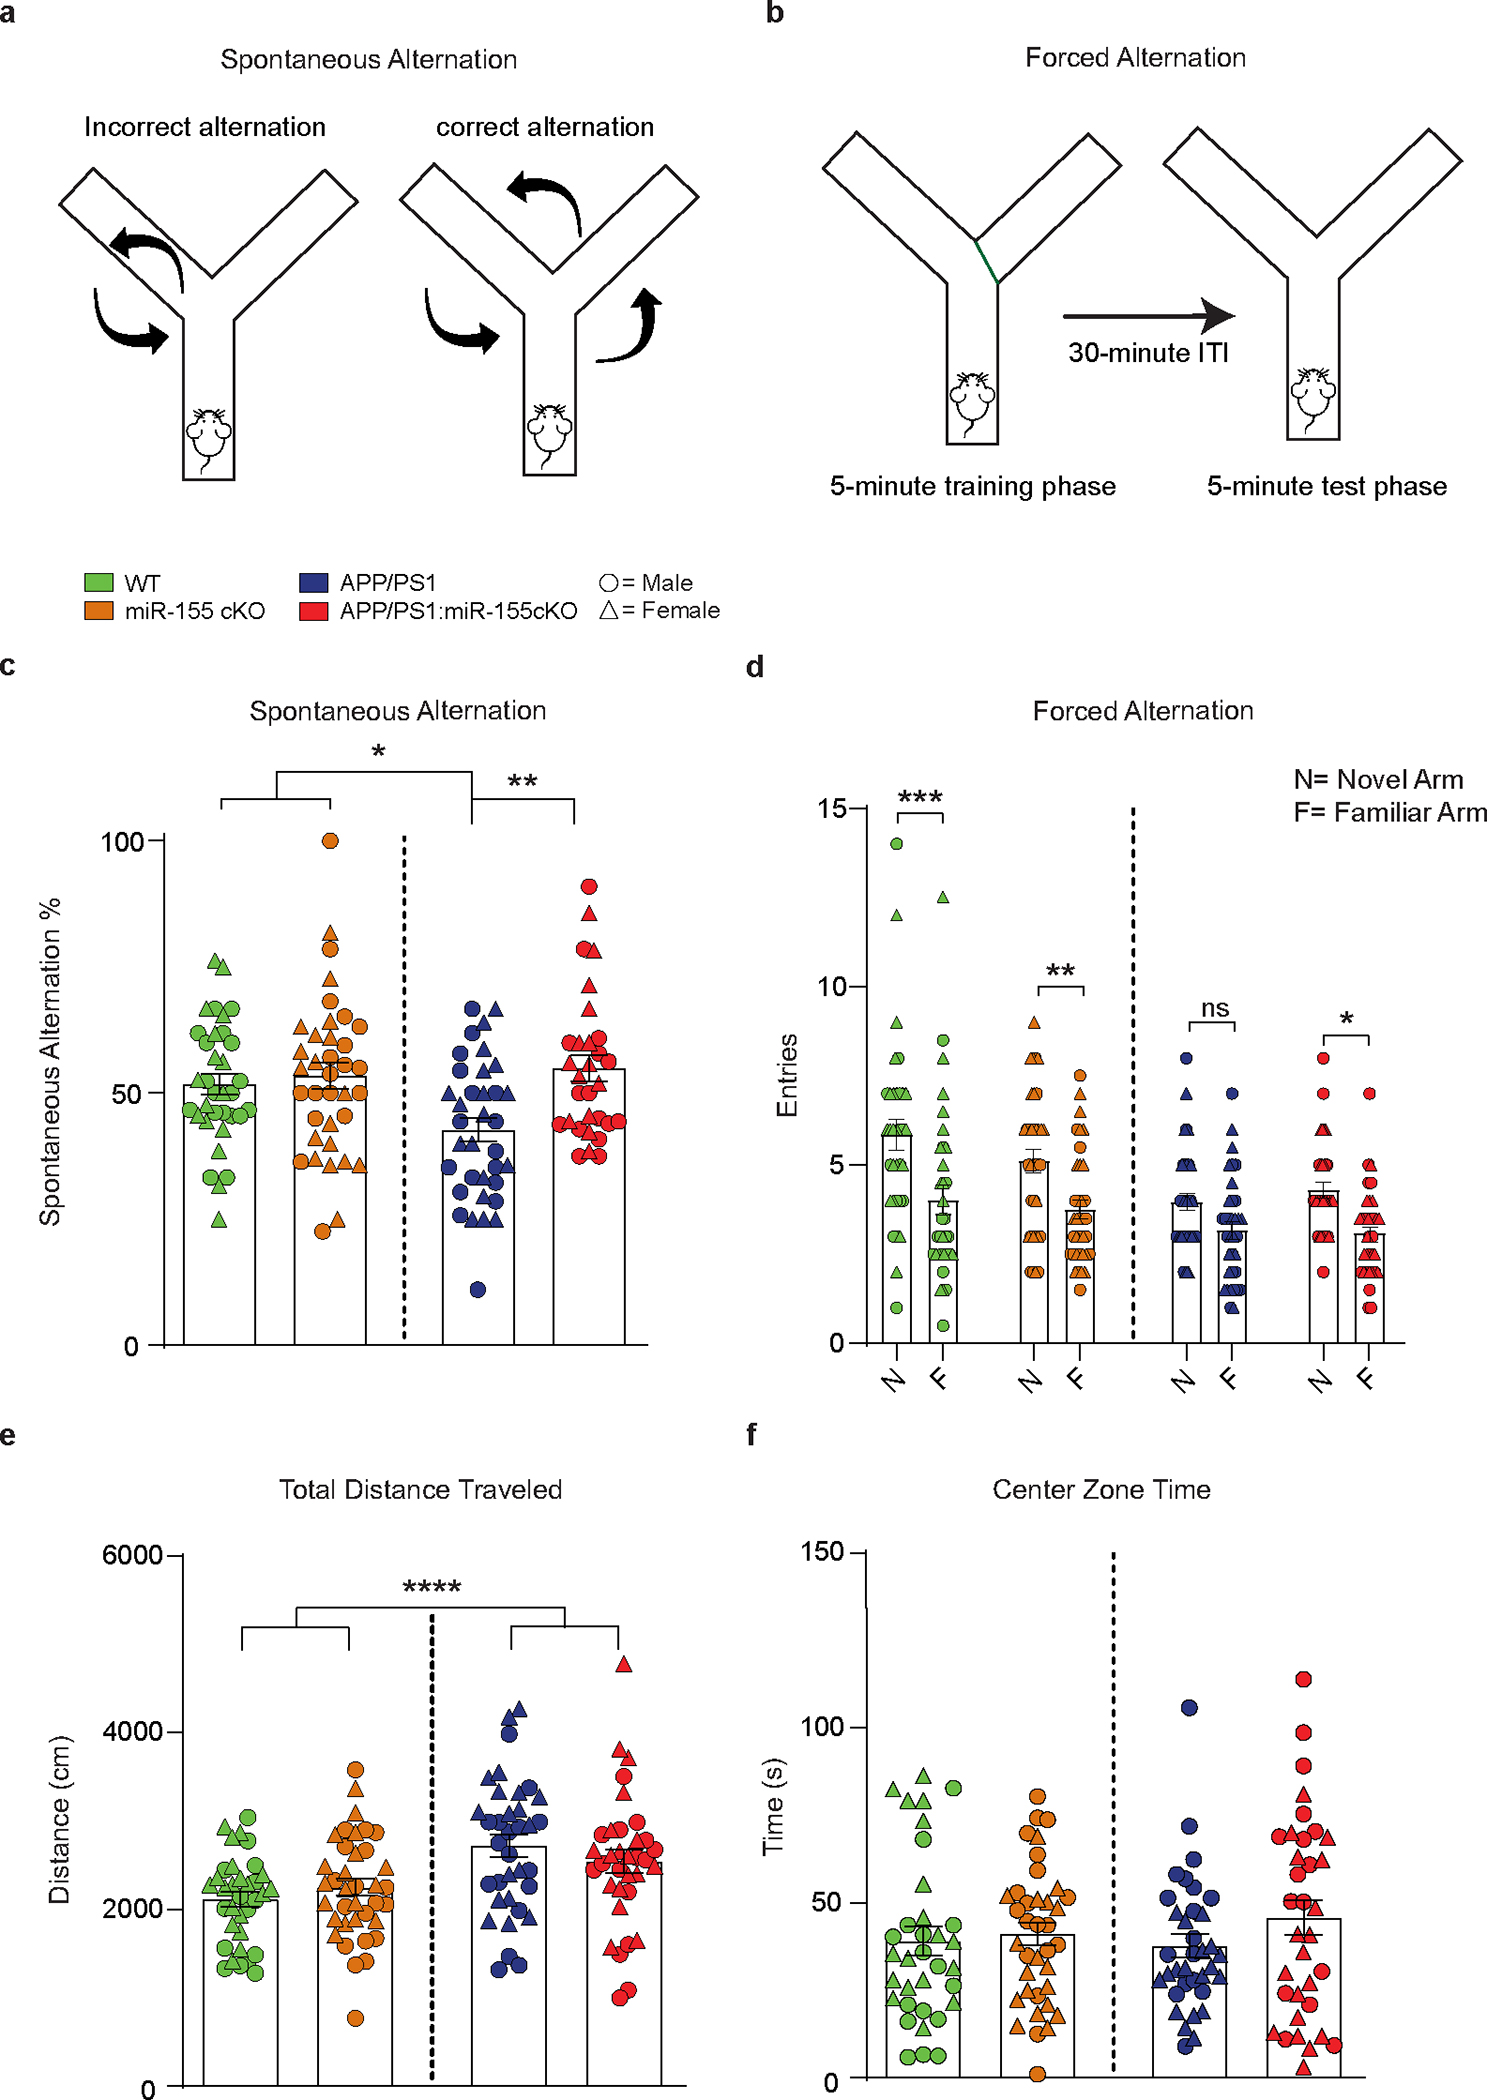
a, Illustration for spontaneous alternation test. b, Illustration for forced alternation test. ITI: inter trial interval. c, Quantification of % correct spontaneous alternations in the Y-maze SA for 8-month-old WT and APP/PS1 mice with and without microglia specific miR-155 ablation. Two-way ANOVA with Tukey’s post hoc test, APP/PS1 vs. APP/PS1:miR-155 cKO, P = 0.004 (n = 34 WT, n = 36 miR-155 cKO, n = 35 APP/PS1 and n = 30 APP/PS1:miR-155 cKO mice). d, FA task was used to assess recognition memory in WT and APP/PS1 mice. The number of entries into the novel arm versus the average number of entries into the familiar arms was compared for each mouse by repeated measure three-way ANOVA with Bonferoni’s post hoc test, WT P = 0.0002, miR-155 cKO P= 0.0064, APP/PS1 P = 0.2361, APP/PS1:miR-155 cKO P = 0.0212 (n = 34 WT, n = 36 miR-155 cKO, n = 35 APP/PS1 and n = 30 APP/PS1:miR-155 cKO mice). e, Total distance traveled over time in the open field locomotor activity task. Main effect of APP transgene by two-way ANOVA, WT vs. APP/PS1, P < 0.0001; APP/PS1 and APP/PS1:miR-155 cKO are not statistically different by two-way ANOVA with Bonferoni’s post hoc test (n = 34 WT, n = 37 miR-155 cKO, n = 35 APP/PS1 and n = 29 APP/PS1:miR-155 cKO mice). f, Center zone time for WT and APP/PS1 mice. There were no statistically significant differences between any groups by two-way ANOVA with Bonferoni’s post hoc test (n = 34 WT, n = 37 miR-155 cKO, n = 35 APP/PS1 and n = 29 APP/PS1:miR-155 cKO mice). Data were presented as mean values ± s.e.m.
Discussion
Here we demonstrate that microglial-specific deletion of miR-155 potentiates the transition from homeostatic to pre-MGnD microglia and enhances microglial immune functions within the pre-MGnD cluster. Furthermore, we found an important role of miR-155 in regulating IFNγ signaling which governs the transition from homeostatic to pre-MGnD and MGnD. Previous scRNAseq studies characterizing microglia in disease and aged mouse models have identified cellular clusters enriched in IFN response genes35, 43. Our trajectory analysis and biological experiments modulating IFNγ signaling demonstrate that the IFNγ pathway directly modulates the transition from M0 to pre-MGnD state. Previous work identified a microglial population similar in transcriptional signature to the pre-MGnD microglia identified in this study, which the authors referred to as “DAM 1” microglia and were induced via an unidentified Trem2-independent mechanism8. Our study demonstrates that IFNγ signaling comprises at least one mechanism by which microglia are polarized into pre-MGnD microglia. Furthermore, our study suggests that pre-MGnD microglia serve as restrictors of plaque associated pathology, highlighting a therapeutically relevant role for this cluster in rescuing cognitive function.
Understanding of the unique microglial populations that exist in the AD brain will be crucial for developing microglia-based therapies for AD. While the identity of microglial clusters in different diseases is still an active area of investigation, our scRNAseq results and published data8, 35, 44–46 indicate that there are at least 3 broad states into which microglia can be grouped in mouse models of AD: homeostatic, pre-MGnD, and MGnD. In this study, we identified the transcriptional changes which define the pre-MGnD population, and found that the IFN-responsive pre-MGnD population is increased in APP/PS1:miR-155 cKO mice. Activation of several immune response pathways suggests that the pre-MGnD clusters in APP/PS1:miR-155 cKO mice are more responsive to Aβ accumulation and efficient at restricting Aβ pathology than that of APP/PS1 mice. Comparatively, the size and the gene signature of the MGnD population was only negligibly changed between APP/PS1 and APP/PS1:miR-155 cKO mice, suggesting that the enhanced protection observed in APP/PS1:miR-155 cKO brains was conferred by the enhanced pre-MGnD cluster. A future area of investigation will be to assess functional differences between the pre-MGnD and MGnD clusters.
One important consideration of this study is its relevance to human disease. miR-155 is conserved between mice and humans, suggesting its conserved gene regulatory function24. Additionally, increased miR-155 expression has been observed in mouse models of AD and in hippocampal tissue from AD donors28, 47. Other previous studies have shown no differential expression of miR-155 in AD brains48–50. In one study, the authors observed neuronal expression of miR-155 through in situ hybridization, although intracerebroventricular infusion of miR-155 in non-tg mice had no effect on learning behavior47. Additional study found that APP/PSEN1 mice with global miR-155 KO showed a greater plaque load than APP/PSEN1 controls28. The predicted targets of miR-155 were significantly enriched in GO categories related to immune responses47. These results suggest that neuronal disruption of miR-155 could modulate pathways related to amyloid deposition and accumulation in neurons, and that on a broad functional level miR-155 deregulation may be associated with AD progression. We detected miR-155 in microglia, and a previous study showed that miR-155 expression was highly specific to cells of hematopoietic origin51. Other literature indicated that miR-155 signal in human perilesional cortex following traumatic brain injury was highly localized to glial cells including astrocytes and microglia52. Further investigation into the role and cell specificity of miR-155 expression in human brain are critical prior to the development of miR-155 targeting AD therapeutics.
Our manuscript has several limitations. First, we were limited in the number of timepoints for the scRNAseq of isolated myeloid cells. Examining pre-MGnD at multiple time points between 4 and 8 months would confirm the fate lineage of pre-MGnD microglia and reveal insightful population spreads at older timepoints. In addition, our study only partially addressed how adaptive immunity crosstalk with microglia can impact neurodegenerative disease progression, which is an area of emerging interest. While we did inhibit peripheral IFNγ with a neutralizing antibody, depletion of IFNγ in T cells would be an interesting experiment and grant insight into the involvement of peripheral adaptive immunity in AD. Our proteomic analysis of animal models also has a limitation to assess the impact of miR-155 deletion on protein expression changes in microglia, since sagittal brain tissue slabs instead of microglia were assessed for the proteomic profiling. Finally, our genetic model (Cx3cr1CreERT2) does not specifically target microglia, but also targets other Cx3cr1+ cells including CAM. While we could not detect miR-155 expression in CD206+ CAM using miRNAscope in aged APP/PS1 mice, we cannot fully rule out the possibility that miR-155 genetic disruption in CAM/BAM might contribute to the transcriptomic changes observed in microglia.
In summary, we show that miR-155 ablation enhances microglia transition from homeostatic to pre-MGnD and that the pre-MGnD phenotype is therapeutically relevant for restricting Aβ pathology. Enhancing the pre-MGnD cluster represents a potential immunomodulatory approach to treat AD.
Methods
Mice
B6.129P2(Cg)-Cx3cr1tm2.1(cre/ERT)Litt/WganJ (Cx3cr1CreERT2)53 and C57BL/6N-Ifngr1tm1.1Rds/J (Ifngr1fl/fl)54 mice were purchased from the Jackson Laboratory. B6.Cg-Tg(Thy1-APPSw,Thy1-PSEN1*L166P)21Jckr (APP/PS1)55 mice were kindly provided by Dr. Mathias Jucker (University of Tubingen). C57BL/6-miR155tm1.1Ggard/J (miR-155fl/fl)56 were kindly provided by Dr. Gwenn Garden (University of North Carolina). Cx3cr1creERT2 mice were crossed with miR-155fl/fl mice. These transgenic mice were then triple crossed with APP/PS1 mice. Cx3cr1creERT2 mice were also crossed with Ifngr1fl/fl mice. Colony room conditions were maintained at 18–23 °C and 40% to 60% humidity, with lights set to a 12-h light/dark cycle. All experimental procedures using animals were approved by the Institutional Animal Care and Use Committee at Boston University School of Medicine and Brigham and Women’s Hospital, Harvard Medical School. In Ifngr1 cKO mice MGnD paradigm experiment and proteomics, only male mice were used. For all the other experiments, male and female mice were used in equal proportion. The ages of mice used ranged from 2.5, 4 to 8 months of age. The number of mice used for each experiment is detailed in the figure legends.
Tamoxifen injection
At 6 weeks of age, mice were intraperitoneally (i.p.) injected with 150 mg of tamoxifen (Sigma Aldrich, T5648–5G) dissolved in corn oil per kg body weight per day for two consecutive days.
Microglia isolation and sorting
Mice were euthanized in a CO2 chamber. The mice were then transcardially perfused with cold Hanks’ Balanced Salt Solution (HBSS). The whole brain was separated from the mouse and the meninges were removed for further processing. The left hemisphere was used for sorting, the right hemisphere was used for immunohistochemistry, and a 1 mm sagittal slice from the left hemisphere was used for whole tissue proteomics. The left hemisphere was homogenized to form a single cell suspension, then resuspended and centrifuged in a 37%/70% Percoll Plus (GE Healthcare, 17–5445-02) gradient at 800G, 23°C, for 25 min with an acceleration of 3 and a deceleration of 1. Mononuclear cells were taken from the interface layer. For general microglia sorting, the cells were stained with anti-mouse Fcrls-APC (1:1000, clone 4G11, Butovsky Lab)57, anti-mouse CD11b-PeCy7 (1:300, eBioscience, 50–154-54), and anti-mouse Ly-6C-PerCP/Cy5.5 (1:300, Biolegend, 123012). After staining, Ly-6C−CD11b+Fcrls+ cells were washed and sorted using BD FACSAria™ II (BD Bioscience) or MoFlo astrios. Data were collected by BD FACS Diva Software. For microglia clusters sorting, the cells were stained with rat anti-Clec7a antibody (1:20, Invivogen, mabg-mdect) and followed with anti-rat IgG (1:200, Biolegend, 405404). After wash, the cells were stained with anti-mouse Fcrls-APC (1:1000, clone 4G11, Butovsky Lab), anti-mouse CD11b-PeCy7 (1:300, eBioscience, 50-154-54), anti-mouse Ly-6C-PerCP/Cy5.5 (1:300, Biolegend, 128012), and anti-mouse Clec2d PE (Biorbyt, orb485179, 1:300). After staining, within Ly-6C−CD11b+Fcrls+ population, Clec2d−Clec7a− (M0) Clec2d+Clec7a− (early pre-MGnD), Clec2d+Clec7a+ (late pre-MGnD), and Clec2d−Clec7a+ (MGnD) were sorted using BD FACSAria™ II (BD Bioscience). Data were collected by BD FACS Diva Software and analyzed by FlowJo v10.
For mice with stereotaxic injections of dead neurons (DNs), a 3 × 6 mm coronal slice around the site of injection was taken. Microglia were enriched using the same method mentioned above. During sorting, phagocytic (DN405+Ly-6C−CD11b+Fcrls+) and non-phagocytic (DN405−Ly-6C−CD11b+Fcrls+) microglia were collected.
IFNγ blocker treatment
On Day 1, the experimental mice were treated i.p. with IFNγ blocker (Bioxcell, BE0055) or IgG1 isotype control (Bioxcell, BE0088), 250 μg per mouse. On Day 2, the mice were first treated i.p with the same dose as Day 1, then apoptotic neurons and IFNγ blocker or IgG1 isotype control were stereotaxically injected into the hippocampus (AP: −2 mm, DV: −2 mm, ML: ± 1.5 mm) and cortex (AP: −2 mm, DV: −1 mm, ML: ±1.5 mm) bilaterally at the dose of 100 μg per mouse. After 16 hours, phagocytic and non-phagocytic microglia were isolated and characterized by FACS and RNA sequencing.
Immunohistochemistry
The right hemisphere was fixed in 4% PFA for 24 hours and the hemisphere was then transferred to a 30% sucrose solution for 48 hours. Brains were later frozen in Tissue-TeK O.C.T. compound. 30 μm sagittal brain sections were cut with a cryostat and kept free floating in cryoprotectant solution. On the first day of staining, free floating brain sections were washed twice with phosphate buffered saline (Thermo Scientific, 14190250) and then incubated for one hour in blocking buffer [PBS, 0.1% Triton (Sigma-Aldrich 93443–100ML), 1% Bovine Serum Albumin (Sigma-Aldrich A3294–50G), 10% Normal Horse Serum (Thermo Fisher, NC9909742)]. Afterwards, the sections were incubated with primary antibodies in the buffer (PBS, 0.1% Triton, 1% Bovine Serum Albumin, 5% Normal Horse Serum) on a shaker overnight at 4°C. The following primary antibodies were used for detection: rabbit-anti-Tmem119 (Synaptic Systems, 400002, 1:1000), mouse-anti-Aβ (Biolegend, 803001, 6E10, 1:1000), mouse-anti-Aβ (Holtzman Lab, clone HJ3.4B, 1:600), rabbit-anti-Stat1 (Cell signaling, 14994T, 1:200), rat-anti-Clec7a (Invivogen, mabg-mdect,1:300), mouse-anti-ApoE (Holtzman Lab, clone HJ6.3, 1:1000), and rat-anti-Lamp1 (DSHB, 1D4B, 1:1000). For Stat1 staining, antigen retrieval protocol using citrate buffer (10 mM, pH 6) was performed on free-floating sections. The following day, the sections were washed three times with PBS. Then the sections were incubated with respective secondary antibodies in the buffer for 1 hour at room temperature. After washing the sections 3 times with PBS, they were moved onto glass slides, allowed to dry, and covered with a glass coverslip and DAPI (Thermo Scientific, P36931). Detailed antibody information was listed in Supplementary Table 5.
Thioflavin-S staining
The floating sections were first immersed in autofluorescence eliminator reagent (Millipore Sigma, 2160) for 5 minutes, then changed to 70% ethanol for 1 minute each time. The sections were transferred to H2O and incubated in filtered 1% aqueous Thioflavin-S (Sigma T1892) for 8 minutes at room temperature. The sections were then sequentially washed in 80%, 95% ethanol and distilled water.
Epifluorescent image capturing
Tilescan images of hippocampal and cortical regions of APP/PS1 and APP/PS1:miR-155 cKO mice were captured using the Keyence BZ-X810 epifluorescent microscope using identical exposure times across samples for each fluorophore at 10x magnification. Images were stitched using Keyence images analysis software and exported as .tif files for later analysis
Thioflavin-S+, 6E10+, and HJ3.4B+ plaque load analysis
Exported .tif files of hippocampal and cortical regions were opened in FIJI. Regions of interest within the cortex and hippocampus were manually selected and copied to a new image file for each stain of interest. The copied region of interest was processed for Gaussian blur and a threshold analysis was performed to capture ~3% of the signal. Following threshold analysis, images were analyzed for particle analysis using the particle analysis function in ImageJ. The size and circularity filters were 50-infinity and 0.2–1.0, respectively, to exclude blood vessels or erroneous signal. The counts and total area of Thioflavin-S+, 6E10+ and HJ3.4B+ plaques were compared to the total area of the selected region to give the count per pixel and percentage area.
Confocal analysis
All confocal imaging was performed on a Leica TCS SP8 lightning microscope at the inverted Leica DMi8 microscope stand using the confocal mode with a 63x oil immersion/1.4 N.A objective using a 1.1 optical zoom at a pinhole of 1.0 Airy units. The data were collected and analyzed using Leica software Las X. Images of 2048 × 2048 pixels as confocal stacks with a z-interval of 0.28 μm system optimized was used to image plaques. For imaging puncta, a 552-nm laser line was used, and emission was collected at 565–650 nm; for imaging Tmem119, a 488-nm laser line was used, and emission was collected at 490–600 nm. Gain and off-set were set at values which prevented saturated and empty pixels. After image acquisition, all images were applied with lightning deconvolution. 3D surface renderings and subsequent analysis of volume, sphericity and mask renderings was performed using the “Surface” module of Imaris 9.5, 64-bit version (Bitplane AG, Saint Paul, MN, www.bitplane.com). Analysis of all images was done while blinded to mouse genotype.
Migration analysis
To assess the level of microglial migration to Aβ plaques, an imaging plane bisecting each individual plaque was captured using confocal microscopy. Following capture, the images were imported into ImageJ and converted to 8-bit images. An area 5um larger than the diameter of the spherical plaques was selected, and a threshold analysis was performed for the channel corresponding to Tmem119 fluorescent signal. The percentage area positive for Tmem119 signal was calculated using the original area of the region of interest. 3 separate high-resolution images of individual plaques were gathered from 12 total mice, equally split between experimental groups and sex.
Plaque internalization by Clec7a+ microglia
Z-stacks were taken for 2–3 individual plaques for each animal, 6 animals per group, 60 individual images taken to capture the entire 30 μm tissue section width with a step size of 0.5 μm. Images were then exported to Imaris bitplane software. Surface renderings were created for Clec7a+ microglia and 6E10+ amyloid plaques. Using the mask function, all signal not incorporated within the Clec7a surface rendering was excluded from analysis, and another surface rendering for amyloid plaque only within the Clec7a+ area was created. Using this surface, the total area of the Clec7a signal and masked amyloid signal was taken and a percentage was created to calculate the total amount of amyloid within Clec7a positive microglia.
Lamp1 quantification
To assess the amount of plaque associated neuritic dystrophy, randomly selected 20x magnification images were taken of the cortices of APP/PS1 and APP/PS1 miR-155 cKO mice. Images were exported to ImageJ, and individual plaques were selected and cropped for analysis. For each plaque, a threshold analysis was performed, and its area was determined. Subsequently, a threshold analysis was performed for the Lamp1 positive signal, and the Lamp1 positive area was normalized to plaque size to correct for differences in neuritic dystrophy due to plaque size. Individual plaques (5–21 per animal) were analyzed with 5–7 animals being analyzed per experimental group, equally split between sex.
Quantification of APOE colocalized with Thioflavin-S+ plaques
To assess the amount of plaque associated Apoe, high resolution z-stack images were taken of individual plaques and the maximum intensity projections were exported to Imaris bitplane software, where the voxel colocalization function was used to assess the percentage of voxels that were double positive for Apoe and Thioflavin signal throughout the entirety of the section volume, masked for the region of interest only to avoid including signal from microglia Apoe. 4 individual plaques per animal were analyzed, with 8 animals being analyzed per experimental group, equally split between sex.
Sphericity
To assess plaque sphericity, we took high resolution images of Thioflavin-S+ plaques from APP/PS1 and APP/PS1:miR-155 cKO mice and created 3D renderings of said plaques using Imaris bitplane software. Using the built in “Sphericity” measurement function native to Imaris, we analyzed the sphericity of a surface rendering, with a value of 1 being equivalent to a perfect sphere. Between 7 and 8 individual plaques were analyzed per animal, 8–9 animals per group.
Plaque associated synaptic degradation
To assess the amount of synaptic degradation around Aβ plaques in APP/PS1 and APP/PS1:miR-155 cKO plaques, we stained sections with Thioflavin-S dye, and antibodies targeting vesicular glutamate transporter member 2 (Vglut2) (polyclonal guinea pig, Synaptic Systems, 1:1000) and post synaptic density protein 95 (PSD95) (Abcam monoclonal anti-goat, 1:1000). The colocalization of these two antibodies indicates the formation of a functional synapse. 6 individual plaques per animal were analyzed with 5–6 animals each group. Using ImageJ, we assessed the percent area that was double positive for signal from both Vglut2 and PSD95 using the mask function in ImageJ around and near Aβ plaques (plaque and peri-plaque, respectively).
miRNAscope
RNAscope® ISH technology was applied on mouse PFA-fixed sections using miRNAscope Reagent kit (ACD, 324531), miR-155 probe (ACD, 887751) according to the manufacturer instructions. The sections were further blocked with 5% BSA, 5% Normal Donkey serum, 0.3% Triton in PBS for 1 hour, followed by primary antibody overnight at 4°C (anti-Iba1, 1:200, Wako, 019–19741; anti-CD206, 1:200, Bio-Rad, MCA2235T). The secondary antibodies (Donkey anti-rabbit AlexaFluor 488, 1:300, Donkey anti-rat AlexaFluor 488, 1:300) were applied for 2 hours. After PBS wash, the sections were mounted with Fluoromount-G™ mounting medium (ThermoFisher, 00–4958-02) with DAPI and sealed with coverslips.
miR-155 quantification
Confocal microscopy images of miR-155 RNAscope were taken using Leica TCS SP8 lightning microscope. The regions of interest (ROI) containing Iba1+ cells, Iba1− cells, and CD206+ cells of the same size were selected in FIJI (ImageJ2). Then the fluorescence intensity of miR-155 signal was measured in FIJI.
Primary neuron culture
Primary Neurons were obtained from mouse embryos at E18. Cerebral hemispheres were isolated. The meninges were then removed from the hemispheres under a dissection microscope. The cerebral hemispheres were digested in a 10 units/ml papain solution for 15 min at 37 °C, and then triturated in a trituration solution of 19 ml Neurobasal media (Gibco, 21103–049), 133 μl BSA (Sigma, A-9576), 0.5 ml Pen/Strep/Glucose/Pyruvate, and 200 μl DNAse (Sigma, D-5025) with fire-polished glass pipettes until a single cell suspension was created. The suspension was filtered through a 40 μm strainer, spun down at 400G for 5 min, and resuspended in 1ml HBSS. The cell number was counted using a trypan blue stain and a cellometer (Nexcelom). Cells were plated on a 6 well, poly-D-lysine coated plate with approximately 1 million cells per well in a minimum volume of 2 ml growth media made of Neurobasal, 1:50 B-27 supplement (Gibco 17504–044), 1:200 Pen/Strep (Gibco, 15140–122), 1:400 Glutamax (Gibco, 35050–061), and 1:50 FBS (Gibco, 10–438-026). After 24 hours of incubation at 37°C, cell viability and contamination were checked under the microscope. If the culture was alive and contamination-free, half of the growth media was removed and replaced with fresh growth media containing 5μM Ara-C (Sigma-Aldrich, C1768–100MG) without FBS. After five days, half of the media was removed and replaced with new growth media without FBS. The ideal time for using the neurons is one week after plating the cells, but the culture is good for up to 3 weeks.
N9 microglial cell culture
The N9 microglial cell line was cultured in DMEM/F-12 medium (Gibco, 11320033) containing 10% fetal bovine serum (FBS). Cells were grown in the humidified incubator at 37°C with 5% CO2.
Co-transfection
Co-transfection of control or STAT1 3’UTR containing Gaussia Luciferase (GLuc) plasmid along with ctrl antagomir, miR-155 antagomir, control mimic or miR-155 mimic were performed using TransIT X2 (Cat. no. MIR6000, MIrus Bio) as per manufacturer’s protocol. Briefly, plasmid (1 μg) and control or miR-155 inhibitor or mimic, miR-18 mimic (50 nM, sequences listed in Supplementary Table 5) were suspended in 50 μl of OptiMEM and 1.5 μl of TransIT X2 were added. TransIT X2 DNA complex was incubated for 30 min at RT and added dropwise onto the cells. Cells were further incubated for 48 hours at 37°C in a CO2 incubator. Medium containing GLuc were collected, and luminescence was measured using Secrete-Pair™ Dual Luminescence Assay Kit (Cat. No. SPDA-D030, GeneCopoeia) as per manufacturer’s protocol. GLuc was normalized to secreted alkaline phosphatase (SEAP) and fold change was calculated in comparison to control antagomir or control mimic transfected cells. Control plasmid was used as negative control.
Induction of apoptotic neurons
Differentiated murine cortical primary neurons isolated from E18 C57BL/6J pups (days in vitro 7–10) were typically cultured one week after initiation of culture. Neurons were removed from the surface of the plate by multiple washed with PBS. The neurons were then incubated under UV light (302 nm) at an intensity of 6315 W for 15 minutes to induce apoptosis. After this step the neurons were kept on ice. The cells were collected, spun down via centrifugation, and resuspended in 1 ml PBS. Next, they were stained with the labeling dye (Alexa405 NHS Ester, Invitrogen, A3000) for 15 min at 37°C, protected from light. Neurons were then washed, spun and resuspended. Number of apoptotic cells was determined using a trypan blue stain and a cellometer. Neurons were resuspended at a density of 25,000 cells per μl.
Apoptotic neuron injection (MGnD paradigm)
The detailed protocol is previously described58. Briefly, mice were anesthetized via intraperitoneal injection of Ketamine (100mg/kg) and Xylazine (10 mg/kg). 2 ul of the apoptotic neuron mixture was injected into the hippocampus (AP: −2 mm, DV: −2 mm, ML: ± 1.5 mm) and cortex (AP: −2 mm, DV: −1 mm, ML: ±1.5 mm) bilaterally using a stereotactic injection apparatus. Animals were processed 16 hours after injection.
Protein digestion and isobaric labeling
1 mm sagittal whole brain tissues were homogenized using the SDS lysis buffer [2% SDS, 150 mM NaCl, 50 mM HEPES (Boston BioProducts, NNH-85, pH 8.5), 5 mm DTT (Sigma-Aldrich, 10197777001), sodium vanadate (New England Biolabs, P07585), protease inhibitor (Sigma-Aldrich, 04693159001) and phosphatase inhibitor (Sigma-Aldrich, 04906845001), H2O (HPLC grade)]. Extracts were reduced at 57°C for 30 min and cysteine residues were alkylated with iodoacetamide (14 mM) in the dark at room temperature for 45 min. Extracts were purified by methanol–chloroform precipitation and pellets were washed with ice-cold methanol. Pellets were resuspended in 2 mL of 8M urea (containing 50 mM HEPES, pH 8.5) and protein concentrations were measured by BCA assay (Thermo Scientific) before protease digestion. One hundred micrograms of protein were diluted to 4M urea and digested overnight with 4 μg LysC (Wako). Digests were diluted further to a 1.5 M urea concentration and 5 μg of trypsin (Promega) was added for 6 hr at 37°C. Digests were acidified with 50 μl of 20% formic acid and subsequently desalted by C18 solid-phase extraction (50 mg, Sep-Pak, Waters). Digested brain peptides were resuspended in 100 μl of 200 mM HEPES, pH 8.0. Ten microliters of TMTpro reagents (Thermo Fisher) were added to each solution for 1 hr at room temperature (25°C). After incubating, the reaction was quenched by adding 4 ml of 5% (w/v) hydroxylamine. Labelled peptides were combined and subsequently desalted by C18 solid-phase extraction (50mg, Sep-Pak, Waters) before basic pH reversed-phase separation.
Basic pH reverse-phase separation
Tandem mass tag (TMT)-labeled peptides were solubilized in 500 ml solution containing 5% acetonitrile in 10 mM ammonium bicarbonate, pH 8.0 and separated by an Agilent 300 Extend C18 column (5 mm particles, 4.6mm inner diameter and 220 mm in length). An Agilent 1100 binary pump coupled with a photodiode array detector (Thermo Fisher) was used to separate the peptides. A 40-min linear gradient from 20% to 40% acetonitrile in 10 mM ammonium bicarbonate, pH 8 (flow rate of 0.6 ml/min) separated the peptide mixtures into a total of 96 fractions (30 sec). A total of 96 fractions was consolidated into 12 samples in a checkerboard fashion, acidified with 20 μl of 20% formic acid and vacuum dried to completion. Each sample was re-dissolved in 5% formic acid, 5% ACN, desalted via StageTips before liquid chromatograph–tandem mass spectrometry (LC–MS/MS) analysis.
LC–MS/MS analysis
Data were collected using an Orbitrap Fusion Lumos mass spectrometer (Thermo Fisher Scientific, San Jose, CA) coupled with a Proxeon EASY-nLC 1200 LC pump (Thermo Fisher Scientific). Peptides were separated on a 100 μm inner diameter microcapillary column packed with 35 cm of Accucore C18 resin (2.6 μm, 100 Å, Thermo Fisher Scientific). Peptides were separated using a 3 hr gradient of 6–22% acetonitrile in 0.125% formic acid with a flow rate of ~400 nL/min. Each analysis used an MS3-based TMT method. The data were acquired using a mass range of m/z400 – 1400, resolution at 120,000, AGC target of 1 × 10⁶, a maximum injection time 100 ms, dynamic exclusion of 180 seconds for the peptide measurements in the Orbitrap.
Data dependent MS2 spectra were acquired in the ion trap with a normalized collision energy (NCE) set at 35%, AGC target set to 2.0 × 10⁵ and a maximum injection time of 120 ms. MS3 scans were acquired in the Orbitrap with a HCD collision energy set to 45%, AGC target set to 1.5 × 10⁵, maximum injection time of 200 ms, resolution at 50,000 and with a maximum synchronous precursor selection (SPS) precursors set to 10.
Mass spectrometry data processing and spectra assignment
In-house developed software was used to convert acquired mass spectrometric data from the .RAW file to the mzXML format. Erroneous assignments of peptide ion charge state and monoisotopic m/z were also corrected by the internal software. SEQUEST algorithm was used to assign MS2 spectra by searching the data against a protein sequence database including Mouse Uniprot Database (downloaded June 2017) and known contaminants such as mouse albumin and human keratins. A forward (target) database component was followed by a decoy component including all listed protein sequences. Searches were performed using a 20 ppm precursor ion tolerance and requiring both peptide termini to be consistent with trypsin specificity. 16-plex TMT labels on lysine residues and peptide N termini (+304.2071 Da) were set as static modifications and oxidation of methionine residues (+15.99492 Da) as a variable modification. An MS2 spectra assignment false discovery rate (FDR) of less than 1% was implemented by applying the target-decoy database search strategy. Filtering was performed using a linear discrimination analysis method to create one combined filter parameter from the following peptide ion and MS2 spectra properties: XCorr and DCn, peptide ion mass accuracy, and peptide length. Linear discrimination scores were used to assign probabilities to each MS2 spectrum for being assigned correctly and these probabilities were further used to filter the data set with an MS2 spectra assignment FDR to obtain a protein identification FDR of less than 1%.
Determination of TMT reporter ion intensities
For reporter ion quantification, a 0.003 m/z window centered on the theoretical m/z value of each reporter ion was monitored for ions, and the maximum intensity of the signal to the theoretical m/z value was recorded. Reporter ion intensities were normalized by multiplication with the ion accumulation time for each MS2 or MS3 spectrum and adjusted based on the overlap of isotopic envelopes of all reporter ions. Following extraction of the reporter ion signal, the isotopic impurities of the TMT reagent were corrected using the values specified by the manufacturer’s specification. Total signal-to-noise values for all peptides were summed for each TMT channel and all values were adjusted to account for variance and a total minimum signal-to-noise value of 200 was implemented.
We used one-way ANOVA with multiple experiment viewer (MEV) to filter out significantly changed proteins across all groups. We then narrowed down significantly changed proteins between APP/PS1 and APP/PS1:miR-155 cKO mice using Student’s unpaired t-test.
RNA isolation and Quantitative Real-Time PCR
Total RNA including miRNA was extracted using RNeasy Plus Micro Kit (Qiagen, 74034) according to the manufacturer’s protocol as Purification of total RNA containing small RNAs from cells. For quantitative real-time polymerase chain reaction (qRT-PCR), total RNA with specific mRNA probes and miRNA probes were used after reverse transcription reaction (high-capacity cDNA Reverse Transcription Kit; Applied Biosystems, 4368814). All mRNA/miRNA amplifications were performed with commercially available FAM-labeled Taqman probes (Thermo Fisher Scientific, 4453320, 4448892, 4427975). Detailed Probes information were listed in Supplementary Table 5. Real-time PCR reaction was performed using QuantStudio™ 7 (Applied Biosystems). All qRT-PCRs were performed in duplicate, and the data of miRNAs were presented as relative expression normalized to U6 as mean ± s.e.m.
Bulk RNA sequencing and analysis
1,000 isolated Ly6C−CD11b+Fcrls+ microglia were lysed in 5 ul TCL buffer +1% beta-mercaptoethanol. Smart-Seq2 libraries were prepared and sequenced by the Broad Genomic Platform. cDNA libraries were generated from sorted cells using the Smart-seq2 protocol59. RNA sequencing was performed using Illumina NextSeq500 using a High Output v2 kit to generate 2 × 38 bp reads. Transcripts were quantified using Salmon (v1.4). RNA sequencing analysis was done in R (v4.1.1) using DESeq2 package (v1.34.0). Raw read counts were processed and normalized using the median of ratio method. Low abundance genes below a mean count of 5 reads/sample were filtered out, and differentially expressed genes (DEGs) were identified by running comparisons using LRT where the cutoff for significant genes was a Benjamini-Hochberg FDR corrected P < 0.05. Statistical analysis which does not cross FDR correction were labeled with P < 0.05. The DEGs were identified by FDR-corrected P value for heatmaps and by P value for volcano plots and targetome analysis. Heatmaps were visualized using the pheatmap package (v.1.0.12, R package), and PCA plots were visualized using the plotPCA command in DESeq2. Volcano plots were generated using the EnhancedVolcano package (v1.12.0) and violin plots were generated using the function geom_violin from ggplot2 package (v3.3.5). Transcription factor enrichment analysis was carried out using the dorothea (Discriminant Regulon Expression Analysis) package60.
Single-cell RNA sequencing
The single cell RNA-seq libraries of female and male samples were generated by the Boston University Single Cell Sequencing Core facility and Harvard Medical School Single Cell core. All the samples were sequenced by Boston University Microarray and Sequencing Resource Core Facility. Sample viability and counts were determined using hemocytometer and trypan blue and ranged from [510,000–1,300,000 counts/ml] and [72–89% viability]. GEMs were generated according to the manufacturer’s protocol by combining barcoded Single Cell 3’ v3.1 Gel Beads, a Master Mix containing cells, and Partitioning Oil onto Chromium Next GEM Chip G (10X Genomics, USA) with targeted capture of 5000 cells per sample. Reverse transcription immediately followed GEM generation, producing barcoded, full-length cDNA from poly-adenylated mRNA. After incubation, GEMs were broken and pooled fractions of cDNA were recovered. Barcoded, full-length cDNA was amplified via PCR to generate sufficient mass for library construction.
A Bioanalyzer High Sensitivity DNA Assay (Agilent Technologies, USA) was used to determine size distribution and yield of amplified cDNA. Double-stranded cDNA then underwent fragmentation, end repair, A-tailing, and adaptor ligation. Incorporation of sample-specific multiplex indices occurred during PCR amplification (14 cycles) according to the manufacturer’s protocol (10X Genomics, USA). Size distribution and molarity of amplified cDNA libraries were assessed via the Bioanalyzer High Sensitivity DNA Assay (Agilent Technologies, USA). Libraries were sequenced on an Illumina NextSeq 2000 instrument with P3 flow cells according to Illumina and 10x Genomics guidelines with 650pM input and 2% PhiX control library spike-in (Illumina, USA) generating 48–69M reads/per cell.
Single-cell processing and analysis
Fastq files were processed using standard cellranger count command. Processed matrix, barcodes and feature files loaded in R (v4.1.1) using Seurat v4.061. Cells with more than 1000 sequencing reads and less than 20 percent mitochondrial transcripts were selected. Only genes present in more than 3 cells were included. Potential dublets were detected using scDblFinder (v1.12.0)62 and filtered out. Expression counts were normalized by the “LogNormalize” method and scaled for mitochondrial read count using linear regression as implemented in Seurat’s “Regress Out” function. Variable genes were Identified using the “vst” selection method. The data was then centered and scaled, analyzed by principal component analysis (PCA), and dimensionally reduced. Top-26 and top-10 principal components were used for female and male, respectively. The cells were clustered on PCA space using gene expression data as implemented in FindNeighbors and FindClusters commands in Seurat. The resolution of clusters for females was set to 0.8 and for males to 0.9. Optimal resolution was determined using clustree package (v0.5.0)63. The method returned 16 cell clusters for females and 20 clusters for males which were then visualized using UMAP for dimensionality reduction. Male samples included sequencing from two different libraries and were therefore batch corrected using Harmony package64. The differentially expressed genes in each cluster were determined by FindAllMarkers. DEGs between APP/PS1:miR-155 cKO and APP/PS1 were identified by running comparisons using LRT where the cutoff for significant genes was a Benjamini-Hochberg FDR corrected P < 0.05. The clusters were identified based on cell-type-specific key signature genes. Clusters containing low-quality cells (high ribosome to mitochondria ratio), non-microglia cells and proliferating cells were removed for downstream analysis. Expression signature analysis revealed three major microglia clusters called M0 (Tmem119high, Clec7aNeg), pre-MGnD (Tmem119Int, Clec7aInt) and MGnD (Tmem119low, Clec7aHigh). Differential comparison of pre-MGnD cluster between APP/PS1-miR155cKO and APP/PS1 was carried out by first determining pre-MGnD markers using FindMarkers with (log2FC > 0.2). 59 and 160 pre-MGnD markers were identified in females and males, respectively. Average marker gene expression was added as module to all cells using AddModuleScore function. Pre-MGnD marker enrichment scores were plotted using violin plot and significance testing between APP/PS1 and APP/PS1:miR155cKO was carried out using Kruska-Wallis test. Detailed characterisation of pre-MGnD revealed three sub-clusters. Two subclusters showed high expression of interferon related genes (Ifit1, Stat1, Isg15, Clec2d). The cluster size was compared by using poisson regression65. Trajectory analysis was carried out using the slingshot package (v2.6.0) and revealed the transition of M0 to MGnD via the interferon related pre-MGnD subclusters. The two interferon related subclusters were characterised as early pre-MGnD and late pre-MGnD based on Clec2dhigh:Clec7alow and Clec2dhigh:Clec7ahigh expression respectively. Volcano plots were generated using the EnhancedVolcano package (v1.12.0). Gene expression was visualized using FeaturePlot and Dotplot66, 67. Pseudotime graphs were created using the SCP integration package (v0.2.1.9) for slingshot trajectory expression.
Pathway analysis
Pathway analysis was performed using gene ontology (GO) enrichment analysis (http://geneontology.org). Differentially expressed genes were used to detect the pathways associated with biological process. Differentially expressed genes with corresponding fold changes and adjusted p values were applied to gene set enrichment analysis (GSEA, https://www.gsea-msigdb.org/gsea/index.jsp)68, 69 and Ingenuity pathway analysis (IPA, https://digitalinsights.qiagen.com/products-overview/discovery-insights-portfolio/analysis-and-visualization/qiagen-ipa/). In IPA, canonical pathways and biological functions were tested for generating biological networks as described previously57.
Targetome analysis
Publicly available databases (mirBase70 and targetscan) were searched for both 5p and 3p-miR-155 target genes. Additionally, IPA miR-155 targets were selected. After filtering all databases for high-confidence targets, 1680 potential target genes were selected.
Behavioral Tests
All behavioral tests were performed in an empty testing room within the animal vivarium, during the light cycle between the hours of 9 am–6 pm. For all tests, animals were habituated in the test room for at least 30 minutes before the start of testing. A test-free period of 3–5 days was used between behavioral tests. The lighting, humidity, temperature, and ventilation were kept as constant as possible in the testing room. All behavioral testing was performed in a blinded manner. All scoring was done using Noldus Ethovision behavioral software.
Open Field
Spontaneous locomotor activity and anxiety was measured using an automated Noldus Ethovision XT apparatus (Noldus Information Technology, Wageningen, the Netherlands) at 10 WPI. Mice were placed in a 50 cm × 50 cm box made of black acrylic walls with a white floor and their locomotion and path was tracked for 5 min. The total distance, average velocity, entries into the center zone (defined as X get measurements for center zone) during testing period were measured.
Forced Alternation
The Forced Alternation paradigm was used to assess spatial working memory as previously described71. This test takes advantage of the tendency of rodents to explore novel areas, and mice with intact spatial recognition memory will prefer to explore a novel arm over familiar arms of the maze, whereas mice with impaired spatial memory will demonstrate a reduced preference for the novel arm72. A period of 12 days was given between testing spontaneous alternation and forced alternation to avoid confounding factors involved with testing in the same maze. Previous studies using both the spontaneous and forced alternation tasks have shown no risk of confound from using the same maze with sufficient time between trials71. Spatial working memory was assessed in APP/PS1 and WT mice. The apparatus was a Y-shaped maze made of white acrylic. Each arm was 34 cm long, 8 cm wide, and 14 cm high. Visual cues were placed in the testing room and kept constant during the whole test. In the first trial of the test, one arm of the Y-maze was closed with a guillotine door and mice were allowed to visit two arms of the Y-maze for 5 min. After 30-min inter-trial interval, mice were placed back in the start arm and allowed free access to the three arms for 5 min. Start and closed arms were randomly assigned for each mouse. We compared the number of entries into the novel arm versus the average of the entries into the two familiar arms during the first 2 minutes of the second trial. Scoring was performed using Noldus Ethovision software, with entries into an arm being counted when the nose point, center point and tail base point were all within the defined area for any given arm.
Spontaneous Alternation
Spontaneous alternation tests were conducted in the same Y-maze as described above. This test consisted of a single 10 min trial, in which the mouse was allowed to explore all three arms of the Y-maze. The start arm was varied between animals to avoid placement bias. Spontaneous Alternation [%] was defined as consecutive entries in 3 different arms, divided by the number of possible alternations (total arm entries minus 2). Re-entries into the same arm were rated as separate entries, which resulted in a 22.2% chance level for continuous alternation.
Statistical analysis
Our sample sizes for experiments were chosen based on our prior publication using APP/PS1 mice58, which defined the expectations for the effect size and variance55. Statistical analyses for behavioral, cell assay and immunohistochemical experiments were performed using GraphPad prism statistical software. For all comparisons groups were assessed for normal distribution. If the data was normally distributed, Student’s unpaired, two-tailed t-test were used. If the data was not normally distributed, two-tailed Mann-Whitney tests or Kruska-Wallis test were used for comparisons examining the difference between two groups. For samples with multiple groups, one-way ANOVA, two- or three-way ANOVA with post hoc tests were performed. No data points were excluded from analysis. Data are presented as mean ± SEM. Data collection and analysis were blindly performed. Data for each experiment were collected and processed randomly and animals were assigned to various experimental groups randomly as well. All n and P-values and statistical tests are indicated in figure legends.
Extended Data
Extended Data Fig. 1. miR-155 is specifically detected in Iba1+ cells in the brain of APP/PS1 mice.
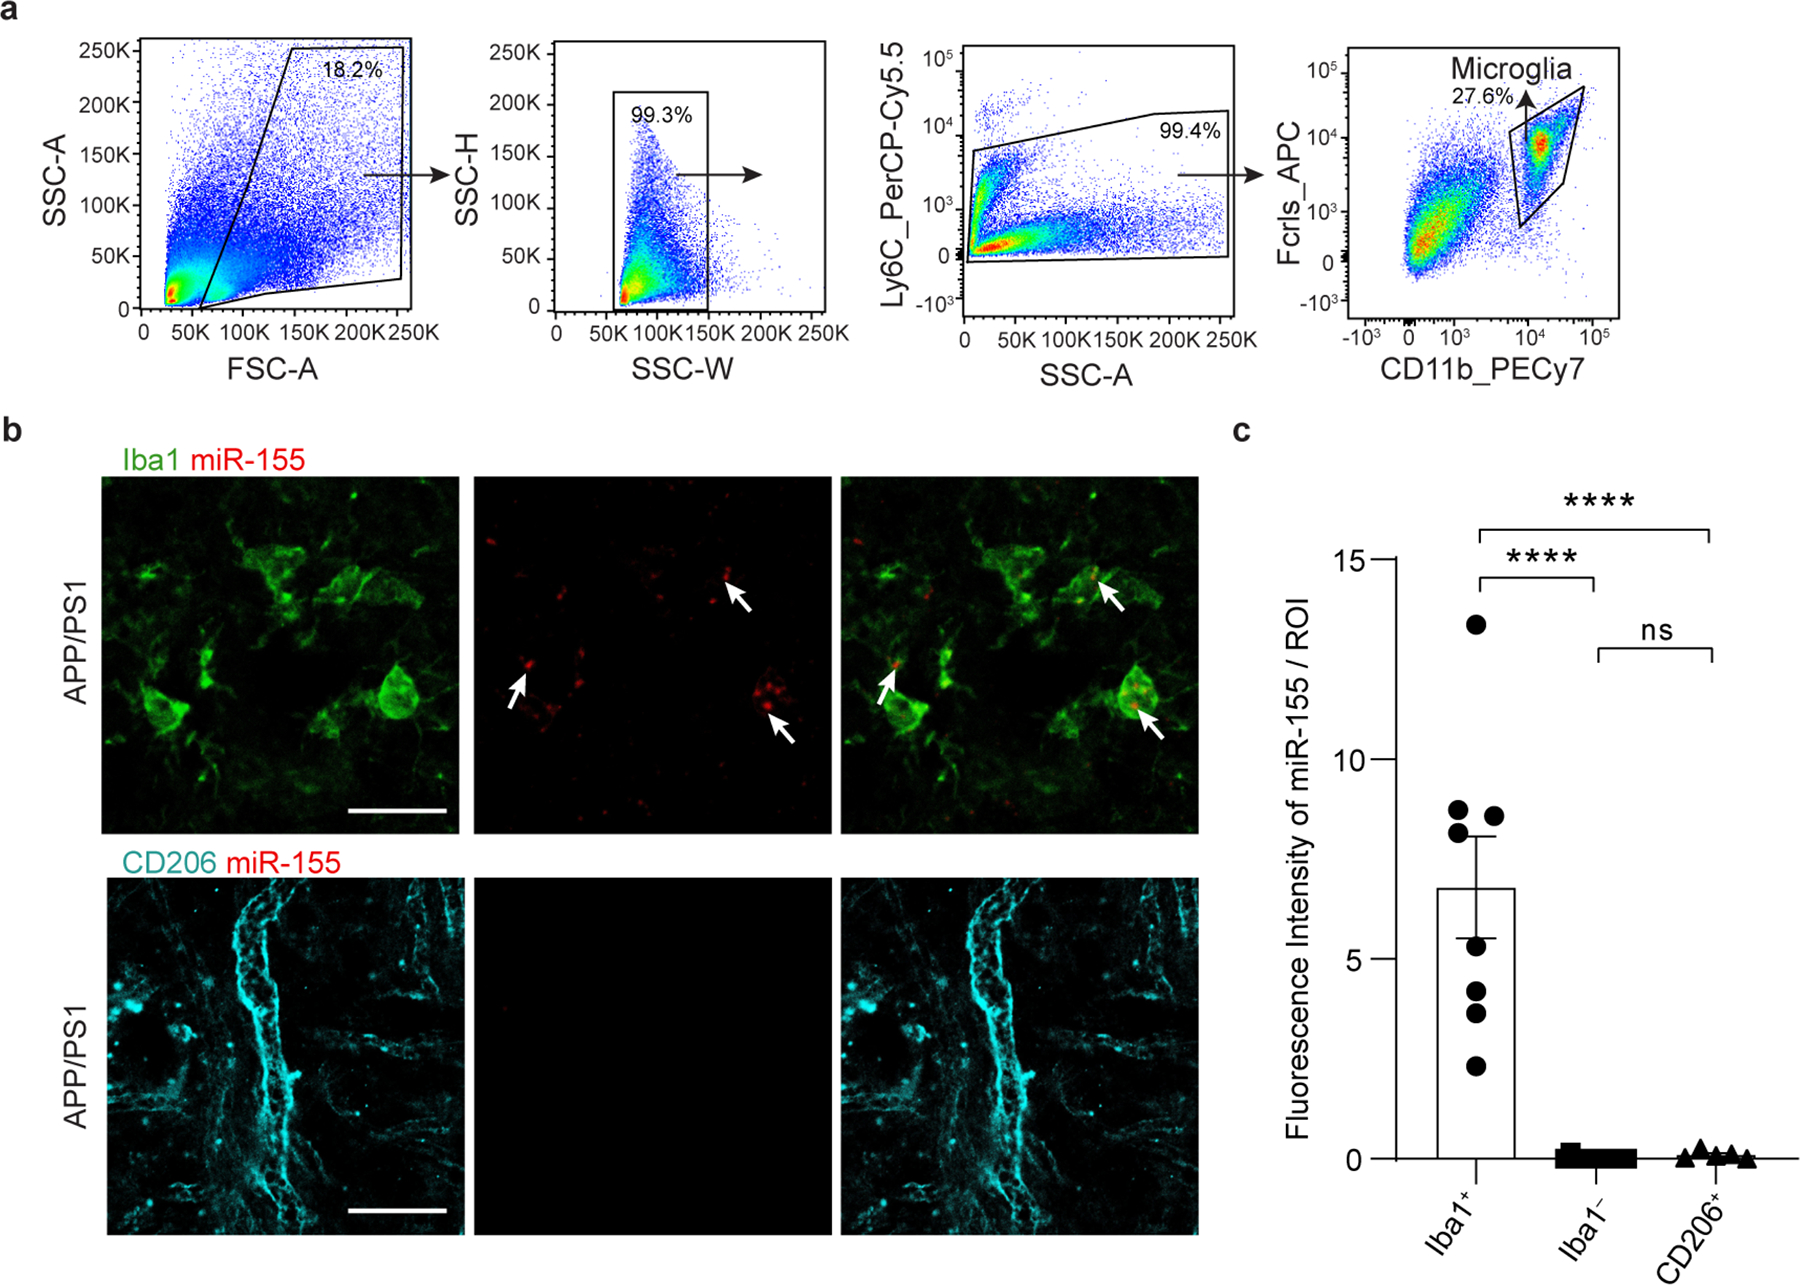
a, Gating strategy for sorting Ly6C–CD11b+Fcrls+ microglia. b, Confocal microscopy images of Iba1 or CD206 immunoreactivity and detection of miR-155 gene expression using miRNAscope in 8-month-old APP/PS1 mice, scale bar: 50 μm. c, Quantification of fluorescence intensity of miR-155 in Iba1+ cells, Iba1− cells, and CD206+ cells per ROI using one-way ANOVA with Tukey’s post hoc analysis, P < 0.0001 (n = 8 ROI for Iba1+ group, n = 12 ROI for Iba1− group, n = 5 ROI for CD206+ group). Data were presented as mean values ± s.e.m.
Extended Data Fig. 2. Targeting microglial miR-155 causes subtle changes in APP/PS1 mice at 8 months old.
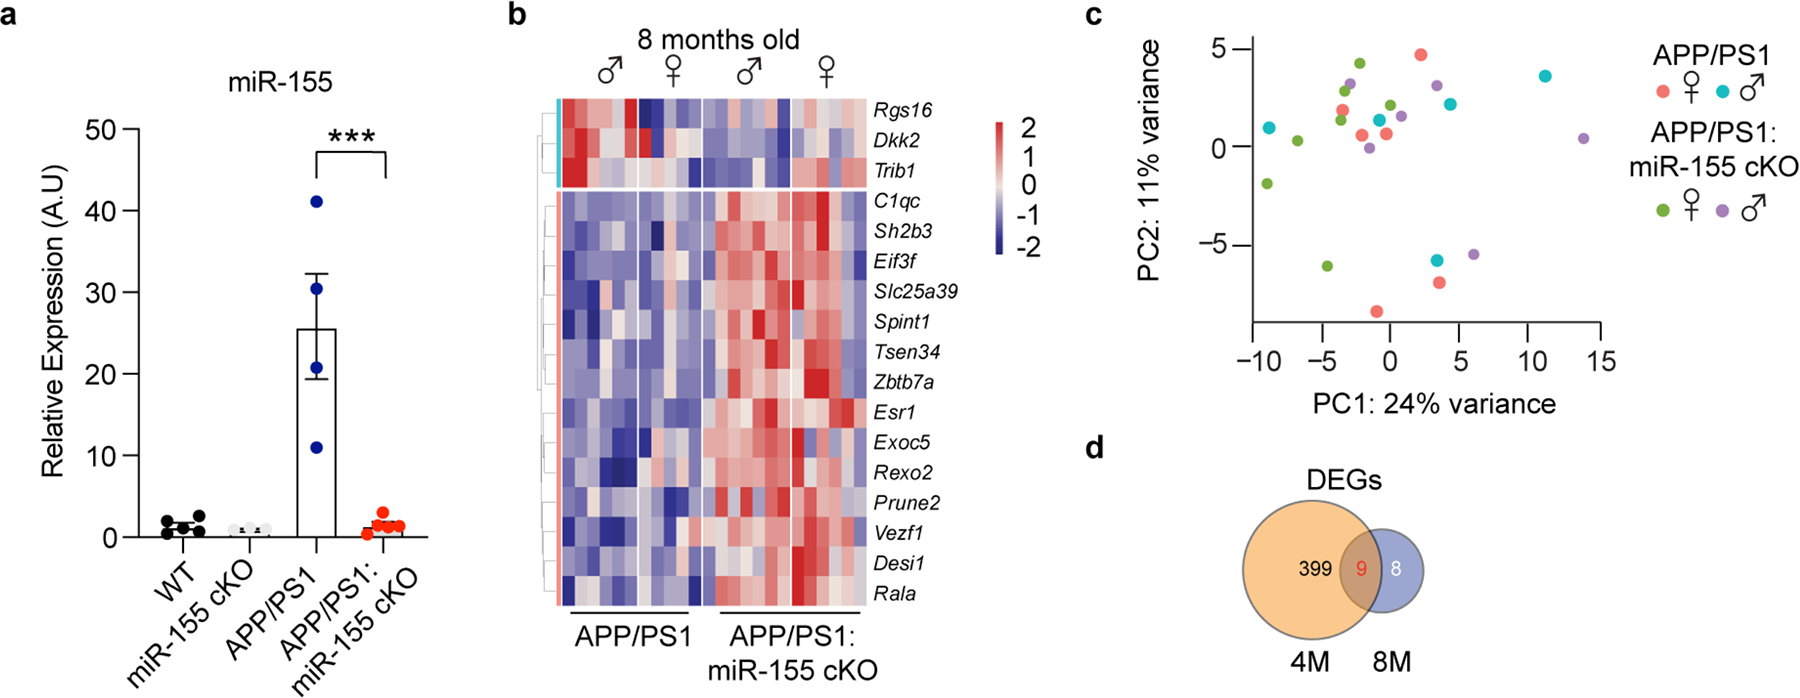
a, qPCR of miR-155 expression in microglia from 8-month-old mice showing the efficiency of tamoxifen treatment, P = 0.0003 using one-way ANOVA with Tukey’s post hoc test (n = 5 mice for WT and APP/PS1:miR-155 cKO group, n = 3 mice for miR-155 cKO group, n = 4 mice for APP/PS1 group). b, Heatmap of DEGs identified in microglia of APP/PS1:miR-155 cKO group at 8 months of age, compared to APP/PS1 group using DESeq2 analysis (Two-sided LRT, FDR-corrected P < 0.05, n = 5–6 per sex/group). c, PCA analysis showing no significant separation among all the groups at 8 months old. d, Venn diagram showing the difference of DEGs between 4- and 8- month groups. Data were presented as mean values ± s.e.m See also Supplementry Table 1.
Extended Data Fig. 3. Targeting microglial miR-155 suppresses homeostatic signature in WT mice.
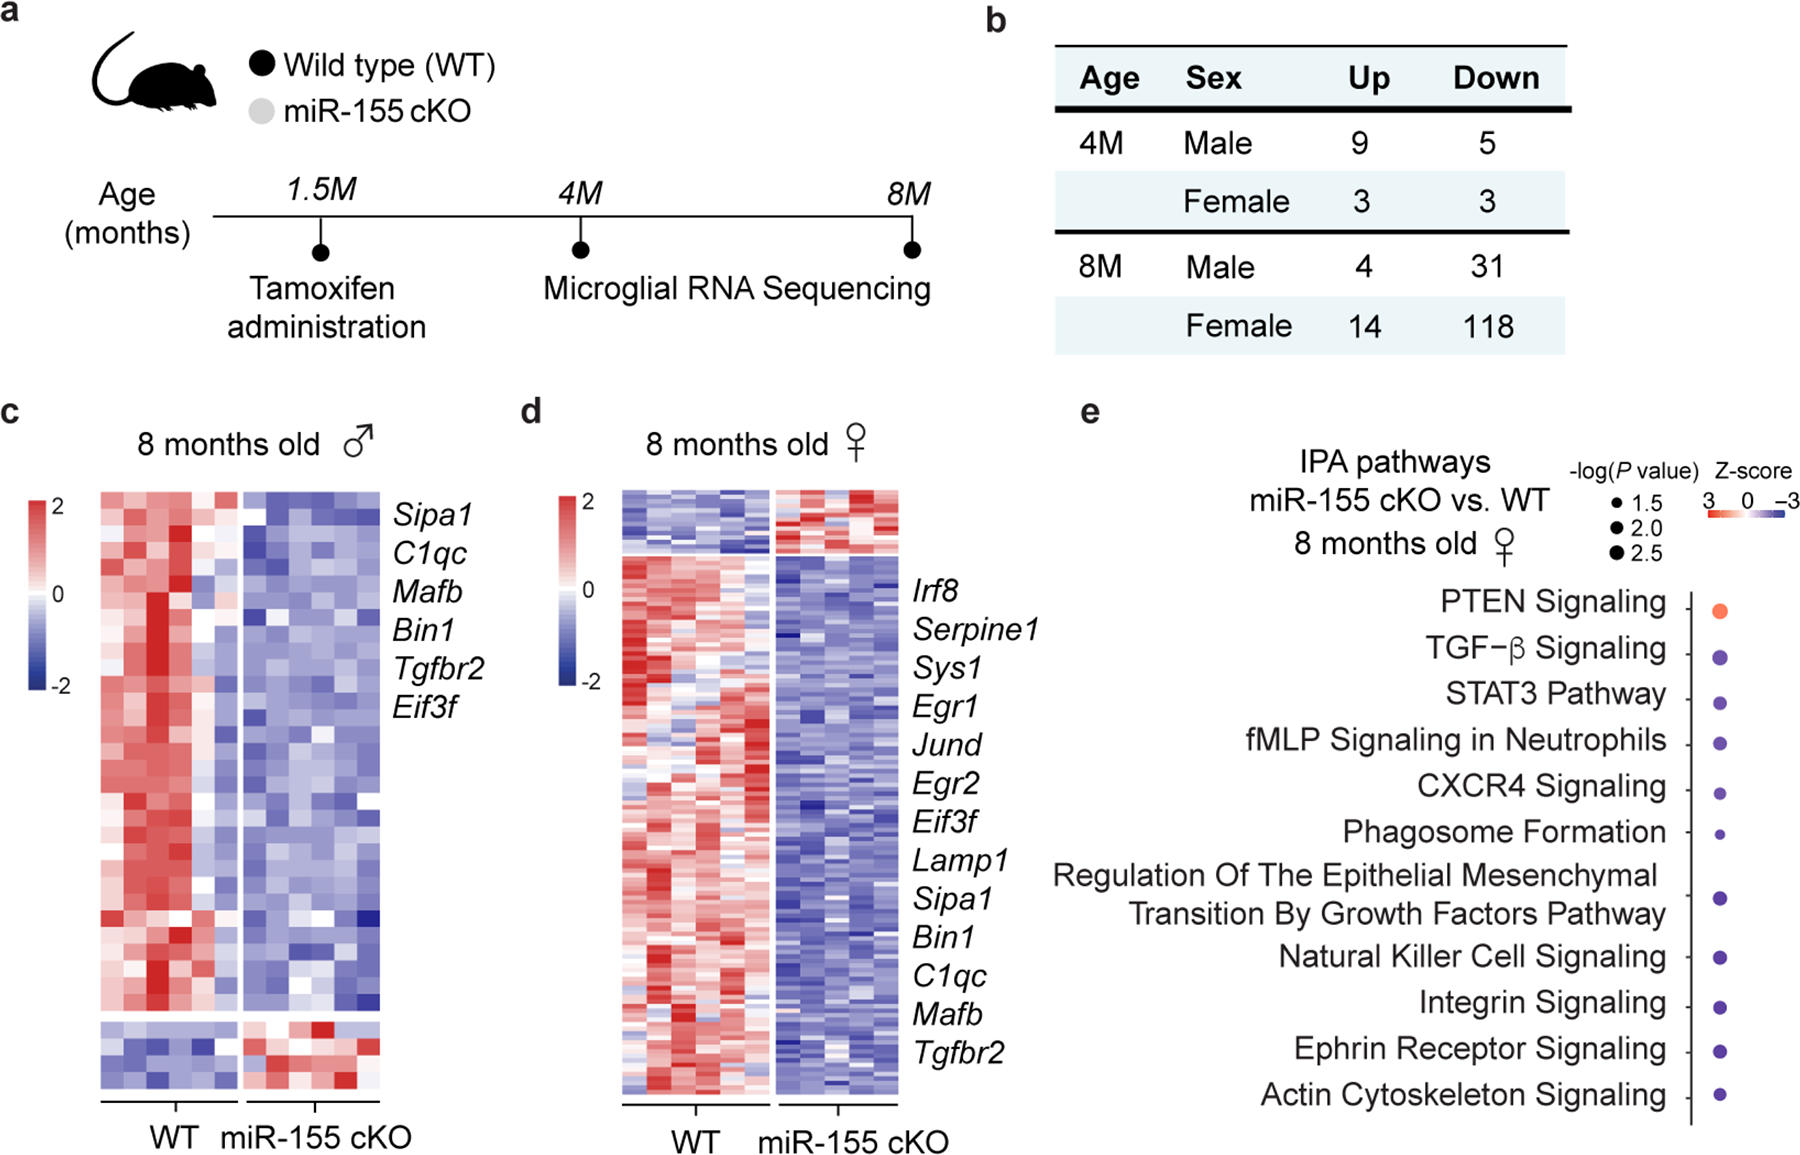
a, Experimental design. b, Number of DEGs comparing miR-155 cKO vs. WT at 4- and 8 months old (n = 5–6 mice per sex/group). Heatmap of DEGs identified in miR-155 cKO microglia, compared to WT microglia for male (c) and female (d) groups using DESeq2 analysis, two-sided Wald test, FDR-corrected P < 0.05 (n = 5–6 mice per sex group). e, Top-affected pathways based on the comparison of female miR-155 cKO microglia vs WT microglia at 8 months of age using IPA (DEGs were identified with two-sided Wald test, FDR-corrected P < 0.05). See also Supplementry Table 1.
Extended Data Fig. 4. Male APP/PS1 mice show more robust changes after targeting microglial miR-155.
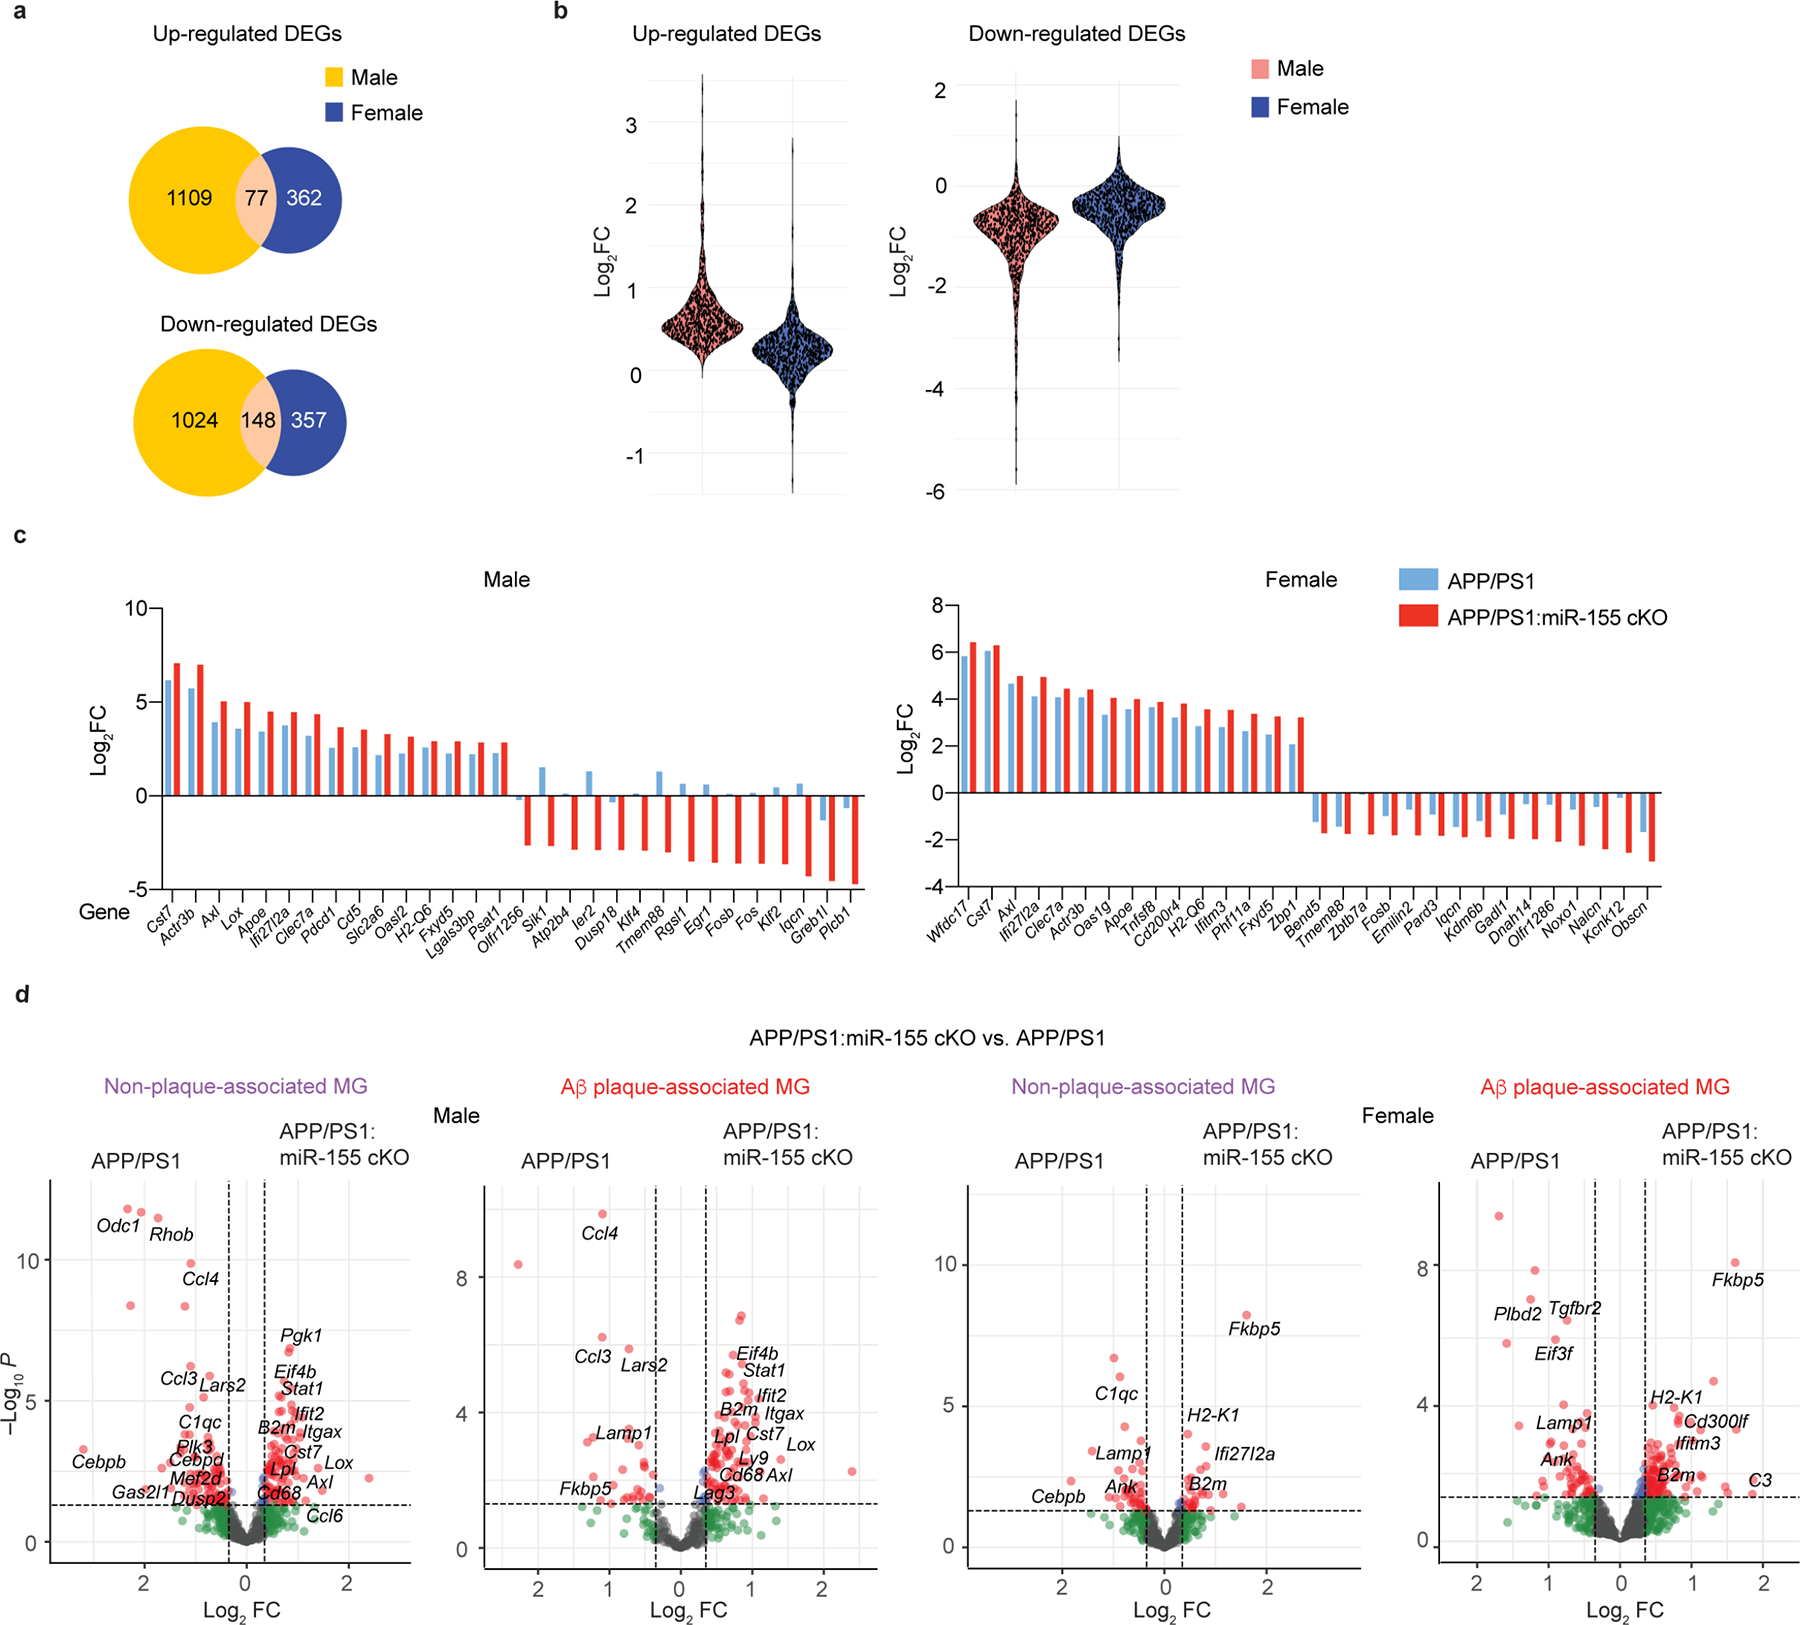
Venn diagram (a) and violin plot (b) showing the difference of up-regulated DEGs or down-regulated DEGs by comparing APP/PS1:miR-155 cKO vs. APP/PS1 (P < 0.05) between male and female samples at 4 months of age. c, Sex-specific top-15 upregulated and downregulated DEGs with the Log2 fold changes (FC) between APP/PS1 vs. WT group and APP/PS1:miR-155 cKO vs. WT group. DEGs were identified using DESeq2 analysis with FDR-corrected P < 0.05. d, Volcano plots using common DEGs of sex-specific APP/PS1:miR-155 cKO microglia vs. APP/PS1 microglia and non-plaque-associated microglia or plaque-associated microglia, compared to WT microglia (Two-sided LRT, P < 0.05). See also Supplementary Table 1.
Extended Data Fig. 5. miR-155 ablation induces interferon signaling in microglia.
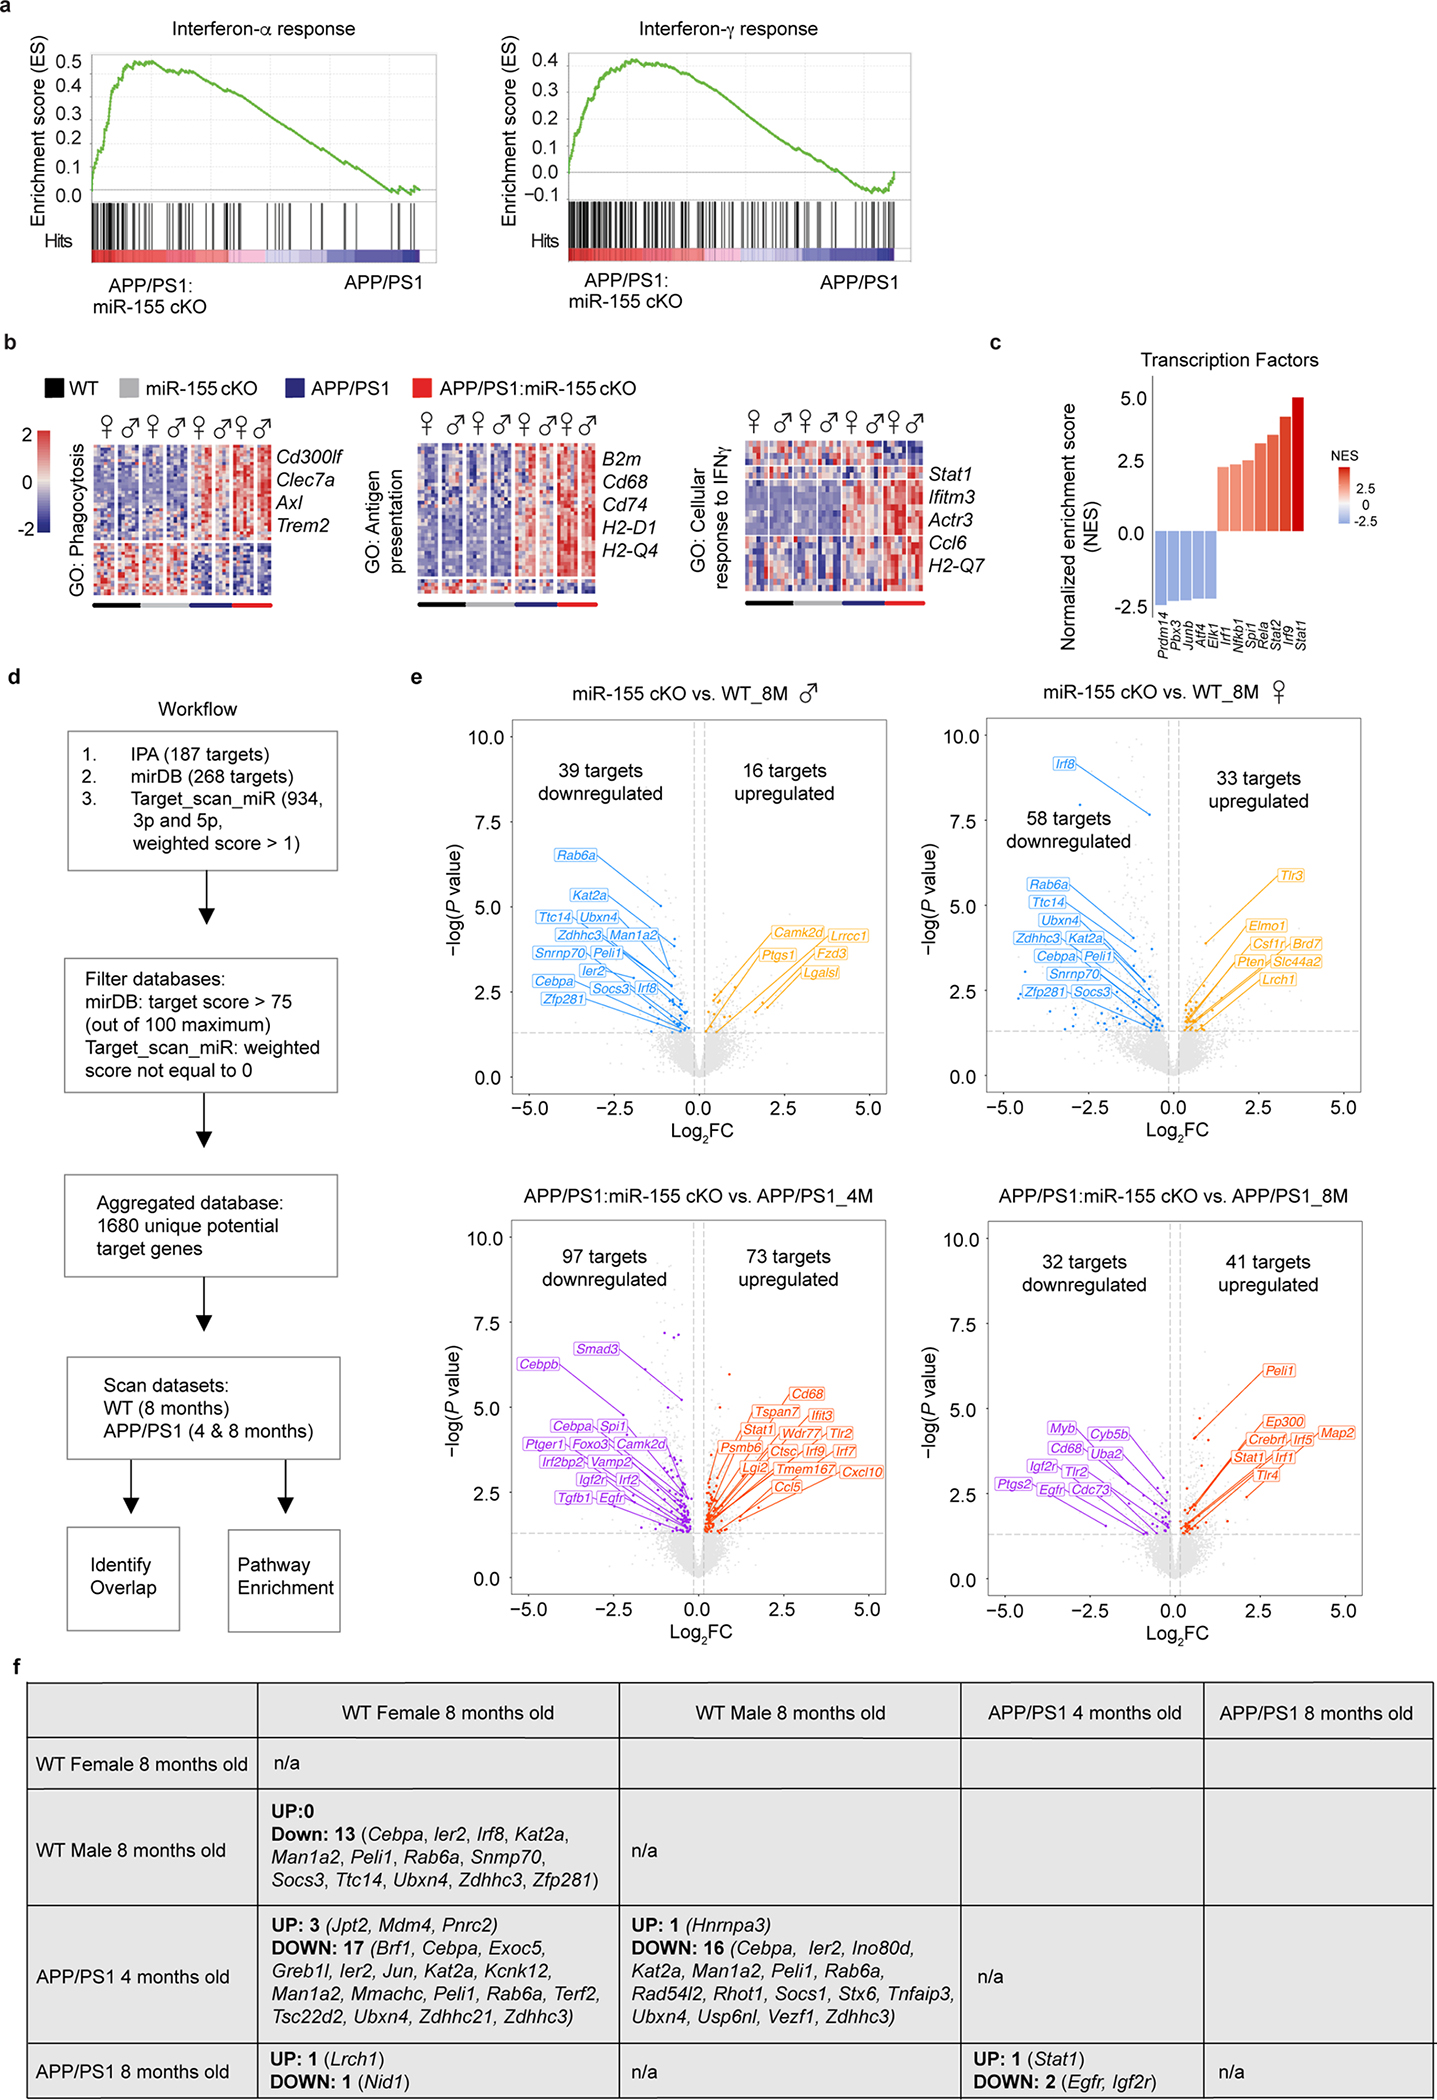
a, GSEA analysis of interferon alpha response and interferon gamma response made using bulk RNA sequencing data from isolated microglia. b, DEG Heatmaps of genes involved in gene ontology terms for phagocytosis, antigen presentation and cellular response to IFNγ derived from bulk RNAseq data (Two-sided LRT, FDR-corrected P < 0.05, n = 4–6 mice per sex/group). c, Transcription factor functional enrichment analysis in microglia comparing APP/PS1:miR-155 cKO vs. APP/PS1 mice at 4 months old (R_Dorothea, FDR-corrected P < 0.05). d, Workflow of generating miR-155 targetome. e, Volcano plots showing common genes (highlighted) between miR-155 targetome and DEGs from four different comparisons: male and female miR-155 cKO vs. WT at the age of 8 months, APP/PS1:miR-155 cKO vs. APP/PS1 at the age of 4 and 8 months (Two-sided Wald test, P < 0.05, n = 5–13 mice per group). f, Table of common miR-155 targeted genes among four different comparisons in e. See also Supplementary Table 1.
Extended Data Fig. 6. miR-155 ablation sensitizes microglial transition to the pre-MGnD cluster through IFNγ signaling.
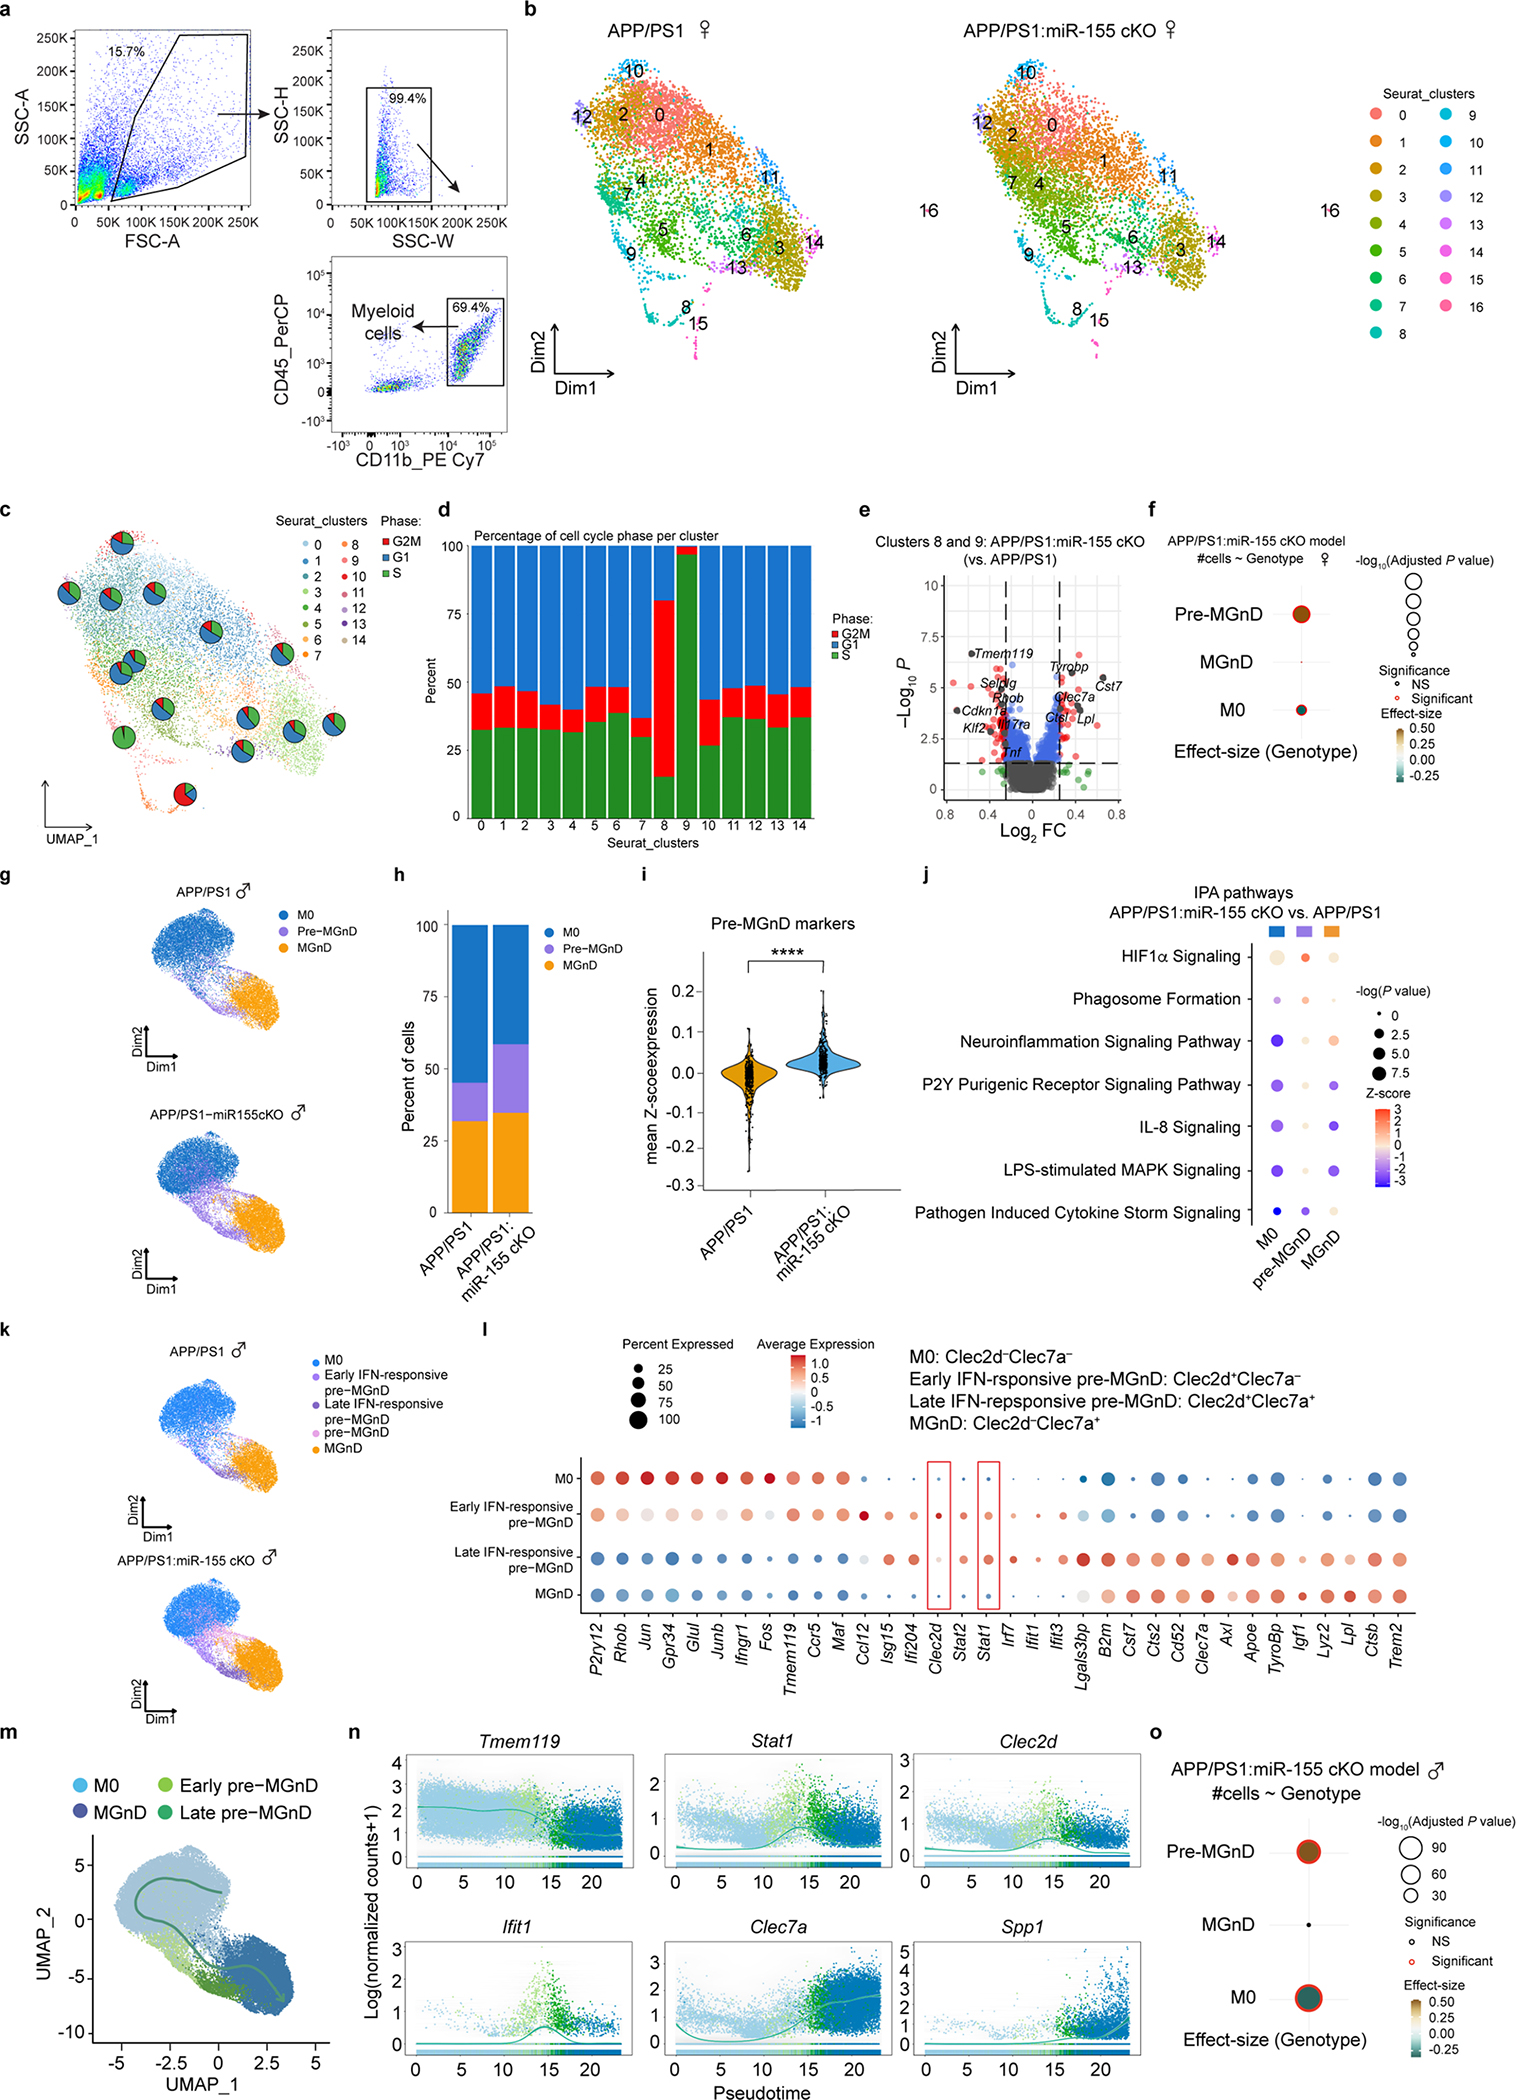
a, Gating strategy for sorting CD11b+CD45+ myeloid cells. b, Unbiased UMAP plots analysis of female APP/PS1 and APP/PS1:miR-155 cKO microglia from single cell sequencing. Initial clustering generated 17 sub-clusters (n = 2 mice per group, 15,429 cells). c, Cell cycle phase analysis for each cluster (clusters 15 and 16 removed). d, Percentage of cell cycle phase within each sub-cluster. e, Volcano plots of DEGs in the proliferating microglia clusters 8 and 9 comparing APP/PS1:miR-155 cKO microglia and APP/PS1 microglia (Two-sided Wald test, P < 0.05). f, Effect-size of differences in the proportion of microglia clusters between genotypes in female APP/PS1:miR-155 cKO mice determined by Poisson regression. The color bar indicates the P value, while the size of the points indicates the effect size. g, UMAP plots analysis of three major microglia clusters identified in male APP/PS1 and APP/PS1:miR-155 cKO microglia from scRNA sequencing (n = 3 mice per group, 43,667 cells). h, Bar charts showing relative percentage of each major microglia cluster in APP/PS1 and APP/PS1:miR-155 cKO mice. i, Violin plots showing the mean Z-score of pre-MGnD markers in APP/PS1 and APP/PS1:miR-155 cKO male mice. P = 3.54507e-91 by Kruska-Wallis test, FDR corrected using Benjamini Hochberg. j, Top-affected pathways from IPA analysis of all three clusters based on the comparison of APP/PS1:miR-155 cKO microglia vs. APP/PS1 microglia at 4 months of age (DEGs were identified with two-sided Wilcox FDR-corrected P < 0.05). k, UMAP plots analysis of microglia clusters identified in male APP/PS1 and APP/PS1:miR-155 cKO microglia including subclusters of pre-MGnD. l, Dot plot showing top markers for four microglia clusters (M0, early IFN-responsive pre-MGnD, late IFN-responsive pre-MGnD and MGnD). m, Trajectory analysis showing the transition from M0 to MGnD via IFN-responsive pre-MGnD clusters. n, Dynamic plots showing the expression of selected genes in all four major microglia clusters. o, Effect-size of differences in the proportion of microglia clusters between genotypes in male APP/PS1:miR-155 cKO mice determined by Poisson regression. The color bar indicates the P value, while the size of the points indicates the effect size. Standard error bars were shown. See also Supplementary Table 2.
Extended Data Fig. 7. Validation of Stat1 and Clec2d pre-MGnD markers.
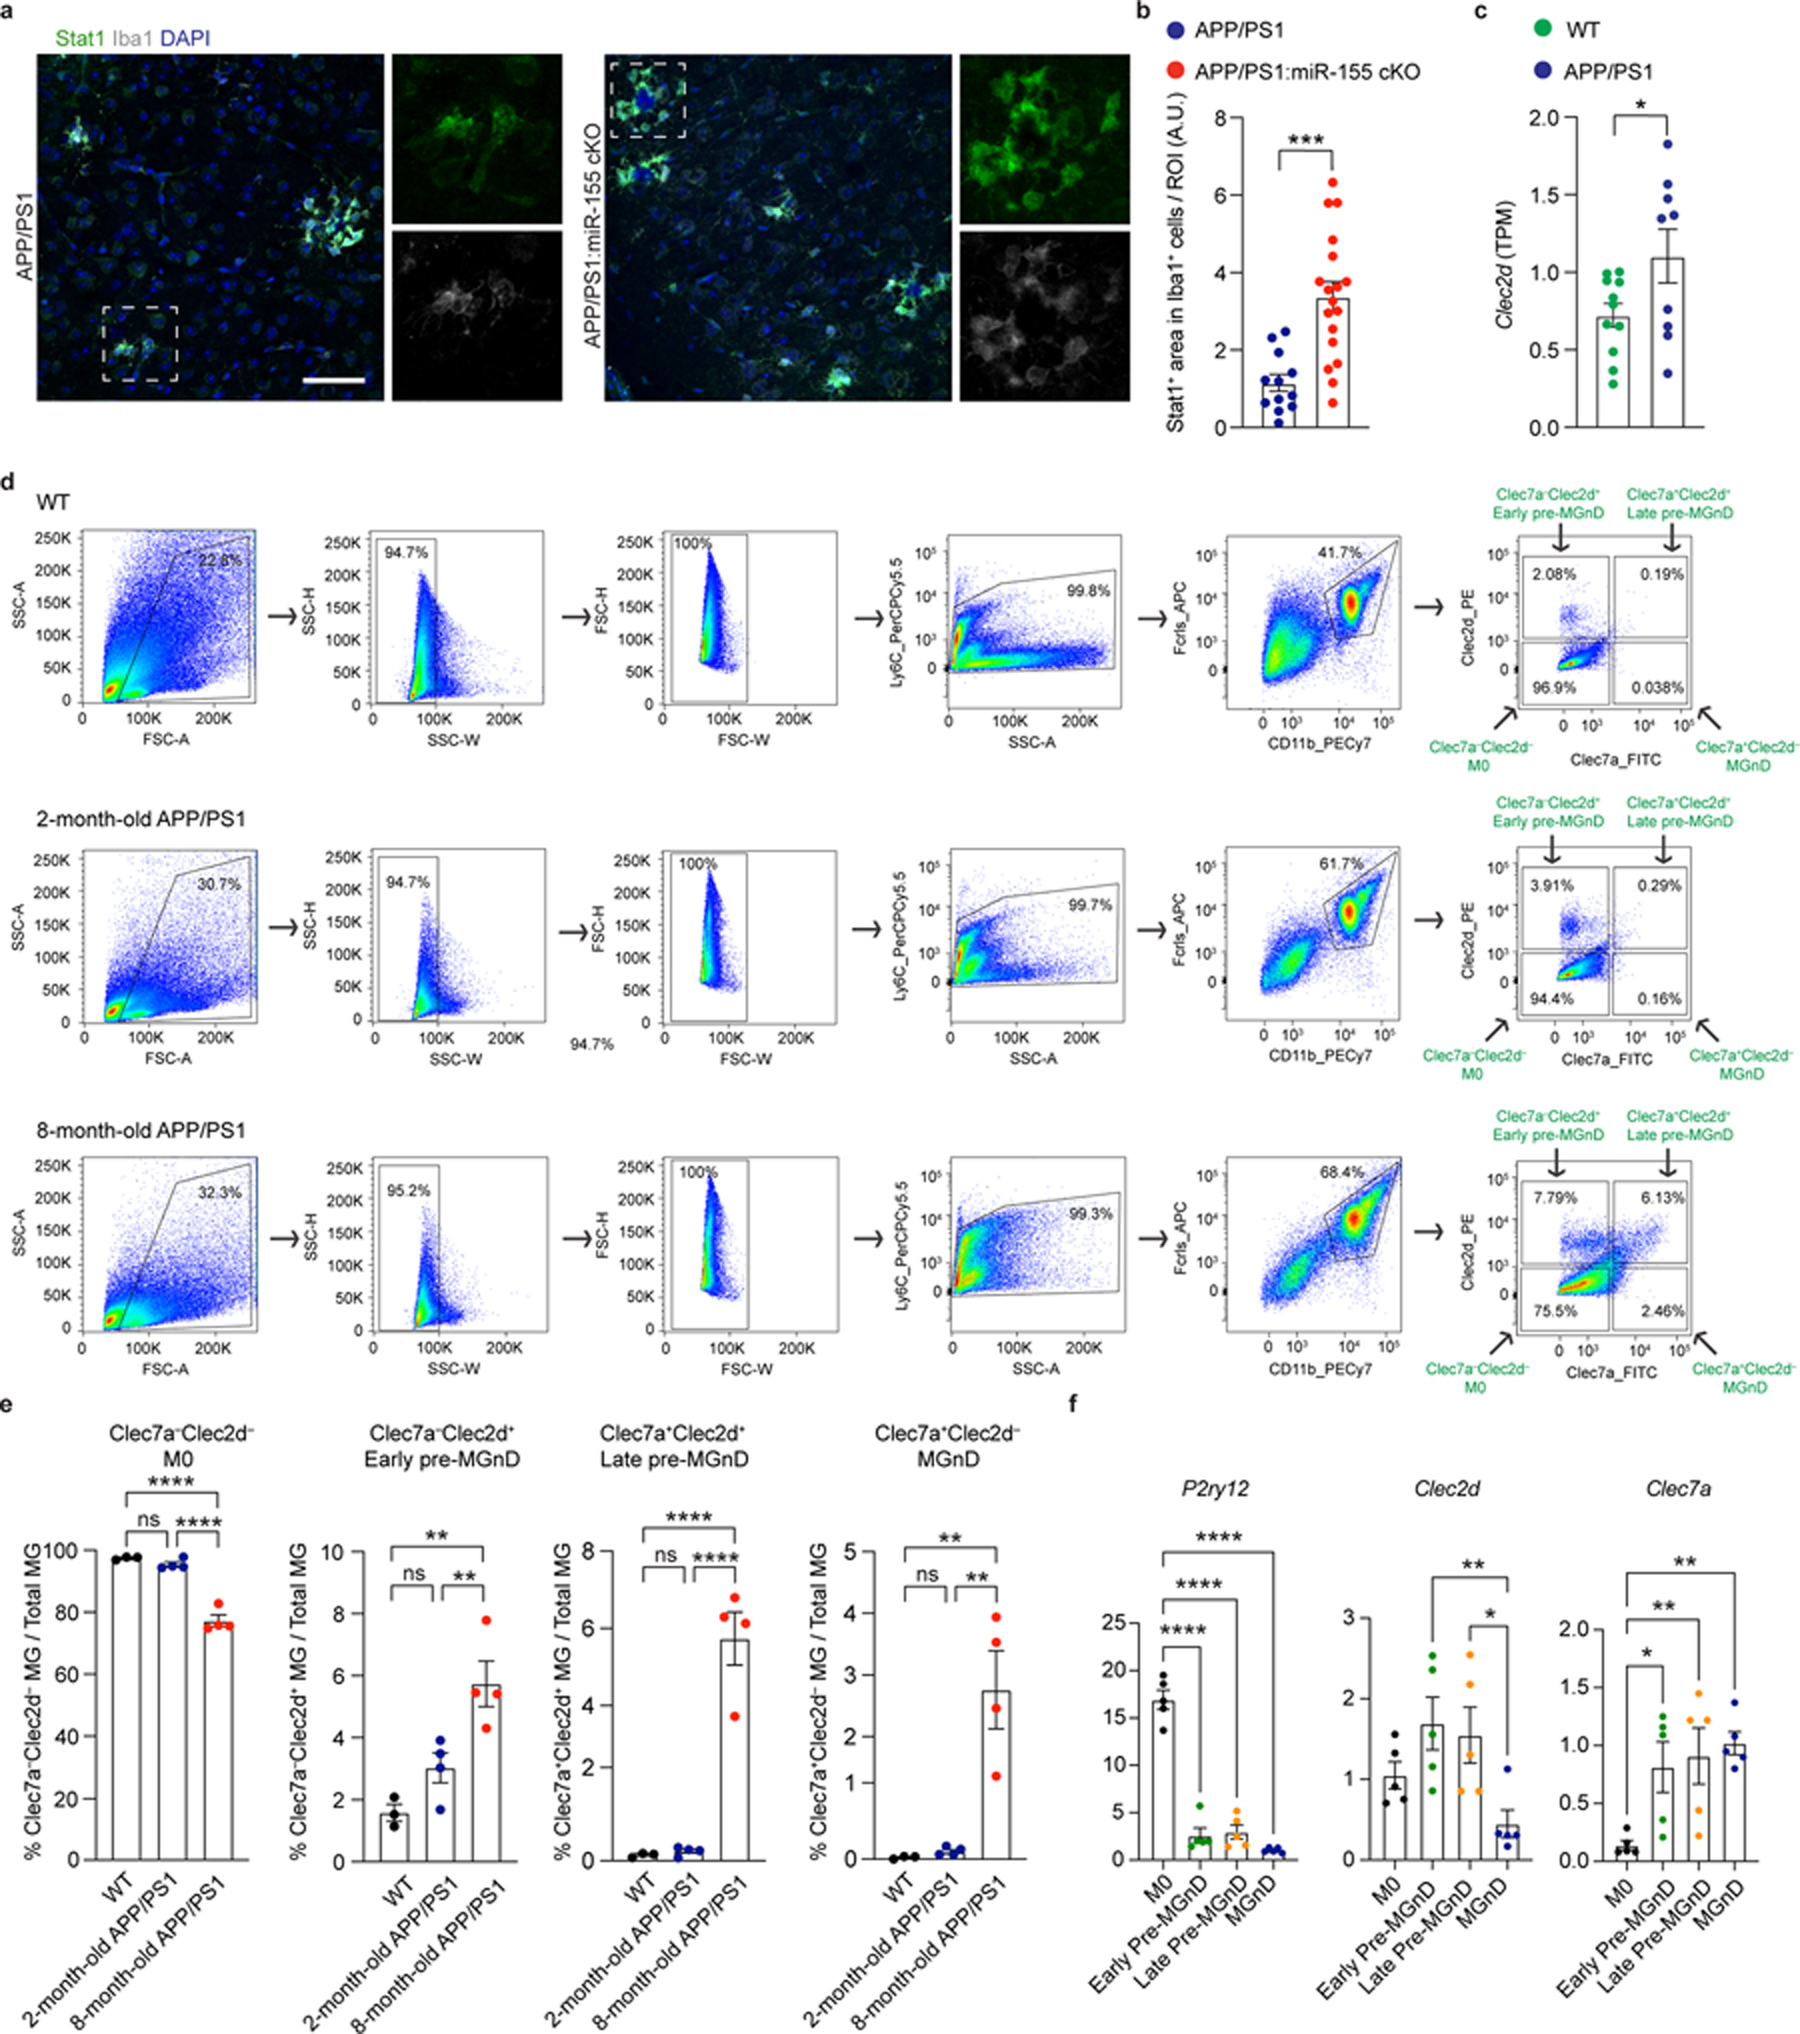
a, Confocal microscopy images of Stat1+ and Iba1+ cells in the brain of APP/PS1 and APP/PS1:miR-155 cKO mice at 4 months of age. Scale bar: 50 μm. b, Quantification of Stat1positive are in Iba1+ cells per ROI, P = 0.0001 by two-tailed Student’s unpaired t-test (n = 12 ROIs from 3 mice for APP/PS1 group, n = 18 ROIs from 6 mice for APP/PS1:miR-155 cKO group). c, Comparison of transcript per million (TPM) level of Clec2d between WT and APP/PS1 mice, P = 0.0458 by two-tailed Student’s unpaired t-test (n = 11 APP/PS1, n = 9 APP/PS1:miR-155 cKO). d, FACS plots showing four clusters in WT, 2- and 8-month-old APP/PS1 mice, which are Clec7a−Clec2d− (M0), Clec7a−Clec2d+ (early pre-MGnD), Clec7a+Clec2d+ (late pre-MGnD), and Clec7a+Clec2d− (MGnD). e, Quantification of percentage of four clusters mentioned in d from WT, 2- and 8-month-old APP/PS1 mice, P < 0.0001 for M0 and late pre-MGnD, P = 0.0011 (WT vs. 8-month-old APP/PS1) and P = 0.0084 (2-month-old APP/PS1 vs. 8-month-old APP/PS1) for early pre-MGnD, P = 0.0017 (WT vs. 8-month-old APP/PS1) and P = 0.0014 (2-month-old APP/PS1 vs. 8-month-old APP/PS1) for MGnD as determined by one-way ANOVA (n = 3 WT, n = 4 APP/PS1). f, qPCR Quantification of gene expression of P2ry12, Clec2d, and Clec7a in M0, early pre-MGnD, late pre-MGnD, and MGnD clusters, P < 0.0001 for P2ry12, P = 0.0046 (early pre-MGnD vs. MGnD) and P = 0.0103 (late pre-MGnD vs. MGnD) for Clec2d, P = 0.0136 (M0 vs. early pre-MGnD), P = 0.0060 (M0 vs. late pre-MGnD), and P = 0.0023 (M0 vs. MGnD) for Clec7a as determined by one-way ANOVA (n = 5 mice/group). Data were presented as mean values ± s.e.m.
Extended Data Fig. 8. miR-155 targets Stat1 and regulates interferon signaling pathway.
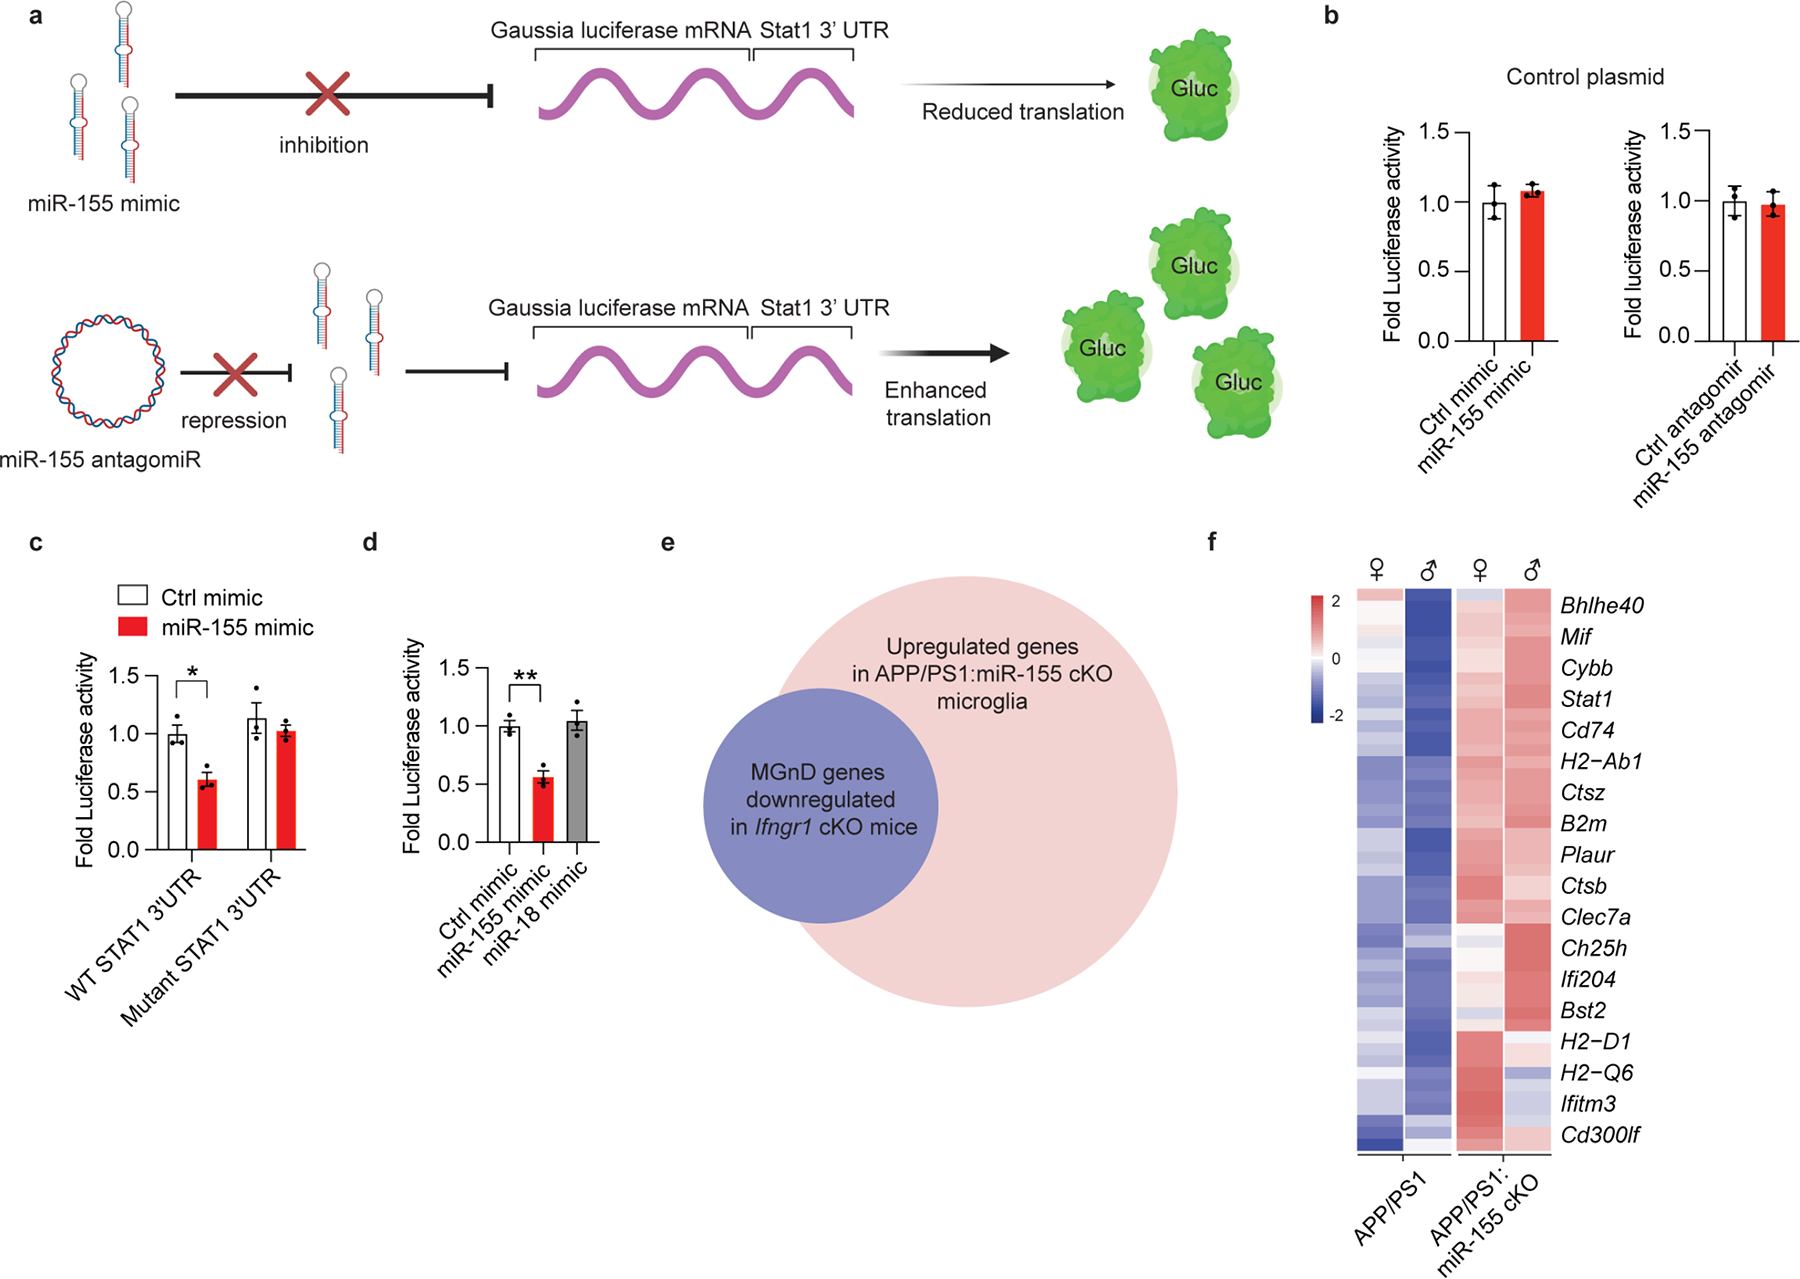
a, Illustration of 3’UTR of Stat1 Gaussia luciferase assay co-transfected with miR-155 mimic or miR-155 antagomir into N9 microglial cells; Created with Biorender.com. b, Control plasmid activity in miR-155 mimic and miR-155 antagomir transfected cells. Fold changes were calculated as compared to control mimic or antagomir using two-tailed Student’s unpaired t-test (n = 3). c, Fold changes of luciferase activity after co-transfection of mutant STAT1 3’UTR and control mimic or miR-155 mimic to check the specific binding of miR-155 to Stat1, P = 0.0234 by two-way ANOVA with Holm-Sidak post hoc analysis (n = 3). d, Fold changes of luciferase activity after non-mutated Stat1 3’UTR co-transfected with the non-relevant miRNA mimic (miR-18), P = 0.0072 by one-way ANOVA with post hoc Tukey’s test (n = 3). Data are representative of 2 independent experiments and show biologically independent replicates (b-d). e, Venn diagram depicting overlap of Ifngr1 cKO downregulated genes and APP/PS1:miR-155 cKO upregulated genes. f, Heatmap showing expression of genes which were downregulated by Ifngr1 cKO phagocytic microglia and upregulated in APP/PS1:miR-155 cKO microglia. Data were presented as mean values ± s.e.m. See also Supplementary Tables 1, 3.
Extended Data Fig. 9. Decreased 6E10+ amyloid plaque burden and enhanced phagocytosis function in APP/PS1:miR-155 cKO mice.
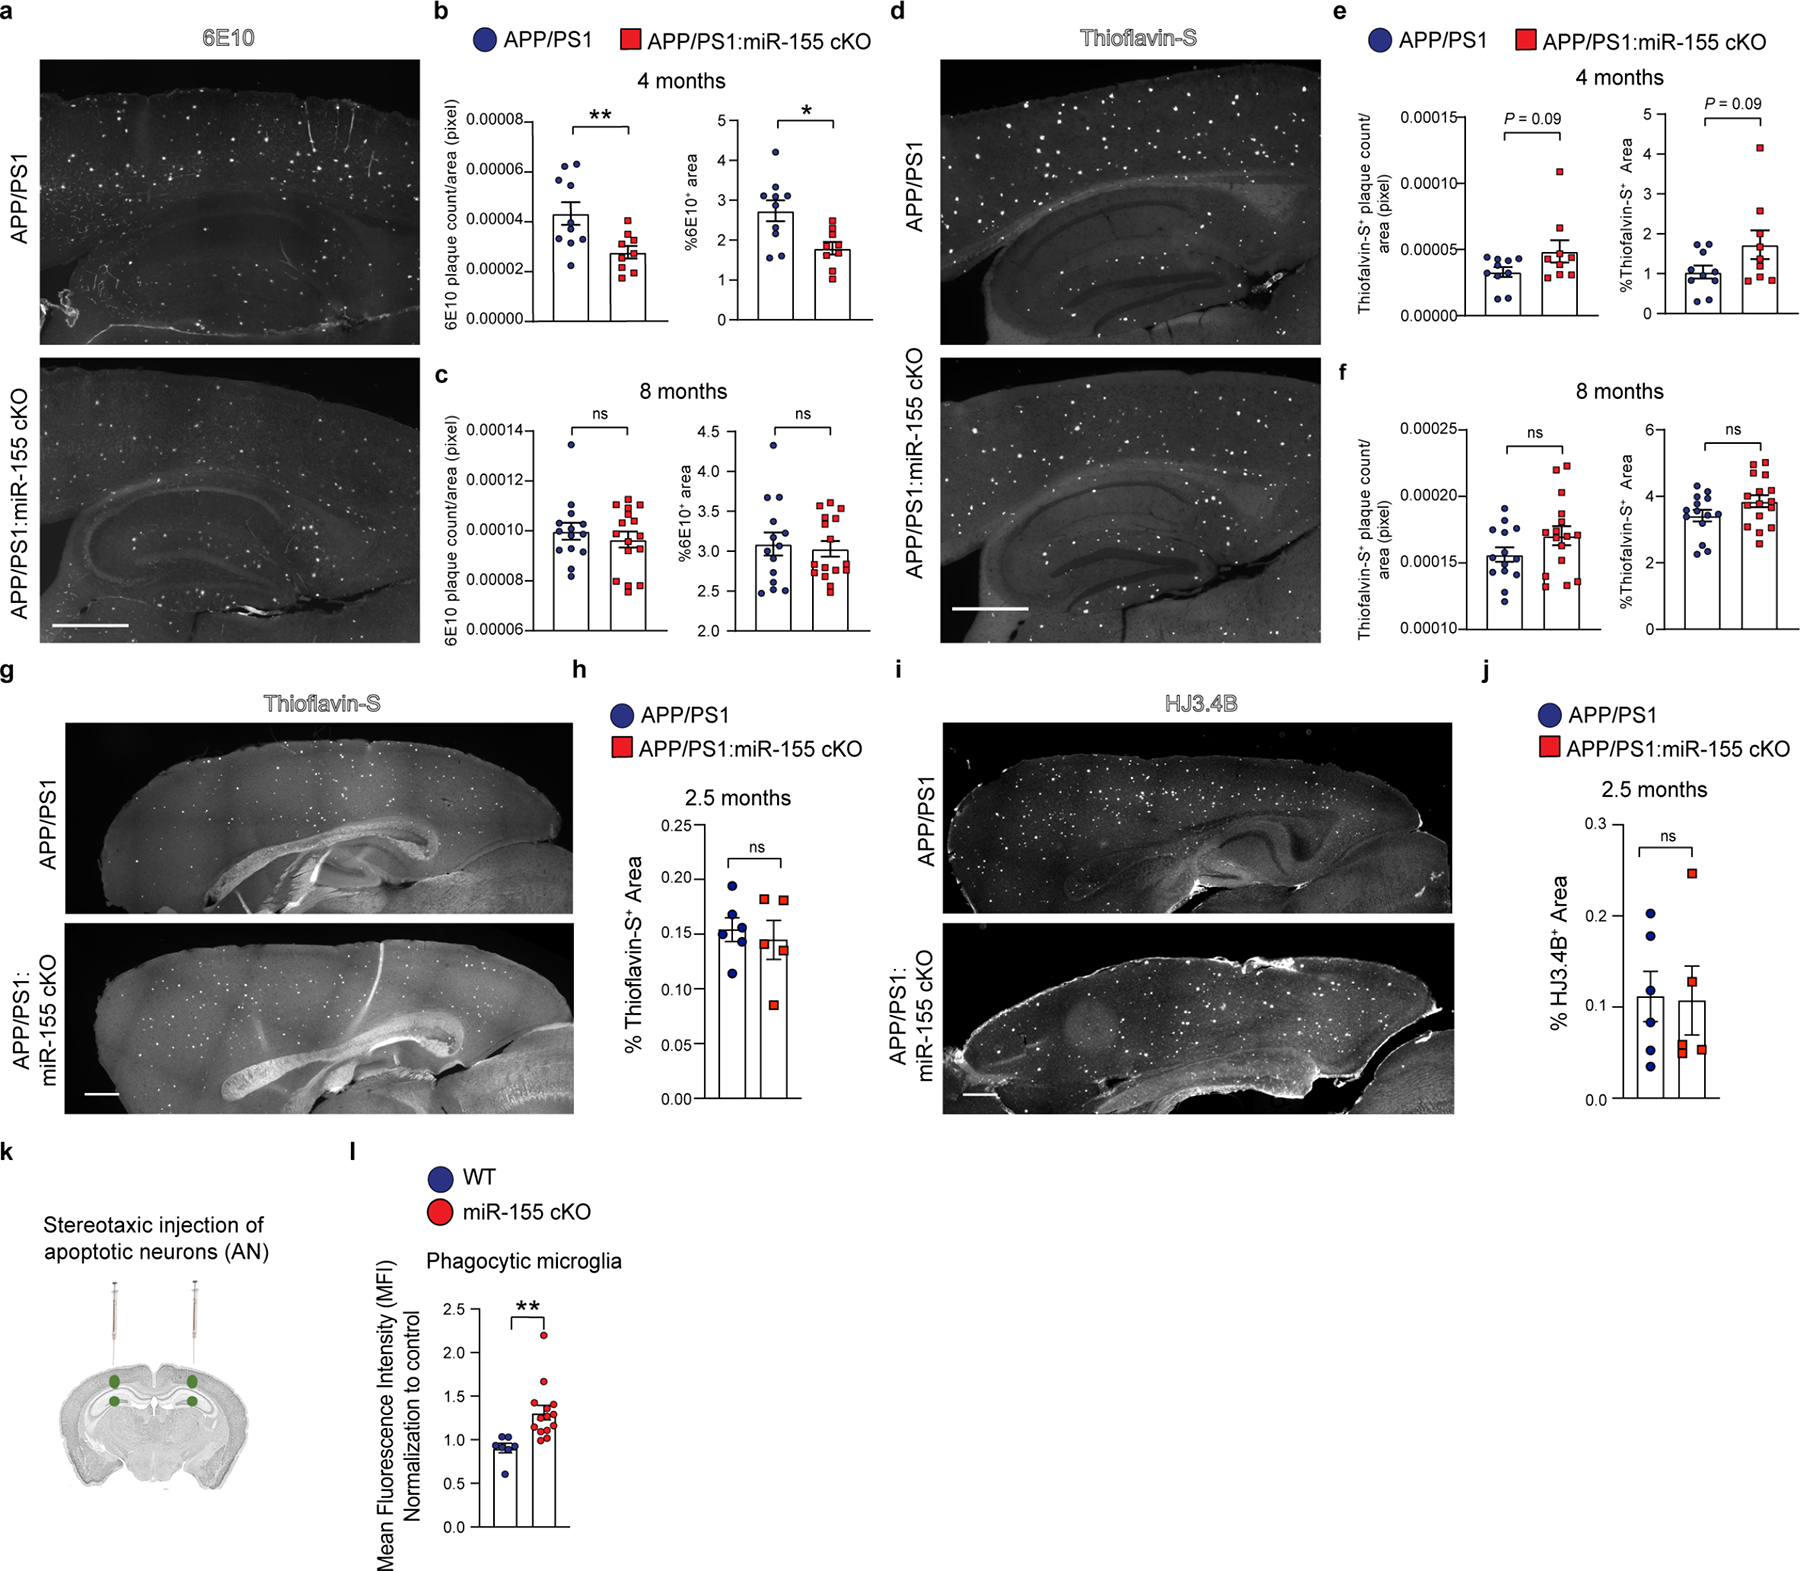
a, Representative images of 6E10 staining in APP/PS1 and APP/PS1:miR-155 cKO brains at the age of 4 months. Scale bar: 500 μm. b, 6E10 plaque counts normalized to area and percent area 6E10 positivity in 4-month-old mice. P values were determined using two-tailed Student’s unpaired t-test, P = 0.0084 and P = 0.0104, respectively (n = 10 APP/PS1, n = 9 APP/PS1:miR-155 cKO). c, 6E10 plaque counts normalized to area and percent area 6E10 positivity in 8-month-old mice (n = 14 APP/PS1, n = 16 APP/PS1:miR-155 cKO). P values were determined using two-tailed Student’s unpaired t-test. d, Representative images of Thioflavin-S in the cortex and hippocampus of APP/PS1 and APP/PS1:miR-155 cKO mice at 4 months old. Scale bar: 500 μm. P values were determined using two-tailed Student’s unpaired t-test. e, Thioflavin-S plaque counts normalized to area and percent area Thioflavin-S positivity in 4-month-old mice. P values were determined using two-tailed Student’s unpaired t-test (n = 10 APP/PS1, n = 9 APP/PS1:miR-155 cKO, P = 0.09). f, Thioflavin-S plaque counts normalized to area and percent area Thioflavin-S positivity in 8-month-old mice (n = 14 APP/PS1, n = 16 APP/PS1:miR-155 cKO). P values were determined using two-tailed Student’s unpaired t-test. g, Representative images of Thioflavin-S in the cortex and hippocampus of APP/PS1 and APP/PS1:miR-155 cKO mice at 2.5 months of age. Scale bar: 500 μm. h, Quantification of Thioflavin-S+ plaque area in the cortical region at 2.5 months of age using two-tailed Student’s unpaired t-test (n = 6 APP/PS1, n = 5 APP/PS1:miR-155 cKO). i, Representative images of HJ3.4B staining in APP/PS1 and APP/PS1:miR-155 cKO brains. Scale bar: 500 μm. j, Quantification of HJ3.4B+ plaque area normalized to cortical area at 2.5 months of age using two-tailed Student’s unpaired t-test (n = 6 APP/PS1, n = 5 APP/PS1:miR-155 cKO). k, Apoptotic neuron injection scheme. l, Mean fluorescence intensity (MFI) of phagocytic microglia sorted from WT and miR-155 cKO mice following apoptotic neuron injection, P = 0.0042 using two-tailed Student’s unpaired t-test (n = 7 WT, n = 14 miR-155 cKO). Data were combined from two independent experiments and normalized to control group (l). Data were presented as mean values ± s.e.m.
Extended Data Fig. 10. Proteomic analysis of whole-brain tissue showed enhanced synaptic functions in APP/PS1:miR-155 cKO mice at 4 and 8 months of age.
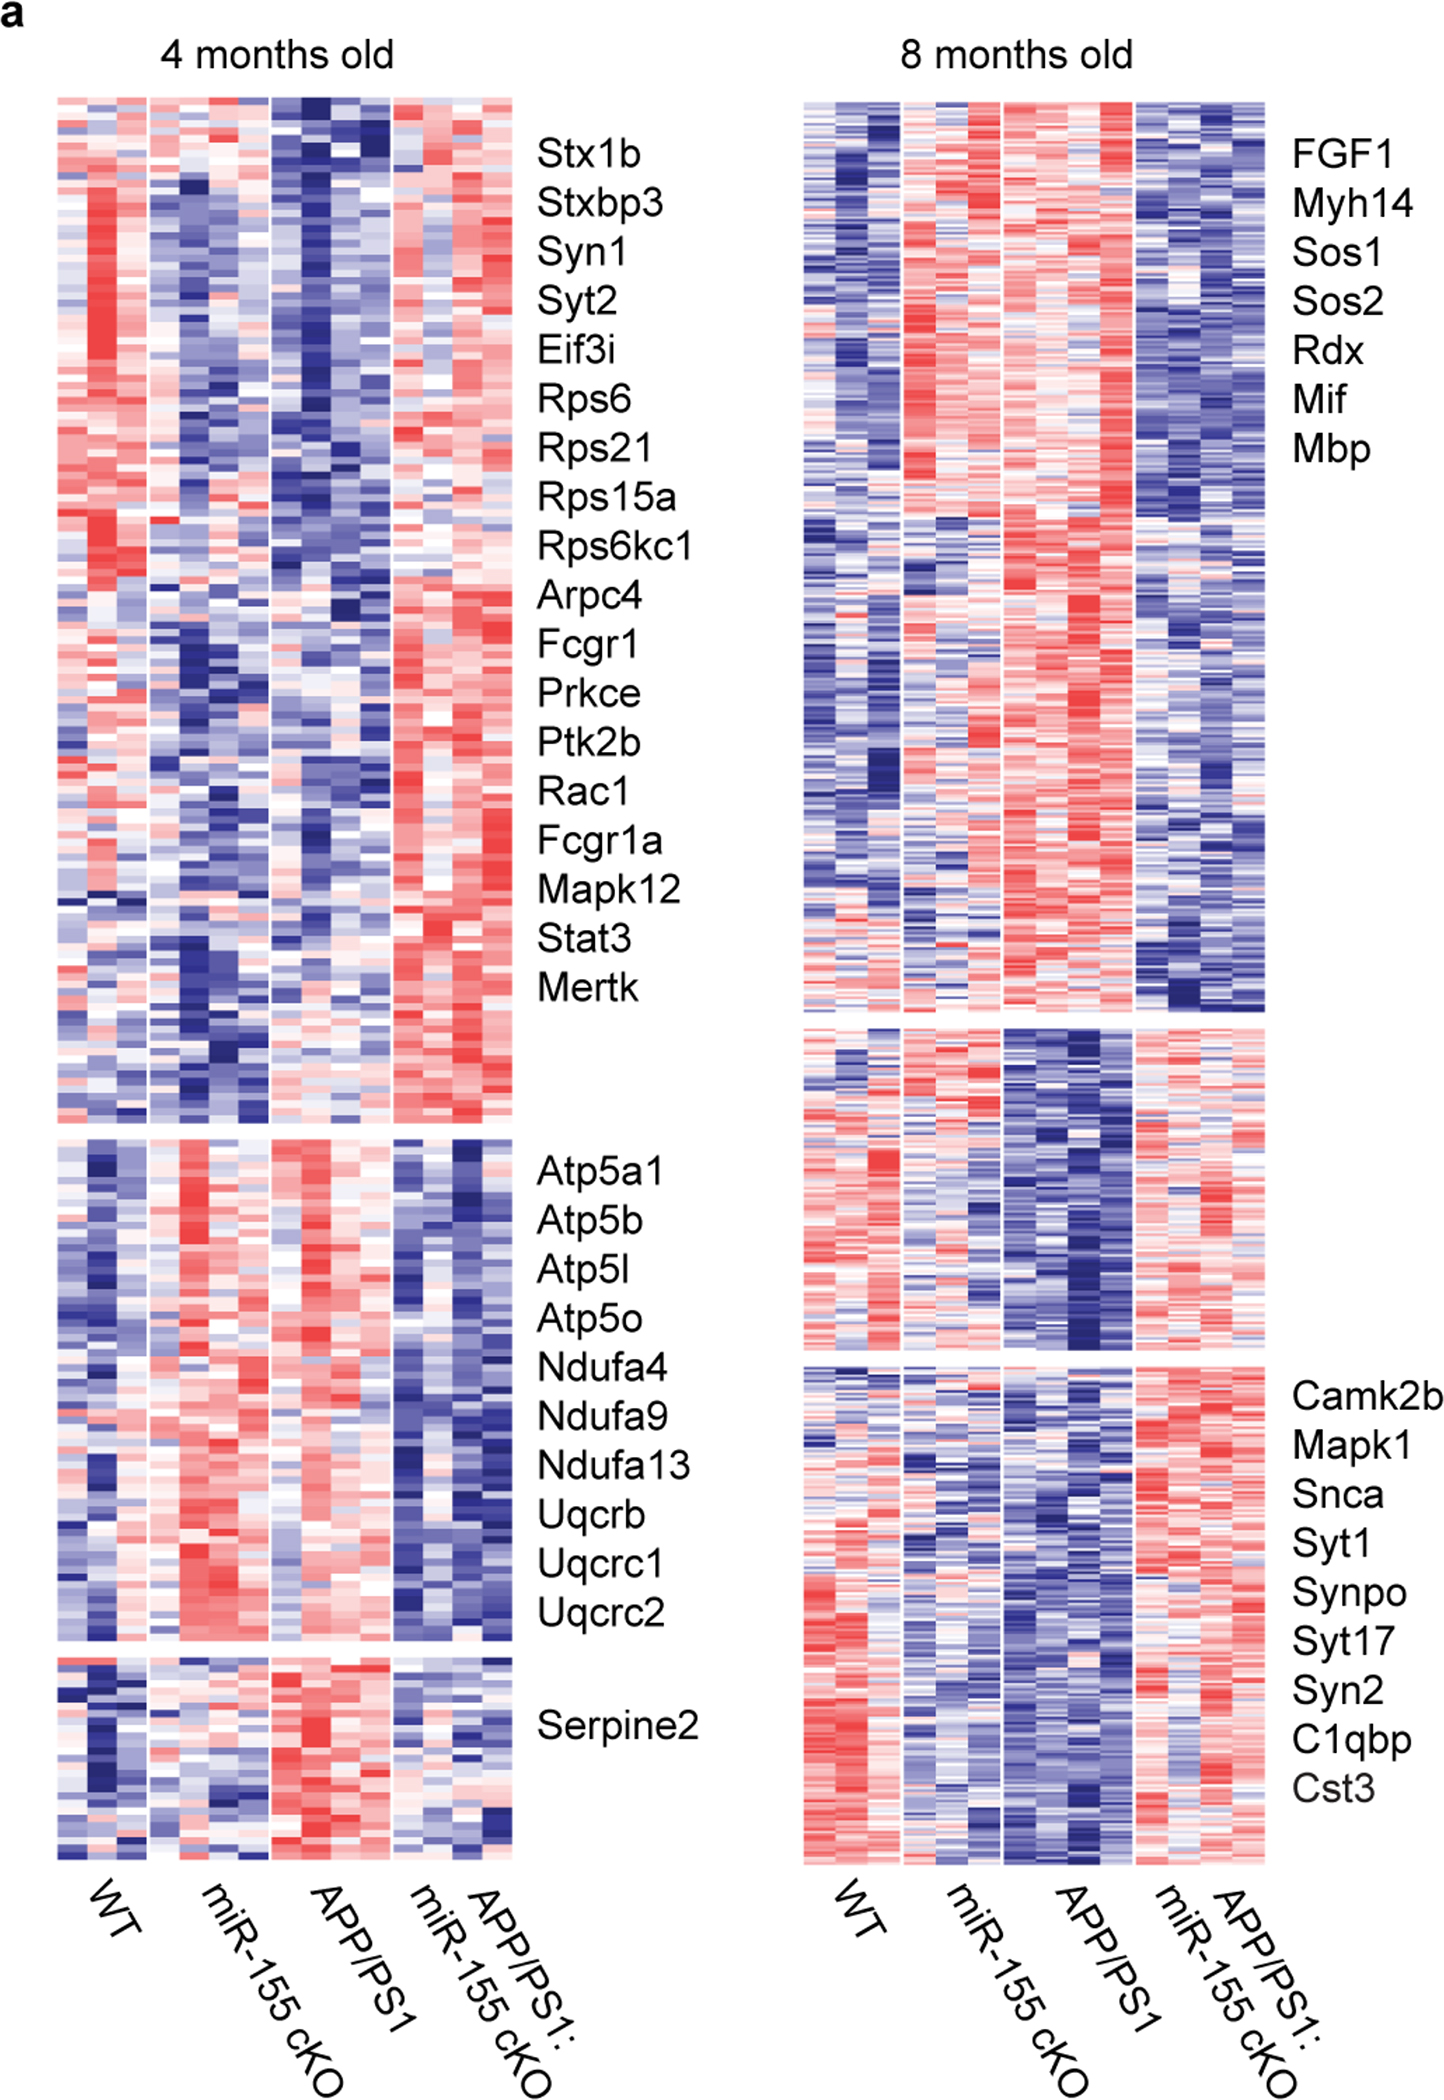
a, Heatmaps of significantly changed proteins between male APP/PS1:miR-155 cKO and APP/PS1 whole brain tissue at 4 and 8 months of age (one-way ANOVA with Student’s t-test between APP/PS1 and APP/PS1:miR-155 cKO mice, P < 0.05, n = 3–4 male mice per group). See also Supplementary Table 4.
Supplementary Material
Acknowledgements
We thank Rajesh Krishnan (Ann Romney Center for Neurologic Diseases Flow Cytometry Core facility) and Brian Tilton (Boston University Flow Cytometry Core facility) for FACS sorting; Yuriy Alekseyev, Boston University Single Cell Sequencing Core facility and Boston University Microarray and Sequencing Resource Core Facility for single cell sequencing; the Single Cell Core at Harvard Medical School for performing the single cell RNA-Seq sample preparation; Lai Ding and NeuroTechnology Studio at Brigham and Women’s Hospital for consultation on data acquisition and data analysis; Dr. Gwenn Garden for sharing miR-155-flox mice; Dr. Sara Garamszegi and Genomic Platform of Broad Institute of MIT and Harvard for Smartseq2 RNAseq; Dr. David Holtzman for sharing the anti-Apoe and anti-Aβ antibodies. This work was supported by grants from the following organizations to the indicated authors. O.B. and T.I.: NIH-NIA (R01AG054672); O.B.: NIH-NIA (R01AG051812, R01AG075509, R01AG080992, R21AG076982, R41AG073059), NIH-NINDS (R01NS088137, R21NS104609, R21NS101673), NIH-NEI (R01EY027921), NIH-NIGMS (R01GM132668); Cure Alzheimer’s Fund (ApoE Consortium) and BrightFocus Foundation (2020A016806); T.I. and S.I.: Cure Alzheimer’s Fund; T.I.: NIH-NIA (RF1AG054199, R01AG066429, R01AG072719 and R01AG067763); S.I.: NIH-NIA (R01AG079859); S.H.: NIH-NIA (F31AG071106) and NIH-NIGMS (T32GM008541). M.A.M: NIH-NEI (K12 EY016335, K08 EY030160) and Research to Prevent Blindness Career Development Award.
Footnotes
Competing Interests
O.B. is an inventor of a patent for use of miR-155 inhibitors for treatment of neurodegenerative diseases. O.B.: collaboration with GSK, Regulus Therapeutics; research funding from Sanofi, GSK, honoraria for lectures, consultancy: Camp4, Ono Pharma USA. T.I. consults Takeda. The remaining authors declare no competing interests.
Code availability
Single-cell and bulk RNAseq were analyzed using customized code available at https://github.com/The-Butovsky-Lab/Yin-Herron-et-al.-miR-155-deletion-study.
Data availability
The data that support the findings of this study are available in this manuscript and supplementary information. The Smartseq2 RNAseq and scRNAseq data that support the findings of this study have been deposited into Gene Expression Omnibus (GEO) under SuperSeries GSE205569.
References
- 1.Efthymiou AG & Goate AM Late onset Alzheimer’s disease genetics implicates microglial pathways in disease risk. Mol Neurodegener 12, 43 (2017). [DOI] [PMC free article] [PubMed] [Google Scholar]
- 2.Lambert JC, et al. Meta-analysis of 74,046 individuals identifies 11 new susceptibility loci for Alzheimer’s disease. Nat Genet 45, 1452–1458 (2013). [DOI] [PMC free article] [PubMed] [Google Scholar]
- 3.Kunkle BW, et al. Genetic meta-analysis of diagnosed Alzheimer’s disease identifies new risk loci and implicates Abeta, tau, immunity and lipid processing. Nat Genet 51, 414–430 (2019). [DOI] [PMC free article] [PubMed] [Google Scholar]
- 4.Colonna M & Butovsky O Microglia Function in the Central Nervous System During Health and Neurodegeneration. Annu Rev Immunol 35, 441–468 (2017). [DOI] [PMC free article] [PubMed] [Google Scholar]
- 5.Heneka MT, et al. Neuroinflammation in Alzheimer’s disease. Lancet Neurol 14, 388–405 (2015). [DOI] [PMC free article] [PubMed] [Google Scholar]
- 6.Butovsky O, et al. Identification of a unique TGF-beta-dependent molecular and functional signature in microglia. Nat Neurosci 17, 131–143 (2014). [DOI] [PMC free article] [PubMed] [Google Scholar]
- 7.Krasemann S, et al. The TREM2-APOE Pathway Drives the Transcriptional Phenotype of Dysfunctional Microglia in Neurodegenerative Diseases. Immunity 47, 566–581 e569 (2017). [DOI] [PMC free article] [PubMed] [Google Scholar]
- 8.Keren-Shaul H, et al. A Unique Microglia Type Associated with Restricting Development of Alzheimer’s Disease. Cell 169, 1276–1290 e1217 (2017). [DOI] [PubMed] [Google Scholar]
- 9.Gosselin D, et al. Environment drives selection and function of enhancers controlling tissue-specific macrophage identities. Cell 159, 1327–1340 (2014). [DOI] [PMC free article] [PubMed] [Google Scholar]
- 10.Wang Y, et al. TREM2 lipid sensing sustains the microglial response in an Alzheimer’s disease model. Cell 160, 1061–1071 (2015). [DOI] [PMC free article] [PubMed] [Google Scholar]
- 11.Butovsky O & Weiner HL Microglial signatures and their role in health and disease. Nat Rev Neurosci 19, 622–635 (2018). [DOI] [PMC free article] [PubMed] [Google Scholar]
- 12.Wang Y, et al. TREM2-mediated early microglial response limits diffusion and toxicity of amyloid plaques. J Exp Med 213, 667–675 (2016). [DOI] [PMC free article] [PubMed] [Google Scholar]
- 13.Yuan P, et al. TREM2 Haplodeficiency in Mice and Humans Impairs the Microglia Barrier Function Leading to Decreased Amyloid Compaction and Severe Axonal Dystrophy. Neuron 90, 724–739 (2016). [DOI] [PMC free article] [PubMed] [Google Scholar]
- 14.Cheng Q, et al. TREM2-activating antibodies abrogate the negative pleiotropic effects of the Alzheimer’s disease variant Trem2R47H on murine myeloid cell function. Journal of Biological Chemistry 293, 12620–12633 (2018). [DOI] [PMC free article] [PubMed] [Google Scholar]
- 15.Cignarella F, et al. TREM2 activation on microglia promotes myelin debris clearance and remyelination in a model of multiple sclerosis. Acta neuropathologica 140, 513–534 (2020). [DOI] [PMC free article] [PubMed] [Google Scholar]
- 16.Ellwanger DC, et al. Prior activation state shapes the microglia response to antihuman TREM2 in a mouse model of Alzheimer’s disease. Proceedings of the National Academy of Sciences 118, e2017742118 (2021). [DOI] [PMC free article] [PubMed] [Google Scholar]
- 17.Fassler M, Rappaport MS, Cuño CB & George J Engagement of TREM2 by a novel monoclonal antibody induces activation of microglia and improves cognitive function in Alzheimer’s disease models. Journal of Neuroinflammation 18, 1–18 (2021). [DOI] [PMC free article] [PubMed] [Google Scholar]
- 18.Schlepckow K, et al. Enhancing protective microglial activities with a dual function TREM 2 antibody to the stalk region. EMBO molecular medicine 12, e11227 (2020). [DOI] [PMC free article] [PubMed] [Google Scholar]
- 19.Jain N, Lewis CA, Ulrich JD & Holtzman DM Chronic TREM2 activation exacerbates Aβ-associated tau seeding and spreading. Journal of Experimental Medicine 220 (2023). [DOI] [PMC free article] [PubMed] [Google Scholar]
- 20.Clayton K, et al. Plaque associated microglia hyper-secrete extracellular vesicles and accelerate tau propagation in a humanized APP mouse model. Mol Neurodegener 16, 18 (2021). [DOI] [PMC free article] [PubMed] [Google Scholar]
- 21.Schafer DP, et al. Microglia sculpt postnatal neural circuits in an activity and complement-dependent manner. Neuron 74, 691–705 (2012). [DOI] [PMC free article] [PubMed] [Google Scholar]
- 22.Stevens B, et al. The classical complement cascade mediates CNS synapse elimination. Cell 131, 1164–1178 (2007). [DOI] [PubMed] [Google Scholar]
- 23.Hong S, et al. Complement and microglia mediate early synapse loss in Alzheimer mouse models. Science 352, 712–716 (2016). [DOI] [PMC free article] [PubMed] [Google Scholar]
- 24.Faraoni I, Antonetti FR, Cardone J & Bonmassar E miR-155 gene: a typical multifunctional microRNA. Biochim Biophys Acta 1792, 497–505 (2009). [DOI] [PubMed] [Google Scholar]
- 25.O’Connell RM, Taganov KD, Boldin MP, Cheng G & Baltimore D MicroRNA-155 is induced during the macrophage inflammatory response. Proc Natl Acad Sci U S A 104, 1604–1609 (2007). [DOI] [PMC free article] [PubMed] [Google Scholar]
- 26.Butovsky O, et al. Targeting miR-155 restores abnormal microglia and attenuates disease in SOD1 mice. Ann Neurol 77, 1085 (2015). [DOI] [PMC free article] [PubMed] [Google Scholar]
- 27.Koval ED, et al. Method for widespread microRNA-155 inhibition prolongs survival in ALS-model mice. Hum Mol Genet 22, 4127–4135 (2013). [DOI] [PMC free article] [PubMed] [Google Scholar]
- 28.Readhead B, et al. miR155 regulation of behavior, neuropathology, and cortical transcriptomics in Alzheimer’s disease. Acta Neuropathol 140, 295–315 (2020). [DOI] [PMC free article] [PubMed] [Google Scholar]
- 29.Aloi MS, et al. The pro-inflammatory microRNA miR-155 influences fibrillar beta-Amyloid1 −42 catabolism by microglia. Glia 69, 1736–1748 (2021). [DOI] [PMC free article] [PubMed] [Google Scholar]
- 30.Hu R, et al. miR-155 promotes T follicular helper cell accumulation during chronic, low-grade inflammation. Immunity 41, 605–619 (2014). [DOI] [PMC free article] [PubMed] [Google Scholar]
- 31.Parkhurst CN, et al. Microglia promote learning-dependent synapse formation through brain-derived neurotrophic factor. Cell 155, 1596–1609 (2013). [DOI] [PMC free article] [PubMed] [Google Scholar]
- 32.Radde R, et al. Abeta42-driven cerebral amyloidosis in transgenic mice reveals early and robust pathology. EMBO Rep 7, 940–946 (2006). [DOI] [PMC free article] [PubMed] [Google Scholar]
- 33.Goldmann T, et al. Origin, fate and dynamics of macrophages at central nervous system interfaces. Nat Immunol 17, 797–805 (2016). [DOI] [PMC free article] [PubMed] [Google Scholar]
- 34.Roy ER, et al. Type I interferon response drives neuroinflammation and synapse loss in Alzheimer disease. J Clin Invest 130, 1912–1930 (2020). [DOI] [PMC free article] [PubMed] [Google Scholar]
- 35.Sala Frigerio C, et al. The Major Risk Factors for Alzheimer’s Disease: Age, Sex, and Genes Modulate the Microglia Response to Abeta Plaques. Cell Rep 27, 1293–1306 e1296 (2019). [DOI] [PMC free article] [PubMed] [Google Scholar]
- 36.Lai JJ, Cruz FM & Rock KL Immune Sensing of Cell Death through Recognition of Histone Sequences by C-Type Lectin-Receptor-2d Causes Inflammation and Tissue Injury. Immunity 52, 123–135 e126 (2020). [DOI] [PMC free article] [PubMed] [Google Scholar]
- 37.Gracias DT, et al. The microRNA miR-155 controls CD8+ T cell responses by regulating interferon signaling. Nature immunology 14, 593–602 (2013). [DOI] [PMC free article] [PubMed] [Google Scholar]
- 38.Li H, Gade P, Xiao W & Kalvakolanu DV The interferon signaling network and transcription factor C/EBP-β. Cellular & molecular immunology 4, 407 (2007). [PMC free article] [PubMed] [Google Scholar]
- 39.He M, Xu Z, Ding T, Kuang D-M & Zheng L MicroRNA-155 regulates inflammatory cytokine production in tumor-associated macrophages via targeting C/EBPβ. Cellular & molecular immunology 6, 343–352 (2009). [DOI] [PMC free article] [PubMed] [Google Scholar]
- 40.Prencipe G, et al. Neutralization of IFN-gamma reverts clinical and laboratory features in a mouse model of macrophage activation syndrome. J Allergy Clin Immunol 141, 1439–1449 (2018). [DOI] [PubMed] [Google Scholar]
- 41.Parhizkar S, et al. Loss of TREM2 function increases amyloid seeding but reduces plaque-associated ApoE. Nat Neurosci 22, 191–204 (2019). [DOI] [PMC free article] [PubMed] [Google Scholar]
- 42.Serneels L, et al. gamma-Secretase heterogeneity in the Aph1 subunit: relevance for Alzheimer’s disease. Science 324, 639–642 (2009). [DOI] [PMC free article] [PubMed] [Google Scholar]
- 43.Hammond TR, et al. Single-cell RNA sequencing of microglia throughout the mouse lifespan and in the injured brain reveals complex cell-state changes. Immunity 50, 253–271. e256 (2019). [DOI] [PMC free article] [PubMed] [Google Scholar]
- 44.Gerrits E, et al. Distinct amyloid-beta and tau-associated microglia profiles in Alzheimer’s disease. Acta Neuropathol 141, 681–696 (2021). [DOI] [PMC free article] [PubMed] [Google Scholar]
- 45.Mathys H, et al. Single-cell transcriptomic analysis of Alzheimer’s disease. Nature 570, 332–337 (2019). [DOI] [PMC free article] [PubMed] [Google Scholar]
- 46.Zhou Y, et al. Human and mouse single-nucleus transcriptomics reveal TREM2-dependent and TREM2-independent cellular responses in Alzheimer’s disease. Nat Med 26, 131–142 (2020). [DOI] [PMC free article] [PubMed] [Google Scholar]
- 47.Sierksma A, et al. Deregulation of neuronal miRNAs induced by amyloid-beta or TAU pathology. Mol Neurodegener 13, 54 (2018). [DOI] [PMC free article] [PubMed] [Google Scholar]
- 48.Culpan D, Kehoe PG & Love S Tumour necrosis factor-alpha (TNF-alpha) and miRNA expression in frontal and temporal neocortex in Alzheimer’s disease and the effect of TNF-alpha on miRNA expression in vitro. Int J Mol Epidemiol Genet 2, 156–162 (2011). [PMC free article] [PubMed] [Google Scholar]
- 49.Patrick E, et al. Dissecting the role of non-coding RNAs in the accumulation of amyloid and tau neuropathologies in Alzheimer’s disease. Mol Neurodegener 12, 51 (2017). [DOI] [PMC free article] [PubMed] [Google Scholar]
- 50.Lau P, et al. Alteration of the microRNA network during the progression of Alzheimer’s disease. EMBO Mol Med 5, 1613–1634 (2013). [DOI] [PMC free article] [PubMed] [Google Scholar]
- 51.Landgraf P, et al. A mammalian microRNA expression atlas based on small RNA library sequencing. Cell 129, 1401–1414 (2007). [DOI] [PMC free article] [PubMed] [Google Scholar]
- 52.Korotkov A, et al. Increased expression of miR142 and miR155 in glial and immune cells after traumatic brain injury may contribute to neuroinflammation via astrocyte activation. Brain Pathology 30, 897–912 (2020). [DOI] [PMC free article] [PubMed] [Google Scholar]
References
- 53.Parkhurst CN, et al. Microglia promote learning-dependent synapse formation through brain-derived neurotrophic factor. Cell 155, 1596–1609 (2013). [DOI] [PMC free article] [PubMed] [Google Scholar]
- 54.Lee SH, et al. Identifying the initiating events of anti-Listeria responses using mice with conditional loss of IFN-gamma receptor subunit 1 (IFNGR1). J Immunol 191, 4223–4234 (2013). [DOI] [PMC free article] [PubMed] [Google Scholar]
- 55.Radde R, et al. Abeta42-driven cerebral amyloidosis in transgenic mice reveals early and robust pathology. EMBO Rep 7, 940–946 (2006). [DOI] [PMC free article] [PubMed] [Google Scholar]
- 56.Hu R, et al. miR-155 promotes T follicular helper cell accumulation during chronic, low-grade inflammation. Immunity 41, 605–619 (2014). [DOI] [PMC free article] [PubMed] [Google Scholar]
- 57.Butovsky O, et al. Identification of a unique TGF-beta-dependent molecular and functional signature in microglia. Nat Neurosci 17, 131–143 (2014). [DOI] [PMC free article] [PubMed] [Google Scholar]
- 58.Krasemann S, et al. The TREM2-APOE Pathway Drives the Transcriptional Phenotype of Dysfunctional Microglia in Neurodegenerative Diseases. Immunity 47, 566–581 e569 (2017). [DOI] [PMC free article] [PubMed] [Google Scholar]
- 59.Picelli S, et al. Smart-seq2 for sensitive full-length transcriptome profiling in single cells. Nat Methods 10, 1096–1098 (2013). [DOI] [PubMed] [Google Scholar]
- 60.Garcia-Alonso L, Holland CH, Ibrahim MM, Turei D & Saez-Rodriguez J Benchmark and integration of resources for the estimation of human transcription factor activities. Genome Res 29, 1363–1375 (2019). [DOI] [PMC free article] [PubMed] [Google Scholar]
- 61.Hao Y, et al. Integrated analysis of multimodal single-cell data. Cell 184, 3573–3587 e3529 (2021). [DOI] [PMC free article] [PubMed] [Google Scholar]
- 62.Germain PL, Lun A, Garcia Meixide C, Macnair W & Robinson MD Doublet identification in single-cell sequencing data using scDblFinder. F1000Res 10, 979 (2021). [DOI] [PMC free article] [PubMed] [Google Scholar]
- 63.Zappia L & Oshlack A Clustering trees: a visualization for evaluating clusterings at multiple resolutions. Gigascience 7 (2018). [DOI] [PMC free article] [PubMed] [Google Scholar]
- 64.Korsunsky I, et al. Fast, sensitive and accurate integration of single-cell data with Harmony. Nat Methods 16, 1289–1296 (2019). [DOI] [PMC free article] [PubMed] [Google Scholar]
- 65.Subramanian Ae.a. Obesity-instructed TREM2high macrophages identified by comparative analysis of diabetic mouse and human kidney at single cell resolution. bioRxiv (2021). [Google Scholar]
- 66.Gabriely G, et al. Myeloid cell subsets that express latency-associated peptide promote cancer growth by modulating T cells. iScience 24, 103347 (2021). [DOI] [PMC free article] [PubMed] [Google Scholar]
- 67.Mantri M, et al. Spatiotemporal single-cell RNA sequencing of developing chicken hearts identifies interplay between cellular differentiation and morphogenesis. Nat Commun 12, 1771 (2021). [DOI] [PMC free article] [PubMed] [Google Scholar]
- 68.Mootha VK, et al. PGC-1alpha-responsive genes involved in oxidative phosphorylation are coordinately downregulated in human diabetes. Nat Genet 34, 267–273 (2003). [DOI] [PubMed] [Google Scholar]
- 69.Subramanian A, et al. Gene set enrichment analysis: a knowledge-based approach for interpreting genome-wide expression profiles. Proc Natl Acad Sci U S A 102, 15545–15550 (2005). [DOI] [PMC free article] [PubMed] [Google Scholar]
- 70.Griffiths-Jones S, Grocock RJ, van Dongen S, Bateman A & Enright AJ miRBase: microRNA sequences, targets and gene nomenclature. Nucleic Acids Res 34, D140–144 (2006). [DOI] [PMC free article] [PubMed] [Google Scholar]
- 71.Wolf A, Bauer B, Abner EL, Ashkenazy-Frolinger T & Hartz AM A Comprehensive Behavioral Test Battery to Assess Learning and Memory in 129S6/Tg2576 Mice. PLoS One 11, e0147733 (2016). [DOI] [PMC free article] [PubMed] [Google Scholar]
- 72.Lalonde R The neurobiological basis of spontaneous alternation. Neurosci Biobehav Rev 26, 91–104 (2002). [DOI] [PubMed] [Google Scholar]
Associated Data
This section collects any data citations, data availability statements, or supplementary materials included in this article.
Supplementary Materials
Data Availability Statement
The data that support the findings of this study are available in this manuscript and supplementary information. The Smartseq2 RNAseq and scRNAseq data that support the findings of this study have been deposited into Gene Expression Omnibus (GEO) under SuperSeries GSE205569.