

Abstract
Co-inhibitory and checkpoint molecules suppress T-cell function in the tumor microenvironment, thereby rendering T cells dysfunctional. While immune checkpoint blockade (ICB) has emerged as a successful treatment option for multiple human cancers, severe autoimmune-like side effects limit its application. Here we found the gene encoding the Peptidoglycan Recognition Protein 1 (PGLYRP1) to be highly co-expressed with genes encoding co-inhibitory molecules and hypothesized that it might be a promising target for cancer immunotherapy. Indeed, genetic deletion of PGLYRP1 in mice led to decreased tumor growth and an increased activation/effector phenotype in CD8+ T cells, suggesting an inhibitory function of PGLYRP1 in CD8+ T cells. Surprisingly, the genetic deletion of PGLYRP1 strongly protected against the development of experimental autoimmune encephalomyelitis (EAE), a model of autoimmune disease in the central nervous system (CNS). Pglyrp1-deficient myeloid cells had a defect in antigen-presentation and T-cell activation, indicating that PGLYRP1 might act as a proinflammatory molecule in myeloid cells during autoimmunity. Our results highlight PGLYRP1 as a promising target for immunotherapy that, when targeted, elicits a potent antitumor immune response while protecting against some forms of tissue inflammation and autoimmunity.
Introduction
Immune checkpoint blockade (ICB) has revolutionized cancer treatment by increasing antitumor immunity through blockade of co-inhibitory receptors on immune cells. While additional agents targeting other co-inhibitory molecules are currently being tested for efficacy in clinical trials, to date only the checkpoint molecules CTLA-4, PD-1, PD-L1, and LAG-3 are targets for FDA-approved drugs. Unfortunately, ICB is only effective in a subset of patients with certain cancer types and ineffective in many others1. Hence, there is a strong need to identify new checkpoint molecules as immunotherapy targets.
A major obstacle of current immunotherapy approaches is the development of immune-related adverse events (irAEs) 2. IrAEs arise because of the disruption of important homeostatic functions of immune checkpoint molecules in regulating immune responses and lowering the threshold for activation of self-reactive T cells, thereby breaking peripheral tolerance 3. Hence, ICB can lead to autoimmune-like tissue inflammation, especially at sites with high exposure to foreign antigens, such as mucosal surfaces. The underlying immunological mechanisms leading to irAEs remain unknown. While immunotherapy-induced irAEs correlate with antitumor immunity, it is unclear whether the mechanisms that drive antitumor immunity are also needed for autoimmune-like tissue inflammation 2–4 observed following checkpoint blockade therapy. Novel therapeutic approaches and targets that induce antitumor immunity, but do not induce autoimmune-like toxicity, are needed, and would significantly enhance the benefit and applicability of ICB in the clinic.
PGLYRP1 is a member of the peptidoglycan recognition protein (PGRP) family that is highly conserved from insects to mammals 5. Mammalian PGLYRP1 is ~200 amino acids long with a molecular mass of ~18–20 kDa, and has a signal peptide 6. PGLYRP1 is expressed along the digestive tract 7 especially in the granules of neutrophils and eosinophils 8,9 and to a lesser extent in non-immune cells, including epithelial cells, fibroblasts, and intestinal M-cells 7,10. PGLYRP1 is directly bactericidal against both Gram-positive and Gram-negative bacteria and likely acts by direct binding to cell wall peptidoglycan (PGN) 11,12. PGLYRP1-deficient mice have an increased susceptibility to infection with lowly pathogenic Gram-positive bacteria and PGLYRP1-deficient neutrophils have defects in intracellular killing and digestion of bacteria 8. In the tumor setting, PGLYRP1 has been shown to directly induce apoptotic cell death in tumor cells by forming a cytotoxic complex with heat shock protein 70 (HSP70) 13. The proinflammatory receptor TREM-1 has been proposed as a receptor for PGLYRP1 on myeloid cells 14. PGLYRP1 forms a complex with peptidoglycans (PGN) and the heterodimer binds to TREM-1 to induce proinflammatory cytokine expression in neutrophils and macrophages. While PGLYRP1 has been found to be upregulated in tumor-associated Treg cells 15, until today, no role of PGLYRP1 in T cells has been described.
Here, we report that Pglyrp1 is highly co-expressed with co-inhibitory genes in T cells. Genetic deletion of PGLYRP1 in mice led to decreased tumor growth accompanied by an enhanced activation/effector phenotype in CD8+ T cells. Surprisingly, Pglyrp1 deficiency also resulted in strong protection against autoimmunity using EAE, a central nervous system (CNS) autoimmune disease model, with defects in antigen-presentation in myeloid cells and major alterations in expression profiles of macrophages/monocytes and neutrophils. Our findings highlight PGLYRP1 as a potential target in immunotherapy that can induce a potent antitumor immune response without triggering some forms of tissue inflammation and autoimmunity.
Results
Pglyrp1 is co-expressed with co-inhibitory genes in T cells
Previous work from our laboratory and others showed that co-inhibitory molecules are highly co-expressed in a gene module in T cells 16,17. Hence, we reasoned that genes highly co-expressed with co-inhibitory genes in CD8+ T cells in tumors could encode novel T-cell checkpoint molecules. We leveraged our previously published scRNA-seq data of CD8+ tumor-infiltrating lymphocytes (TILs) from B16F10 melanoma 17 to identify all genes co-varying across single cells with genes encoding known immune checkpoints (Pdcd1, Tigit, Ctla4, Havcr2, Lag3) vs. genes associated with stemness (Ccr7, Cxcr5, Tcf7, Sell) (Fig. 1a, Supplementary Table 1). Genes encoding multiple molecules with known functions in T cells, including Cxcr6, Nkg7, Gzmb, Ifng, Prf1, Irf8, and Bhlhe40 18–21, were positively correlated with checkpoint genes and negatively correlated with stemness genes. In addition, Pglyrp1, which had no known function in T cells, followed this pattern (Spearman ρ with co-inhibitory molecules = 0.47, p=1.2×10⁻²¹; Spearman ρ with stemness genes = −0.27, p=1.8×10⁻⁷; p-values were computed with Spearman’s asymptotic t-tests). Consistently, Pglyrp1 was expressed in a cell cluster characterized by expression of co-inhibitory genes (Pdcd1, Tigit, Ctla4, Havcr2, Lag3) and a T-cell dysfunction signature 22, and not in a cell cluster expressing stem-like genes (Slamf6, Ccr7, Cxcr5, Tcf7, Sell) (Fig. 1b,c). We validated increased Pglyrp1 expression ex vivo in PD-1+ TIM-3+ CD8+ T cells that comprise exhausted T cells isolated from MC38-OVA tumors (Fig. 1d). In scRNA-seq of immune cells from human melanoma tumors 23, Pglyrp1 was expressed the highest in exhausted CD8+ T cells together with other co-inhibitory molecules (Extended Data Fig. 1), albeit at lower levels than RNAs encoding other checkpoint molecules, indicating that co-expression of Pglyrp1 with co-inhibitory molecules is conserved in exhausted human T cells, but may have not been as appreciated given lower RNA levels.
Fig. 1: Co-expression of Pglyrp1 with co-inhibitory receptors in T cells.

(a-c) Pglyrp1 is co-expressed with co-inhibitory receptors in B16 tumor-infiltrating CD8+ T cells based on scRNA-seq data 16. (a) Spearman correlation coefficients of genes with known co-inhibitory genes (Pdcd1, Tigit, Ctla4, Havcr2, Lag3) vs. with stemness genes (Ccr7, Cxcr5, Tcf7, Sell) across single cells. Genes significantly correlated with co-inhibitory genes (FDR < 0.05) and anti-correlated with stem-like genes (FDR < 0.05) were marked in red, and the counterpart in blue. P-values were computed with computed with two-sided Spearman’s asymptotic t-tests and then adjusted for multiple comparisons using the Benjamini & Hochberg method (FDR). (b) Heatmap displaying the expression of Pglyrp1 and selected co-inhibitory genes (top, rows) and selected stem-like genes (bottom, rows) in CD8+ T single cells (columns). The color indicates the cell-wise z-normalized expression level. Genes and cells were ordered by hierarchical clustering using Euclidean distance and Ward’s clustering criterion 52. (c) UMAP plot showing the rank-normalized expression of the CD8+ T cell dysfunction signature 22 and Pglyrp1, Pdcd1, Havcr2, Lag3, and Tigit in tumor-infiltrating single CD8+ T cells 16.
(d) Relative expression (RE) of Pglyrp1 in CD8+ T cells isolated from MC38-OVA tumors to CD8+ T cells isolated from the spleen by qPCR (n=3–4).
(e) Relative expression (RE) of Pglyrp1 in CD4+ (left) and CD8+ (right) T cells in vitro differentiated with IL-27 to cells differentiated without IL-27 by qPCR (n=3).
(f) Relative expression (RE) of Pglyrp1 in CD4+ T cells from wildtype (WT) or Maf−/−Prdm1−/− mice in vitro differentiated +/− IL-27 by qPCR (n=3). The expression was calculated relative to WT cells at day 0.
(g,h) Influence of IL-27-signaling on the expression of Pglyrp1 in vivo. Expression of Pglyrp1 (normalized TPM) in CD8+ T cells isolated from B16 melanoma tumors of wildtype (WT) and Il27ra−/− mice (g) (n=4–5) or Maf−/−Prdm1−/− mice (h) (n=3–7) by bulk RNA-seq 16.
In (d-h) data are presented as the mean with ± SEM. In (d-f,h) unpaired two-tailed t-tests were performed. In (g) a two-tailed Mann-Whitney test was performed. *, P <0.05; **, P <0.01; ***, P <0.001; ****, P <0.0001.
Thus, our data showed that Pglyrp1 was highly co-expressed with co-inhibitory genes in exhausted CD8+ T cells in both mice and humans.
Pglyrp1 expression in T cells is regulated by IL-27
We have previously demonstrated that the cytokine IL-27 induces a co-inhibitory module in T cells 16. Notably, Pglyrp1 was a member of this IL-27-induced co-inhibitory module. To confirm the induction of Pglyrp1 expression by IL-27 in T cells, we cultured naïve CD4+ and naïve CD8+ T cells in vitro with or without IL-27 and confirmed a significant increase of Pglyrp1 expression in CD4+ (~27 fold) and CD8+ (~2.5 fold) T cells upon IL-27- signaling (Fig. 1e). Previously, the transcription factors (TFs) PRDM1 and c-MAF were identified as cooperative regulators of the IL-27- induced co-inhibitory module 16. To test whether they contribute to the IL-27-mediated induction of Pglyrp1 expression in T cells, we cultured naïve CD4+ T cells from PRDM1/c-MAF-deficient mice (Maf−/− Prdm1−/−) in vitro with or without IL-27 (Fig. 1f). The induction of Pglyrp1 expression by IL-27 was significantly reduced in Maf−/− Prdm1−/− T cells, suggesting that the IL-27-PRDM1/c-MAF axis induces Pglyrp1 expression in T cells in vitro. To examine whether IL-27 and PRDM1/c-MAF play a role in Pglyrp1 expression in T cells in vivo, we analyzed our previously published bulk RNA-seq data of CD8+ T cells isolated from B16F10 melanoma tumors in WT and IL-27 receptor-deficient (Il27ra−/−) mice or Maf−/−Prdm1−/− mice 16 (Fig. 1g,h). In both cases, we found a reduced level of Pglyrp1 expression compared to the respective WT controls. Hence, our results suggest that the IL-27-PRDM1/c-MAF axis regulates the expression of Pglyrp1 in T cells in vitro as well as in vivo.
Decreased tumor growth in Pglyrp1-deficient mice
To analyze whether PGLYRP1 plays a functional role in antitumor immunity, we examined the association between the expression levels of PGLYRP1 and survival rate in different human cancers and revealed a significantly worse outcome in tumors with high PGLYRP1 expression (Extended Data Fig. 2), suggesting that PGLYRP1 might act as negative regulator of antitumor immunity in human cancers.
To study the role of PGLYRP1 in immune responses, we obtained Pglyrp1−/− mice (Extended Data Fig. 3a) that showed no alterations in immune system composition and T-cell phenotype at homeostasis (Extended Data Fig. 3b-d). To test the role of PGLYRP1 in antitumor immunity in mice, we implanted MC38-OVA colon carcinoma cells and B16-OVA melanoma cells in Pglyrp1−/− mice and matching wildtype (WT) littermate controls (Fig. 2 and Extended Data Fig. 3e,f). We found decreased tumor sizes and tumor weights in Pglyrp1−/− mice implanted with MC38-OVA cells (Fig. 2a-c), suggesting PGLYRP1 as a potential negative regulator of antitumor immunity. We also found decreased tumor growth in Pglyrp1−/− mice with B16-OVA melanoma cells (Extended Data Fig. 3e,f), highlighting that the effect of Pglyrp1 deficiency on tumor growth is conserved across these tumor types. To analyze whether the loss of PGLYRP1 can synergize with ICB, we induced tumors and administered anti-PD-1 antibodies into Pglyrp1−/− mice. ICB treatment with anti-PD-1 antibody did not improve the tumor growth control in the Pglyrp1−/− mice vs. the WT controls (Extended Data Fig. 3g), suggesting, unlike other checkpoint molecules, the PGLYRP1 pathway does not cooperate with the PD-1 pathway to exert tumor growth control.
Fig. 2: Pglyrp1-deficient mice show enhanced antitumor immunity.

(a-c) MC38-OVA tumors were implanted into WT and Pglyrp1−/− mice. (a) Mean tumor growth (n=9), (b) tumor sizes (n=9) and (c) tumor weights on day 15 (WT n=15, Pglyrp1−/− n= 13) are shown.
(d-k) TILs were harvested from mice bearing MC38-OVA tumors.
(d) Representative flow cytometry data and summary plots of the frequency of Treg cells (CD45+ TCRβ+ CD4+ FOXP3+) (WT n=10, Pglyrp1−/− n= 7).
(e) Representative flow cytometry data and summary plots of the frequency of indicated cytokines in CD8+ T cells (WT n=10, Pglyrp1−/− n= 8), TNF (WT n=10, Pglyrp1−/− n= 11).
(f,g) Representative flow cytometry data and summary plots of the frequency of PD-1+ and TIM-3+ (f) and PD-1+ TIM-3+ double-positive (g) CD8+ T cells (WT n=10, Pglyrp1−/− n= 8).
(h) Volcano plot of differentially expressed genes comparing WT vs. Pglyrp1−/− CD8+ T cells (n=4). Differential genes were computed as FDR < 0.15, |log2 fold change| > 1. Positive log2 fold change corresponds to upregulation in Pglyrp1−/− CD8+ T cells and vice versa. -log10 p-values were capped within [0, 6] for visualization purposes. The dots matching the gene names are highlighted in yellow. P-values were computed with likelihood ratio tests in edgeR, then adjusted for multiple comparisons using the Benjamini & Hochberg method (FDR).
(i) Heatmap of selected differentially expressed genes (columns; FDR < 0.15, |log2 fold change| > 1) comparing WT vs. Pglyrp1−/− CD8+ T cells (n=4; rows). The color represents the sample-wise z-normalized expression level.
(j,k) Gene set enrichment analysis of selected Gene Ontology (GO) terms (j) and published CD8+ T cell signatures (k) enriched in Pglyrp1−/− vs. WT CD8+ T cells. Wherry exhaustion 27; effector vs. memory, exhausted vs. memory 27; effector vs. memory LCMV, effector vs. exhausted 28; effector memory vs. naïve 29; human exhaustion 30. P-values were computed with the empirical phenotype-based permutation tests (GSEA) and the values shown in the figures were not adjusted for multiple comparisons.
In (a,d-g) data are presented as the mean with ± SEM. In (b,c) data are presented as the mean. Unpaired two-tailed t-tests were performed. *, P <0.05; **, P <0.01.
To understand in which immune cell type PGLYRP1 might play a role in the tumor microenvironment (TME), we assessed by qPCR the expression of Pglyrp1 in different immune cell populations isolated from MC38-OVA tumors (Extended Data Fig. 3h). Consistent with our previous analysis (Fig. 1, Extended Data Fig. 1), the highest expression of Pglyrp1 was in exhausted CD8+ T cells. In the innate compartment of the TME, NK cells and neutrophils expressed the highest levels of Pglyrp1. There were no major differences in immune cell population relative frequencies in MC38-OVA tumors grown in Pglyrp1−/− mice compared to tumors grown in WT mice (Extended Data Fig. 3i), except for Tregs that were significantly decreased in tumors of Pglyrp1−/− mice (Fig. 2d), but were unchanged in the spleen of naïve mice (Extended Data Fig. 4a) and in the draining lymph node (dLN) and spleen of tumor-bearing mice (Extended Data Fig. 4b).
Because Pglyrp1 is co-expressed with co-inhibitory molecules in CD8+ T cells, we next focused on the CD8+ T-cell compartment (Extended Data Fig. 4c). Interestingly, a higher frequency of CD8+ T cells in the tumor and dLN in Pglyrp1−/− mice expressed proinflammatory cytokines, including IFNγ, TNF, and GM-CSF, suggesting an increased effector function (Fig. 2e, Extended Data Fig. 4d). We found no differences in the expression of cytokines in CD4+ T cells, except for an increase in IFNγ production in tumors (Extended Data Fig. 4e). TIM-3 and PD-1 are co-inhibitory molecules upregulated during T-cell activation that are also markers of terminally exhausted T cells 3. We found an increased expression of TIM-3 and PD-1 on CD8+ T cells and an increased frequency of TIM-3+ PD-1+ CD8+ T cells in the tumor, dLN, and spleen in Pglyrp1−/− mice (Fig. 2f,g, Extended Data Fig. 4f). We found no difference in the expression of TIM-3 and PD-1 on CD4+ T cells (Extended Data Fig. 4g). Together with our functional data, these data indicated enhanced activation and effector phenotype of CD8+ TILs in Pglyrp1−/− mice.
To comprehensively characterize the CD8+ T-cell phenotype in Pglyrp1−/− mice, we performed bulk RNA-seq of tumor-infiltrating CD8+ T cells in Pglyrp1−/− mice and matching WT littermate controls. We identified 330 upregulated and 35 downregulated genes in Pglyrp1−/− CD8+ T cells vs. WT cells (FDR < 0.15, |log2 fold change| > 1; p-values were computed with likelihood ratio tests in edgeR24–26, then adjusted for multiple comparisons using the Benjamini & Hochberg method (FDR)) (Fig. 2h, Supplementary Table 2). Consistent with our flow analysis, genes increased in Pglyrp1−/− vs. wildtype CD8+ T cells included those involved in T-cell activation, effector functions, and exhaustion (Nr4a2, Prf1, Lag3, Irf8, Atf3, Ifng, Havcr2, Tigit, Maf) (Fig. 2h,i), and were enriched in T-cell effector and exhaustion signatures 27–30 (Fig. 2j,k).
Pglyrp1−/− CD8+ TILs show a shift to effector/exhausted cells
To better understand the simultaneous increase in both expression of co-inhibitory molecules and effector functions in Pglyrp1−/− CD8+ TILs, we profiled CD45+ CD3+ TILs from Pglyrp1−/− mice and matching WT littermate controls by scRNA-seq (Fig. 3). Cells clustered into four subsets (Fig. 3a), which we annotated as Tregs, CD4+ conventional T cells (Tconv), and two CD8+ T-cell clusters based on marker expression (Extended Data Fig. 5a, Supplementary Table 3). Stemness/progenitor-like pathways were enriched in one of the CD8+ T-cell clusters, including those related to WNT and TCF signaling and stem- and naïve-like cells (Extended Data Fig. 5b). In contrast, the other CD8+ T-cell cluster was enriched for signatures of T-cell activation, effector functions, and exhaustion, indicating one cluster as stem-like cells and the other as effector/exhausted cells. RNA velocity analysis 31 suggested a trajectory from the stem-like cells to the effector/exhausted cells (Extended Data Fig. 5c), further supporting this model. Consistent with our earlier analysis (Fig. 1, Extended Data Fig. 3h), Pglyrp1 expression was highest in the effector/exhausted and Treg clusters (Fig. 3b).
Fig. 3: ScRNA-seq of tumor-infiltrating T cells in Pglyrp1-deficient mice.

(a) UMAP of tumor-infiltrating T cells (1,820 cells) in Pglyrp1−/− and WT mice.
(b) Violin plot (top) and dot plot (bottom) depicting the expression of Pglyrp1 in WT T cell clusters. P-values were computed using Wilcoxon rank-sum tests and not adjusted for multiple comparisons.
(c) Differentially expressed genes (FDR < 0.05 and |log2 fold change| > 0.25; p-values computed with the empirical Bayes quasi-likelihood F-tests in edgeR, then adjusted for multiple comparisons using the Benjamini & Hochberg method (FDR)) (top) and the distance (bottom, Methods) between Pglyrp1−/− and WT cells.
(d) Genotype-specific composition of the T cell clusters. Relative frequencies (left) and log2 odds ratios and Bonferroni adjusted p-values of two-sided chi-square tests comparing Pglyrp1−/− vs. WT (right) are shown. A positive log2 odds ratio corresponds to a higher relative frequency in Pglyrp1−/− cells and vice versa. CD8+ T cell includes both CD8+ T cell clusters.
(e) UMAP by genotype of tumor-infiltrating T single cells.
(f) Volcano plot of differentially expressed genes (FDR < 0.05 and |log2 fold change| > 0.25) in the stem-like CD8+ T cell cluster. Log2 fold changes and -log10 p-values were capped within [−1.5, 1.5] and [0, 20] respectively for visualization purposes. P-values were computed with the empirical Bayes quasi-likelihood F-tests in edgeR, then adjusted for multiple comparisons using the Benjamini & Hochberg method (FDR).
(g) Gene set enrichment analysis of selected Gene Ontology (GO) terms and KEGG and Reactome pathways (left) and published CD8+ T cell signatures (right) enriched in the CD8+ T cell-1 cluster. IL-27 signature 16; exhaustion (Supplementary Table 7); terminally exhausted 53; exhaustion CD8 T cells 23; transitory vs. stem-like 54, self-renewing 55; progenitor exhausted 56; RNA processing 57. P-values computed with empirical phenotype-based permutation tests (GSEA) and not adjusted for multiple comparisons.
(h,i) MC38-OVA tumors were implanted into WT and E8iCrePglyrp1fl/fl mice (n=7).
(h) Mean tumor growth is shown.
(i) Summary plots of the frequency of CD8+ T cells, PD-1+, and TIGIT+ CD8+ T cells by flow cytometry (n=6–7).
In (h,i) data are presented as the mean with ± SEM. Unpaired two-tailed t-tests were performed. *, P <0.05.
Cell profiles from WT and Pglyrp1−/− mice were well-mixed in the Tregs and CD4+ Tconv clusters, with a handful of differentially expressed genes (8 and 41 genes were upregulated; 4 and 7 were downregulated in Tregs and CD4+ Tconv cells, respectively; FDR <0.05, |log2 fold change| ≥0.25; p-values were computed with empirical Bayes quasi-likelihood F-tests in edgeR, then adjusted for multiple comparisons using the Benjamini & Hochberg method (FDR)) (Fig. 3c, Supplementary Table 4). As in our flow analysis (Fig. 2d), there was a significant decrease in the proportion of Tregs in tumors from Pglyrp1−/− mice (Fig. 3d). Of the few genes differentially expressed between Tregs from WT vs. Pglyrp1−/− mice, Itgae (encoding CD103) was the top downregulated gene (p = 1.2×10⁻⁵, fold change = 2.73; p-values were computed with empirical Bayes quasi-likelihood F-tests in edgeR) in Pglyrp1−/− mice (Extended Data Fig. 5d). CD103 is usually highly expressed on tumor-infiltrating Tregs and marks a particularly suppressive subset of Tregs 32. Hence, a dysregulated expression of CD103 on Pglyrp1−/− Tregs might be involved in their low representation in the tumors.
Conversely, CD8+ T-cell profiles were more distinct between Pglyrp1−/− and WT mice, with a larger number of differentially expressed genes (239 up- and 226 downregulated; Fig. 3c, Supplementary Table 4), a greater distance in the principal components (PC) space (Fig. 3c), most prominently in the stem-like cluster, and a visible global shift (Fig. 3e). Moreover, the proportion of effector/exhausted cells was significantly increased in Pglyrp1−/− TILs (Fig. 3d), consistent with the previous flow analysis (Fig. 2e-g). These data suggest major expression changes in the stem-like cluster and an increase in the proportion of effector/exhausted cells in Pglyrp1−/− mice, indicating a shift in the differentiation trajectory of stem-like cells to effector/exhausted cells. Indeed, the stem-like cells from Pglyrp1−/− mice revealed higher expression levels of genes (Stat1, Cd69, Jak2, Tbx21, Irf1, Prf1) and pathways (interferon signaling, leukocyte-mediated cytotoxicity, exhaustion) of T-cell activation and generation of effector T cells (Fig. 3f,g). These data further indicated a shift of stem-like cells to activated/exhausted cells in the CD8+ TIL compartment in Pglyrp1−/− mice.
To examine whether PGLYRP1 has a cell-intrinsic function in CD8+ T cells, we generated Pglyrp1-conditional knockout mice (Pglyrp1fl/fl) and bred them to E8iCre mice to generate mice with a specific deletion of Pglyrp1 in CD8+ T cells (E8iCre Pglyrp1fl/fl) (Extended Data Fig. 6a). We implanted MC38-OVA tumors into E8iCre Pglyrp1fl/fl mice and WT littermate controls and found that E8iCre Pglyrp1fl/fl mice had better tumor growth control and increased frequencies of CD8+ TILs expressing higher levels of PD-1 and TIGIT (Fig. 3h,i). In contrast, genetic deletion of Pglyrp1 expression specifically in myeloid cells (LysMCre Pglyrp1fl/fl) showed no alteration in tumor growth, suggesting that the expression of Pglyrp1 on myeloid cells is dispensable for antitumor immunity (Extended Data Fig. 6b).
In summary, our data suggest that the deletion of Pglyrp1 in CD8+ TILs leads to a shift of stem-like cells to activated/exhausted cells, indicating that PGLYRP1 is potentially an inhibitory molecule that regulates stem-like to effector transition in CD8+ TILs.
Pglyrp1-deficient mice are protected from EAE
A major obstacle of blocking co-inhibitory molecules for cancer therapy is the induction of autoimmune-like side effects that arise due to the important function of immune inhibitory molecules in regulating immune responses and restoring homeostasis 2,3. Similarly in murine mouse models, the blockade and deletion of T-cell inhibitory molecules, such as CTLA-4, PD-1, TIM-3, and TIGIT, leads to exacerbated autoimmune disease, including experimental autoimmune encephalomyelitis (EAE) 3,33–36. Since tumor models in mice are of shorter duration, which does not allow us to examine spontaneous autoimmunity, we tested the impact of loss of Pglyrp1 in an induced model of autoimmunity.
To examine whether PGLYRP1 deficiency also exacerbates autoimmune disease, we induced EAE in Pglyrp1−/− mice and matching WT littermate controls. To our surprise, Pglyrp1−/− mice were highly protected against EAE with a decreased incidence (Pglyrp1−/−: 62%, WT: 100%), maximal clinical EAE score (Pglyrp1−/−: 2.3, WT: 2.9), and mean clinical EAE score (Pglyrp1−/−: 1.6, WT: 2.3) (Fig. 4a-c). Histological analysis further revealed reduced CNS lesions and optic neuritis in Pglyrp1−/− mice (Fig. 4d,e). Compared to WT, in the CNS of Pglyrp1−/− mice we found a general reduction of hematopoietic infiltrates (CD45+) and CD4+ T cell-, CD8+ T cell-, Treg-, and B cell- infiltrates, cell types known to play important roles in EAE disease (Fig. 4f). The CD4+ T cells that did infiltrate into the CNS of Pglyrp1−/− mice expressed significantly lower levels of the inflammatory cytokines IL-17A, IFNγ, and GM-CSF, as well as the anti-inflammatory cytokine IL-10 (Fig. 4g, Extended Data Fig. 7a). Infiltrated CD8+ T cells expressed significantly lower levels of IL-17A and IFNγ (Extended Data Fig. 7b). Together, these data indicate a defect in T-cell priming during EAE without PGLYRP1.
Fig. 4: Pglyrp1 deficiency results in protection from EAE.

(a,b,c) EAE was induced by CFA/MOG in WT and Pglyrp1−/− mice (n=13–14). The mean clinical score (a), the disease course summary table (b), and the mean clinical score (n=8–14; mean ± standard deviation was shown for each statistic) (c) are shown (WT n=14, Pglyrp1−/− n=8). Data are merged from two independent experiments.
(d,e) On day 24 after immunization, histology was performed of the CNS parenchyma and meninges (d) and the optic nerve (e) (WT n=9, Pglyrp1−/− n=8). WM: white matter, GM: grey matter. Gr L: granular layer.
(f,g) On day 18 after immunization, CNS-infiltrating lymphocytes were extracted and the number of different immune populations (f) and the expression of intracellular cytokines in CD4+ T cells (g) were analyzed by flow cytometry (n=5).
In (a,c,f,g) data are presented as the mean with ± SEM. Unpaired two-tailed t-tests were performed. *, P <0.05; **, P <0.01; ****, P <0.0001.
In summary, in contrast to mice deficient in other known T-cell inhibitory molecules, Pglyrp1−/− mice are protected against EAE and PGLYRP1 seems to contribute to EAE disease pathology.
PGLYRP1 acts as a proinflammatory molecule in myeloid cells
To reveal the cell type responsible for the reduced EAE phenotype in Pglyrp1-global knockout mice (Pglyrp1−/−), we utilized the E8iCre Pglyrp1fl/fl mice as well as crossed the Pglyrp1-conditional knockout mouse (Pglyrp1fl/fl) to Cd4Cre mice to generate mice with a specific deletion of Pglyrp1 in CD4+ Tconv cells, Tregs, and CD8+ T cells (Cd4Cre Pglyrp1fl/fl). We did not observe any significant differences in the development of EAE in either model compared to WT littermates, indicating that the loss of PGLYRP1 expression in T cells was not responsible for the protective EAE phenotype in Pglyrp1−/− mice (Fig. 5a,b).
Fig. 5: Pglyrp1 expression in myeloid cells contributes to EAE disease.
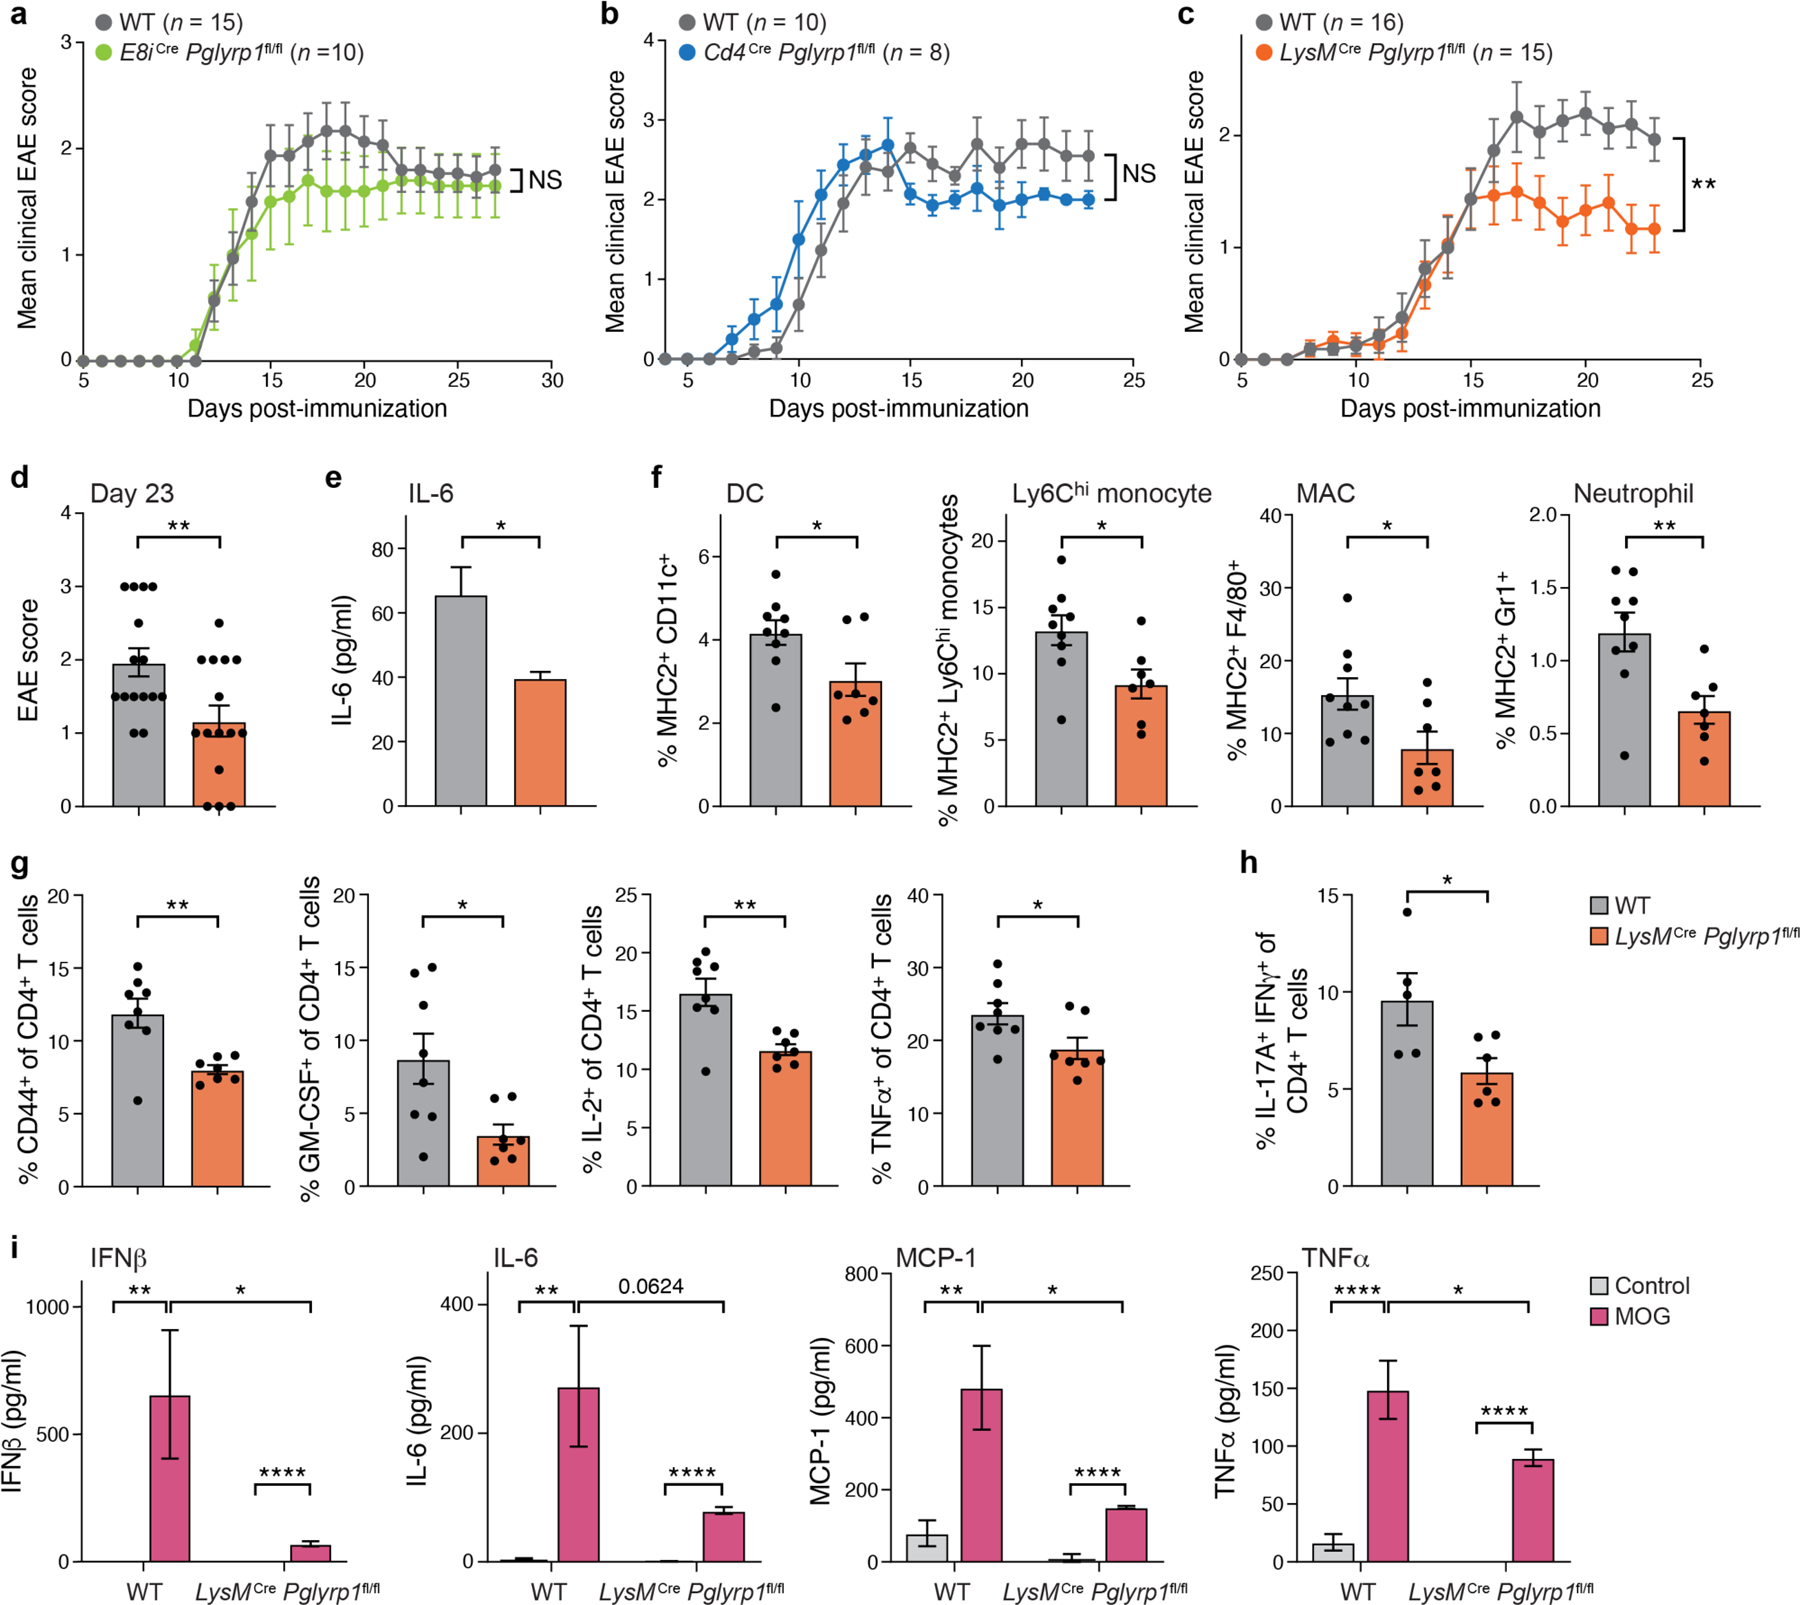
(a,b,c) EAE was induced by CFA/MOG. The mean clinical score of EAE in E8iCre Pglyrp1fl/fl (n=10) and WT littermate controls (n=15) (a), in Cd4Cre Pglyrp1fl/fl (n=8) and WT littermate controls (n=10) (b), and in LysMCre Pglyrp1fl/fl (n=15) and WT littermate controls (n=16) (c) are shown. In the LysMCre experiment data are merged from two independent experiments.
(d) Bar plot depicting the mean clinical score on day 23 of EAE in LysMCre Pglyrp1fl/fl and WT littermate controls (n=15).
(e) Concentration of IL-6 in the blood of EAE mice at peak of disease (day 15) by legendplex (n=4).
(f) MHC2 expression on different myeloid cell populations in the CNS in EAE mice at disease onset (day 10) by flow cytometry (WT n=9, LysMCre Pglyrp1fl/fl n=7).
(g) Phenotypic characterization of T cells in the dLN in EAE mice at disease onset (day 10) by flow cytometry (n=7–8).
(i) Cytokine concentration in the culture medium during recall assay, measured by legendplex (n=7, WT control n=9).
In all plots data are presented as the mean with ± SEM. Unpaired two-tailed t-tests were performed. *, P <0.05; **, P <0.01; ****, P <0.0001.
Based on the defect in T-cell priming in Pglyrp1−/− mice during EAE (Fig. 4f,g) and the important function of myeloid cells in priming autoreactive T cells during EAE 37,38, we hypothesized that disrupting the expression of PGLYRP1 on myeloid cells could contribute to the reduced EAE phenotype in Pglyrp1−/− mice. Hence, we crossed the Pglyrp1fl/fl mice to LysMCre mice to generate mice with a specific deletion of Pglyrp1 in myeloid cells, including monocytes, mature macrophages, granulocytes, and some dendritic cells (DCs) (LysMCre Pglyrp1fl/fl) 39. Interestingly, LysMCre Pglyrp1fl/fl mice were protected against EAE when compared to WT littermate controls (Fig. 5c,d), with lower systemic levels of the proinflammatory cytokine IL-6 (Fig. 5e). The CNS-infiltrating myeloid cells were less activated, as measured by MHC2 expression (Fig. 5f). In accordance with reduced myeloid cell activation, CD4+ T cells in the dLN appeared less primed, with reduced expression of the activation marker CD44 and cytokines GM-CSF, IL-2, and TNF (Fig. 5g), suggesting a defect in T-cell priming in LysMCre Pglyrp1fl/fl mice during EAE. In addition, lower frequencies of pathogenic Th17 cells (IL-17A+ IFNγ+) were detected in the CNS (Fig. 5h). Together, these data indicate that PGLYRP1 expression in myeloid cells is required for sufficient antigen-presentation and priming of T cells during EAE.
To directly test a role of PGLYRP1 expression in myeloid cells in antigen-presentation to CD4+ T cells, we performed an antigen-presentation assay. We co-cultured splenocytes from LysMCre Pglyrp1fl/fl mice or WT littermates with naïve CD4+ T cells from 2D2 T-cell receptor (TCR) transgenic mice that express a TCR specific for the myelin oligodendrocyte glycoprotein (MOG) 40 in culture medium with or without MOG peptide (Extended Data Fig. 7c,d). In culture wells with LysMCre Pglyrp1fl/fl splenocytes, 2D2 cells had lower proliferation rates (Extended Data Fig. 7c) and lower levels of the proinflammatory cytokines IL-1α, IL-6, MCP-1, and TNF were secreted into the media (Extended Data Fig. 7d), suggesting a role of PGLYRP1 expression in myeloid cells for antigen-presentation and priming of CD4+ T cells.
To examine whether PGLYRP1 expression in myeloid cells plays a role in T-cell priming during EAE, we performed a recall assay in the context of induced EAE in LysMCre Pglyrp1fl/fl mice and WT littermate controls. At day 10 post-immunization, we harvested the spleens and cultured splenocytes with or without MOG peptide. In the culture wells with LysMCre Pglyrp1fl/fl splenocytes, lower concentrations of proinflammatory cytokines (IFNβ, IL-6, MCP-1, TNF) were detected in the media (Fig. 5i), suggesting a role of PGLYRP1 expression in myeloid cells for priming of CD4+ T cells during EAE.
Together, these data suggest PGLYRP1 is needed by myeloid cells for optimal antigen-presentation and priming of CD4+ T cells during EAE.
Expression changes in Pglyrp1−/− monocytes and neutrophils
To reveal which myeloid cell populations are affected by Pglyrp1 deficiency during EAE, we first analyzed the expression of Pglyrp1 in immune populations in the dLNs at EAE onset (Fig. 6a). We detected the highest expression in monocytes and neutrophils. This high Pglyrp1-expression was induced by EAE, as monocytes and neutrophils derived from naïve mice showed lower Pglyrp1-expression.
Fig. 6: ScRNA-seq reveals changes in monocytes and neutrophils in Pglyrp1-deficient mice during EAE.
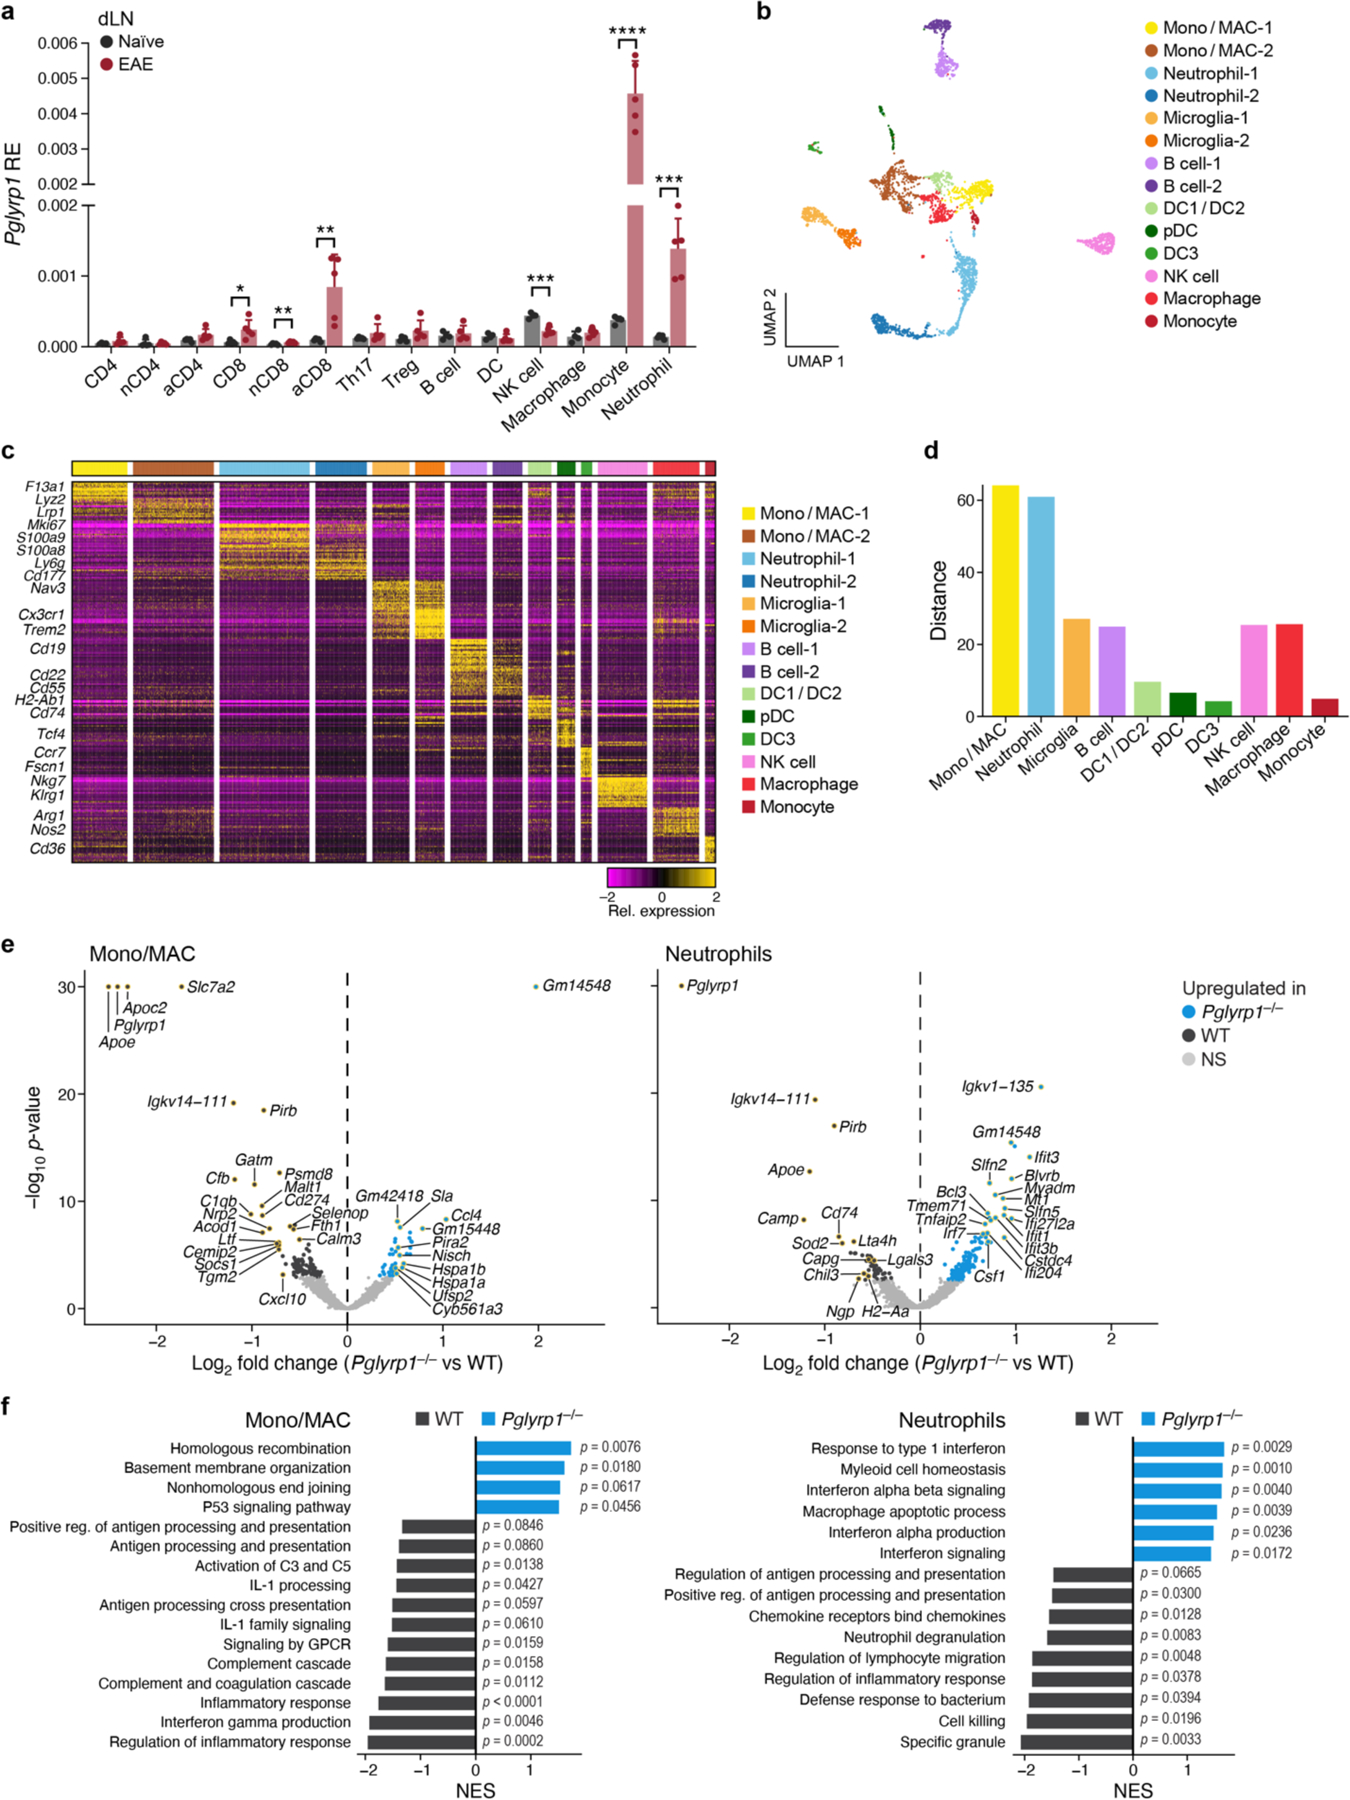
(a) Expression of Pglyrp1 in immune populations in the dLNs at EAE onset (day 10) by qPCR (n=5). nCD4= naïve CD4+ T cells, aCD4= activated CD4+ T cells, nCD8= naïve CD8+ T cells, aCD8= activated CD8+ T cells. Data are presented as the mean with + SEM. Unpaired two-tailed t-tests were performed. *, P <0.05; **, P <0.01; ***, P <0.001; ****, P <0.0001.
(b) UMAP of CNS-infiltrating myeloid cells (3,698 cells). EAE was induced in Pglyrp1−/− and WT littermate controls and CNS-infiltrating myeloid cells were sorted (CD45+ CD3− CD19−) for scRNA-seq at disease onset (day 10).
(c) Heatmap representing cluster-specific upregulated genes (FDR <0.05, log2 fold change > log2(1.5)). If more than 20 genes met the cut-off criteria in a cluster, plotted the top 20 genes with the largest fold changes (if a gene was ranked top 20 in multiple clusters, it is only shown once in the cluster block where it has the biggest fold change).
(d) Bar plots comparing the distance (Methods) between Pglyrp1−/− and WT cells.
(e) Volcano plot of differentially expressed genes comparing WT vs. Pglyrp1−/− cells in the mono/MAC and neutrophil clusters. Differential genes were computed as FDR < 0.05, |log2 fold change| > 0.25. Positive log2 fold change corresponds to upregulation in Pglyrp1−/− cells and vice versa. Log2 fold changes and -log10 p-values were capped within [−2.5, 2.5] and [0, 30] respectively for visualization purposes. The dots matching the gene names are highlighted in yellow. P-values were computed with the empirical Bayes quasi-likelihood F-tests in edgeR, then adjusted for multiple comparisons using the Benjamini & Hochberg method (FDR).
(f) Gene set enrichment analysis of selected Gene Ontology (GO) terms and KEGG/Reactome pathways in WT vs. Pglyrp1−/− cells in the mono/MACS (left) and neutrophils (right). P-values were computed with the empirical phenotype-based permutation tests (GSEA) and the values shown in the figures were not adjusted for multiple comparisons.
To examine how Pglyrp1 deficiency alters the myeloid cell compartment, we performed scRNA-seq of CD45+ CNS-infiltrating cells derived from Pglyrp1−/− mice and matching WT littermate controls during EAE onset and analyzed the B cells and myeloid cells (CD3− cells). The 3,698 mainly myeloid cell profiles were partitioned into 14 clusters (Fig. 6b, Extended Data Fig. 8a) with distinct expression signatures (Fig. 6c, Supplementary Table 5). We annotated the 14 subsets using cell type markers and differential gene signatures as monocytes/macrophages (mono/MAC), neutrophils, microglia, B cells, DC1/DC2s, pDCs, DC3s, NK cells, macrophages, and monocytes (Fig. 6c, Supplementary Table 5).
Comparison between Pglyrp1−/− and WT cells in each cluster revealed the greatest differences (distance in the PC space) between cells in mono/MACs and neutrophil clusters (Fig. 6d). Differential gene expression analysis between Pglyrp1−/− and WT mice revealed substantial expression changes in mono/MACs (44 genes upregulated, 119 genes downregulated, FDR<0.05 and |log2 fold change| > 0.25; p-values were computed with empirical Bayes quasi-likelihood F-tests in edgeR, then adjusted for multiple comparisons using the Benjamini & Hochberg method (FDR)) and neutrophils (163 genes upregulated, 54 genes downregulated, FDR<0.05 and |log2 fold change| > 0.25; FDR were computed in the same as mono/MACs) (Fig. 6e, Supplementary Table 6). Genes decreased in mono/MACs in Pglyrp1−/− mice included those encoding members of the complement system (Cfb, C1qb) and the proinflammatory chemokine CXCL10 (Cxcl10). Cd74 encoding the HLA-DR antigens-associated invariant chain (CD74) was decreased in Pglyrp1−/− neutrophils. Interestingly, 9 genes were decreased in both Pglyrp1−/− mono/MACs and neutrophils, including Apoe and Lgals3 (Extended Data Fig. 8b). In particular, Apoe was substantially downregulated in both Pglyrp1−/− mono/MACs (rank 1 by fold change) and neutrophils (rank 3 by fold change). Apoe encodes the apolipoprotein E (APOE) that has recently been shown to have a critical function in myeloid cell antigen-presentation and T-cell priming 41, in accordance with our findings of defects in antigen-presentation and T-cell priming in Pglyrp1−/− mice during EAE (Fig. 4g,5g,5i and Extended Data Fig. 7). Lgals3 encodes GALECTIN-3, which regulates the migration of monocytes/macrophages 42. Genes increased in both Pglyrp1−/− mono/MACs and neutrophils include Jun and Lilra6, both involved in myeloid cell activation 43–45. Multiple interferon-stimulated genes were upregulated in Pglyrp1−/− neutrophils (Ifit3, Ifit3b, Ifit1, Ifi204, Ifi27l2a, Oasl2, Irf7), indicating an increased IFN-signaling. The differentially upregulated genes in WT mono/MACs were enriched for complement cascade, inflammatory response, and antigen-presentation pathways, while Pglyrp1−/− mono/MACs upregulated genes were enriched for DNA repair and cell division (Fig. 6f). WT neutrophils were enriched for pathways involved in cell killing, neutrophil degranulation, and antigen-presentation, while pathways associated with interferon signaling were enriched in Pglyrp1−/− neutrophils. Together, these analyses suggest the downregulation of proinflammatory pathways and activation in both Pglyrp1−/− mono/MACs and neutrophils, and antigen-presentation by macrophages.
It has previously been shown that PGN binding to PGLYRP1 is required for its ability to activate myeloid cells via TREM-1 14. To test whether PGLYRP1 alone can also activate myeloid cells, we treated monocytes in vitro with PGN, recombinant PGLYRP1 or PGN + recombinant PGLYRP1 and measured the secretion of the proinflammatory cytokine TNF into the culture medium. We found significant secretion of TNF only by monocytes treated with both PGN and PGLYRP1 (Extended Data Fig. 8c), suggesting that PGLYRP1 in complex with PGN mediates myeloid cell activation and further that, in the absence of PGLYRP1, myeloid cells are not activated efficiently to mediate optimal antigen-presentation during EAE.
In summary, we found a high expression of Pglyrp1 in monocytes and neutrophils and substantial transcriptional changes in these cell populations in Pglyrp1−/− mice during EAE. These data support a model in which PGLYRP1 expression in mono/MACs and neutrophil populations is required for optimal priming of a pathogenic response in EAE. Deficiencies in functions required for effective antigen-presentation by mono/MACs and neutrophils then contribute to attenuation of EAE disease in Pglyrp1−/− and in LysMCre Pglyrp1fl/fl mice.
Discussion
In this study, we identified PGLYRP1 as a potential target for immunotherapy. We found that Pglyrp1-expression in T cells is induced by the cytokine IL-27. IL-27 is an immunoregulatory cytokine that suppresses T-cell responses by multiple mechanisms, including inhibition of T-cell effector differentiation 46,47 and induction of a “co-inhibitory” module in effector T cells 16. In addition, IL-27 induces IL-10 in a wide range of cell types and can differentiate naïve T cells to type 1 regulatory T (Tr1) cells 48–50. In accordance with these functions, Il27ra−/− T cells have defects in producing IL-10 51. Based on our findings that PGLYRP1 plays an inhibitory function in T cells, it makes sense that it is induced by the immunoregulatory cytokine IL-27, as part of a general anti-inflammatory module together with IL-10 and co-inhibitory molecules. Furthermore, our findings highlight the value of examining other molecules in the IL-27-induced module.
A major obstacle of current immunotherapy is the lowering of the threshold for autoreactive T cell activation and induction of irAEs 2. Hence, in murine mouse models for autoimmune diseases, such as EAE, the blockade and deletion of T-cell inhibitory molecules, including CTLA-4, PD-1, TIM-3, and TIGIT, leads to exacerbated disease 3,33–36. Interestingly, genetic deletion of PGLYRP-1, which is part of the same co-inhibitory module, protects the mice against EAE. These data might imply that, in contrast to other co-inhibitory molecules, the blockade of PGLYRP1 might limit severe autoimmune-like side effects in cancer immunotherapy. While the CNS is not an organ where irAEs are usually observed following checkpoint blockade therapy, the EAE results might be applicable to other tissues affected by irAEs. Antibody blockades of CTLA-4 and PD-1, which induce irAEs in multiple organs, also accelerate and induce more severe EAE. While this aspect requires additional investigation, it provides the interesting possibility of cancer immunotherapy that induces a potent antitumor immune response without inducing severe autoimmune-like side effects. Most irAEs are observed at mucosal sites, including the gastrointestinal tract 2. PGLYRP1 is highly expressed in the gastrointestinal tract 7 and activates the innate immune system by forming a complex with the bacterial cell wall component PGN. Binding of the complex of PGLYRP1 and PGN to its receptor TREM-1 activates and induces the expression of proinflammatory cytokines in myeloid cells, including neutrophils and macrophages 14. Hence, the beneficial effects observed in EAE upon PGLYRP1 deletion may be due to the requirement of PGLYRP1 to bind to PGN in the Complete Freund’s Adjuvant (CFA) to mediate its proinflammatory function. In the context of irAEs at mucosal sites, where exposure to microbiota is abundant, PGLYRP1 might be an important driver of inflammation by sensing the microbiota and then activating myeloid cells. Therefore, the targeting of PGLYRP1 might be beneficial in preventing the development of irAEs by inhibiting or limiting the activation of myeloid cells.
Interestingly, our findings are unique in that PGLYRP1 has opposing functions on different cell types; it is inhibitory in CD8+ T cells and proinflammatory in myeloid cells. Indeed, we found the genetic deletion of Pglyrp1 to enhance antitumor immunity but inhibit the development of EAE. A potential explanation for these findings is different expression profiles of Pglyrp1 in immune cells in the tumors vs. in EAE. We found Pglyrp1 to be highly expressed in CD8+ T cells in the tumor and in neutrophils and monocytes in the dLN during EAE. Therefore, the function of PGLYRP1 in CD8+ T cells might dominate in tumors in an immunosuppressive environment and its function in myeloid cells might dominate during a highly proinflammatory autoimmune reaction - EAE.
In conclusion, here, we describe PGLYRP1 as a potential target for cancer immunotherapy that, when targeted, could induce a potent antitumor immune response without enhancing CNS autoimmunity. Further studies could reveal additional mechanisms by which PGLYRP1 affects immune populations and how its targeting may affect irAEs in other tissues. Overall PGYLRP1 may represent the prototype of a class of targets that, when appropriately blocked, promote antitumor immunity without inducing autoimmunity by regulating functions of different cell types, including myeloid cells vs. effector CD8+ T cells.
Methods
Mice
C57BL/6J wildtype, B6.129S4-Pglyrp1tm1.1Lky/J (named Pglyrp1−/−), C57BL/6-Tg(Cd8a-cre)1Itan/J (named E8iCre), B6.129P2-Lyz2tm1(cre)Ifo/J (named LysmCre), and B6.Cg-Tg(Cd4-cre)1Cwi/BfluJ (named Cd4Cre) were obtained from the Jackson Laboratory. For the generation of conditional Pglyrp1 knockout mice (named Pglyrp1fl/fl), the KOMP ES cell line Pglyrp1tm1a(KOMP)Mbp, RRID:MMRRC_060166-UCD, was obtained from the Mutant Mouse Resource and Research Center (MMRRC) at University of California at Davis, an NIH-funded strain repository, and was donated to the MMRRC by the KOMP repository, University of California, Davis; originating from Kent Lloyd, UC Davis Mouse Biology Program. For all experiments 8–12 weeks old and sex-matched mice were used (both female and male). All mice used in this study were housed at the Brigham and Women’s Hospital (BWH) mouse facility in Boston under specific-pathogen-free (SPF) conditions on a 12-hour light/dark cycle (light from 7am-7pm and dark from 7pm-7am) at 22°C and 42% humidity. Mice were fed with 5053 PicoLab rodent diet 20 (LabDiet). Animals were assigned to the experimental groups based on the genotype. Tumor measurements and EAE scoring was performed in a blinded fashion to avoid biased data acquisition. All experiments were approved by and carried out in accordance with guidelines of the Institutional Animal Care and Use Committee (IACUC) in the Brigham and Women’s Hospital (BWH) in Boston. Pglyrp1+/+ and Pglyrp1+/− littermates were used as controls for Pglyrp1−/− mice. Cre negative Pglyrp1fl/fl littermates were used as controls for LysmCre Pglyrp1fl/fl, E8iCre Pglyrp1fl/fl, and Cd4Cre Pglyrp1fl/fl mice.
Isolation and differentiation of naïve CD4+ T cells
The spleen and peripheral lymph nodes were harvested and smashed through 40 μm sterile strainers. ACK lysis (Buffer from Lonza) was performed with splenocytes for 5 min at RT. Using anti-CD4 microbeads (Miltenyi Biotec), CD4+ T cells were isolated following the manufacture’s protocol. Naïve CD4+ CD25− CD44− CD62L+ cells were purified using a BD FACS Aria IIIu flow cytometer (BD Biosciences) and were activated on flat-bottom 96-well plates (1×10⁵ cells/well) with plate-bound anti-CD3 (1μg/ml, clone 145–2C11, Bio X Cell) and anti-CD28 (1μg/ml, clone PV-1, Bio X Cell) antibodies for three days in the presence of 25ng/ml rmIL-27 (R&D systems) or no cytokines.
Active induction of EAE
Mice (8–12 weeks old) sex-matched were immunized subcutaneously into the flanks with an emulsion containing the MOG35–55 peptide (100μg/mouse, Genemed Synthesis) and M. tuberculosis H37Ra extract (5mg/ml, Becton Dickinson) in CFA (200ul/mouse, Becton Dickinson). Pertussis toxin (100ng/mouse, List Biological Laboratories) was administered intravenously on days 0 and 2. Mice were monitored daily, and mice were assigned clinical scores as follows: 0, healthy; 1, limp tail; 2, impaired righting reflex and/or ataxic gait; 3, hind limb paralysis; 4, total limb paralysis; 5, moribund or death. Mice with a clinical score >4 were euthanized.
For the isolation of lymphocytes from EAE mice, mice were sacrificed, and perfusion was performed intracardially with PBS. To obtain cells from draining lymph nodes, lymph nodes were mashed through a 40 μm strainer. For the isolation of cells from the CNS, the forebrain and cerebellum were dissected and together with the spinal cord were flushed out with PBS using hydrostatic pressure. CNS tissue was cut into small pieces with a razor blade and digested with collagenase D (2.5mg/ml, Roche Diagnostics) at 37°C for 20 min. Mononuclear cells were isolated by passing the tissue through a 40 μm strainer, followed by centrifugation through a Percoll gradient (37% and 70%). Lastly, the mononuclear cells were obtained from the interphase, washed, and used for further analysis.
CNS histology
Histological analysis of the CNS was performed as previously described 58. In short, mice were sacrificed at the end of the EAE disease course (~day 30) and brains and spinal cords were fixed in 10% neutral-buffered formalin. Tissues were embedded in paraffin and were stained with Luxol fast blue-H&E stains. The inflammatory foci in leptomeninges and parenchyma (>10 mononuclear cells) were then counted in a blinded fashion.
Tumor experiments
MC38-OVAdim colon carcinoma cells (named MC38-OVA) were kindly provided by Mark Smyth. B16-OVA melanoma cells (named B16-OVA) were generously provided by Kai Wucherpfennig. MC38-OVA (0.5×10⁶) cells or B16-OVA cells (0.5×10⁶) were subcutaneously injected into the right flank of mice. Tumor growth was measured in two dimensions using digital calipers. Tumor size was calculated as the product of the two perpendicular diameters. The maximal tumor size permitted by IACUC in BWH is 400 mm2 (20 mm in any one direction) and this maximal size was not exceeded in our study. For the isolation of TILs, tumor tissue was dissociated with collagenase D (2.5mg/ml) at 37°C for 20 min, followed by centrifugation through a discontinuous Percoll gradient (GE Healthcare). Isolated cells were subsequently used for downstream analysis. For ICB treatment, 250µg of anti-PD-1 (clone RMP1–14, BioXCell) antibody or 250µg of control immunoglobulin (Rat IgG2a, BioXCell) were injected intraperitoneally in sterile PBS on days 6, 8 and 10 post tumor-implantation.
Flow cytometry and fluorescence-activated cell sorting (FACS)
Single-cell suspensions were stained with antibodies for surface proteins in flow buffer (2% FCS in PBS) for 30min at 4°C in the dark. The following antibodies were purchased from Biolegend (clone, catalog number, dilution): CD3 (145–2C11, 100321, 1:500), CD4 (RM4–5, 100512, 1:500), CD8 (53–6.7, 100708, 1:500), CD11b (M1/70, 101212, 1:500), CD11c (N418, 117318, 1:500), CD19 (6D5, 115540, 1:500), CD25 (PC61, 102016, 1:500), CD44 (IM7, 103008, 1:500), CD62L (MEL-14, 104412, 1:500), CD45 (30-F11, 103116, 1:500), F4/80 (BM8, 123118, 1:500), Gr1 (RB6–8C5, 108408, 1:500), I-A/E (clone M5/114.15.2, 107645, 1:1000), Ly-6C (HK1.4, 128036, 1:500), NK1.1 (PK136, 108732, 1:500), PD-1 (RMP1–30, 109110, 1:500), and TCRβ (H57–597, 109228, 1:500). The anti-mouse TIGIT antibody (clone GIGD7) was purchased from eBioscience (catalog number 12–9501-82, dilution 1:500). The antibody against TIM-3 (5D12) was generated in house and used at 1:300 dilution. Viability staining was performed using the eF506 dye (eBioscience) at 1:1000 dilution.
The following cell populations were identified in the spleen, lymph nodes, CNS, and tumor as follows: T cells (CD45+ TCRβ+), CD4+ T cells (CD45+ TCRβ+ CD4+), activated CD4+ T cells (CD45+ TCRβ+ CD4+ CD44+), naive CD4+ T cells (CD45+ TCRβ+ CD4+ CD44− CD62L+), CD8+ T cells (CD45+ TCRβ+ CD8+), activated CD8+ T cells (CD45+ TCRβ+ CD8+ CD44+), naive CD8+ T cells (CD45+ TCRβ+ CD8+ CD44− CD62L+), exhausted CD8+ T cells (CD45+ TCRβ+ CD8+ PD-1+ TIM-3+), Th17 cells (CD45+ TCRβ+ CD4+ IL-17A-GFP+), Treg cells (CD45+ TCRβ+ CD4+ CD25+ or CD45+ TCRβ+ CD4+ FOXP3+), B cells (CD45+ CD19+), natural killer (NK) cells (CD45+ NK1.1+), neutrophils (CD45+ CD11b+ Ly-6Cint Gr1+), dendritic cells (DCs) (CD45+ CD11c+ I-A/Ehigh), macrophages (MACS) (CD45+ CD11b+ Gr1− F4/80+), and monocytes (CD45+ CD11b+ Gr1− F4/80− Ly-6Clow or high).
For intracellular cytokine staining, cells were activated for 4h at 37°C with the Cell Stimulation Cocktail (plus protein transport inhibitors) (eBioscience). Subsequent fixing and staining were performed using the BD Fixation/Permeabilization Solution Kit (BD Biosciences) following the manufacturer’s instructions. Transcription factor staining was performed with the FoxP3/Transcription Factor Staining Buffer Set (eBioscience). Intracellular antibody staining was performed at 4°C in the dark for 30min. The following antibodies were purchased from Biolegend (clone, catalog number, dilution): GM-CSF (MP1–22E9, 505404, 1:300), IFNγ (XMG1.2, 505850, 1:300), IL-2 (clone JES6–5H4), IL-10 (JES5–16E3, 505008, 1:300), IL-17A (TC11–18H10.1, 506922, 1:300), and TNF (MP6-XT22, 506324, 1:300). The antibody to stain FOXP3 (clone FJK-16s) was purchased from eBioscience (catalog number 17–5773-82, dilution 1:300). Flow cytometry samples were acquired on BD LSRII (BD Biosciences), BD LSRFortessa (BD Biosciences), or BD FACSymphony (BD Biosciences) flow cytometers using the BD FACSDiva software. FACS was performed on a BD FACS Aria IIIu flow cytometer (BD Biosciences). Flow cytometry data analysis was performed with FlowJo software (FlowJo LCC) and GraphPad Prism software (GraphPad).
Antigen-presentation assay
The spleen was smashed through 40 μm sterile strainers and ACK lysis (Buffer from Lonza) was performed for 5 min at RT. Using anti-CD4 microbeads (Miltenyi Biotec), CD4+ T cells were depleted from the splenocytes following the manufacture’s protocol. Naïve 2D2 CD4+ T cells were isolated as described above and stained with CellTrace Violet (ThermoFischer Scientific) following the manufacture’s protocol to track proliferation. For the assay, 1×10⁵ CD4-depleted splenocytes were co-cultured with 5×10⁴ naïve 2D2 CD4+ T cells for 3 days with 100 μg MOG35–55 peptide. Cells were harvested for flow cytometry and cytokine concentrations in the supernatants were measured with the bead-based immunoassay (see below). For monocyte cultures, cells were treated overnight with PGN-BS (3 μg/ml, InvivoGen) and recombinant PGLYRP1 (1 μg/ml, R&D) and cytokine concentrations in the supernatants were measured with the bead-based immunoassay (see below).
Recall assay
Mice were immunized for EAE induction as described above. 10 days post immunization, splenocytes were obtained as described above and 1×10⁵ cells were cultured for 3 days with 100 μg MOG35–55 peptide. Cells were harvested for flow cytometry and cytokine concentrations in the culture medium were quantified using the bead-based immunoassay (see below).
Bead-based immunoassay
Cytokine concentrations in the culture medium of in vitro cultured cells were measured using the LegendPlex Mouse Inflammation Panel (13-plex) (Biolegend, Cat# 740446) per manufacturer’s instructions. Sample acquisition was performed using a BD LSRII flow cytometer (BD Biosciences) and data was analyzed using the LegendPlex Data Analysis Software Suite 2022.
Quantitative Polymerase Chain Reaction (qPCR)
RNA isolation was performed using the PicoPure RNA Isolation Kit (Applied Biosystems) following the manufacturer’s instructions. cDNA synthesis was conducted in a thermal cycler (Bio-Rad) with the SuperScript VILO cDNA Synthesis Kit (Invitrogen). qPCR was performed using the TaqMan Fast Advanced Master Mix (Thermo Fisher Scientific) according to manufacturer’s instructions and run in the ViiA 7 Real-Time PCR system (Applied Biosystems). The following TaqMan probes (Thermo Fisher Scientific) were used: Pglyrp1 (Cat# Mm00437150_m1), Foxp3 (Cat# Mm00475162_m1), Tigit (Cat# Mm03807522_m1), Ctla4 (Cat# Mm00486849_m1), Pdcd1 (Cat# Mm01285676_m1), Lag3 (Cat# Mm00493071_m1), Havcr2 (Cat# Mm01294183_m1), 18S (Cat# 4352930E), and Actb (Cat# 4352341E). The housekeeping genes 18S rRNA and Actb were used for normalization. Relative expression levels are depicted as 2−ΔCT values, ΔCT = (gene of interest CT) - (geoMean Housekeeper CT).
Statistical analysis
No statistical methods were used to pre-determine sample sizes but our sample sizes are similar to those reported in previous publications 17,22,59. No data was excluded unless stated otherwise in the respective Methods section. Data distribution was assumed to be normal but this was not formally tested.
Bulk RNA-sequencing
For bulk RNA-seq, 1,000 living cells were FACS-sorted immediately into TCL buffer (QIAGEN) supplemented with 1% ß-mercaptoethanol (Sigma Aldrich). As previously described 60, full-length RNA-seq library preparation was performed following a modified SMART-Seq2 protocol 61. cDNA concentration was quantified (Quant-iT PicoGreen dsDNA Assay Kit, Thermo Fisher Scientific) and normalized to 0.25ng/ul and libraries were prepared using the Nextera XT DNA Library Preparation kit (Illumina). Using a Bioanalyzer (Agilent), the final libraries were verified to have a size of 500 bp. For sequencing, the barcoded libraries were pooled, normalized to 2 nM, and denatured using 0.1 N NaOH. Sequencing was performed following the manufacturer’s protocols using the paired-end Illumina sequencing (38bp X 2) with 75 cycle Nextseq 500 high output V2 kit (Illumina).
Droplet-based scRNA-seq
The cell populations of interest were sorted by FACS for sequencing. For cell hashing, the cells were incubated for 30 min on ice in flow buffer with the TotalSeq™-antibody pool (Biolegend) at 1:1000 final dilution for each antibody, followed by a total of three washes with flow buffer. Following the manufacturer’s instructions (10x Genomics), the samples were then separated into droplet emulsions using the Chromium Single Cell 5’ V2 Solution. The library preparations of the scRNA-seq, including TCR-seq and 5’ feature barcoding libraries were performed according to manufacturer’s instructions (10x Genomics) using the NextGem 5’ v2 Dual Index protocol. Libraries were pooled to 4nM. The sequencing of the libraries was performed on NovaSeq (Illumina). scRNA-seq libraries and 5’ feature barcoding libraries were sequenced with the following read configuration: Read 1: 28 cycles, Read 2: 96 cycles, Index read 1: 8 cycles. scTCR-seq libraries were sequenced with these read configurations: Read 1: 150 cycles, Read 2: 150 cycles, Index read 1: 8 cycles.
Preprocessing of scRNA-seq data
Combined scRNA- and scTCR-seq data were generated and analyzed independently for tumor-infiltrating and dLN leukocytes in MC38-OVA tumor-bearing mice (related to Fig. 3 and Extended Data Fig. 5) and CNS-infiltrating leukocytes during EAE (related to Fig. 6 and Extended Data Fig. 8). Base-calling was performed using NovaSeq Control Software v1.7.5 (RTA v3.4.4). UMI count matrices were generated from Binary Base Call (BCL) data using the cellranger workflow in Cumulus 62, a cloud-based framework for large-scale single-cell sequencing data analysis. We used the version based on the Terra platform (https://app.terra.bio/) and Google Cloud Platform. In this workflow, 10x Genomics CellRanger 6.0.1 was used to demultiplex reads from BCL files, align reads to the mm10 reference genome (CellRanger 2020-A version based on GENCODE vM23/Ensembl 98), compute UMI counts per gene and cell-hashing antibodies and filter out empty droplets. Low- quality cell profiles were excluded if they fulfilled one or more of the following criteria: (i) the number of genes expressed <=500, (ii) the total number of UMIs > 50,000 in tumor-infiltrating cells or > 15,000 in dLN cells, (3) >=10% of the total UMIs were mitochondrial RNA. DoubletFinder 63 was applied to detect doublets, but very few high-confidence doublets were detected. We cleaned out contaminations by firstly splitting data into T cells and myeloid cells (see below for T cell identification methods), then iteratively over-clustering the cells within each compartment and removing clusters that were not CD45+ cells or could not be classified (see below for dimension reduction, clustering, and cell type annotation methods). We recovered the tissue origin (tumor vs. lymph node; mixed for sequencing by accident) for CD45+ CD3+ cells in the tumor experiment using the expression of dissociation signatures (64, higher in tumor samples). Following this process, 5,819 tumor-infiltrating and 4,327 CNS-infiltrating leukocytes were used for downstream analysis.
Normalization, dimensionality reduction, and clustering
Seurat v 4.1.0 was used to perform normalization, dimensionality reduction, and clustering. First, the UMI count matrix for tumor-infiltrating lymphocytes was normalized using SCTransform. Next, Principal Component Analysis (PCA) was performed using the RunPCA function. Number of PCs was selected based on an elbow plot for clustering and UMAP. Then, a Shared Nearest Neighbor (SNN) graph was constructed and clusters were identified using a modularity maximization algorithm 65 (FindCluster function). Specifically, the FindNeighbors function constructs the SNN graph in the following three steps: build a K-Nearest Neighbor (KNN, k.param = 20) graph in the PC space, calculate the Jaccard index between every cell and its k nearest neighbors, remove edges with low Jaccard index (prune.SNN <1/15). Uniform Manifold Approximation and Projection (UMAP) 66 was computed using the RunUMAP function on selected PCs and the UMAP cell embeddings were used for visualization. Parameters such as the PCs (dims), clustering resolution (resolution), number of neighboring points used to compute UMAP (n.neighbors), and tightness of UMAP embedding (min.dist) were configured for each analysis to reflect the goal of analysis and to account for the within subset transcriptional variation. The specific parameters are available in the code and the “commands” slot of the processed Seurat objects (see data and code availability statements).
Cell type annotation
Clusters annotation was performed by examining the expression of single cell type marker genes as well as signature panels from literature 67. Signature scores were computed using the AddModuleScore function in the Seurat package. Specifically, this function calculates the average expression level for genes in the signature as well as a control gene set randomly selected from bins to match the average expression of the genes in the signature 30. The control average expression was subtracted from the signature average expression to correct for background noise.
Differential expression in scRNA-seq data
EdgeR 24–26 was used to identify differentially expressed genes between groups of cells. Specifically, we used the quasi-likelihood negative binomial model (glmQLFit and glmQLTest functions) with raw UMI counts as the input, adjusting for detection rate (z-normalized number of genes detected in each cell) and channel (if data were sequenced in multiple channels; modeled as a categorical variable). Genes were filtered before applying edgeR to include only those detected in >10% of the cells in at least one level of the groups being compared (e.g. Pglyrp1−/− vs. WT) to improve the performance of differential expression analysis 68.
T-cell identification
Since the T cells and non-T leukocytes (myeloid cells) were sorted separately but sequenced together, we computationally separated them for downstream analyses. We first performed clustering on mixed T and non-T cells using the steps and parameters described above. Next, differentially upregulated genes and the percentage of cells that had valid clonotype information were computed for each cluster. We then annotated clusters that have high expression of known T cell marker genes (such as Cd3e) and high prevalence of valid clonotypes as T cells. A total of 1,820 tumor-infiltrating T cells (Fig. 3 and Extended Data Fig. 5) and 3,698 CNS-infiltrating non-T cells (Fig. 6 and Extended Data Fig. 8) were identified.
Cell subpopulation distance measurement
To quantify the distance between two cell subpopulations, such as two cell types, we proposed a distance measure based on the overlap of the nearest neighbor (Fig. 3c and Fig. 6d). Firstly, we constructed a k Nearest Neighbor (kNN) graph by linking each cell to its kNN (distance between two cells was defined as the Euclidean distance of their cell embeddings in the PC space; parameter k and number of PCs were set to the same as those used in the clustering analysis that identified the subpopulations). Next, for each pair of subpopulations, we computed the similarity statistic by counting the number of edges between them and dividing by the maximum possible number of such edges (product of the subpopulation sizes). Finally, we took the inverse of the similarity to obtain the distance between the two subpopulations.
Analysis of changes in cell subpopulation frequencies
Changes in the relative frequencies were tested for every subpopulation independently using chi-square tests. The null hypothesis is no difference in the proportion of cells belonging to the subpopulation of interest across two groups, and the alternative is such a difference exists in either direction.
Trajectory analysis using RNA velocity
The trajectory was inferred for tumor-infiltrating CD4+ and CD8+ T cells using kallisto | bustools 69 and scVelo 31. Spliced and unspliced RNAs were counted using the kallisto | bustools lamanno workflow. Then RNA velocity and projection of velocity to UMAP embedding were computed using scVelo. Default parameters were used except that the number of cells required to have positive UMI counts for a gene to be analyzed in scVelo was set to 5.
Analysis of public RNA-seq data
Related to Fig. 1a-c, public SMART-Seq2 scRNA-seq data for tumor-infiltrating CD8+ T cells from B16F10 melanoma-bearing mice were obtained from GSE113208 16. We only used the wild-type samples (GSM3100259 - GSM3100263) from 5 subseries (GSE113262, GSE113280, GSE113689, GSE113807, GSE113811) and the CD8+ T cell subset (cell type labels were in the data), and the provided processed data were TMM-normalized FPKM. Cells were excluded if they fulfilled one of the following criteria: (1) the number of detected genes (FPKM>0) is less than 1,000 in GSE113262 or GSE113280, or less than 2,000 in GSE113689, GSE113807 or GSE113811; (2) library size (total FPKM) is higher than 250,000 in GSE113689, GSE113807 or higher than 500,000 in GSE113689, GSE113807 or GSE113811. Seurat v4.1.0 was then used to analyze the data. The expression data were further log-normalized using the NormalizeData function for downstream analysis. The top 2,000 highly variable genes were identified using the FindVariableFeatures function. Dimension reduction was performed using the same steps described above for the in-house scRNA-seq data, except the PCA was performed using only the highly variable genes. In Fig. 1a, the Spearman correlation coefficient was computed for every highly variable gene (except those used to compute average co-inhibitory and stem-like expression profiles) to the average expression of a set of known co-inhibitory genes (Pdcd1, Tigit, Ctla4, Havcr2, Lag3) and of a set of known stem-like genes (Ccr7, Cxcr5, Tcf7, Sell).
The public data scRNA-seq data for immune cells from melanoma patients treated with checkpoint inhibitors (Extended Data Fig. 1) were obtained from GSE120575 23, and the provided processed data were TPM. Cell type annotations were also provided by the authors. Since the expression level of PGLYRP1 was very low in the data, we dichotomized the data and used the percentage of cells with positive TPM as the measure of expression level.
Cancer patient survival analysis was performed using the TIMER2 database 70.
Analysis of bulk RNA-seq data
Bulk RNA-seq data were preprocessed using the smartseq2 v1.1.0 workflow in Cumulus. Before running the workflow, base-calling was performed using NextSeq Control Software 2.2.0.4 (RTA 2.4.11) and the BCL files were demultiplexed into fastq files using bcl2fast2 (v2.20.0.422) (https://support.illumina.com/downloads/bcl2fastq-conversion-software-v2-20.html). Then the workflow employs histat2 v2.1.0 71 to align read to mm10 mouse genome, and the RSEM v1.3.3 72 to calculate raw counts and TPM. The workflow computes the TPM-normalized count for each gene, defined as TPMi / 106 × c rounded to the nearest integer, where TPMi is the TPM for gene i, and c is the total number of reads achieved for the sample.
Samples with low alignment rates and/or unique alignment rates were excluded from downstream analyses. Data were normalized using the variance stabilizing transformation implemented in DESeq2 73 for visualization. Differential expression analysis was performed using edgeR on TPM-normalized counts (glmFit and glmLRT), where lowly expressed genes (total TPM-normalized counts in all 8 samples is less than 10) were excluded before the analysis.
Gene set enrichment analysis
Gene set enrichment analysis was performed using fGSEA 74, a fast algorithm for Gene Set Enrichment Analysis (GSEA). Genes were firstly ranked according to some statistics, such as the differential expression test statistic comparing two subpopulations (which may need to be polarized to reflect the direction of differential expression). For example, the test statistic from glmQLFtest in edgeR should be multiplied by (−1) if the gene has a negative log-fold change and then ranked decreasingly to prioritize the genes upregulated in the condition of interest. fGSEA then uses the rankings to compute the normalized enrichment scores and p-values for a given gene set. Published signatures used for GSEA in this manuscript include: Wherry exhaustion 27; effector vs. memory, exhausted vs. memory 27; effector vs. memory LCMV, effector vs. exhausted 28; effector memory vs. naïve 29; human exhaustion 30; terminally exhausted-156; transitory vs. stem-like 54; terminally exhausted-2 53; transitory vs. exhausted 54; exhausted T cells 75; effector-like 56. IL-27 signature 16; exhaustion CD8 T cells 23, self-renewing 55; progenitor exhausted 56; RNA processing 57.
Extended Data
Extended Data Fig. 1. Pglyrp1 is expressed on exhausted T cells in human cancer.

Expression of Pglyrp1 and co-inhibitory receptors in single immune cells of human melanoma samples23. Plotted are the percent of cells with UMI count
1. Annotation as defined in publication.
Extended Data Fig. 2. Association between the expression levels of Pglyrp1 and survival rate in different human cancers.

Overall survival of patients with breast cancer (BRCA) (n = 1,100), HER2-positive BRCA (BRCA-Her2) (n = 82), colon adenocarcinoma (COAD) (n = 458), and lung squamous cell carcinoma (LUSC) (n = 501) grouped by PGLRYP1 expression through TIMER2 database70. Split expression percentage of patients: 20%. Analyses were performed with log-rank Mantel-Cox test. Hazard ratio (HR) and p-value are provided.
Extended Data Fig. 3. Immune-profiling of tumors in Pglyrp1-deficient mice.

(a) Pglyrp1−/− mouse validation. Relative expression (RE) of Pglyrp1 transcript in WT, Pglyrp1−/+, and Pglyrp1−/− CD8+ T cells from the spleen by qPCR (n = 2–3). The expression is depicted as relative to WT cells. The bar indicates the mean. (b–d) Analysis of the immune system in the colon of 7-week-old Pglyrp1−/− mice and WT littermates by flow cytometry (n = 3). General immune system composition (b), and intra-cellular cytokine staining in CD4+ T cells (c) and CD8+ T cells (d) are displayed. (e, f) B16-OVA tumors were implanted into WT and Pglyrp1−/− mice (n = 7). (e) Mean tumor growth and (f) tumor sizes on day 16 are shown. (g) MC38-OVA tumors were implanted into WT and Pglyrp1−/− mice and mice were treated with anti-PD-1 antibody on days 6, 8, and 10 post tumor-implantation. The control group included WT mice injected with control immunoglobulin (Rat IgG2a). (h) Relative expression of Pglyrp1 transcript in different immune populations isolated from MC38-OVA tumors grown in WT mice by qPCR (n = 4). (i) Frequency of different immune populations in MC38-OVA tumors grown in WT and Pglyrp1−/− mice (n = 9) by flow cytometry. In (b-i) data are presented as the mean with ±SEM. Unpaired two-tailed t-tests were performed. NS, not significant.
Extended Data Fig. 4. Immune populations in the dLN and spleen of tumor-bearing Pglyrp1-deficient mice.

(a) Frequency of Treg cells (CD45+ TCRβ+ CD4+ FOXP3+) in the spleen of naïve mice (n = 3). (b, d–g) MC38-OVA tumors were implanted into WT and Pglyrp1−/− mice and TILs were harvested for flow cytometry. (b) Summary plots of the frequency of Treg cells (CD45+ TCRβ+ CD4+ FOXP3+) in the dLN (WT n = 9, Pglyrp1−/− n = 8) (left) and spleen (WT n = 10, Pglyrp1−/− n = 8) (right). (c) Gating strategy for CD8+ T cells in the tumor. (d) Summary plots of the frequency of indicated cytokines in CD8+ T cells in the dLN (WT n = 9, Pglyrp1−/− n = 8) (top) and spleen (WT n = 10, Pglyrp1−/− n = 8) (bottom). (e) Summary plots of the frequency of indicated cytokines in CD4+ T cells in the tumor (WT n = 12, Pglyrp1−/− n = 8) (top), dLN (WT n = 10, Pglyrp1−/− n = 8) (middle) and spleen (WT n = 12, Pglyrp1−/− n = 8) (bottom). (f) Summary plots of the frequency of PD-1- and TIM-3-expressing CD8+ T cells in the dLN (n = 8) (top) and spleen (WT n = 10, Pglyrp1−/− n = 8) (bottom). (g) Summary plots of the frequency of PD-1- and TIM-3-expressing CD4+ T cells in the tumor (WT n = 10, Pglyrp1−/− n = 8). In all panels, data are presented as the mean with ±SEM. Unpaired two-tailed t-tests were performed. NS, not significant.
Extended Data Fig. 5. Characterization of tumor-infiltrating T cells in Pglyrp1-deficient mice.

(a) Heatmap representing cluster-specific upregulated genes (FDR <0.05, log2 fold change > log2(1.5)). If a gene was upregulated in multiple clusters, it is only shown once in the cluster block where it has the biggest fold change. (b) Gene set enrichment analysis of selected Gene Ontology (GO) terms and KEGG and Reactome pathways (top) and published CD8+ T cell signatures (bottom) enriched in CD8+ T cell-1 (stem-like) cluster vs. CD8+ T cell-2 (effector/exhausted) cluster. Only WT cells were included in the analysis. Naïve CD8–1 (Supplementary Table 7); naïve CD8–2 (Supplementary Table 7); terminally exhausted-156; transitory vs. stem-like54; terminally exhausted-253; transitory vs. exhausted54; exhausted T cells75; effector-like56. P-values were computed with the empirical phenotype-based permutation tests (GSEA) and the values shown in the figures were not adjusted for multiple comparisons. (c) RNA velocity analysis was performed on the CD8+ T cell clusters (Fig. 3a) using scVelo31. The velocity vector field is displayed as streamlines (top) and at single-cell level with each arrow showing the direction and speed (thickness) of movement of an individual cell (bottom). (d) Volcano plot of differentially expressed genes comparing WT vs. Pglyrp1−/− cells in the Treg cluster (Fig. 3a). Differential genes were computed as FDR < 0.05 and |log2 fold change| > 0.25. Positive log2 fold change corresponds to upregulation in Pglyrp1−/− cells and vice versa. Log2 fold changes and -log10 p-values were capped within [−1.5, 1.5] and [0, 20] respectively for visualization purposes. P-values were computed with the empirical Bayes quasi-likelihood F-tests in edgeR, then adjusted for multiple comparisons using the Benjamini & Hochberg method (FDR).
Extended Data Fig. 6. Analysis of the tumor phenotype in Pglyrp1fl/fl mice.
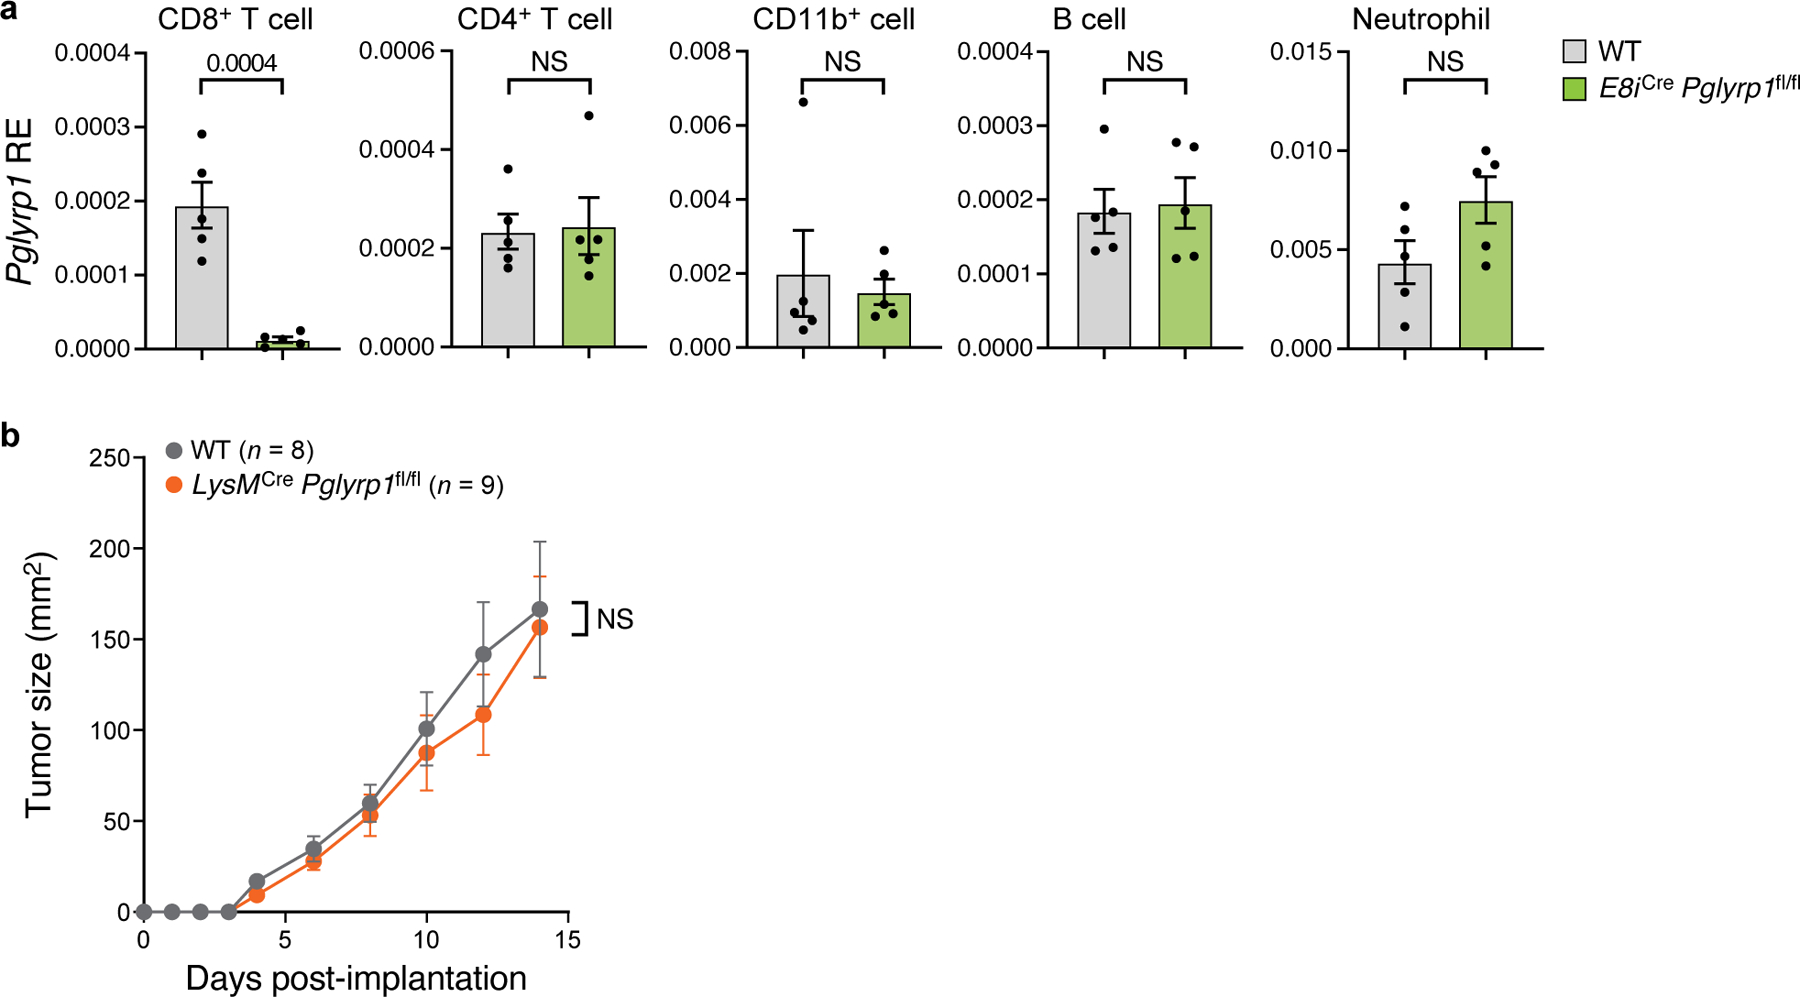
(a) Relative expression (RE) of Pglyrp1 in CD8+ T cells, CD4+ T cells, CD11b+ cells, B cells and neutrophils by qPCR (n = 5). MC38-OVA tumors were implanted into WT and E8iCrePglyrp1fl/fl mice. (b) Mean tumor growth of MC38-OVA tumors implanted into WT and LysMCrePglyrp1fl/fl mice (n = 8–9). In (a,b) data are presented as the mean with ± SEM. Unpaired two-tailed t-tests were performed. NS: not significant.
Extended Data Fig. 7. Analysis of CD8+ T cell phenotype and antigen-presentation of LysMCre Pglyrp1fl/fl splenocytes.

(a) Gating strategy of CD4+ T cells in the CNS. (b) On day 18 after immunization, CNS-infiltrating lymphocytes were extracted and analyzed for the expression of intracellular cytokines in CD8+ T cells by flow cytometry (n = 5). (c) Antigen-presentation assay with splenocytes from LysMCre Pglyrp1fl/fl or WT littermate controls with 2D2 naïve CD4+ T cells with or without MOG peptide (n = 4). Cell proliferation was measured by CellTrace Violet (CTV) staining. Quantification (left) and representative plots (right). (d) Cytokine concentration in the culture medium during antigen-presentation assay as in a, measured by legendplex (n = 4). In (b-d) data are presented as the mean with + SEM. Unpaired two-tailed t-tests were performed. NS: not significant.
Extended Data Fig. 8. scRNA-seq of CNS-infiltrated myeloid cells in Pglyrp1−/− mice during EAE.

(a) UMAP of CNS-infiltrating myeloid cells (3,698 cells). EAE was induced in Pglyrp1−/− and WT littermate controls and CNS-infiltrating myeloid cells were sorted (CD45+ CD3− CD19−) for scRNA-seq at disease onset (day 10). (b) Venn diagram depicting the overlap in upregulated genes (FDR < 0.05, |log2 fold change| > 0.25) in WT cells (top) and Pglyrp1−/− cells (bottom) both in mono/MAC and neutrophil clusters as defined in (Fig. 6b). (c) Monocyte treatment with PGN, PGLYRP1, or PGN + PGLYRP1 (n = 3). Bar plot depicting the TNF concentration in the culture medium. Data are presented as the mean with ±SEM. Dotted line indicates the detection limit. Unpaired two-tailed t-tests were performed.
Supplementary Material
Acknowledgments
We would like to thank all members of the Kuchroo laboratory for helpful discussions and feedback. We thank Junrong Xia, Helene Stroh, Edward A. Greenfield, Rajesh Kumar Krishnan, and Deneen Kozoriz for their assistance and technical support and Leslie Gaffney for help with figures. Additionally, we would like to thank Mary Collins for critical feedback on the manuscript.
This work was supported by National Institute of Health grants (P01AI073748, P01AI039671, P01AI056299, and R01AI144166) to V.K.K and R01CA187975 (A.C.A.). A.S. was supported by a German Academic Scholarship Foundation (Studienstiftung des Deutschen Volkes) PhD fellowship. A.R. was supported by the Klarman Cell Observatory and HHMI.
Footnotes
Competing interests statement
A.C.A. is a member of the SAB for Tizona Therapeutics, Trishula Therapeutics, Compass Therapeutics, Zumutor Biologics, ImmuneOncia, and Excepgen, which have interests in cancer immunotherapy. A.C.A. is also a paid consultant for iTeos Therapeutics and Larkspur Biosciences. V.K.K. is cofounder of Celsius Therapeutics, Tizona Therapeutics, Larkspur Biosciences and Bicara Therapeutics. A.C.A.’s and V.K.K.’s interests are reviewed and managed by the Brigham and Women’s Hospital and Partners Healthcare in accordance with their conflict-of-interest policies. A.R. is a co-founder and equity holder of Celsius Therapeutics, an equity holder in Immunitas, and was an SAB member of ThermoFisher Scientific, Syros Pharmaceuticals, Neogene Therapeutics and Asimov until July 31, 2020. A.R. is an employee of Genentech (member of the Roche Group) since August 2020, and has equity in Roche. All other authors declare no competing interests.
Code availability
All code is available on GitHub: https://github.com/lhuang1/Pglyrp1_Tumor_EAE
Data availability
Bulk and single-cell RNA-seq data generated in this paper (related to Fig. 2h-k), are available in GEO: GSE223896. Pre-existing data accessed in Fig. 1a-c are available in GEO: GSE113968 (subseries numbers are GSE113262, GSE113280, GSE113689, GSE113807, and GSE113811), and the data accessed in Extended Data Fig. 1 are available in GEO: GSE120575.
References
- 1.Ribas A, and Wolchok JD (2018). Cancer immunotherapy using checkpoint blockade. Science 359, 1350–1355. 10.1126/science.aar4060. [DOI] [PMC free article] [PubMed] [Google Scholar]
- 2.Pauken KE, Dougan M, Rose NR, Lichtman AH, and Sharpe AH (2019). Adverse Events Following Cancer Immunotherapy: Obstacles and Opportunities. Trends Immunol 40, 511–523. 10.1016/j.it.2019.04.002. [DOI] [PMC free article] [PubMed] [Google Scholar]
- 3.Schnell A, Bod L, Madi A, and Kuchroo VK (2020). The yin and yang of co-inhibitory receptors: toward anti-tumor immunity without autoimmunity. Cell Res 30, 285–299. 10.1038/s41422-020-0277-x. [DOI] [PMC free article] [PubMed] [Google Scholar]
- 4.Khan Z, Hammer C, Carroll J, Di Nucci F, Acosta SL, Maiya V, Bhangale T, Hunkapiller J, Mellman I, Albert ML, et al. (2021). Genetic variation associated with thyroid autoimmunity shapes the systemic immune response to PD-1 checkpoint blockade. Nat Commun 12, 3355. 10.1038/s41467-021-23661-4. [DOI] [PMC free article] [PubMed] [Google Scholar]
- 5.Dziarski R, and Gupta D (2006). The peptidoglycan recognition proteins (PGRPs). Genome Biol 7, 232. 10.1186/gb-2006-7-8-232. [DOI] [PMC free article] [PubMed] [Google Scholar]
- 6.Dziarski R, and Gupta D (2010). Review: Mammalian peptidoglycan recognition proteins (PGRPs) in innate immunity. Innate Immun 16, 168–174. 10.1177/1753425910366059. [DOI] [PubMed] [Google Scholar]
- 7.Royet J, Gupta D, and Dziarski R (2011). Peptidoglycan recognition proteins: modulators of the microbiome and inflammation. Nat Rev Immunol 11, 837–851. 10.1038/nri3089. [DOI] [PubMed] [Google Scholar]
- 8.Dziarski R, Platt KA, Gelius E, Steiner H, and Gupta D (2003). Defect in neutrophil killing and increased susceptibility to infection with nonpathogenic gram-positive bacteria in peptidoglycan recognition protein-S (PGRP-S)-deficient mice. Blood 102, 689–697. 10.1182/blood-2002-12-3853. [DOI] [PubMed] [Google Scholar]
- 9.Cho JH, Fraser IP, Fukase K, Kusumoto S, Fujimoto Y, Stahl GL, and Ezekowitz RA (2005). Human peptidoglycan recognition protein S is an effector of neutrophil-mediated innate immunity. Blood 106, 2551–2558. 10.1182/blood-2005-02-0530. [DOI] [PMC free article] [PubMed] [Google Scholar]
- 10.Lo D, Tynan W, Dickerson J, Mendy J, Chang HW, Scharf M, Byrne D, Brayden D, Higgins L, Evans C, and O’Mahony DJ (2003). Peptidoglycan recognition protein expression in mouse Peyer’s Patch follicle associated epithelium suggests functional specialization. Cell Immunol 224, 8–16. 10.1016/s0008-8749(03)00155-2. [DOI] [PubMed] [Google Scholar]
- 11.Lu X, Wang M, Qi J, Wang H, Li X, Gupta D, and Dziarski R (2006). Peptidoglycan recognition proteins are a new class of human bactericidal proteins. J Biol Chem 281, 5895–5907. 10.1074/jbc.M511631200. [DOI] [PubMed] [Google Scholar]
- 12.Wang M, Liu LH, Wang S, Li X, Lu X, Gupta D, and Dziarski R (2007). Human peptidoglycan recognition proteins require zinc to kill both gram-positive and gram-negative bacteria and are synergistic with antibacterial peptides. J Immunol 178, 3116–3125. 10.4049/jimmunol.178.5.3116. [DOI] [PubMed] [Google Scholar]
- 13.Sashchenko LP, Dukhanina EA, Yashin DV, Shatalov YV, Romanova EA, Korobko EV, Demin AV, Lukyanova TI, Kabanova OD, Khaidukov SV, et al. (2004). Peptidoglycan recognition protein tag7 forms a cytotoxic complex with heat shock protein 70 in solution and in lymphocytes. J Biol Chem 279, 2117–2124. 10.1074/jbc.M307513200. [DOI] [PubMed] [Google Scholar]
- 14.Read CB, Kuijper JL, Hjorth SA, Heipel MD, Tang X, Fleetwood AJ, Dantzler JL, Grell SN, Kastrup J, Wang C, et al. (2015). Cutting Edge: identification of neutrophil PGLYRP1 as a ligand for TREM-1. J Immunol 194, 1417–1421. 10.4049/jimmunol.1402303. [DOI] [PMC free article] [PubMed] [Google Scholar]
- 15.Downs-Canner S, Berkey S, Delgoffe GM, Edwards RP, Curiel T, Odunsi K, Bartlett DL, and Obermajer N (2017). Suppressive IL-17A(+)Foxp3(+) and ex-Th17 IL-17A(neg)Foxp3(+) Treg cells are a source of tumour-associated Treg cells. Nat Commun 8, 14649. 10.1038/ncomms14649. [DOI] [PMC free article] [PubMed] [Google Scholar]
- 16.Chihara N, Madi A, Kondo T, Zhang H, Acharya N, Singer M, Nyman J, Marjanovic ND, Kowalczyk MS, Wang C, et al. (2018). Induction and transcriptional regulation of the co-inhibitory gene module in T cells. Nature 558, 454–459. 10.1038/s41586-018-0206-z. [DOI] [PMC free article] [PubMed] [Google Scholar]
- 17.Singer M, Wang C, Cong L, Marjanovic ND, Kowalczyk MS, Zhang H, Nyman J, Sakuishi K, Kurtulus S, Gennert D, et al. (2016). A Distinct Gene Module for Dysfunction Uncoupled from Activation in Tumor-Infiltrating T Cells. Cell 166, 1500–1511 e1509. 10.1016/j.cell.2016.08.052. [DOI] [PMC free article] [PubMed] [Google Scholar]
- 18.Ng SS, De Labastida Rivera F, Yan J, Corvino D, Das I, Zhang P, Kuns R, Chauhan SB, Hou J, Li XY, et al. (2020). The NK cell granule protein NKG7 regulates cytotoxic granule exocytosis and inflammation. Nat Immunol 21, 1205–1218. 10.1038/s41590-020-0758-6. [DOI] [PMC free article] [PubMed] [Google Scholar]
- 19.Raskov H, Orhan A, Christensen JP, and Gogenur I (2021). Cytotoxic CD8(+) T cells in cancer and cancer immunotherapy. Br J Cancer 124, 359–367. 10.1038/s41416-020-01048-4. [DOI] [PMC free article] [PubMed] [Google Scholar]
- 20.Di Pilato M, Kfuri-Rubens R, Pruessmann JN, Ozga AJ, Messemaker M, Cadilha BL, Sivakumar R, Cianciaruso C, Warner RD, Marangoni F, et al. (2021). CXCR6 positions cytotoxic T cells to receive critical survival signals in the tumor microenvironment. Cell 184, 4512–4530 e4522. 10.1016/j.cell.2021.07.015. [DOI] [PMC free article] [PubMed] [Google Scholar]
- 21.Salmon AJ, Shavkunov AS, Miao Q, Jarjour NN, Keshari S, Esaulova E, Williams CD, Ward JP, Highsmith AM, Pineda JE, et al. (2022). BHLHE40 Regulates the T-Cell Effector Function Required for Tumor Microenvironment Remodeling and Immune Checkpoint Therapy Efficacy. Cancer Immunol Res 10, 597–611. 10.1158/2326-6066.CIR-21-0129. [DOI] [PMC free article] [PubMed] [Google Scholar]
- 22.Kurtulus S, Madi A, Escobar G, Klapholz M, Nyman J, Christian E, Pawlak M, Dionne D, Xia J, Rozenblatt-Rosen O, et al. (2019). Checkpoint Blockade Immunotherapy Induces Dynamic Changes in PD-1(−)CD8(+) Tumor-Infiltrating T Cells. Immunity 50, 181–194 e186. 10.1016/j.immuni.2018.11.014. [DOI] [PMC free article] [PubMed] [Google Scholar]
- 23.Sade-Feldman M, Yizhak K, Bjorgaard SL, Ray JP, de Boer CG, Jenkins RW, Lieb DJ, Chen JH, Frederick DT, Barzily-Rokni M, et al. (2018). Defining T Cell States Associated with Response to Checkpoint Immunotherapy in Melanoma. Cell 175, 998–1013 e1020. 10.1016/j.cell.2018.10.038. [DOI] [PMC free article] [PubMed] [Google Scholar]
- 24.Robinson MD, McCarthy DJ, and Smyth GK (2010). edgeR: a Bioconductor package for differential expression analysis of digital gene expression data. bioinformatics 26, 139−-140. [DOI] [PMC free article] [PubMed] [Google Scholar]
- 25.McCarthy DJ, Chen Y, and Smyth GK (2012). Differential expression analysis of multifactor RNA-Seq experiments with respect to biological variation. Nucleic Acids Res 40, 4288–4297. 10.1093/nar/gks042. [DOI] [PMC free article] [PubMed] [Google Scholar]
- 26.Chen Y, Lun AT, and Smyth GK (2016). From reads to genes to pathways: differential expression analysis of RNA-Seq experiments using Rsubread and the edgeR quasi-likelihood pipeline. F1000Research 5. [DOI] [PMC free article] [PubMed] [Google Scholar]
- 27.Wherry EJ, Ha SJ, Kaech SM, Haining WN, Sarkar S, Kalia V, Subramaniam S, Blattman JN, Barber DL, and Ahmed R (2007). Molecular signature of CD8+ T cell exhaustion during chronic viral infection. Immunity 27, 670–684. 10.1016/j.immuni.2007.09.006. [DOI] [PubMed] [Google Scholar]
- 28.Doering TA, Crawford A, Angelosanto JM, Paley MA, Ziegler CG, and Wherry EJ (2012). Network analysis reveals centrally connected genes and pathways involved in CD8+ T cell exhaustion versus memory. Immunity 37, 1130–1144. 10.1016/j.immuni.2012.08.021. [DOI] [PMC free article] [PubMed] [Google Scholar]
- 29.Gattinoni L, Lugli E, Ji Y, Pos Z, Paulos CM, Quigley MF, Almeida JR, Gostick E, Yu Z, Carpenito C, et al. (2011). A human memory T cell subset with stem cell-like properties. Nat Med 17, 1290–1297. 10.1038/nm.2446. [DOI] [PMC free article] [PubMed] [Google Scholar]
- 30.Tirosh I, Izar B, Prakadan SM, Wadsworth MH 2nd, Treacy D, Trombetta JJ, Rotem A, Rodman C, Lian C, Murphy G, et al. (2016). Dissecting the multicellular ecosystem of metastatic melanoma by single-cell RNA-seq. Science 352, 189–196. 10.1126/science.aad0501. [DOI] [PMC free article] [PubMed] [Google Scholar]
- 31.Bergen V, Lange M, Peidli S, Wolf FA, and Theis FJ (2020). Generalizing RNA velocity to transient cell states through dynamical modeling. Nat Biotechnol. 10.1038/s41587-020-0591-3. [DOI] [PubMed] [Google Scholar]
- 32.Anz D, Mueller W, Golic M, Kunz WG, Rapp M, Koelzer VH, Ellermeier J, Ellwart JW, Schnurr M, Bourquin C, and Endres S (2011). CD103 is a hallmark of tumor-infiltrating regulatory T cells. Int J Cancer 129, 2417–2426. 10.1002/ijc.25902. [DOI] [PubMed] [Google Scholar]
- 33.Karandikar NJ, Vanderlugt CL, Walunas TL, Miller SD, and Bluestone JA (1996). CTLA-4: a negative regulator of autoimmune disease. J Exp Med 184, 783–788. 10.1084/jem.184.2.783. [DOI] [PMC free article] [PubMed] [Google Scholar]
- 34.Salama AD, Chitnis T, Imitola J, Ansari MJ, Akiba H, Tushima F, Azuma M, Yagita H, Sayegh MH, and Khoury SJ (2003). Critical role of the programmed death-1 (PD-1) pathway in regulation of experimental autoimmune encephalomyelitis. J Exp Med 198, 71–78. 10.1084/jem.20022119. [DOI] [PMC free article] [PubMed] [Google Scholar]
- 35.Monney L, Sabatos CA, Gaglia JL, Ryu A, Waldner H, Chernova T, Manning S, Greenfield EA, Coyle AJ, Sobel RA, et al. (2002). Th1-specific cell surface protein Tim-3 regulates macrophage activation and severity of an autoimmune disease. Nature 415, 536–541. 10.1038/415536a. [DOI] [PubMed] [Google Scholar]
- 36.Joller N, Hafler JP, Brynedal B, Kassam N, Spoerl S, Levin SD, Sharpe AH, and Kuchroo VK (2011). Cutting edge: TIGIT has T cell-intrinsic inhibitory functions. J Immunol 186, 1338–1342. 10.4049/jimmunol.1003081. [DOI] [PMC free article] [PubMed] [Google Scholar]
- 37.Chastain EM, Duncan DS, Rodgers JM, and Miller SD (2011). The role of antigen presenting cells in multiple sclerosis. Biochim Biophys Acta 1812, 265–274. 10.1016/j.bbadis.2010.07.008. [DOI] [PMC free article] [PubMed] [Google Scholar]
- 38.Jordao MJC, Sankowski R, Brendecke SM, Sagar, Locatelli G, Tai YH, Tay TL, Schramm E, Armbruster S, Hagemeyer N, et al. (2019). Single-cell profiling identifies myeloid cell subsets with distinct fates during neuroinflammation. Science 363. 10.1126/science.aat7554. [DOI] [PubMed] [Google Scholar]
- 39.Shi J, Hua L, Harmer D, Li P, and Ren G (2018). Cre Driver Mice Targeting Macrophages. Methods Mol Biol 1784, 263–275. 10.1007/978-1-4939-7837-3_24. [DOI] [PMC free article] [PubMed] [Google Scholar]
- 40.Bettelli E, Pagany M, Weiner HL, Linington C, Sobel RA, and Kuchroo VK (2003). Myelin oligodendrocyte glycoprotein-specific T cell receptor transgenic mice develop spontaneous autoimmune optic neuritis. J Exp Med 197, 1073–1081. 10.1084/jem.20021603. [DOI] [PMC free article] [PubMed] [Google Scholar]
- 41.Bonacina F, Coe D, Wang G, Longhi MP, Baragetti A, Moregola A, Garlaschelli K, Uboldi P, Pellegatta F, Grigore L, et al. (2018). Myeloid apolipoprotein E controls dendritic cell antigen presentation and T cell activation. Nat Commun 9, 3083. 10.1038/s41467-018-05322-1. [DOI] [PMC free article] [PubMed] [Google Scholar]
- 42.Jia W, Kidoya H, Yamakawa D, Naito H, and Takakura N (2013). Galectin-3 accelerates M2 macrophage infiltration and angiogenesis in tumors. Am J Pathol 182, 1821–1831. 10.1016/j.ajpath.2013.01.017. [DOI] [PubMed] [Google Scholar]
- 43.Yao J, Mackman N, Edgington TS, and Fan ST (1997). Lipopolysaccharide induction of the tumor necrosis factor-alpha promoter in human monocytic cells. Regulation by Egr-1, c-Jun, and NF-kappaB transcription factors. J Biol Chem 272, 17795–17801. 10.1074/jbc.272.28.17795. [DOI] [PubMed] [Google Scholar]
- 44.Napolitani G, Bortoletto N, Racioppi L, Lanzavecchia A, and D’Oro U (2003). Activation of src-family tyrosine kinases by LPS regulates cytokine production in dendritic cells by controlling AP-1 formation. Eur J Immunol 33, 2832–2841. 10.1002/eji.200324073. [DOI] [PubMed] [Google Scholar]
- 45.Bashirova AA, Apps R, Vince N, Mochalova Y, Yu XG, and Carrington M (2014). Diversity of the human LILRB3/A6 locus encoding a myeloid inhibitory and activating receptor pair. Immunogenetics 66, 1–8. 10.1007/s00251-013-0730-9. [DOI] [PMC free article] [PubMed] [Google Scholar]
- 46.Artis D, Villarino A, Silverman M, He W, Thornton EM, Mu S, Summer S, Covey TM, Huang E, Yoshida H, et al. (2004). The IL-27 receptor (WSX-1) is an inhibitor of innate and adaptive elements of type 2 immunity. J Immunol 173, 5626–5634. 10.4049/jimmunol.173.9.5626. [DOI] [PubMed] [Google Scholar]
- 47.Stumhofer JS, Laurence A, Wilson EH, Huang E, Tato CM, Johnson LM, Villarino AV, Huang Q, Yoshimura A, Sehy D, et al. (2006). Interleukin 27 negatively regulates the development of interleukin 17-producing T helper cells during chronic inflammation of the central nervous system. Nat Immunol 7, 937–945. 10.1038/ni1376. [DOI] [PubMed] [Google Scholar]
- 48.Awasthi A, Carrier Y, Peron JP, Bettelli E, Kamanaka M, Flavell RA, Kuchroo VK, Oukka M, and Weiner HL (2007). A dominant function for interleukin 27 in generating interleukin 10-producing anti-inflammatory T cells. Nat Immunol 8, 1380–1389. 10.1038/ni1541. [DOI] [PubMed] [Google Scholar]
- 49.Fitzgerald DC, Zhang GX, El-Behi M, Fonseca-Kelly Z, Li H, Yu S, Saris CJ, Gran B, Ciric B, and Rostami A (2007). Suppression of autoimmune inflammation of the central nervous system by interleukin 10 secreted by interleukin 27-stimulated T cells. Nat Immunol 8, 1372–1379. 10.1038/ni1540. [DOI] [PubMed] [Google Scholar]
- 50.Zhang H, Madi A, Yosef N, Chihara N, Awasthi A, Pot C, Lambden C, Srivastava A, Burkett PR, Nyman J, et al. (2020). An IL-27-Driven Transcriptional Network Identifies Regulators of IL-10 Expression across T Helper Cell Subsets. Cell Rep 33, 108433. 10.1016/j.celrep.2020.108433. [DOI] [PMC free article] [PubMed] [Google Scholar]
- 51.Batten M, Kljavin NM, Li J, Walter MJ, de Sauvage FJ, and Ghilardi N (2008). Cutting edge: IL-27 is a potent inducer of IL-10 but not FoxP3 in murine T cells. J Immunol 180, 2752–2756. 10.4049/jimmunol.180.5.2752. [DOI] [PubMed] [Google Scholar]
- 52.Murtagh F, and Legendre P (2014). Ward’s hierarchical agglomerative clustering method: which algorithms implement Ward’s criterion? Journal of classification 31, 274−-295. [Google Scholar]
- 53.Beltra JC, Manne S, Abdel-Hakeem MS, Kurachi M, Giles JR, Chen Z, Casella V, Ngiow SF, Khan O, Huang YJ, et al. (2020). Developmental Relationships of Four Exhausted CD8(+) T Cell Subsets Reveals Underlying Transcriptional and Epigenetic Landscape Control Mechanisms. Immunity 52, 825–841 e828. 10.1016/j.immuni.2020.04.014. [DOI] [PMC free article] [PubMed] [Google Scholar]
- 54.Hudson WH, Gensheimer J, Hashimoto M, Wieland A, Valanparambil RM, Li P, Lin JX, Konieczny BT, Im SJ, Freeman GJ, et al. (2019). Proliferating Transitory T Cells with an Effector-like Transcriptional Signature Emerge from PD-1(+) Stem-like CD8(+) T Cells during Chronic Infection. Immunity 51, 1043–1058 e1044. 10.1016/j.immuni.2019.11.002. [DOI] [PMC free article] [PubMed] [Google Scholar]
- 55.Gaublomme JT, Yosef N, Lee Y, Gertner RS, Yang LV, Wu C, Pandolfi PP, Mak T, Satija R, Shalek AK, et al. (2015). Single-Cell Genomics Unveils Critical Regulators of Th17 Cell Pathogenicity. Cell 163, 1400–1412. 10.1016/j.cell.2015.11.009. [DOI] [PMC free article] [PubMed] [Google Scholar]
- 56.Miller BC, Sen DR, Al Abosy R, Bi K, Virkud YV, LaFleur MW, Yates KB, Lako A, Felt K, Naik GS, et al. (2019). Subsets of exhausted CD8(+) T cells differentially mediate tumor control and respond to checkpoint blockade. Nat Immunol 20, 326–336. 10.1038/s41590-019-0312-6. [DOI] [PMC free article] [PubMed] [Google Scholar]
- 57.Best JA, Blair DA, Knell J, Yang E, Mayya V, Doedens A, Dustin ML, Goldrath AW, and Immunological Genome Project C (2013). Transcriptional insights into the CD8(+) T cell response to infection and memory T cell formation. Nat Immunol 14, 404–412. 10.1038/ni.2536. [DOI] [PMC free article] [PubMed] [Google Scholar]
Methods-only references
- 58.Jager A, Dardalhon V, Sobel RA, Bettelli E, and Kuchroo VK (2009). Th1, Th17, and Th9 effector cells induce experimental autoimmune encephalomyelitis with different pathological phenotypes. J Immunol 183, 7169–7177. 10.4049/jimmunol.0901906. [DOI] [PMC free article] [PubMed] [Google Scholar]
- 59.Schnell A, Huang L, Singer M, Singaraju A, Barilla RM, Regan BML, Bollhagen A, Thakore PI, Dionne D, Delorey TM, et al. (2021). Stem-like intestinal Th17 cells give rise to pathogenic effector T cells during autoimmunity. Cell 184, 6281–6298 e6223. 10.1016/j.cell.2021.11.018. [DOI] [PMC free article] [PubMed] [Google Scholar]
- 60.Satija R, Farrell JA, Gennert D, Schier AF, and Regev A (2015). Spatial reconstruction of single-cell gene expression data. Nat Biotechnol 33, 495–502. 10.1038/nbt.3192. [DOI] [PMC free article] [PubMed] [Google Scholar]
- 61.Picelli S, Faridani OR, Bjorklund AK, Winberg G, Sagasser S, and Sandberg R (2014). Full-length RNA-seq from single cells using Smart-seq2. Nat Protoc 9, 171–181. 10.1038/nprot.2014.006. [DOI] [PubMed] [Google Scholar]
- 62.Li B, Gould J, Yang Y, Sarkizova S, Tabaka M, Ashenberg O, Rosen Y, Slyper M, Kowalczyk MS, Villani AC, et al. (2020). Cumulus provides cloud-based data analysis for large-scale single-cell and single-nucleus RNA-seq. Nat Methods 17, 793–798. 10.1038/s41592-020-0905-x. [DOI] [PMC free article] [PubMed] [Google Scholar]
- 63.McGinnis CS, Murrow LM, and Gartner ZJ (2019). DoubletFinder: Doublet Detection in Single-Cell RNA Sequencing Data Using Artificial Nearest Neighbors. Cell Syst 8, 329–337 e324. 10.1016/j.cels.2019.03.003. [DOI] [PMC free article] [PubMed] [Google Scholar]
- 64.Machado L, Geara P, Camps J, Dos Santos M, Teixeira-Clerc F, Van Herck J, Varet H, Legendre R, Pawlotsky JM, Sampaolesi M, et al. (2021). Tissue damage induces a conserved stress response that initiates quiescent muscle stem cell activation. Cell Stem Cell 28, 1125–1135 e1127. 10.1016/j.stem.2021.01.017. [DOI] [PubMed] [Google Scholar]
- 65.Waltman L, and Van Eck NJ (2013). A smart local moving algorithm for large-scale modularity-based community detection. The European physical journal B 86, 1−-14. [Google Scholar]
- 66.McInnes L, Healy J, and Melville J (2018). Umap: Uniform manifold approximation and projection for dimension reduction. arXiv preprint arXiv:1802.03426 [Google Scholar]
- 67.Zilionis R, Engblom C, Pfirschke C, Savova V, Zemmour D, Saatcioglu HD, Krishnan I, Maroni G, Meyerovitz CV, Kerwin CM, et al. (2019). Single-Cell Transcriptomics of Human and Mouse Lung Cancers Reveals Conserved Myeloid Populations across Individuals and Species. Immunity 50, 1317–1334 e1310. 10.1016/j.immuni.2019.03.009. [DOI] [PMC free article] [PubMed] [Google Scholar]
- 68.Soneson C, and Robinson MD (2018). Bias, robustness and scalability in single-cell differential expression analysis. Nat Methods 15, 255–261. 10.1038/nmeth.4612. [DOI] [PubMed] [Google Scholar]
- 69.Melsted P, Booeshaghi AS, Liu L, Gao F, Lu L, Min KHJ, da Veiga Beltrame E, Hjorleifsson KE, Gehring J, and Pachter L (2021). Modular, efficient and constant-memory single-cell RNA-seq preprocessing. Nat Biotechnol 39, 813–818. 10.1038/s41587-021-00870-2. [DOI] [PubMed] [Google Scholar]
- 70.Li T, Fu J, Zeng Z, Cohen D, Li J, Chen Q, Li B, and Liu XS (2020). TIMER2.0 for analysis of tumor-infiltrating immune cells. Nucleic Acids Res 48, W509–W514. 10.1093/nar/gkaa407. [DOI] [PMC free article] [PubMed] [Google Scholar]
- 71.Borate U, Esteve J, Porkka K, Knapper S, Vey N, Scholl S, Garcia-Manero G, Wermke M, Janssen J, and Traer E (2019). Phase Ib Study of the Anti-TIM-3 Antibody MBG453 in Combination with Decitabine in Patients with High-Risk Myelodysplastic Syndrome (MDS) and Acute Myeloid Leukemia (AML) American Society of Hematology; Washington, DC. [Google Scholar]
- 72.Li B, and Dewey CN (2011). RSEM: accurate transcript quantification from RNA-Seq data with or without a reference genome. BMC Bioinformatics 12, 323. 10.1186/1471-2105-12-323. [DOI] [PMC free article] [PubMed] [Google Scholar]
- 73.Love MI, Huber W, and Anders S (2014). Moderated estimation of fold change and dispersion for RNA-seq data with DESeq2. Genome Biol 15, 550. 10.1186/s13059-014-0550-8. [DOI] [PMC free article] [PubMed] [Google Scholar]
- 74.Korotkevich G, Sukhov V, Budin N, Shpak B, Artyomov MN, and Sergushichev A (2021). Fast gene set enrichment analysis. BioRxiv [Google Scholar]
- 75.Jiang P, Gu S, Pan D, Fu J, Sahu A, Hu X, Li Z, Traugh N, Bu X, Li B, et al. (2018). Signatures of T cell dysfunction and exclusion predict cancer immunotherapy response. Nat Med 24, 1550–1558. 10.1038/s41591-018-0136-1. [DOI] [PMC free article] [PubMed] [Google Scholar]
Associated Data
This section collects any data citations, data availability statements, or supplementary materials included in this article.
Supplementary Materials
Data Availability Statement
Bulk and single-cell RNA-seq data generated in this paper (related to Fig. 2h-k), are available in GEO: GSE223896. Pre-existing data accessed in Fig. 1a-c are available in GEO: GSE113968 (subseries numbers are GSE113262, GSE113280, GSE113689, GSE113807, and GSE113811), and the data accessed in Extended Data Fig. 1 are available in GEO: GSE120575.