

Abstract
Purpose
To determine whether the unsupervised domain adaptation (UDA) method with generated images improves the performance of a supervised learning (SL) model for prostate cancer (PCa) detection using multisite biparametric (bp) MRI datasets.
Materials and Methods
This retrospective study included data from 5150 patients (14 191 samples) collected across nine different imaging centers. A novel UDA method using a unified generative model was developed for PCa detection using multisite bpMRI datasets. This method translates diffusion-weighted imaging (DWI) acquisitions, including apparent diffusion coefficient (ADC) and individual diffusion-weighted (DW) images acquired using various b values, to align with the style of images acquired using b values recommended by Prostate Imaging Reporting and Data System (PI-RADS) guidelines. The generated ADC and DW images replace the original images for PCa detection. An independent set of 1692 test cases (2393 samples) was used for evaluation. The area under the receiver operating characteristic curve (AUC) was used as the primary metric, and statistical analysis was performed via bootstrapping.
Results
For all test cases, the AUC values for baseline SL and UDA methods were 0.73 and 0.79 (P < .001), respectively, for PCa lesions with PI-RADS score of 3 or greater and 0.77 and 0.80 (P < .001) for lesions with PI-RADS scores of 4 or greater. In the 361 test cases under the most unfavorable image acquisition setting, the AUC values for baseline SL and UDA were 0.49 and 0.76 (P < .001) for lesions with PI-RADS scores of 3 or greater and 0.50 and 0.77 (P < .001) for lesions with PI-RADS scores of 4 or greater.
Conclusion
UDA with generated images improved the performance of SL methods in PCa lesion detection across multisite datasets with various b values, especially for images acquired with significant deviations from the PI-RADS-recommended DWI protocol (eg, with an extremely high b value).
Keywords: Prostate Cancer Detection, Multisite, Unsupervised Domain Adaptation, Diffusion-weighted Imaging, b Value
Supplemental material is available for this article.
© RSNA, 2024
Keywords: Prostate Cancer Detection, Multisite, Unsupervised Domain Adaptation, Diffusion-weighted Imaging, b Value

Summary
Unsupervised domain adaptation with diffusion-weighted images generated using a unified model improved the performance of supervised learning models in detection of prostate cancer lesions across large, multisite datasets with various b values.
Key Points
■ A novel unsupervised domain adaptation (UDA) method used a unified generator to translate the diffusion-weighted image style from multiple target (test) domains into the reference (training) domain used for training the supervised learning model for prostate cancer detection.
■ The dynamic filter was used to enable multidomain mapping within a unified generator that accepts target images with arbitrary b values as distinct domains, leveraging meta-information to differentiate between domains.
■ When evaluated on 1692 unseen test cases (2393 samples), the proposed method was shown to improve performance of the baseline supervised learning method in detecting lesions with Prostate Imaging Reporting and Data System score of 3 or greater (area under the receiver operating characteristic curve [AUC], 0.73–0.79; P < .001), including when the b values of the test image represented out-of-distribution samples from the training set (particularly for low b values of 150 and 200 sec/mm2 and high b value of 2000 sec/mm2, with the AUC increasing from 0.49 to 0.76 [P < .001]).
Introduction
Prostate cancer (PCa) is one of the most common cancers in men. If PCa is detected early, the patient can have an improved prognosis, including better treatment outcomes and lower mortality rates (1,2). Earlier studies have shown promising results for early PCa diagnosis using multiparametric MRI (3,4) or biparametric MRI (bpMRI) (5,6). Recently, deep learning–based methods have achieved high performance for PCa detection by leveraging information from bpMR images (7–11). These methods could boost productivity of radiologists by shortening the time needed for interpreting images through automated lesion detection. In addition, they have the potential to heighten diagnostic accuracy, notably for less experienced radiologists, and to enhance consistency among different readers (9). In these techniques, diffusion-weighted imaging (DWI) stands out as a crucial element, offering a pronounced distinction in signal intensities between cancerous and healthy tissues. This distinction is especially noticeable in apparent diffusion coefficient (ADC) maps and images with high b values.
Many convolutional neural networks (CNNs) from previous studies were trained and tested using supervised learning (SL) methods on datasets from a single institution or multiple sites that adhered to similar acquisition protocols, particularly with b-value settings as recommended by the Prostate Imaging Reporting and Data System (PI-RADS) (12) guidelines. Under these conditions, test samples are tightly matched to the training set, allowing CNNs to yield reliable results for such in-distribution data. However, in real-world scenarios, clinical sites may have their own preferences for b-value selections. Although variances in ADC and images with high b values due to diverse b-value choices may seem negligible to human observers, they can substantially influence deep learning models. This is largely attributed to the domain shifts observed across images from different datasets (13). The performance of a CNN drops, producing inaccurate results, when domain shifts are encountered or an out-of-distribution (OOD) test sample from a target domain is processed, whose b values are not included in the training set (14). Figure 1A provides an illustrative example.
Figure 1:

(A) Diagram shows the common domain shift problem for prostate cancer detection with a supervised learning model. When MR images are collected using different protocols, the performance of the pretrained model is not guaranteed. (B) Diagram shows the typical unsupervised domain adaptation (UDA) solution on domain shift, in which multiple generators and detection models are trained. (C) Our unified model solution, which needs only a single generator and pretrained detection network. Specifically, the proposed method aims to translate image style from the target domain (unlabeled test data) to the reference domain (labeled data used to train the detection model) using a unified generator. The training set is regarded as the source domain, with the reference domain being its subset. Best viewed in color. AI = artificial intelligence, R = reference domain, S = source domain, T = target domain.
One straightforward way to overcome the domain shift problem is to retrain the generic model with a larger dataset to enlarge the b-value distribution. In practice, however, it is hard to transfer data between different imaging centers to obtain extra training data, and obtaining human labels for large datasets is time-consuming and expensive. In addition, there is no assurance that all b values will be included.
Domain adaptation is a potential solution to address the domain shift issue, which attempts to alleviate the decrease in generalization ability caused by the distribution shift between source domain training data and target domain test data (15–18). However, such methods require human delineations from the target domain during the training process. Addressing the label availability challenge, unsupervised domain adaptation (UDA) has been introduced. Although UDA methods are extensively used across various medical image analysis tasks (19–22), only a few studies have been conducted in the field of PCa detection (23). Furthermore, most existing UDA studies are focused on single-domain mapping. When applied to multidomain settings, these methods are required to train multiple generators for every domain pair, as well as their downstream task networks, after obtaining the generated labeled data. This approach is time-consuming and not feasible in practice (Fig 1B).
The aim of this study was to assess whether harmonization of ADC maps and high-b-value image data improve the accuracy of predicting prostate lesion from multisite data with various b values. We propose a UDA framework that is designed for practical applications with a unified model for multidomain mapping, as depicted in Figure 1C, which is computationally efficient, especially when encountering a large number of domains. Moreover, our method does not require annotations from the test data, and it can be applied to any pretrained network for practical use without retraining. Specifically, our approach uses the ADC map and high-b-value images derived from various b-value settings as inputs. It leverages meta-information to more effectively synthesize the ADC map and high-b-value image at a consistent (and standard) b-value setting. Our method was evaluated using a large-scale dataset with various b values.
Materials and Methods
Dataset
The study received approval from the local ethics committees at all participating institutions. Written informed consent was obtained from all patients, or consent was waived as appropriate. Some of the authors involved in data analysis are employees of Siemens Healthineers. This retrospective analysis uses a multicohort dataset of 5150 cases from nine different clinical sites, all of which have bpMRI prostate examinations consisting of T2-weighted acquisition and DWI of at least two different b values. Of the 5150 cases, 2170 have been previously reported (9). The inclusion criteria for the study were as follows: (a) patients who were treatment-naive, (b) clear visibility of the prostate gland in the field of view of bpMR images, and (c) acquisition of images using 1.5-T or 3-T axial MRI scans with a body or endorectal coil. The following were the exclusion criteria: (a) cases involving prostatectomy or any scenario where the prostate was partially resected and (b) cases with severe artifacts resulting from implants or motion.
The previous study used only one pair of b values for each case, whereas this study included all qualified b values to investigate their effect on the detection performance. The b values ranging from 0 to 200 sec/mm2 were considered low, and those between 600 and 2000 sec/mm2 were considered high. The ADC images and DW images with a b value of 2000 sec/mm2 were computed based on each pair of low-b-value and high-b-value DW images by performing a nonlinear least-squares fit to the following equation:
For each voxel, the coefficient of b was used as its ADC value (with a scaling factor of 106), and the intensity of B-2000 image was calculated through extrapolation at a b value of 2000 sec/mm2. To maintain consistency and reduce variation in ADC computation, vendor-provided ADC maps were excluded from the study. In this way, each pair of b values from the same case can be considered as a unique sample from a different domain. This yielded a total of 14 191 samples of 34 different combinations of b values from all cases. We categorized all samples into a few subgroups based on the range of b values. The details of each subgroup are shown in Figure 2A.
Figure 2:

Overview of the dataset. The (A) b-value distribution and (B) data split are shown. The left side (pie chart) of (A) shows the sample number and percentage of each group, and the details are shown on the right side. Asterisk denotes the groups excluded from testing because of the limited sample number. In (B), the detailed training data for different methods are marked by different dashed rectangle boxes; best viewed in color. UDA = unsupervised domain adaptation.
A total of 3458 cases were used for training, as shown in Figure 2B. For training the baseline method (ie, the previously reported SL model [24]), the best pair of b values (optimal) was selected and only one single sample from each case was used. PI-RADS guidelines recommend using one low b-value set at 0–100 sec/mm2 (preferably 50–100 sec/mm2) and one intermediate b-value set at 800–1000 sec/mm2 for ADC computations (25). We followed this suggestion and selected the b values that are the closest to 50 and 1000 sec/mm2 as low and high b values, respectively. For other methods (generic model and proposed UDA methods), additional samples with all possible b-value pairs were used, which consisted of 11 763 samples from the same training cases. In the UDA training process, 882 samples whose b values are from the standard domain (low b value of 50 sec/mm2, high b value of 800 sec/mm2) were selected as reference domain data to train the unified generator of UDA methods, and the rest of the data were considered target domain samples. The independent testing set contained 1692 cases with 2428 samples. The results of 2393 samples are reported in this work because of limited sample number for some b-value subgroups, such as groups 10 and 11 in Figure 2A.
All the cases had lesion-based PI-RADS information and voxel-based annotations of the lesion boundaries. The PCa lesion annotations were obtained on the basis of the clinical radiology reports and were carefully reviewed by an expert radiologist (D.W., who has 5 years of experience in radiology and specializes in prostate MRI); the details of annotation process can be viewed in Appendix S1. A positive case was defined as containing lesions with PI-RADS grade 3 or higher.
Image Preprocessing
We adopted the same preprocessing procedures as described elsewhere (14,24). PI-RADS guidelines recommend a high b-value set at 1400 sec/mm2 or greater; similarly, in this study, we recomputed a high b-value image at a fixed b value of 2000 sec/mm2 to ensure a representation in which lesions stand out. The fixed b value was selected to further eliminate the b-value variances among datasets (26). The preprocessing pipeline took raw bpMRI acquisitions and generated well-formatted data volumes for all subsequent synthesis and detection models (Appendix S2).
Algorithm Design
Figure 3 shows the proposed framework, which aims to solve two common practical issues in PCa detection: domain shift and label availability for test data. The proposed framework contains two parts: synthesis and detection. To increase the generalizability of the SL detection network for OOD test samples, generators align the style of DWI B-2000 and ADC test samples from the target domain to the reference domain at the image level. Next, the detection model predicts the PCa heatmap, which uses the concatenation of T2-weighted acquisition, generated ADC, generated DWI B-2000, and prostate mask as inputs. Notably, this entire process operates without the need for test data labels. To more accurately mimic real-world scenarios, we initially trained the detection model and then used the trained model to educate the generators.
Figure 3:

Proposed unsupervised domain adaptation framework for prostate cancer (PCa) detection, which contains two parts: synthesis (top left) and detection (top right). Specifically, the supervised learning model from baseline method (24) is first trained to provide supervision to the generators. In addition, both generators (orange) are identical but with different weights. The dynamic filter (green) is plugged into the generator for multidomain mapping and takes meta-information as input to specify domain information. The bottom left shows the differences between traditional and dynamic filters, and the bottom right provides details of the proposed unified generator. ADC = apparent diffusion coefficient, CONV = convolutional, DWI = diffusion-weighted imaging, MLP = multilayer perceptron, PI-RADS = Prostate Imaging Reporting and Data System.
Detection Network
Our two-dimensional (2D) detection network is a U-Net embedded with residual blocks. This network uses information from the 2D section of T2-weighted acquisition, ADC, DWI B-2000, and prostate mask to generate the corresponding PCa lesion heatmap. Further details of the architecture can be referenced elsewhere (24). In line with those configurations (24), a three-dimensional (3D) heatmap is derived from all sections for each sample, with the nonzero regions considered as lesion candidates. To identify the true-positive and false-positive results, a threshold was used to obtain a set of connected components. The true-positive results were identified if the connected components overlapped on annotations or were less than 5 mm away from the lesion center. Otherwise, such connected components were classified as false positive. Any PCa lesions that lacked corresponding detections were termed false negative.
Synthesis Network and Dynamic Filter
The synthesis models (generators) were adapted from CUT (Contrastive learning for Unpaired image-to-image Translation) (27), which is a U-shaped network. Although the architecture for the DWI B-2000 and ADC generators is identical, they have different parameters (ie, separate networks are trained for the DWI B-2000 and ADC images). Each generator takes a 2D image from the target domain as input and produces a 2D image styled in the reference domain, as illustrated in Figure 3. The discriminator evaluates the performance of the generator during training by distinguishing between generated and real reference domain images. When both the input image and its label were used to train the baseline method, the detection loss was applied to offer supplementary guidance to the generator. To emphasize correct mapping to the reference domain, we used an additional consistency loss (Lconsistency) at the image level to preserve the original information from the input image, especially if its b values aligned with the PI-RADS standard range. Specifically, the mean square error serves as the metric.
Unlike typical UDA methods, which require multiple networks for multidomain mapping, we used only a unified model for each modality. However, the performance of the unified model may be limited in producing robust results between multiple domains due to a lack of domain information. To address this issue, we proposed a dynamic filter as a domain indicator, which aims to increase domain generalizability of the unified model by leveraging meta-information. As shown in Figure 3, the traditional convolutional layer processes feature maps with parameters (θ) that are learned during training. In contrast, the parameters of the dynamic filter are dynamically generated based on different conditions by a scaling layer. Thus, the unified generator could achieve robust multidomain mapping with provided meta-information. Other works use one-hot encoding for the dynamic filter (28–30), which can be complex for large-scale studies with multiple domains. In contrast, we converted low and high b values from meta-information into a 2D tensor, which simplifies the input for the domain controller and preserves original information. As suggested elsewhere (29,31), a filter scaling strategy generates a kernel-wise scale factor, uniformly weighting all parameters instead of individually scaling them. Specifically, the domain controller learns to generate the corresponding filter scaling matrix (M) based on the provided meta-information. Each element in M represents the scale of the corresponding kernel, and the parameters of the dynamic filter are dynamically adjusted through scalar multiplication.
Implementation Details
The training process of the detection model (baseline) is detailed in a previous study (24), and we used binary cross-entropy as detection loss (Ldet). To train the generator, we set the batch size to 96 and used the same loss functions as reported by Park et al (27), which are denoted as LCUT. The total epoch was set to 100. The domain controller is a simple convolutional layer with 7 as kernel size, an input channel of 2, and an output channel of 128, where 64 scaling factors and bias weights are included. The hyperparameters of the generators are the same as reported previously (27). In addition, the loss selections of generators (Lsyn) depend on three scenarios related to the input image: (a) Lsyn = LCUT for unlabeled target domain data, (b) Lsyn = Ldet + LCUT for labeled target domain data, and (c) Lsyn = Ldet + LCUT + Lconsistency for reference domain data. The detailed training process of generator can be viewed in Appendix S3. The training was conducted on NVIDIA A100 GPUs and implemented using PyTorch.
Model Comparisons
We compared our proposed framework with two deep learning methods for PCa lesion detection using multisite bpMRI datasets, which are (a) baseline (a SL pretrained detection model [24]) and (b) a generic model (retrain the baseline method using a larger dataset with various b values). We also reported the results of the ablation study to show the effectiveness of the proposed method in Appendix S6.
Statistical Analysis
The area under the receiver operating characteristic curve (AUC) score was computed as case-level performance, which is the primary end point of this work. The maximum value of the 3D heatmap was defined as the prediction score of the sample to calculate the AUC score. The CI was computed on the basis of a bootstrap approach with 2000 resamples. The statistical results were conducted using Python with NumPy, sklearn, and SciPy libraries. We set a statistical significance threshold of .05. In addition, the free-response receiver operating characteristic (FROC) was used as a metric to evaluate the lesion-level performance as supplementary results. Moreover, peak signal-to-noise ratio, mean square error, and structural similarity index measure were used as metrics to evaluate the image quality of generated images. This requires the same cases to have DW images in both reference domain and other target domains.
To achieve this, we selected all cases from the testing dataset that had six different b values. The DWI B-2000 images were computed using naturally acquired DW images of three different b-value pairs: (50, 800), (150, 1500), and (200, 2000). The proposed method was applied to the B-2000 images computed using b values of (150, 1500) and (200, 2000) to generate new B-2000 images. The original and generated B-2000 images were compared with the corresponding one computed by using (50, 800) b values.
We used t-distributed stochastic neighbor embedding (t-SNE) visualization to assess the effect of the generated ADC and DWI B-2000 images on the detection network. Specifically, we randomly selected 100 samples from the unseen test set with a low b value of 200 sec/mm2 and a high b value of 2000 sec/mm2. These samples served as input for our proposed framework. For the t-SNE visualization, we extracted the feature maps of these selected cases from the bottleneck feature map of the baseline method.
Results
Patient Characteristics
This retrospective study contains 5150 male cases with a median age of 65 years (IQR, 59–70 years), and the detailed patient and imaging characteristics are provided in Table 1.
Table 1:
Patient and Imaging Characteristics

Case-level Performance
Table 2 displays the case-level performance. For both PI-RADS score of 3 or greater and PI-RADS score of 4 or greater, the overall performance of the proposed model was significantly higher (P < .001) compared with other models. The baseline method was effective when test data b values closely matched the training set, primarily in the reference domain (group 4), but did not perform as well with OOD samples, as seen in group 9. Even with diverse b values added to the training data, the generic model failed to differentiate across domains, resulting in unstable performance, especially in the commonly used reference domain. Our UDA method improved the results of the baseline method in all groups when b values deviated from the standard and maintained consistent performance for the reference domain. The detailed results of the statistical analysis are shown in Figure S1. In addition, the overall AUC performance in different zones can be viewed in Table S1.
Table 2:
Case-level Areas Under Receiver Operating Characteristic Curve on Unseen Test Sets

Lesion-level Performance
FROC values representing the false-positive to true-positive ratio are shown in Table 3. The proposed method outperformed the baseline in most domains except for the false-positive rate in group 3 and the true-positive rate in group 7. Figure 4 shows four typical domains with the highest testing samples. For standard b values, the baseline method had higher AUC scores; however, the proposed method demonstrates higher overall performance, particularly when b values diverged from the standard.
Table 3:
Free-Response Receiver Operating Characteristic Results of Baseline and Proposed Methods

Figure 4:

Free-response receiver operating characteristic (FROC) curves of comparative methods. Blue and orange represent the baseline and proposed methods, respectively. The 95% CIs for each are shaded. The selected groups are common actual b-value imaging settings and fall into three categories: near, within, and distant from the standard b-value range.
Quality of Generated Image
The proposed framework was assessed in terms of the image quality of generated DWI B-2000 images through comparison with paired DWI B-2000 images in the reference domain. The peak signal-to-noise ratio, mean square error, and structural similarity index measure results are provided in Table 4. In the analysis of both b-value pairs, the generated images had higher peak signal-to-noise ratio, lower mean square error, and higher structural similarity index measure. The results indicate that the DWI B-2000 images generated by our method are more similar to the reference domain images than the original target domain images.
Table 4:
Image Similarity Comparison of Original and Computed Diffusion-weighted B-2000 Images

Figure 5 displays original bpMR images, generated DW images, and detection heatmaps of four example cases (two positive and two negative). In each group, one case is from the reference domain and one case is from the target domain with b values far from the PI-RADS guideline recommendation. For cases in the reference domain, no obvious changes were observed in the generated images, and the predictions were similar by using original or generated images. For cases not in the reference domain, a substantial improvement in image quality was observed for the generated images. The predictions were also more accurate when compared with the reference standard annotations.
Figure 5:
![Qualitative results of axial plane from four example samples are presented based on their reference standard labels and b values, which are indicated at the top of each column and represented as “low b value, high b value.” The type of image (T2-weighted [T2w] and diffusion-weighted imaging [DWI]) for each sample is labeled on the left side of the figure. Red contours outline the reference standard lesion annotations. All images in the same row are displayed using the same window center and width. ADC = apparent diffusion coefficient.](https://www.ncbi.nlm.nih.gov/core/lw/2.0/html/tileshop_pmc/tileshop_pmc_inline.html?title=Click%20on%20image%20to%20zoom&p=PMC3&id=11449150_ryai.230521.fig5.jpg)
Qualitative results of axial plane from four example samples are presented based on their reference standard labels and b values, which are indicated at the top of each column and represented as “low b value, high b value.” The type of image (T2-weighted [T2w] and diffusion-weighted imaging [DWI]) for each sample is labeled on the left side of the figure. Red contours outline the reference standard lesion annotations. All images in the same row are displayed using the same window center and width. ADC = apparent diffusion coefficient.
t-SNE Visualization
To better visualize the relationship between reference domain images, original target domain images and generated images, we applied the t-SNE algorithm to reduce the bottleneck layer features of the PCa detection network to a 2D representation. For neat visualization, 100 cases whose original DWI acquisitions had a low b value of 200 sec/mm2 and a high b value of 2000 sec/mm2 were selected for this analysis. The original and generated DW images were used as input of the detection network. Another 100 cases from the PROSTATEx Challenge dataset (32) were selected as the reference domain (ie, low b value of 50 sec/mm2 and high b value of 800 sec/mm2) cases for comparison. The 2D plot of the bottleneck layer features is displayed in Figure 6. The generated DW images using the proposed method formed a tighter cluster compared with the original target domain image. Moreover, the generated images aligned more closely with the reference domain data, which indicates a higher similarity in the latent space of the detection network.
Figure 6:
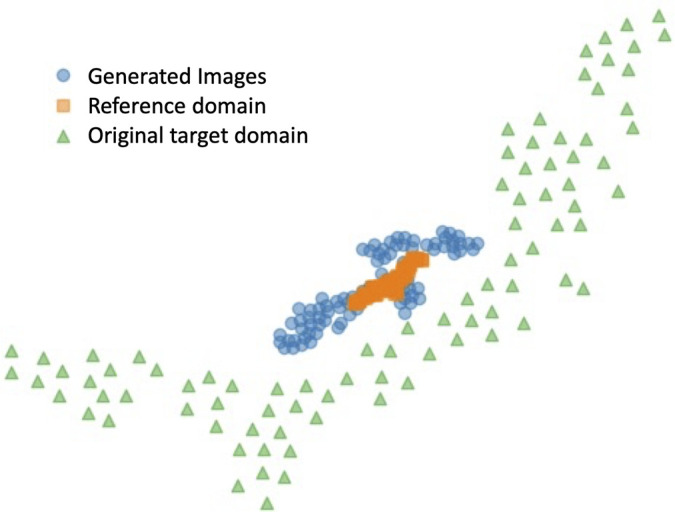
t-Distributed stochastic neighbor embedding visualization based on the feature map of the pretrained detection network at bottleneck layer. Orange squares represent inputs from reference domain images, green triangles denote inputs using original target domain images, and blue dots correspond to inputs of images generated by the proposed method.
Discussion
We proposed a novel UDA method with a unified model to solve practical common issues, specifically domain shift and label availability, for PCa lesion detection. Only a unified model is used in our framework for multidomain mapping instead of multiple networks being trained as in typical UDA methods. To achieve better performance of a unified model in multidomain scenarios, we proposed and used a dynamic filter to leverage domain information. When benchmarked against other methods using a large-scale, multisite dataset comprising 5150 cases (14 191 samples), our approach consistently demonstrated an enhanced capability to perform more accurate PCa detection.
To demonstrate the feasibility for practical use, this study was conducted on a large-scale dataset with different imaging protocols, where the heterogeneous domain shifts are present and pose a challenge to achieve a consistent performance. The proposed method leverages information from the entire dataset, notably unlabeled data, to reduce the annotation effort, which is usually a burden for large datasets. Importantly, the proposed method can seamlessly be integrated into any pretrained PCa detection framework and can be used as an image adapter at the upstream level to reduce discrepancies between domains. The method overall improved the generalizability of downstream PCa detection models. There is no need to retrain or modify the network for new target data, making the method suitable for a variety of medical image applications.
To our knowledge, no previous study has explored the domain shift in PCa detection using ADC and DWI high-b-value images, especially given the various domains in our study. We validated the common practical solutions as part of our experimental contributions. Although such methods are not the optimal solutions, important findings emerged: (a) using the original test image is preferable if its b values closely align with training set, and (b) retraining a generic model could produce unpredictable results because of its broad adaptability and limitations in specific learning. These findings offer valuable insights for future studies, especially those targeting clinical applications.
Several existing studies have tried to address these prevalent practical challenges by producing more consistent DW images. For instance, Winkel et al (9) suggested recalculating ADC maps and high-b-value images at a fixed 2000 sec/mm2 rather than using the originally acquired images. However, this method cannot avoid the diffusion kurtosis effect if the acquired DWI uses a high b value greater than 1500 sec/mm2. The proposed method with an image-to-image technique effectively translates OOD target samples into the style of reference domain. Resulting generated ADC and DWI B-2000 images are similar to the real reference domain image both at image-level and latent-level. The most pronounced improvements occur when the high b value deviates further from the standard range. In addition, when high b values are within the reference domain, our method boosts performance for low b values that are OOD samples. Comprehensive detection results indicate that high b values influence domain discrepancy more than low b values.
In this study, we introduce the dynamic filter, which can be treated as a domain indicator and plugged into any generator to leverage meta-information. The proposed dynamic filter generates conditional parameters according to the corresponding meta-information to differentiate domains. This is unlike encoding meta-information as one-hot vectors, which often requires a codebook to rigidly encode the corresponding relationship. Such an encoding approach might not be ideal for large-scale studies involving multiple domains. Moreover, the codebook would need adjustments whenever a new combination of b values emerges. In contrast, we designed an effective yet straightforward strategy that directly uses b values as input. This not only retains the original meta-information but also simplifies the process, making it adaptable to arbitrary b-value combinations.
Our study had some limitations. Our approach is limited by using only b values from meta-information to provide domain information. This constraint may contribute to suboptimal performance, especially when high b values closely resemble those of the reference domain. It is crucial to acknowledge this limitation while also recognizing the potential expansion of our proposed domain adaptation method to include T2-weighted images in future iterations. Subsequent efforts will involve incorporating additional meta-information, such as field strength, sequence selection, and the number of averages, to more comprehensively quantify domain shifts resulting from diverse acquisition protocols. Another potential contributing factor to the occasional unsatisfactory performance of our proposed method is the restricted number of training samples available for specific b-value settings, as evident in the comparatively lower performance of group 3, comprising only 53 training samples. Future endeavors will concentrate on manifold learning within the latent space of meta-information, offering a continuous representation of b-value variations and enhancing generalizability to unseen b-value settings. Moreover, as our proposed UDA framework demonstrates its feasibility, subsequent work will involve developing additional image synthesis models based on our current approach. A comparative analysis of widely used synthesis models will be a crucial step forward. Recent developments in network architectures, such as nnU-Net and its variants, have proven effective for PCa detection tasks (33,34). The detection network could be redesigned using similar architectures to better adapt to synthesized images, potentially enhancing detection accuracy. As an early-stage study, we observed a significant improvement in overall performance with the proposed method, particularly when the high b value deviates further from the standard range. These improvements indicate that the proposed method may provide higher-quality images and more accurate detection results, facilitating the interpretation time for radiologists, particularly those who are less experienced, and potentially increasing interreader agreement. However, the performance is constrained by the imbalanced cases of b-value distribution, not only between training and test sets for certain groups but also within different groups in the training set. In practice, the test sample from such groups may directly feed into the detection network. Future work will aim to improve the accuracy across diverse data distribution using cost-sensitive learning.
In conclusion, our unified model-based UDA method for PCa detection showed marked improvement compared with the baseline model on a large multisite dataset, especially outside the reference domain. To the best of our knowledge, this is the first large-scale study exploring the impact of b-value properties on ADC and DWI B-2000 images with the aim of improving detection outcomes for a multidomain scenario. It also paves the way for future research, potentially inspiring further studies in this field.
Authors declared no funding for this work.
Disclosures of conflicts of interest: H. Li No relevant relationships. H. Liu No relevant relationships. H.v.B. Employee, Siemens Healthineers; patents planned, issued or pending, US11403750B2 (priority date 2019): Localization and classification of abnormalities in medical images, US20210049761A1 (priority date 2019): Methods and systems for generating surrogate marker based on medical image data; stockholder of Siemens Healthineers and Royal Philips Electronics. R.G. Employee of Siemens Healthineers; shareholder, Siemens Healthineers. H.H. No relevant relationships. A.T. RSNA Research Scholar Grant; signed contract for speaker honorarium for Siemens Innovations 24 Conference (May 2024); research support in the form of hardware and software, Siemens Healthineers. D.W. No relevant relationships. T.P. Grants or contracts, Berlin Institute of Health (Advanced Clinician Scientist Grant, Platform Grant), Ministry of Education and Research (BMBF, 01KX2021 (RACOON), 01KX2121 („NUM 2.0”, RACOON), 68GX21001A, 01ZZ2315D), German Research Foundation (DFG, SFB 1340/2), European Union (H2020, CHAIMELEON: 952172, DIGITAL, EUCAIM:101100633) and research agreements with AGO, Aprea AB, ARCAGY-GINECO, Astellas Pharma Global (APGD), AstraZeneca, Clovis Oncology, Inc, Holaira, Incyte Corporation, Karyopharm, Lion Biotechnologies, Inc, MedImmune, Merck Sharp & Dohme Corp, Millennium Pharmaceuticals, Inc, Morphotec, NovoCure, PharmaMar S.A. and PharmaMar USA, Roche, Siemens Healthineers, and TESARO; fees for a book translation (Elsevier B.V.). I.S. No relevant relationships. M.H.C. Grant from Siemens Healthcare. Q.Y. No relevant relationships. D.S. No relevant relationships. S.S. Research support (personnel, supplies), Siemens Healthineers. F.C. No relevant relationships. M.H. No relevant relationships. I.O. NIH, NSF grants, “Self-Fusion for Medical Images,” Ipek Oguz, Yuankai K. Tao, Joseph D. Malone, Yigit Atay, and Dewei Hu, (U.S. Provisional Patent, converted to copyright in 2022), “Systems and Methods for Navigation and Identification during Endoscopic Surgery,” Ipek Oguz, Zach Stoebner, Ayberk Acar, Daiwei Lu, Jie Ying Wu, Nick Kavoussi, (U.S. Provisional Patent, 2023); Insight (ITK) Software Consortium Board member. D.C. Employed by Siemens Healthineers; stockholder, Siemens Healthineers. A.K. Employee of Siemens Healthineers and this work is initiated, implemented, and results are considered property of Siemens Healthineers; work is patented and assigned to Siemens Healthineers; stockholder, Siemens Healthineers. B.L. Employed by Siemens Healthineers; stockholder, Siemens Healthineers.
Abbreviations:
- ADC
- apparent diffusion coefficient
- AUC
- area under the receiver operating characteristic curve
- bpMRI
- biparametric MRI
- CNN
- convolutional neural network
- DWI
- diffusion-weighted imaging
- FROC
- free-response receiver operating characteristic
- OOD
- out-of-distribution
- PCa
- prostate cancer
- PI-RADS
- Prostate Imaging Reporting and Data System
- SL
- supervised learning
- t-SNE
- t-distributed stochastic neighbor embedding
- 3D
- three-dimensional
- 2D
- two-dimensional
- UDA
- unsupervised domain adaptation
References
- 1. Paschalis A , de Bono JS . Prostate Cancer 2020: “The times they are a’changing” . Cancer Cell 2020. ; 38 ( 1 ): 25 – 27 . [DOI] [PubMed] [Google Scholar]
- 2. Sung H , Ferlay J , Siegel RL , et al . Global Cancer Statistics 2020: GLOBOCAN estimates of incidence and mortality worldwide for 36 cancers in 185 countries . CA Cancer J Clin 2021. ; 71 ( 3 ): 209 – 249 . [DOI] [PubMed] [Google Scholar]
- 3. Ahmed HU , El-Shater Bosaily A , Brown LC , et al. ; PROMIS study group . Diagnostic accuracy of multi-parametric MRI and TRUS biopsy in prostate cancer (PROMIS): a paired validating confirmatory study . Lancet 2017. ; 389 ( 10071 ): 815 – 822 . [DOI] [PubMed] [Google Scholar]
- 4. Eklund M , Jäderling F , Discacciati A , et al. ; STHLM3 consortium . MRI-targeted or standard biopsy in prostate cancer screening . N Engl J Med 2021. ; 385 ( 10 ): 908 – 920 . [DOI] [PubMed] [Google Scholar]
- 5. Kuhl CK , Bruhn R , Krämer N , Nebelung S , Heidenreich A , Schrading S . Abbreviated biparametric prostate MR imaging in men with elevated prostate-specific antigen . Radiology 2017. ; 285 ( 2 ): 493 – 505 . [DOI] [PubMed] [Google Scholar]
- 6. Barth BK , De Visschere PJL , Cornelius A , et al . Detection of clinically significant prostate cancer: short dual-pulse sequence versus standard multiparametric MR imaging-a multireader study . Radiology 2017. ; 284 ( 3 ): 725 – 736 . [DOI] [PMC free article] [PubMed] [Google Scholar]
- 7. Schelb P , Kohl S , Radtke JP , et al . Classification of cancer at prostate MRI: deep learning versus clinical PI-RADS asessment . Radiology 2019. ; 293 ( 3 ): 607 – 617 . [DOI] [PubMed] [Google Scholar]
- 8. Yu X , Lou B , Zhang D , et al . Deep attentive panoptic model for prostate cancer detection using biparametric MRI scans . In: International Conference on Medical Image Computing and Computer-Assisted Intervention 2020. ; 594 – 604 . [Google Scholar]
- 9. Winkel DJ , Tong A , Lou B , et al . A novel deep learning based computer-aided diagnosis system improves the accuracy and efficiency of radiologists in reading biparametric magnetic resonance images of the prostate: results of a multireader, multicase study . Invest Radiol 2021. ; 56 ( 10 ): 605 – 613 . [DOI] [PubMed] [Google Scholar]
- 10. Saha A , Hosseinzadeh M , Huisman H . End-to-end prostate cancer detection in bpMRI via 3D CNNs: effects of attention mechanisms, clinical priori and decoupled false positive reduction . Med Image Anal 2021. ; 73 : 102155 . [DOI] [PubMed] [Google Scholar]
- 11. Duran A , Dussert G , Rouvière O , Jaouen T , Jodoin PM , Lartizien C . ProstAttention-Net: a deep attention model for prostate cancer segmentation by aggressiveness in MRI scans . Med Image Anal 2022. ; 77 : 102347 . [DOI] [PubMed] [Google Scholar]
- 12. Turkbey B , Rosenkrantz AB , Haider MA , et al . Prostate Imaging Reporting and Data System Version 2.1: 2019 update of Prostate Imaging Reporting and Data System Version 2 . Eur Urol 2019. ; 76 ( 3 ): 340 – 351 . [DOI] [PubMed] [Google Scholar]
- 13. Guan H , Liu M . Domain adaptation for medical image analysis: a survey . IEEE Trans Biomed Eng 2022. ; 69 ( 3 ): 1173 – 1185 . [DOI] [PMC free article] [PubMed] [Google Scholar]
- 14. Liu J , Lou B , Diallo M , et al . Detecting out-of-distribution via an unsupervised uncertainty estimation for prostate cancer diagnosis . The 5th International Conference on Medical Imaging with Deep Learning . https://proceedings.mlr.press/v172/liu22a/liu22a.pdf. Published 2022. Accessed November 2023 . [Google Scholar]
- 15. DeSilvio T , Moroianu S , Bhattacharya I , Seetharaman A , Sonn G , Rusu M . Intensity normalization of prostate MRIs using conditional generative adversarial networks for cancer detection . Proc SPIE Int Soc Opt Eng 2021. ; 11597 : 115970J 6 . [Google Scholar]
- 16. Hu L , Zhou DW , Fu CX , et al . Calculation of apparent diffusion coefficients in prostate cancer using deep learning algorithms: a pilot study . Front Oncol 2021. ; 11 : 697721 . [DOI] [PMC free article] [PubMed] [Google Scholar]
- 17. Hu L , Zhou DW , Zha YF , et al . Synthesizing high-b-value diffusion-weighted imaging of the prostate using generative adversarial networks . Radiol Artif Intell 2021. ; 3 ( 5 ): e200237 . [DOI] [PMC free article] [PubMed] [Google Scholar]
- 18. Grebenisan A , Sedghi A , Izard J , Siemens R , Menard A , Mousavi P . Spatial decomposition for robust domain adaptation in prostate cancer detection . IEEE 18th International Symposium on Biomedical Imaging , April 2021 . [Google Scholar]
- 19. Cai J , Zhang Z , Cui L , Zheng Y , Yang L . Towards cross-modal organ translation and segmentation: A cycle- and shape-consistent generative adversarial network . Med Image Anal 2019. ; 52 : 174 – 184 . [DOI] [PubMed] [Google Scholar]
- 20. Huo Y , Xu Z , Moon H , et al . Synseg-net: Synthetic segmentation without target modality ground truth . IEEE Trans Med Imaging 2018. ; 38 ( 4 ): 1016 – 1025 . [DOI] [PMC free article] [PubMed] [Google Scholar]
- 21. Chen C , Dou Q , Chen H , Qin J , Heng PA . Unsupervised bidirectional cross-modality adaptation via deeply synergistic image and feature alignment for medical image segmentation . IEEE Trans Med Imaging 2020. ; 39 ( 7 ): 2494 – 2505 . [DOI] [PubMed] [Google Scholar]
- 22. Li H , Hu D , Zhu Q , Larson K , Zhang H , Oguz I . Unsupervised cross-modality domain adaptation for segmenting vestibular schwannoma and cochlea with data augmentation and model ensemble . In: Crimi A , Bakas S (eds). Brainlesion: Glioma, Multiple Sclerosis, Stroke and Traumatic Brain Injuries . BrainLes 2021. Lecture Notes in Computer Science , vol 12963 . Springer; , Cham: : 2021. . [Google Scholar]
- 23. Chiou E , Giganti F , Punwani S , Kokkinos I , Panagiotaki E . Unsupervised domain adaptation with semantic consistency across heterogeneous modalities for mri prostate lesion segmentation . arXiv 2109.09736 [preprint] https://arxiv.org/abs/2109.09736. Posted September 19, 2021. Accessed November 2023 .
- 24. Yu X , Lou B , Shi B , et al . False positive reduction using multiscale contextual features for prostate cancer detection in multi-parametric MRI scans . 2020 IEEE 17th International Symposium on Biomedical Imaging (ISBI) , Iowa City, IA : 1355 – 1359 . [Google Scholar]
- 25. Weinreb JC , Barentsz JO , Choyke PL , et al . PI-RADS Prostate Imaging - Reporting and Data System: 2015, version 2 . Eur Urol 2016. ; 69 ( 1 ): 16 – 40 . [DOI] [PMC free article] [PubMed] [Google Scholar]
- 26. Rosenkrantz AB , Parikh N , Kierans AS , et al . Prostate cancer detection using computed very high b-value diffusion-weighted imaging: how high should we go? Acad Radiol 2016. ; 23 ( 6 ): 704 – 711 . [DOI] [PubMed] [Google Scholar]
- 27. Park T , Efros A , Zhang R , Zhu J . Contrastive learning for unpaired image-to-image translation . In: Vedaldi A , Bischof H , Brox T , Frahm JM (eds). Computer Vision – ECCV 2020. ECCV 2020 . Lecture Notes in Computer Science , vol 12354 . Springer; , Cham: . [Google Scholar]
- 28. Yang H , Sun J , Yang L , Xu Z . A unified hyper-GAN model for unpaired multi-contrast MR image translation . In: de Bruijne M , et al . Medical Image Computing and Computer Assisted Intervention – MICCAI 2021. MICCAI 2021 . Lecture Notes in Computer Science , vol 12903 . Springer; , Cham: . [Google Scholar]
- 29. Liu H , Fan Y , Li H , et al . ModDrop++: a dynamic filter network with intra-subject co-training for multiple sclerosis lesion segmentation with missing modalities . In: Wang L , Dou Q , Fletcher PT , Speidel S , Li S (eds). Medical Image Computing and Computer Assisted Intervention – MICCAI 2022. MICCAI 2022 . Lecture Notes in Computer Science , vol 13435 . Springer; , Cham: . [Google Scholar]
- 30. Zhao Z , Yang H , Sun J . Modality-adaptive feature interaction for brain tumor segmentation with missing modalities . In: Wang L , Dou Q , Fletcher PT , Speidel S , Li S (eds). Medical Image Computing and Computer Assisted Intervention – MICCAI 2022. MICCAI 2022 . Lecture Notes in Computer Science , vol 13435 . Springer; , Cham: . [Google Scholar]
- 31.Alharbi Y, Smith N, Wonka P. Latent filter scaling for multimodal unsupervised image-to-image translation. 2019 IEEE/CVF Conference on Computer Vision and Pattern Recognition (CVPR), Long Beach, CA: 1458–1466. [Google Scholar]
- 32. Litjens G , Debats O , Barentsz J , Karssemeijer N , Huisman H . Computer-aided detection of prostate cancer in MRI . IEEE Trans Med Imaging 2014. ; 33 ( 5 ): 1083 – 1092 . [DOI] [PubMed] [Google Scholar]
- 33. Isensee F , Jaeger PF , Kohl SAA , Petersen J , Maier-Hein KH . nnU-Net: a self-configuring method for deep learning-based biomedical image segmentation . Nat Methods 2021. ; 18 ( 2 ): 203 – 211 . [DOI] [PubMed] [Google Scholar]
- 34. Bosma JS , Saha A , Hosseinzadeh M , Slootweg I , de Rooij M , Huisman H . Semisupervised learning with report-guided pseudo labels for deep learning-based prostate cancer detection using biparametric MRI . Radiol Artif Intell 2023. ; 5 ( 5 ): e230031 . [DOI] [PMC free article] [PubMed] [Google Scholar]