

Abstract
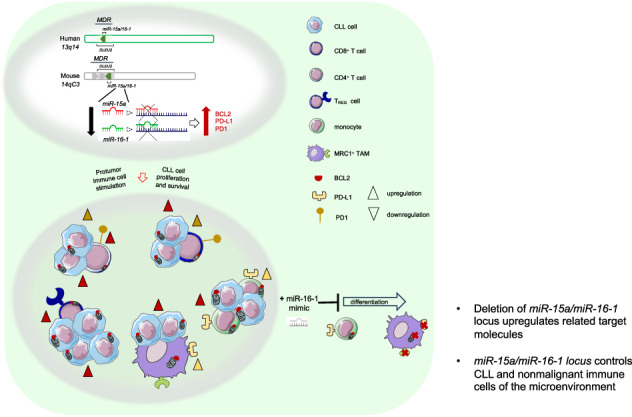
The development and progression of chronic lymphocytic leukemia (CLL) depend on genetic abnormalities and on the immunosuppressive microenvironment. We have explored the possibility that genetic drivers might be responsible for the immune cell dysregulation that shapes the protumor microenvironment. We performed a transcriptome analysis of coding and non-coding RNAs (ncRNAs) during leukemia progression in the Rag2−/−γc−/− MEC1-based xenotransplantation model. The DLEU2/miR-16 locus was found downmodulated in monocytes/macrophages of leukemic mice. To validate the role of this cluster in the tumor immune microenvironment, we generated a mouse model that simultaneously mimics the overexpression of hTCL1 and the germline deletion of the minimal deleted region (MDR) encoding the DLEU2/miR-15a/miR-16-1 cluster. This model provides an innovative and faster CLL system where monocyte differentiation and macrophage polarization are exacerbated, and T-cells are dysfunctional. MDR deletion inversely correlates with the levels of predicted target proteins including BCL2 and PD1/PD-L1 on murine CLL cells and immune cells. The inverse correlation of miR-15a/miR-16-1 with target proteins has been confirmed on patient-derived immune cells. Forced expression of miR-16-1 interferes with monocyte differentiation into tumor-associated macrophages, indicating that selected ncRNAs drive the protumor phenotype of non-malignant immune cells.
Subject terms: Tumour immunology, Translational research
Introduction
Chronic lymphocytic leukemia (CLL) is a B-cell malignancy characterized by the expansion of CD5+ B cells. Its heterogeneous clinical course reflects differences in the biology of the disease, particularly chromosomal alterations [1]. The most frequent chromosomal aberration is 13q deletion; 55% of patients with CLL carry this deletion and have the longest survival. Besides chromosomal aberrations, other crucial features of CLL include recurrent mutations, microRNA (miRNA) dysregulation and microenvironmental involvement [2, 3].
miR-15a/miR-16-1 are on the same gene cluster that maps the human chromosome 13q14 region that encodes for several genes highly conserved in human and mice. The minimal deleted region (MDR) includes the DLEU2 long non-coding RNA (ncRNA), and the miR-15a/miR-16-1 cluster. Mutations interfering with the normal expression of miR-15a/miR-16-1 have been observed in patients with CLL [4], as well as in the NZB strain of mice that develop a CLL-like disease at old age [5].
To recapitulate the 13q14 deletion, a transgenic mouse model carrying the deletion of the MDR was developed [6]. Mice with the germline deletion of the MDR develop lymphoproliferations with low penetrance (50% develop CLL) and have indolent disease. Overall, the genetic inactivation of miR-15a/miR-16-1 in mice has provided conclusive evidence of a tumor-suppressor role of these miRNAs in CLL pathogenesis [7]. miR-15a/miR-16-1 exerts tumor-suppression function by targeting bcl-2 oncogene on CLL cells [4, 8, 9].
BCL2 has a multifunctional role beyond oncogenesis; several studies in murine models have reported its involvement in the development and function of the immune system [10]. T cells begin to express BCL2 when they reach the single-positive stage, and BCL2 over-expression enhances the survival of T cells [11, 12]. Interestingly, bcl2−/− mice have impaired immune system development; the loss of white pulp lymphoid tissue is the most remarkable abnormality observed in their spleens. Both B and T cell lineages are deleted by massive episodes of apoptosis that occur at various ages in bcl-2−/− mice [13]. The mechanism of regulation for the BCL2 family proteins includes several points of transcriptional and post-transcriptional control, including transcriptional regulation via transcription factors, miRNAs and alternative splicing. It is known that the prolonged survival of leukemic CLL cells is associated with defective apoptosis that triggers the nuclear factor kappa B (NF-kB) and phosphoinositide 3-kinase (PI3K)/AKT pathways. These pathways are constitutively activated in CLL and promote the overexpression of BCL2 family proteins that have become successful targets in the treatment of CLL with the development and approval of BCL2 targeting agents [14] (i.e. venetoclax). Given the broad expression of BCL2, it is known that the drug can also have an impact on the non-malignant tumor immune microenvironment (TIME) [15].
The TIME of CLL is particularly populated by T cells, natural killer (NK) cells, monocytes, macrophages, and myeloid-derived suppressor cells (MDSCs) that provide critical survival signals to malignant cells and suppress natural immunosurveillance [16]. Alterations of the T cell repertoire start at early stage and worsen during disease progression with functional impairment and exhaustion of memory T cells and expansion of CD4+ regulatory T cells. The monocyte cell count is often increased in patients with CLL with subset skewing toward CD14+ CD16+ monocytes with protumor macrophage differentiation capacity.
The molecular mechanisms responsible for the protumor function of selected immunosuppressive cells are poorly investigated, as is the impact of currently used targeted therapies on the immune system of patients. Besides miR-15a/miR-16-1’s well-known tumor suppressor function targeting BCL2 molecule on tumor cells [9], in mice there is evidence that BCL2-expressing monocytes can be forced to undergo macrophage differentiation [17]. In addition, it is known that miR-16-1 regulates macrophage pro-tumor polarization through the critical immune suppressor PD-L1 [18].
The purpose of this study was to investigate the molecular profile and immunophenotype of human and mouse immune cells exposed to CLL cells and to investigate genetic drivers of protumor immune dysregulation. We focused on the DLEU2/miR-15a/miR-16-1 cluster and its target proteins. Our results are the first to demonstrate in mouse models and patients with CLL the involvement of this gene cluster in the protumor function of non-malignant immune cells.
Materials and Methods
Primary Cells
Human primary samples were obtained from patients with CLL (all Rai stages) referred to the Leukemia Department at The University of Texas MD Anderson Cancer Center with the approval of MD Anderson’s Institutional Review Board (protocol LAB04-0678; NCT02756897 phase 2 trial [15]) and, in accordance with the Declaration of Helsinki. Written informed consent was obtained from the donors. The clinical and biological features of the patients analyzed are described in Tables S1 and S2. All the patients were either untreated or OFF therapy for at least 8 months before the beginning of the study. Frozen human peripheral blood mononuclear cells (PBMCs) from healthy donors (50–59 years old, 3 females and 3 males) were purchased from STEMCELL Technologies (Vancouver, Canada).
Mice
All mice were housed and bred in specific pathogen-free animal facilities at IRCCS San Raffaele Hospital and MD Anderson Cancer Center. Depending on the animal experiment, mice were treated in accordance with European Union guidelines and with the approval of the IRCCS San Raffaele Hospital’s Institutional Ethical Committee (protocols 601 and 726) or with the approval of the Institutional Animal Care and Use Committee of MD Anderson Cancer Center (protocol 00001627-RN02) and conducted in accordance with the Animal Welfare Act, the Guide for the Care and Use of Laboratory Animals, and the Public Health Service (PHS) Policy. For detailed information on immunocompetent mice and related genotype, xenograft and TCL1-related transplantation studies see the Supplementary Materials and Methods.
Gene expression profiling analysis
hCD19- cells from murine bone marrow (BM) of Rag2−/−γc−/− mice xeno-transplanted with MEC1 cells were secondarily enriched for monocytes/macrophages by depletion of T, NK, dendritic cells, progenitors, granulocytes and red blood cells using the Easysep negative selection monocyte enrichment kit on an EasySep Magnet (STEMCELL Technologies, Vancouver, Canada), following the manufacturer’s instructions. RNA extraction was performed using a RNeasy Mini Kit (QIAGEN, Hilden, Germany). For detailed microarray procedures and analysis, see the Supplementary Materials and Methods.
Murine cell preparations and flow cytometry
Peripheral blood (PB), spleen (SP), and femurs were collected from mice, and cells were isolated. Erythrocytes from bone marrow (BM), SP and PB samples were lysed by incubation in ammonium chloride solution (ACK) lysis buffer (NH4Cl 0.15 M, KHCO3 10 mM, Na2/ethylenediaminetetraacetic acid 0.1 mM, pH 7.2–7.4) for 5 min at room temperature. After blocking of fragment crystallizable (Fc) receptors with Fc block (BD Biosciences, San Jose, CA, USA) for 10 min at room temperature, cells from PB, BM and SP were stained with the antibodies (15 min. at 4 °C) listed in Supplementary Tables S3-4. Cells were analyzed with a BD LSRFortessa X-20 flow cytometer and data analyzed with FCS Express 6 Flow-Cytometry software. Absolute cell numbers were obtained by multiplying the percentage of the cells by the total number of splenocytes, mesenteric lymph nodes, peritoneal cells, and BM cells flushed from 1 femur and tibiae.
Reverse-phase protein array (RPPA) assay
Functional proteomics reverse phase protein array (RPPA) was performed at the Functional Proteomics Reverse Phase Protein Array Core Facility at MD Anderson. Details are described in the Supplementary Materials and Methods.
Human cell flow cytometry and cell sorting
After blood withdrawal, flow cytometry phenotype analysis and fluorescence-activated cell sorting of human live myeloid cells and of human live lymphoid cells were performed using LSRFortessa X-20 and BD FACS Aria II (BD Biosciences) instruments, respectively. Flow cytometry data were analyzed with FCS Express 6 Flow Cytometry software. Methodologies and antibodies are described in the Supplementary Materials and Methods and Tables S5-7.
Statistical analysis
The statistical analysis of the data was performed using the GraphPad Prism 9.0 Software. For detailed description of statistical analysis, including microarray and RPPA analysis, see the Supplementary Materials and Methods.
Results
Transcriptome analysis of myeloid cells exposed to leukemic cells in a CLL-xenograft system
Immune cells of the myeloid lineage and CLL cells support each other during leukemia progression and dissemination [19]. We have investigated the molecular interactions supporting this cell-cell interdependence with a special focus on ncRNAs, whose role in non-malignant immune cells is largely unknown.
We used a mouse Affymetrix Clariom D assay and Transcriptome Analysis Console (TAC) 3.0 software to perform a broad transcriptome-gene- and exon-level analysis of coding and ncRNA isoforms in different stages of leukemia (day 21, early stage; day 31, late stage leukemia) in Rag2−/−γc−/− mice xeno-transplanted with MEC1 cells (Fig. S1A). As shown in Fig. S1B, we found a significant enrichment of both upregulated and downregulated ncRNAs. MiRNAs miR-511-3p, miR-181c, miR-9-2 and the long ncRNAs (lncRNAs) HOX transcript antisense RNA 4 (HOTAIR 4) and HOX antisense intergenic RNA myeloid 1 (HOTAIRM1) were found upregulated in murine myeloid cells during leukemia progression (Table S8). ROCK2, a direct target of miR-511-3p [20], and DLEU2/miR-16-1, which are on the same gene cluster that maps the human chromosome 13q14 region, were found downmodulated in murine myeloid cells during leukemia progression (Table S9). Although the deletion of 13q14 is the most frequent genetic lesion in CLL cells, miR-15a/miR-16-1-mediated regulation of non-malignant myeloid cells has not been characterized. The MDR includes the first exon of the DLEU1 ncRNA, the deleted in leukemia (DLEU) 2 gene, encoding for a primary transcript, and the miR-15a/miR-16-1 cluster, which is located in an intron of DLEU2. We previously reported that DLEU2 transcript is downregulated in myeloid cells isolated from the BM of MEC1-xenotransplanted mice at early stage of leukemia development compared with myeloid cells from age-matched, wild-type (WT), untransplanted mice [19]. Other groups have found that miR-16-1 regulates macrophage protumor activation and polarization through the critical immune suppressor molecule PD-L1 [18, 21]. Recent findings have also demonstrated that myeloid cells are required for PD1/PD-L1 checkpoint activation [22] and that PD-L1 expression can be induced in protumor and immunosuppressive cell types of the myeloid lineage [23].
Our findings corroborate the hypothesis that DLEU2/miR-15a/miR-16-1 has a role in the protumor function of myeloid cells during leukemia progression.
The TCL1+/−MDR−/− mouse model of CLL
We used the mice with the germline deletion of the MDR (MDR−/−) [6] to further explore the hypothesis that DLEU2/miR-15a/miR-16-1 affects the protumor function of non-malignant myeloid and lymphoid cells during leukemia progression. MDR−/− mice were crossed with Eμ-TCL1 transgenic (tg) mice [24]. TCL1+/−, TCL1+/−MDR−/− (TM), MDR−/− and WT mice were developed, and we first analyzed their survival. The MDR deletion significantly shortened the life spans of the mice (Fig. 1A), thus offering a more rapid and reliable model of CLL development. We then characterized 4- and 9-month-old TCL1+/−, TCL1+/−MDR−/−, MDR−/− and WT mice (n = 6–10 mice/group). By using multi-color flow cytometry, we have analyzed the accumulation of CD19+CD5+ leukemic cells and key molecules (e.g., BCL2) potentially involved in the miR-15a/miR-16-1-mediated control of cell proliferation and differentiation. An increase of CD19+CD5+ leukemic cells in the spleen (SP) of 4-month-old TCL1+/−MDR−/− mice correlated with the upregulation of BCL2 (Fig. 1B, C). The splenic CD19+CD5+ leukemic expansion and BCL2 upregulation were exacerbated in 9-month-old TCL1+/−MDR−/− mice (Fig. 1D, E). The same trend was observed in the peripheral blood (PB) and bone marrow (BM), but it did not reach statistical significance due to the heterogeneity of the mice (Fig. S2A–H).
Fig. 1. Premature CLL-like expansion and shorter life span in TCL1 transgenic mice with MDR deletion.

A Kaplan–Meier survival curves for TCL1+/− (n = 51), TCL1+/−MDR−/− (TM; n = 20), MDR−/−(n = 18) and wild-type (WT; n = 17) mice. A statistical analysis of the groups was performed using the log-rank test (median survival: 10 months for TM, 13 months for TCL1+/−, 17 months for MDR−/−, 24 months for WT mice). Mice were included in the analysis after spontaneous death or after they had been killed because of symptoms of illness. B, C Using flow cytometry, 4-month-old TM mice (n = 7), age-matched TCL1+/− (n = 6), MDR−/− (n = 6) and WT control (n = 6) mice were analyzed for the accumulation of CD19+ CD5+ B cells in the spleen. B The mean values ± the standard deviations (SDs) of the absolute numbers of CD19+ CD5+ cells gated on CD19+ cells and (C) the mean values ± SDs of the absolute numbers of CD19+ BCL2+ cells gated on CD19+ CD5+ cells are shown in the graphs. A statistical analysis was performed using the Student t test *P < 0.05, **P < 0.01. D, E Using flow cytometry, 9-month-old TM (n = 9), age-matched TCL1+/− (n = 10), MDR−/− (n = 10), WT control (n = 7) mice and, 27-month-old MDR−/− (n = 3) were analyzed for the accumulation of CD19+ CD5+ B cells in the spleen. D The mean values ± SDs of the absolute numbers of CD19+ CD5+ cells gated on CD19+ cells and (E) the mean values ± SDs of the absolute numbers of CD19+ BCL2+ cells gated on CD19+ CD5+ cells are shown in the graphs. A statistical analysis was performed using the Student’s t test *P < 0.05, **P < 0.01. F–H B cells were purified from the spleen of 9-month-old TM, TCL1+/− and MDR−/− mice using magnetic negative selection. Lysates were processed for the reverse phase protein Array (RPPA). The heatmaps of unsupervised hierarchical clustering display differentially expressed proteins between (F) leukemic cells from TCL1+/− (n = 3) and MDR−/− (n = 6) mice, (G) leukemic cells from TM (n = 3) and MDR−/− (n = 6) mice, and (H) leukemic cells from TM (n = 3) and TCL1+/− (n = 3) mice.
To examine the proteomic profile of the leukemic cells purified from the spleen of leukemic TCL1+/−MDR−/− mice compared to TCL1+/− and to MDR−/− mice, we used the RPPA high-throughput technology (Fig. 1F–H). We found that several components of the BCR and PI3K/AKT signaling pathways (e.g., PKCa, Lyn, ERK1/2, JNK2) [25] were upregulated in the TCL1+/− compared with the MDR−/− mice (Fig. 1F). The same signaling pathways were found activated in the TCL1+/−MDR−/− mice compared to MDR−/− mice including the downstream upregulation of the anti-apoptotic protein MCL1, a well-known target of miR-15a/miR-16-1 [9] (Fig. 1G). Of note, serum- and glucocorticoid-inducible protein kinase 3 (SGK3) was upregulated in the splenic CLL cells of TCL1+/−MDR−/− mice compared with TCL1+/− and MDR−/− mice (Fig. 1G, H). SGK3, also known as cytokine-independent survival kinase, is a well-known downstream mediator of PI3K oncogenic signaling in various cancers, including breast cancer and ovarian cancer [26, 27]. SGK3 is involved in cell proliferation, growth, survival, and migration and is considered an intriguing target for anticancer drug development [28, 29].
Overall, we have generated a faster CLL mouse model with two known pro-tumorigenic genes, the hTCL1 oncogene and the MDR tumor-suppressor, in the context of a murine immunocompetent microenvironment.
Characterization of the immune cells in the TCL1+/−MDR−/− mouse model
To investigate the involvement of miR-15a/miR-16-1 in the protumor function of myeloid and lymphoid non-malignant cells in the leukemic microenvironment during leukemia progression, we examined the lymphoid and myeloid cell populations including lymphocytes, monocytes, macrophages, and monocytic-myeloid derived suppressor cells (M-MDSCs) in the circulation and lymphoid tissues of TCL1+/−MDR−/− and age-matched control mice. We analyzed key molecules potentially involved in the miR-16-1-mediated control of myeloid cell proliferation and differentiation (e.g., BCL2 and checkpoint molecules PD-1 and PD-L1) in 4- and 9-month-old mice. In the spleen of 4-month-old mice, we observed an altered composition of the T lymphocyte population and of the CD4:CD8 T cell ratio (Fig. 2A) and found a significant increase of the whole pool of CD8+ T cells and of CD8+ and CD4+ memory T cells expressing BCL2 in TCL1+/−MDR−/− and MDR−/− mice compared with TCL1+/− and WT mice (Fig. 2B–E). Furthermore, we found high numbers of PD1+ CD4+ effector memory (TEM) T cells (Fig. 2F) and an increase of potentially regulatory CD4+ CD25+ T cells expressing BCL2 in TCL1+/−MDR−/− compared with TCL1+/− mice (Fig. 2G, H). This aberrant T cell composition was associated with the significant increase of Ly6Clow monocytes in the circulation, BM, and SP of the 4-month old TCL1+/−MDR−/− mice (Fig. 3A–G). Ly6Clow monocytes differentiate into protumor-associated macrophages (TAMs) [30]. Of note, in the SP, we found high frequency of protumor TAMs expressing MRC1, BCL2 and PD-L1 (Fig. 3H–J). These findings demonstrate that the deletion of the DLEU2/miR-15a/miR-16-1 cluster impacts the myeloid and lymphoid cell compartment at early stage of leukemia development.
Fig. 2. Characterization of the T-cell compartment of young TCL1 transgenic mice with MDR deletion.

A–H The splenic T-cell compartment of 4-month-old TCL1+/−MDR−/− (TM; n = 7), age-matched TCL1+/−(n = 6), MDR−/− (n = 6), and wild-type (WT) control (n = 6) mice was analyzed using flow cytometry. A The mean values ± the standard deviations (SD) of the absolute numbers of CD4+ and CD8+ T cells, (B) the mean values ± SD of the absolute numbers of CD44−CD62L+ naïve, CD44+CD62Llow/neg effector and CD44+CD62L+ central memory CD8+ T cells and, (C) the mean value ± SDs of the absolute numbers of CD44-CD62L+ naïve, CD44+CD62Llow/neg effector and CD44+CD62L+ central memory CD8+ T cells expressing BCL2 are shown in graphs. D The mean value ± SDs of the absolute numbers of CD44−CD62L+ naïve, CD44+CD62Llow/neg effector and CD44+CD62L+ central memory CD4+ T cells, (E) the mean value ± SD of the absolute number of CD44−CD62L+ naïve, CD44+CD62Llow/neg effector and CD44+CD62L+ central memory CD4+ T cells expressing BCL2 or (F) PD1 are shown in graphs. G The mean value ± SD of the absolute number of CD4+CD25+ T cells and (H) CD4+CD25+BCL2+ T cells are shown in graphs. A statistical analysis was performed using the Student’s t test *P < 0.05, **P < 0.01, ***P < 0.001.
Fig. 3. Characterization of the monocytes and macrophages of young TCL1 transgenic mice with MDR deletion.

A–H Monocytes and macrophages of 4-month-old TCL1+/−MDR−/− (TM; n = 7), age-matched TCL1+/−(n = 6), MDR−/− (n = 6) and WT control (n = 6) mice were analyzed using flow cytometry. A The mean value of the relative contributions of CD11b+ CSF1R+ cells gated on CD45 in peripheral blood (PB) is shown in the graph. B The mean values of the absolute numbers of CD11b+ CSF1R+ cells gated on CD45 in BM and (C) SP are shown in the graphs. D The mean values of the absolute numbers of CD11b+ CSF1R+ BCL2+ monocytes is shown in graph. E The mean value of the relative contributions of CD11b+ Ly6Clow and CD11b+ Ly6Chigh cells to the whole monocyte subset (CD11b+ CSF1R+) gated on CD45+ in the PB is shown in the graph. F The mean values of the absolute numbers of CD11b+ Ly6Clow and CD11b+ Ly6Chigh cells to the whole monocyte subset (CD11b+ CSF1R+) gated on CD45+ in the BM and (G) SP are shown in the graphs. H The mean values of the absolute numbers of CD11b+ F4/80+ cells gated on CD45+ in the SP is shown in the graph. I The mean values of the absolute number of CD11b+ F4/80+ MRC1+ cells, (J) CD11b+ F4/80+ BCL2+ and CD11b+ F4/80+ PD-L1+ gated on CD45+ in the SP are shown in the graphs. A statistical analysis was performed using the Student’s t test *P < 0.05.
In 9-month-old mice, we confirmed an altered CD4:CD8 T-cell ratio in the circulation of TCL1+/−MDR−/− and MDR−/− mice with a significant increase of CD8+ effector memory TEM cells and of CD8+ central memory TCM expressing PD-1 in the SP (Fig. 4A–D). A small cohort of 27-month-old MDR−/− was included in the study to rule out the possibility of age-related effects in the mice with the germline deletion.
Fig. 4. Characterization of the T cell compartment of leukemic TCL1 transgenic mice with MDR deletion.

A–D The splenic T-cell compartment of 9-month-old TCL1+/−MDR−/− (TM; n = 9), age-matched TCL1+/− (n = 10), MDR−/− (n = 10), WT control (n = 7) mice and 27-month-old MDR−/− (n = 3) was analyzed using flow cytometry. A The relative contributions ± SD of the of the CD4+ and CD8+ T cells in the PB, (B) the mean values ± SDs of the absolute numbers of CD4+ and CD8+ T cells in the SP, (C) the mean values ± SDs of the absolute numbers of CD44-CD62L+ naïve, CD44+CD62Llow/neg effector and CD44+CD62L+ central memory CD8+ T cells and, (D) the mean values ± SDs of the absolute numbers of CD44−CD62L+ naïve, CD44+CD62Llow/neg effector and CD44+CD62L+ central memory CD8+ T cells expressing PD1 are shown in the graphs. A statistical analysis was performed using the Student’s t test *P < 0.05, **P < 0.01, ***P < 0.001.
In addition, an increase in CD19+CD5+ leukemic cells was associated with an increased number of BCL2-expressing monocytes in the (PB), BM and SP (Fig. 5A–F); increased numbers of PD-L1 expressing monocytes in the PB and BM (Fig. 5G, H); and an increased percentage of protumor F4/80+ MRC1+ macrophages in the PB (Fig. 5I, J) and SP (Fig. S3).
Fig. 5. Characterization of monocytes and macrophages of leukemic TCL1 transgenic mice with MDR deletion.

A–H The monocytes and macrophages of 9-month-old TCL1+/−MDR−/− (TM; n = 9), age-matched TCL1+/− (n = 10), MDR−/− (n = 10), WT control (n = 7) mice and 27-month-old MDR−/− (n = 3) were analyzed using flow cytometry. A The mean values ± SDs of the relative contributions of CD11b+ CSF1R+ cells gated on CD45 in PB is shown in the graph. B The mean values ± SDs of the absolute numbers of CD11b+ CSF1R+ cells gated on CD45 in BM and (C) SP are shown in the graphs. D The mean values ± SDs of relative contributions of CD11b+ CSF1R+ BCL2+ monocytes in PB is shown in the graph. E The mean values ± SDs of the absolute numbers of CD11b+ CSF1R+ BCL2+ monocytes in BM and (F) SP are shown in the graphs. G The mean values ± SDs of relative contributions of CD11b+ CSF1R+ PDL1+ monocytes in PB is shown in the graph. H The mean values ± SDs of the absolute numbers of CD11b+ CSF1R+ PDL1+ monocytes in BM is shown in the graph. I The mean values ± SDs of the relative contributions of CD11b+ F4/80+ cells gated on CD45+ in the PB is shown in the graph. J The mean values ± SDs of the relative contributions of CD11b+ F4/80+ MRC1+ cells gated on CD45+ in the PB is shown in the graph. A statistical analysis was performed using the Student’s t test *P < 0.05, **P < 0.01, ***P < 0.001.
To finally demonstrate the cell-autonomous, pro-leukemic activity of monocytes from 13q14 MDR−/− mice, we used a TCL1 tg transplantation system where we transplanted leukemic cells obtained from the SP of an Eμ-TCL1 tg mouse into syngeneic, immunocompetent recipients. At day 84 post-transplantation, mice were injected intravenously (i.v.) with monocytes purified from the BM of MDR−/− mice. Seven days later, they were killed. As shown in Fig. 6A–F, a significantly higher frequency of CD19+ CD5+ leukemic cells was observed in the spleen of mice adoptively transferred with MDR−/−-derived monocytes that was accompanied by an increased spleen weight.
Fig. 6. Pro-tumor function of monocytes and macrophages from MDR−/− mice in the TCL1 transgenic transplantation system.

A C57BL/6 mice intraperitoneally (i.p.) transplanted with leukemic B cells from a Eµ-TCL1 transgenic mouse donor, were left untreated (n = 3, red squares) or adoptively transferred (AT, day +84) with monocytes/macrophages purified from the BM of MDR−/− mice (n = 3, empty red squares). Mice were killed on day 91 and were analyzed using flow cytometry. B The mean values ± SD of the relative contributions of CD19+ CD5+ cells to the whole B cell pool at day 84 and (C) day 91 in the PB of mice are shown in the graphs. D The mean values ± SDs of the absolute number of CD19+ CD5+ cells gated on CD19+ in BM and (E) SP are shown in the graphs. F The spleen weights of untreated and adoptively transferred mice are shown in the graph. A statistical analysis was performed using the Student’s t test *P < 0.05.
miR-15a/ miR-16-1 in CLL patient-derived immune cells
To validate the molecular and functional information gathered from mouse models in human samples, we evaluated miR-15a/miR-16-1 expression in human immune cells, including CD19+ B cells, CD8+ effector and central memory T cells (TEM and TCM), CD4+ TREG cells, CD14+CD16++ non-classical (NC), CD14++CD16+ intermediate (I) and CD14++CD16- classical (C) monocytes, and CD14+ HLA-DRlow/neg monocytic-myeloid derived suppressor cells (M-MDSCs). Figs. S4A and 7A show the expression level of miR-15a and miR-16-1 relative to U6 control on CD19+ B cells, T cells and monocyte subsets separated from fresh PBMCs of a cohort of 7 patient samples from MDACC (cohort 1, patients 1-7; Table S1).
Fig. 7. Characterization of miR-16-1 and related target proteins in human immune cells.

A, B The relative quantification values were calculated as miR-16-1 expression relative to U6 control. (A) miR-16-1 expression in human CD19+ B cells, effector memory hCD8+ CD45RA−CD45RO+CD62L− TEM, central memory hCD8+ CD45RA-CD45RO+CD62L+ TCM, CD4+CD25+CD127low/− Tregs, CD14+ CD16++ non-classical, CD14++ CD16+ intermediate and CD14++ CD16− classical monocytes and CD14+HLADRlow/− M-MDSCs, separated from fresh PBMCs of CLL patients (n = 7, patients 1–7, Table S1) using fluorescence-activated cell sorting is shown in the graph. B Frozen PBMCs obtained from healthy donors (n = 6) and patients with CLL (n = 6, patients 1, 2, 3, 51, 52, 68) were plated for 2 h in a 6-well plate at 6 × 10⁶/1.8 mL after thawing and were then stained for fluorescence activated cell sorting (FACS). Patients 51, 52, 68 were enrolled into trial with ibrutinib (IBT) and venetoclax (Ven) after this study, and are indicated as pre-treatment. miR-16-1 expression in human CD19+ B cells, effector memory hCD8+ CD45RA−CD45RO+CD62L− TEM, central memory hCD8+ CD45RA-CD45RO+CD62L+ TCM, CD4+CD25+CD127low/− TREG, CD14+ CD16++ non-classical (NC), CD14++ CD16+ intermediate (I) and CD14++ CD16− classical (C) monocytes and CD14+HLADRlow/− M-MDSCs, separated from PBMCs of healthy donors and patients with CLL is shown in graph. C–F Frozen PBMCs obtained from healthy donors (n = 6) and patients with CLL (n = 6, patients 1, 2, 3, 51, 52, 68) were plated for 2 h in a 6-well plate at 6 × 10⁶/1.8 mL after thawing and were then stained and analyzed for the expression of BCL2, PD1 and PD-L1 on CD19+ B cells, effector memory hCD8+ CD45RA-CD45RO+CD62L− TEM, central memory hCD8+ CD45RA−CD45RO+CD62L+ TCM, CD4+CD25+CD127low/− Tregs, CD14+ CD16++ non-classical, CD14++ CD16+ intermediate and CD14++ CD16− classical monocytes and CD14+HLADRlow/− M-MDSCs using flow cytometry. C The mean values ± SDs of the relative contributions of BCL2 expressing immune cells from patients with CLL and healthy donor controls and are shown in the graph. D The mean values ± SDs of the absolute numbers of BCL2 expressing immune cells from patients with CLL and healthy donor controls are shown in the graph. E The mean values ± SDs of the relative contributions of PD-L1+ CD14+ CD16++ non-classical, PD-L1+ CD14++ CD16+ intermediate, PD-L1+ CD14++ CD16− classical monocytes and PD-L1+ CD14+HLADRlow/− M-MDSCs from patients with CLL and healthy donor controls are shown in graph. F The mean values ± SDs of the relative contributions of PD1+ CD8+ CD45RA−CD45RO+CD62L− TEM and PD1+ CD8+ CD45RA-CD45RO+CD62L+ TCM from patients with CLL and healthy donor controls are shown in graph. G MISTRG mice were adoptively transferred on day 0 with monocytes and M-MDSCs (i.v.: 50,000-546,000 cells depending on the patient, including NC, I, C monocyte subsets and M-MDSCs) separated using fluorescence-activated cell sorting from the PBMCs of patients 413, 680, 915 (Table S2) and NS-transfected for 15 min with 50pM of either miR-16-1 miRNA mimic or miRNA mimic control. Mice were euthanized 7 days later for the analysis of patient-derived macrophages. H miR-16-1 expression relative to U6 control in myeloid cell pools (including NC, I, C monocytes and M-MDSCs) separated from PBMCs of CLL patients (n = 3, patients 413, 680, 915, Table S2) and then NS-transfected with miR-16-1 miRNA mimic (miR-16-1 mimic), with mimic control (mimic control) or left untreated (Unt) is shown in the graph. I The percentages of BCL2+, PD-L1+, CD206+, CD163+ to the whole CD68+ macrophage pool gated on live cells detected in the PB of MISTRG mice are shown in the graphs. J Flow cytometry detection of BCL2, PD-L1, CD206 and CD163 by human CD68+ macrophages in the PB of MISTRG mice transplanted with cells from representative patient 915. The percentage of BCL2, PD-L1, CD206 and CD163-expressing macrophages is indicated. A statistical analysis was performed using the Student’s t test *P < 0.05, **P < 0.01, ***P < 0.001.
Finally, as frozen samples became available, we retrospectively analyzed, together with miRNAs, the levels of human BCL2/PD1/PD-L1 target proteins on immune cells from patients with CLL and compared them with the levels in age-matched, healthy donor controls (n = 6; Fig. 7B–F; Fig. S4B). This set of patient samples includes sub-cohort 1A within cohort 1 (Table S1, patients 1,2,3) and 3 patients enrolled into the investigator-initiated phase 2 trial NCT02756897 [15] with BTK inhibitor ibrutinib (IBT) and the BCL2 inhibitor venetoclax (Ven) (Table S1, patients 51, 52, 68). The immune cell composition of patients treated with IBT/Ven was longitudinally investigated in a larger cohort of patients, including the 3 patients mentioned in regard to Fig. 7, and is described in Fig. S5A–I. Low levels of miR-15a/miR-16-1 and high levels of BCL2 protein have been observed in B cells and immune cells from patients with CLL and from healthy donor controls (Fig. 7B–D, Fig. S4B), while increasing levels of PD1/PD-L1 checkpoint molecules were observed in immune cells from patients with CLL compared with healthy donor controls (Fig. 7E, F). As expected, in patients with CLL, the majority of cells expressing BCL2 were B cells (Fig. 7D).
To mechanistically evaluate the involvement of miR-15a/miR-16-1 in the differentiation of monocytes into macrophages and ultimately their protumor immunophenotype, we established a patient-derived xenograft (PDX) system in the humanized MISTRG mice. This strain particularly facilitates the engraftment of human innate immune cells including monocytes [31]. When adoptively transferred into MISTRG mice, patient-derived monocyte subsets and M-MDSCs differentiate in vivo into tumor-associated macrophages (Fig. S6). We exploited the NanoStraw technology [32, 33] to transfect patient derived monocytes and M-MDSCs (Fig. S7) with either miR-16-1 or miR-15a mimics. When we forced the expression of miR-16-1 on a pool of monocytes and M-MDSCs from 3 patients with CLL (Table S2, patients 413, 680, 915) and we analyzed macrophages in MISTRG mice (Figs. S8–S9, 7G–J), we found a downregulation of BCL2/PD-L1 related target proteins together with a downmodulation of TAM protumor markers including CD163 and CD206 (Fig. 7I, J). This regulation on macrophages was not induced by the forced expression of miR-15a (Fig. S10).
Overall, our findings confirmed the previous evidence on miR-15a/miR-16-1 on B and T cells, and our study was the first to investigate the role of miR-15a/miR-16-1 cluster on human monocyte subsets, M-MDSCs and macrophages. We demonstrated that human monocyte subsets and M-MDSCs have low expression levels of miR-15a/miR-16-1 and express BCL2 and PD-L1. We ultimately demonstrated that forced expression of miR-16-1 mitigates the protumor immunophenotype of monocyte-derived macrophages.
Discussion
The tumor-suppressor role of DLEU2/miR-15a/miR-16-1 locus has been extensively characterized on leukemic cells [6, 9].
In this study, we demonstrated that DLEU2/miR-15a/miR-16-1 and its target proteins are involved in a wide molecular program of the non-malignant immune system that is exacerbated during leukemia development, progression, and dissemination.
Several studies have documented a variety of ncRNA molecular signatures in the mouse immune system [34].
Our transcriptome analysis of coding and ncRNAs performed on murine monocytes and macrophages at different stages of leukemia in Rag2−/−γc−/− xeno-transplanted mice showed an enrichment of several miRNAs and lncRNAs involved in normal and malignant hematopoiesis. We found differential expression of miR-511-3p, miR-181c and miR-9-2 on myeloid cells. These miRNAs modulate macrophage activation and function in solid tumors [35].
DLEU2 and miR-16-1 were found downmodulated on myeloid cells. This evidence supported our hypothesis that the MDR locus has a role in the protumor function of myeloid cells during leukemia progression, and the results obtained in the TCL1+/−MDR−/− mouse model further supported our hypothesis. In patients with CLL, we found that miR-16-1 drives the protumor phenotype of monocyte-derived macrophages.
Although 13q14 deletion is the most frequent genetic lesion in CLL cells, occurring in more than 50% of cases, a mouse model recapitulating the 13q14 deletion with optimal disease penetrance and latency for translational studies was lacking. We developed the TCL1+/−MDR−/− mouse model characterized by the 13q14 deletion, and overexpression of the hTCL1 gene, present in the vast majority of human CLL cases. Of note, in patients with CLL either somatic or germline mutations of miR16-1 have been reported [4] and the MDR−/− mouse model recapitulating the germline 13q14 deletion, allowed to investigate its impact on the biology of cells of both the lymphoid and myeloid lineage.
The peculiar TIME observed in the TM mouse model recalls crucial features of immune dysfunction observed in patients with CLL. Perturbation of the innate and adaptive immune system is observed in almost all the patients from the time of diagnosis [36, 37]. Alterations in T-cell populations start in early-stage and worsen during disease progression with initial increase of the absolute CD4+ and CD8+ T cell count, followed by reduction of the CD4+:CD8+ T cell ratio, functional impairment of T-cell cytotoxic activity and immune synapse formation, exhaustion features and expansion of CD4+ FoxP3+ regulatory T cells (TREG). The monocyte cell count is often increased in patients with CLL and skews toward CD14+CD16+ Non-Classical and Intermediate monocytes with immunosuppressive properties and protumor, M2-like macrophage differentiation capacity [38]. The TCL1+/−MDR−/− mice closely recapitulate some of these features, including the CD4:CD8 T cell ratio abnormality, T-cell exhaustion, monocyte populations more committed to macrophage differentiation, and exaggerated protumor and cell-autonomous macrophage phenotype. This evidence supports the need for further studies profiling the ncRNA signatures of the immune cells in patients with CLL.
The BCL2 upregulation we observed on leukemic cells and immune cells in the TCL1+/−MDR−/− mice confirmed previous data demonstrating in patients with CLL that miR-15a/miR-16-1 exerts its tumor-suppression function by targeting BCL2 [4, 9, 28].
BCL2 was found expressed on immune cells from either patients with CLL and 50 to 60-year-old healthy donors thus confirming the role of BCL2 molecule in the development and function of the whole immune system [10]. The low expression level of miR-15a/miR-16-1 that we found on immune cells from both patients with CLL and age-matched healthy donors might be due to complete different mechanisms and should be further investigated.
First, low expression level of miR-15a/miR-16-1 in immune cells might be an age-related phenomenon like that observed in aged wild-type NZB mice where a point mutation in the 3’-flanking sequence of Mirn16-1 results in decreased levels of miR-16 in lymphoid tissues [5]. It is unexplored the status of miR-15a/miR-16-1 cluster in the immune cells of ≤ 40-year-old healthy donors.
Second, DLEU2 is poorly investigated, and it might have an immune-related role. It encodes a lncRNA (1.0–1.8 kb) that targets several miRNAs, and it might be a crucial regulator of immune cells from patients with CLL compared with healthy donors. The initial identified transcript was thought to be a tumor suppressor lncRNA through negative regulation of cell cycle progression [39]. A certain alternative transcript of DLEU2 has been shown to facilitate cell cycle transition through modulation of expression of angiotensin I- converting enzyme 2 (ACE2) and cyclin D1 [40]. Overall, studies on cancer cell lines and mouse models assessed the effects of DLEU2 overexpression or silencing on tumor progression [41]. Its impact on immune cells of the lymphoid and myeloid lineage should be also investigated.
In conclusion our study indicates that DLEU2/miR-15a/miR-16-1 and its target proteins are responsible for the dysregulation of immune cells that shapes the protumor microenvironment during CLL development, progression, and dissemination and underlines the relevance of investigating the role of ncRNAs in the human immune system.
Supplementary information
Acknowledgements
This study was supported by CLL Global Research Foundation (to MTSB), The UT MD Anderson Cancer Center Moon Shot Program (to MTSB), Rosemary and Daniel J. Harrison III (to MTSB and WW), NIH/NCI P30CA016672 (to the Research Animal Support Facility, to the Advanced Cytometry and Sorting Facility—ACSF, and to the Advanced Technology Genomics Core—ATGC), Program Molecular Clinica Oncology-5 per mille number 9965 (to FC-C) Associazione Italiana per la Ricerca sul cancro AIRC (Italy). Some of the figures were created using BioRender.com and Servier Medical Art: www.smart.servier.com. Eμ-TCL1 transgenic mice were a gift of J. Byrd and C.M. Croce (The Ohio State University, Columbus, OH). MDR−/− mice were a kind gift of U. Klein and Riccardo Dalla-Favera (Columbia University, New York). C57BL/6 mice were purchased at Taconic Biosciences (NY, USA). We are grateful to U. Klein for providing constructive comments. We are grateful to Laura Russell and the Department of Scientific Publications, MD Anderson Cancer Center, for reviewing the manuscript and providing constructive comments.
Author contributions
MTSB conceptualized the study; RZ performed experiments and analyzed the data; PK performed experiments and analyzed the data; PB performed experiments; CI performed the statistical analysis of the data; SS assisted in flow cytometry in vitro studies; FB performed in vivo survival experiments; KC-K assisted in flow cytometry and cell sorting study design, set up and analysis in mice and human experiments; VJ assisted in mice studies; ET and MM performed microarray studies; NC, S-SC, and X-JY assisted in mice studies; NJ contributed patient samples and provided patient-related input; PG assisted in initial experimental in vivo studies; FC-C initially guided the research, assisted in the interpretation and discussion of the results; RM, SK, RS assisted in nanostraw experiments; RB assisted in mimics experiments and in interpretation and discussion of the results; VG assisted in the interpretation and discussion of the results; WW contributed patient samples with clinical/biological features and assisted in the interpretation and discussion of the results; GC assisted in experiment design, interpretation and discussion of the results; MJK contributed patient samples with clinical/biological features, provided patient-related input, assisted in the interpretation and discussion of the results; MTSB provided study resources, designed and supervised the project, performed experiments, analyzed the data and wrote the paper. All the authors reviewed and approved the manuscript.
Data availability
The authors declare that all relevant data of this study are available within the article or from the corresponding author upon request. Microarray data are available at GEO under accession number GSE224048. The NCT02756897 phase 2 trial information are available at www.clinicaltrials.gov.
Competing interests
RM, SK, RS are employees of Navan Technologies. All the remaining authors declare no competing financial interests.
Footnotes
Publisher’s note Springer Nature remains neutral with regard to jurisdictional claims in published maps and institutional affiliations.
These authors contributed equally: Ronghua Zhang, Priyanka Khare.
Supplementary information
The online version contains supplementary material available at 10.1038/s41408-024-01142-3.
References
- 1.Dohner H, Stilgenbauer S, Benner A, Leupolt E, Krober A, Bullinger L, et al. Genomic aberrations and survival in chronic lymphocytic leukemia. N. Engl J Med. 2000;343:1910–6. [DOI] [PubMed] [Google Scholar]
- 2.Svanberg R, Janum S, Patten PEM, Ramsay AG, Niemann CU. Targeting the tumor microenvironment in chronic lymphocytic leukemia. Haematologica. 2021;106:2312–24. [DOI] [PMC free article] [PubMed] [Google Scholar]
- 3.Rassenti LZ, Balatti V, Ghia EM, Palamarchuk A, Tomasello L, Fadda P, et al. MicroRNA dysregulation to identify therapeutic target combinations for chronic lymphocytic leukemia. Proc Natl Acad Sci USA. 2017;114:10731–6. [DOI] [PMC free article] [PubMed] [Google Scholar]
- 4.Calin GA, Ferracin M, Cimmino A, Di Leva G, Shimizu M, Wojcik SE, et al. A MicroRNA signature associated with prognosis and progression in chronic lymphocytic leukemia. N. Engl J Med. 2005;353:1793–801. [DOI] [PubMed] [Google Scholar]
- 5.Scaglione BJ, Salerno E, Balan M, Coffman F, Landgraf P, Abbasi F, et al. Murine models of chronic lymphocytic leukaemia: role of microRNA-16 in the New Zealand Black mouse model. Br J Haematol. 2007;139:645–57. [DOI] [PMC free article] [PubMed] [Google Scholar]
- 6.Klein U, Lia M, Crespo M, Siegel R, Shen Q, Mo T, et al. The DLEU2/miR-15a/16-1 cluster controls B cell proliferation and its deletion leads to chronic lymphocytic leukemia. Cancer Cell. 2010;17:28–40. [DOI] [PubMed] [Google Scholar]
- 7.Simonetti G, Bertilaccio MT, Ghia P, Klein U. Mouse models in the study of chronic lymphocytic leukemia pathogenesis and therapy. Blood. 2014;124:1010–9. [DOI] [PubMed] [Google Scholar]
- 8.Calin GA, Dumitru CD, Shimizu M, Bichi R, Zupo S, Noch E, et al. Frequent deletions and down-regulation of micro- RNA genes miR15 and miR16 at 13q14 in chronic lymphocytic leukemia. Proc Natl Acad Sci USA. 2002;99:15524–9. [DOI] [PMC free article] [PubMed] [Google Scholar]
- 9.Calin GA, Cimmino A, Fabbri M, Ferracin M, Wojcik SE, Shimizu M, et al. MiR-15a and miR-16-1 cluster functions in human leukemia. Proc Natl Acad Sci USA. 2008;105:5166–71. [DOI] [PMC free article] [PubMed] [Google Scholar]
- 10.Renault TT, Chipuk JE. Getting away with murder: how does the BCL-2 family of proteins kill with immunity? Ann N. Y Acad Sci. 2013;1285:59–79. [DOI] [PMC free article] [PubMed] [Google Scholar]
- 11.Strasser A, Harris AW, Cory S. bcl-2 transgene inhibits T cell death and perturbs thymic self-censorship. Cell. 1991;67:889–99. [DOI] [PubMed] [Google Scholar]
- 12.Veis DJ, Sentman CL, Bach EA, Korsmeyer SJ. Expression of the Bcl-2 protein in murine and human thymocytes and in peripheral T lymphocytes. J Immunol. 1993;151:2546–54. [PubMed] [Google Scholar]
- 13.Veis DJ, Sorenson CM, Shutter JR, Korsmeyer SJ. Bcl-2-deficient mice demonstrate fulminant lymphoid apoptosis, polycystic kidneys, and hypopigmented hair. Cell. 1993;75:229–40. [DOI] [PubMed] [Google Scholar]
- 14.Souers AJ, Leverson JD, Boghaert ER, Ackler SL, Catron ND, Chen J, et al. ABT-199, a potent and selective BCL-2 inhibitor, achieves antitumor activity while sparing platelets. Nat Med. 2013;19:202–8. [DOI] [PubMed] [Google Scholar]
- 15.Jain N, Keating M, Thompson P, Ferrajoli A, Burger JA, Borthakur G, et al. Ibrutinib plus venetoclax for first-line treatment of chronic lymphocytic leukemia: a nonrandomized phase 2 trial. JAMA Oncol. 2021;7:1213–9. [DOI] [PMC free article] [PubMed] [Google Scholar]
- 16.Banerjee P, Zhang R, Ivan C, Galletti G, Clise-Dwyer K, Barbaglio F, et al. Trabectedin reveals a strategy of immunomodulation in chronic lymphocytic leukemia. Cancer Immunol Res. 2019;7:2036–51. [DOI] [PMC free article] [PubMed] [Google Scholar]
- 17.Lagasse E, Weissman IL. Enforced expression of Bcl-2 in monocytes rescues macrophages and partially reverses osteopetrosis in op/op mice. Cell. 1997;89:1021–31. [DOI] [PubMed] [Google Scholar]
- 18.Jia X, Li X, Shen Y, Miao J, Liu H, Li G, et al. MiR-16 regulates mouse peritoneal macrophage polarization and affects T-cell activation. J Cell Mol Med. 2016;20:1898–907. [DOI] [PMC free article] [PubMed] [Google Scholar]
- 19.Galletti G, Scielzo C, Barbaglio F, Rodriguez TV, Riba M, Lazarevic D, et al. Targeting macrophages sensitizes chronic lymphocytic leukemia to apoptosis and inhibits disease progression. Cell Rep. 2016;14:1748–60. [DOI] [PubMed] [Google Scholar]
- 20.Squadrito ML, Pucci F, Magri L, Moi D, Gilfillan GD, Ranghetti A, et al. miR-511-3p modulates genetic programs of tumor-associated macrophages. Cell Rep. 2012;1:141–54. [DOI] [PubMed] [Google Scholar]
- 21.Liang X, Xu Z, Yuan M, Zhang Y, Zhao B, Wang J, et al. MicroRNA-16 suppresses the activation of inflammatory macrophages in atherosclerosis by targeting PDCD4. Int J Mol Med. 2016;37:967–75. [DOI] [PMC free article] [PubMed] [Google Scholar]
- 22.Zhang Y, Velez-Delgado A, Mathew E, Li D, Mendez FM, Flannagan K, et al. Myeloid cells are required for PD-1/PD-L1 checkpoint activation and the establishment of an immunosuppressive environment in pancreatic cancer. Gut. 2017;66:124–36. [DOI] [PMC free article] [PubMed] [Google Scholar]
- 23.Prima V, Kaliberova LN, Kaliberov S, Curiel DT, Kusmartsev S. COX2/mPGES1/PGE2 pathway regulates PD-L1 expression in tumor-associated macrophages and myeloid-derived suppressor cells. Proc Natl Acad Sci USA. 2017;114:1117–22. [DOI] [PMC free article] [PubMed] [Google Scholar]
- 24.Bichi R, Shinton SA, Martin ES, Koval A, Calin GA, Cesari R, et al. Human chronic lymphocytic leukemia modeled in mouse by targeted TCL1 expression. Proc Natl Acad Sci USA. 2002;99:6955–60. [DOI] [PMC free article] [PubMed] [Google Scholar]
- 25.Bresin A, D’Abundo L, Narducci MG, Fiorenza MT, Croce CM, Negrini M, et al. TCL1 transgenic mouse model as a tool for the study of therapeutic targets and microenvironment in human B-cell chronic lymphocytic leukemia. Cell Death Dis. 2016;7:e2071. [DOI] [PMC free article] [PubMed] [Google Scholar]
- 26.Dieterle AM, Bohler P, Keppeler H, Alers S, Berleth N, Driessen S, et al. PDK1 controls upstream PI3K expression and PIP3 generation. Oncogene. 2014;33:3043–53. [DOI] [PubMed] [Google Scholar]
- 27.Lien EC, Dibble CC, Toker A. PI3K signaling in cancer: beyond AKT. Curr Opin Cell Biol. 2017;45:62–71. [DOI] [PMC free article] [PubMed] [Google Scholar]
- 28.Liu D, Yang X, Songyang Z. Identification of CISK, a new member of the SGK kinase family that promotes IL-3-dependent survival. Curr Biol. 2000;10:1233–6. [DOI] [PubMed] [Google Scholar]
- 29.Bruhn MA, Pearson RB, Hannan RD, Sheppard KE. AKT-independent PI3-K signaling in cancer-emerging role for SGK3. Cancer Manag Res. 2013;5:281–92. [DOI] [PMC free article] [PubMed] [Google Scholar]
- 30.Ingersoll MA, Spanbroek R, Lottaz C, Gautier EL, Frankenberger M, Hoffmann R, et al. Comparison of gene expression profiles between human and mouse monocyte subsets. Blood. 2010;115:e10–9. [DOI] [PMC free article] [PubMed] [Google Scholar]
- 31.Rongvaux A, Willinger T, Martinek J, Strowig T, Gearty SV, Teichmann LL, et al. Development and function of human innate immune cells in a humanized mouse model. Nat Biotechnol. 2014;32:364–72. [DOI] [PMC free article] [PubMed] [Google Scholar]
- 32.Pop MA, Almquist BD. Controlled delivery of MicroRNAs into primary cells using nanostraw technology. Adv Nanobiomed Res. 2021;1:2000061. [DOI] [PMC free article] [PubMed] [Google Scholar]
- 33.Schmiderer L, Subramaniam A, Zemaitis K, Backstrom A, Yudovich D, Soboleva S, et al. Efficient and nontoxic biomolecule delivery to primary human hematopoietic stem cells using nanostraws. Proc Natl Acad Sci USA. 2020;117:21267–73. [DOI] [PMC free article] [PubMed] [Google Scholar]
- 34.Rose SA, Wroblewska A, Dhainaut M, Yoshida H, Shaffer JM, Bektesevic A, et al. A microRNA expression and regulatory element activity atlas of the mouse immune system. Nat Immunol. 2021;22:914–27. [DOI] [PMC free article] [PubMed] [Google Scholar]
- 35.Squadrito ML, Etzrodt M, De Palma M, Pittet MJ. MicroRNA-mediated control of macrophages and its implications for cancer. Trends Immunol. 2013;34:350–9. [DOI] [PMC free article] [PubMed] [Google Scholar]
- 36.Forconi F, Moss P. Perturbation of the normal immune system in patients with CLL. Blood. 2015;126:573–81. [DOI] [PubMed] [Google Scholar]
- 37.Rossi D, De Paoli L, Rossi FM, Cerri M, Deambrogi C, Rasi S, et al. Early stage chronic lymphocytic leukaemia carrying unmutated IGHV genes is at risk of recurrent infections during watch and wait. Br J Haematol. 2008;141:734–6. [DOI] [PubMed] [Google Scholar]
- 38.Maffei R, Bulgarelli J, Fiorcari S, Bertoncelli L, Martinelli S, Guarnotta C, et al. The monocytic population in chronic lymphocytic leukemia shows altered composition and deregulation of genes involved in phagocytosis and inflammation. Haematologica. 2013;98:1115–23. [DOI] [PMC free article] [PubMed] [Google Scholar]
- 39.Liu Y, Corcoran M, Rasool O, Ivanova G, Ibbotson R, Grander D, et al. Cloning of two candidate tumor suppressor genes within a 10 kb region on chromosome 13q14, frequently deleted in chronic lymphocytic leukemia. Oncogene. 1997;15:2463–73. [DOI] [PubMed] [Google Scholar]
- 40.Li W, Wang R, Ma JY, Wang M, Cui J, Wu WB, et al. A human long non-coding RNA ALT1 controls the cell cycle of vascular endothelial cells via ACE2 and cyclin D1 pathway. Cell Physiol Biochem. 2017;43:1152–67. [DOI] [PubMed] [Google Scholar]
- 41.Ghafouri-Fard S, Dashti S, Farsi M, Taheri M. Deleted in lymphocytic leukemia 2 (DLEU2): An lncRNA with dissimilar roles in different cancers. Biomed Pharmacother. 2021;133:111093. [DOI] [PubMed] [Google Scholar]
Associated Data
This section collects any data citations, data availability statements, or supplementary materials included in this article.
Supplementary Materials
Data Availability Statement
The authors declare that all relevant data of this study are available within the article or from the corresponding author upon request. Microarray data are available at GEO under accession number GSE224048. The NCT02756897 phase 2 trial information are available at www.clinicaltrials.gov.