

Abstract
Glycogen is a highly branched biomacromolecule that functions as a glucose buffer. It is involved in multiple diseases such as glycogen storage disorders, diabetes, and even liver cancer, where the imbalance between biosynthetic and catabolic enzymes results in structural alterations and abnormal accumulation of glycogen that can be toxic to cells. Accurate and sensitive glycogen quantification and structural determination are prerequisites for understanding the phenotypes and biological functions of glycogen under these conditions. In this research, we furthered cell glycogen characterization by presenting a highly sensitive method to measure glycogen content and degree of branching. The method employed a novel fructose density gradient as an alternative to the traditional sucrose gradient to fractionate glycogen from cell mixtures using ultracentrifugation. Fructose was used to avoid the large glucose background allowing the method to be highly quantitative. The glycogen content was determined by quantifying 1-phenyl-3-methyl-5-pyrazolone (PMP) derivatized glucose residues obtained from acid hydrolyzed glycogen using ultra-high performance liquid chromatography triple quadrupole mass spectrometry (UHPLC/QqQ-MS). The degree of branching was determined through linkage analysis where the glycogen underwent permethylation, hydrolysis, PMP derivatization and UHPLC/QqQ-MS analysis.
The new approach was used to study the effect of insulin on the glycogen phenotypes of human hepatocellular carcinoma (Hep G2) cells. We observed that cells produced greater amounts of glycogen with less-branching under increasing insulin levels before reaching the cell’s insulin-resistant state, where the trend reversed and the cells produced less but higher-branched glycogen. The advantage of this method lies in its high sensitivity in characterizing both the glycogen level and structure of biological samples.
Introduction
Glycogen is described as a hyperbranched polysaccharide of glucose and serves as the vital energy storage in the human body. It plays important roles in regulating glucose-dependent functions and supporting physical activities.1 The structure of glycogen controls its physiochemical properties and biological functions. For example, the glycogen branching frequency mediates the water solubility as well as the rate of glucose storage and release.2 Abnormal structural alterations and accumulation of glycogen caused by disorders of biosynthetic and catabolic enzymes, are often fatal for cells.3,4 The metabolic dysregulation of glycogen results in many storage diseases and may contribute to the development of diabetes and cancers.5-7 Current diagnosis of glycogen-related diseases is a combination of clinical presentation, metabolite (e.g., serum glucose) test, enzyme activity, and molecular genetic analysis.8,9 Direct analysis of glycogen requires an invasive muscle or liver biopsy by which, abnormal levels of glycogen have been found in multiple human tissues with diseases (Table 1).7,10-12 Glycogen structures with unusual degree of branching were also noted for some glycogen storage disorders (e.g., Cori disease and Andersen disease) but remained to be characterized for diabetes and other diseases.12
Table 1.
| Disease | Deficiency | Principal tissue affected | Glycogen content | Glycogen branching |
|---|---|---|---|---|
| GSD 0 | Glycogen synthase | Liver, muscle, heart | Null/Low level | Normal |
| GSD I (Von Gierke disease) | Glucose-6-phosphatase | Liver, kidney | Increase | Normal |
| GSD II (Pompe disease) | α-1,4 glucosidase | Muscle, heart, skin | Massive increase | Normal |
| GSD III (Cori or Forbes disease) | Debranching enzyme | Liver, muscle, heart | Increase | Increase |
| GSD IV (Andersen disease) | Branching enzyme | Liver, muscle, heart, nervous | Increase | Decrease |
| GSD V (McArdle disease) | Phosphorylase (muscle) | Muscle | Moderate increase | Normal |
| GSD VI (Hers disease) | Phosphorylase (liver) | Liver | Increase | Normal |
| GSD VII (Tarui disease) | Phosphofructokinase (muscle) | Muscle | Increase | Normal |
| GSD VIII | Phosphofructokinase (liver) | Liver | Increase | Normal |
| EPM2 (Lafora Disease) | Laforin or Malin | Liver, muscle, heart, nervous | Increase | Decrease |
| IDDM (Type 1 diabetes) | Insulin deficiency | Liver, muscle, adipose | Decrease | ??? |
| Heart, kidney | Increase | ??? | ||
| NIDDM (Type 2 diabetes) | Insulin resistance | Liver, muscle | Decrease | ??? |
| Heart, kidney | Increase | ??? |
GSD (Glycogen Storage Disease)
EPM2 (Epilepsy Progressive Myoclonic 2)
IDDM (Insulin-Dependent Diabetes Mellitus)
NIDDM (NonInsulin-Dependent Diabetes Mellitus)
Due to the importance of glycogen, efforts have been made to characterize glycogen content and structure to differentiate disease phenotypes and develop diagnostic biomarkers. Total glucose methods including anthrone and phenol-sulfuric acid assays measured glycogen levels by utilizing concentrated sulfuric acid to break down and dehydrate glycogen. The resulting hydroxymethyl furfural was then reacted with anthrone or phenol to produce a blue-green or yellow-gold color that could be measured with spectrophotometry.13,14 These methods provide rapid and convenient approaches to quantify total carbohydrates but lack specificity for glycogen. Alternatively, amyloglucosidase (AMG), an enzyme that cleaves both 1,4 and 1,6-α-D-glucosidic bonds in glycogen was used to digest glycogen. The released glucose monomers were then oxidized by glucose oxidase to produce hydrogen peroxide which could be detected with a colorimetric probe.15-17 These colorimetric methods provide quantitative information about total glycogen, but provide no structural information and are readily complicated by the large glucose background.
To characterize the glycogen structure, proton nuclear magnetic resonance (1H NMR) spectroscopy was employed to directly study the degree of branching by measuring the fraction of α-1,6 linkages18; however, the method requires large amount of samples (in milligram quantities). The degree of branching could also be calculated from chain-length distributions which are measured by the complete hydrolysis of α-1,6 linkages with isoamylase before separating and analyzing the resulting linear glucans based on their degree of polymerization using techniques such as fluorophore-assisted carbohydrate electrophoresis (FACE)19,20 and high-performance anion exchange chromatography with pulsed amperometric detection (HPAEC-PAD)21,22. These techniques showed satisfactory reproducibility but compromised throughput, sensitivity and quantitative accuracy.23
Mass spectrometry (MS)-based methods have emerged as powerful tools to analyze both polysaccharide content and structure. Matrix-assisted laser desorption/ionization time-of-flight mass spectrometry (MALDI/TOF-MS) was used as a fast and sensitive technique to study carbohydrate chain-length distribution but showed compromised reproducibility.24 We recently developed robust and high-throughput methods to determine both the monosaccharide constituents and glycosidic linkages of carbohydrates by employing UHPLC/QqQ-MS.25 The monosaccharide content method first hydrolyzed polysaccharides with strong acid, then PMP-derivatized and quantified the monosaccharides with an external calibration curve composed of monosaccharide standards. The glycosidic linkage method permethylated and hydrolyzed polysaccharides, and PMP-derivatized and quantified the methylated monosaccharides based on their peak areas. The relative abundances of monosaccharide units at the terminal, linear, bisecting, and trisecting positions were compared to provide structural information.26 The sensitivity, specificity and reproducibility of these MS-based methods showed high potential in application of cell glycogen analysis. However, these methods have only been used to analyze plant and food polysaccharides, and have not been applied towards characterizing glycogen.
In this research, we developed a cell glycogen extraction and analysis workflow that can sensitively and simultaneously determine the glycogen amount and degree of branching using UHPLC/QqQ-MS (Fig. 1). We found that the commonly used glycogen purification method via sucrose gradient centrifugation could introduce glucose impurities from the sucrose which affect the glycogen analysis, so instead we developed a novel fructose gradient centrifugation method to extract and purify glycogen from the complex cellular environment and to avoid the contamination. The glycogen content was then measured through the monosaccharide analysis by quantifying PMP-derivatized glucose units and the degree of branching was monitored through the linkage analysis by comparing the abundances of different glycosidic linkages. The limit of detection (LOD) and limit of quantification (LOQ) of the glycogen quantification method were determined to be 5 pg and 5 ng, respectively. To demonstrate the method’s viability, we examined the Hep G2 cell glycogen phenotypes under insulin-stimulated and resistant cell states. We discovered that the glycogen content increased and degree of branching decreased when the cells were first treated with higher concentration of insulin while a reverse trend was observed when the cells reached their insulin-resistant states. The results highlighted the sensitivity, efficacy and robustness of this method making it ideal for glycogen analysis in research using small sample sizes such as in blood samples and cell models. By providing both quantitative and structural information, the method will facilitate studies in glycogen structure-function relationship and help further the understanding of disease-related glycogen phenotypes.
Figure 1.

Sample preparation workflow of cell glycogen for quantification and degree of branching analysis via LC-MS. (a) Glycogen was extracted from cells through lysis, a series of centrifugations, and ethanol precipitation. All centrifugations were performed at 4°C. (b) The glycogen was hydrolyzed and derivatized for monosaccharide composition analysis (top) or permethylated before hydrolyzed and derivatized for glycosidic linkage analysis (bottom). (c) The derivatized glycosides from glycogen samples were subjected to UHPLC/QqQ-MS analysis, resulting in chromatograms with the green peaks. Reference peaks obtained from pooled mono- or oligo-saccharide standards were shown in blue and superimposed on the sample peaks. The green fructose peak in the monosaccharide analysis originated from the fructose gradient.
Methods
Cell culture and insulin treatment.
Hep G2 cells were grown in DMEM containing 25 mM D-glucose, supplemented with 10% (v/v) FBS and 1% (v/v) penicillin-streptomycin. The cells were maintained at 37°C in a humidified cell culture incubator with 5% CO2 and split at 80% confluency using a 1:5 ratio. After the cells were plated in a 10-cm Petri dish for 24 hrs, the medium was changed to FBS-free DMEM for 24 hrs. For the treatment, the media was changed into FBS-free DMEM containing 1 x 10⁴, 1 x 10³, 1 x 10², 10, 1 nM insulin.27,28 After 24 hrs of incubation, 100 μL of the cell culture media was collected to determine glucose consumption and the cells were harvested for glycogen analysis.
Cell glycogen extraction using density gradient centrifugation.
Fructose gradients were prepared at least one night prior to glycogen extraction. Stock solutions for 30%, 60% and 80% (w/v) fructose were prepared with nanopure water and stored at 4°C until use. To a 1.5 mL ultracentrifuge tube, 400 μL of the 80% fructose stock solution was added to the bottom and allowed to freeze on dry ice. Then, subsequent layers of 400 μL of each 60% and 30% fructose solutions were added on top after the previous layer was frozen. The gradients can be stored in −80°C and moved to 4°C one night before use to allow the gradient to become linear. Sucrose gradients (25%, 50%, 75%) were prepared the same way.
The glycogen extraction method was developed based on previous approaches.15,29,30 Cells were washed twice with DPBS and harvested with scrapers (Fig. 1a). The cell mixture was centrifuged at 130 × g for 7 min at 4°C. The cell pellet was resuspended in 1.2 mL of 20 mM HEPES buffer at pH 7.4 and heated in a boiling water bath for 5 min to inactivate endogenous enzymes that digest glycogen. The samples were cooled to 4°C and the condensed liquid was spun down. The cells were lysed at 4°C using a probe sonicator (Q700; QSonica) through five on (5 s) and off (10 s) pulse cycles at 25% amplitude. The lysate was centrifuged at 6,000 × g for 10 min at 4°C to remove cellular debris and nuclear fractions. An aliquot of 2 μL of the supernatant was used to measure protein concentration through BCA assay. The protein content was used later to normalize the glycogen content. Another aliquot of 1 mL of the supernatant was collected for ultracentrifugation at 50,000 × g for 30 min at 4°C. The pellet was reconstituted in 200 μL of 20 mM HEPES buffer and layered on top of a linear fructose gradient. The sample was ultracentrifuged at 280,000 × g for 2.5 hrs at 4°C to separate glycogen from other cellular fractions. The top 1.38 mL of supernatant was removed carefully. To the remaining solution, 500 μL of ethanol was added, vortexed and stored in −80°C for 20 min to precipitate the glycogen. The sample was centrifuged at 4,000 × g for 10 min at 4°C before the supernatant with most fructose was removed. Another wash with 100 μL of ethanol was performed using the same procedure. The precipitate was dried in vacuo completely and reconstituted in 100 μL of nanopure water. Aliquots of 5 μL and 50 μL of the solution were used for glycogen content determination and degree of branching analysis, respectively. The remaining material was stored in −80°C for further use.
Glycogen content determination using LC-MS.
The glycogen quantification method was adapted from the monosaccharide compositional analysis.25,31,32 The samples were hydrolyzed in 100 μL of 4 M TFA at 120°C for 1 h (Fig. 1b upper). The released monosaccharides were dried completely in vacuo. An external calibration curve was prepared by diluting a pool of monosaccharide standards into concentrations ranging from 0.001 to 50 μg/mL per monosaccharide. The pool included glucose, galactose, mannose, fructose, allose, fucose, rhamnose, arabinose, xylose, ribose, galacturonic acid, glucuronic acid, N-acetylgalactosamine and N-acetylglucosamine. Together with the standards, the samples were derivatized with 100 μL of 0.2 M PMP in methanol and 100 μL of 28% ammonium hydroxide at 70°C for 30 min. The samples were dried completely in vacuo and reconstituted in nanopure water. Chloroform-water extraction was performed twice to remove the excess PMP reagent. The water layer was analyzed with an Agilent 1290 Infinity II UHPLC coupled with an Agilent 6495 QqQ MS using dynamic multiple reaction monitoring (dMRM). The data were analyzed with the Agilent MassHunter quantitative analysis software version B.08.00 (Fig. 1c upper). The transition m/z 511.2 → m/z 175.1 was used to quantify glucose and the product ion m/z 217.1 was monitored as a qualifier ion. The amount of glucose derived from the glycogen was extrapolated from the external calibration curve and normalized to protein amount.
Degree of branching analysis.
The degree of branching analysis was adapted from the glycosidic linkage analysis.26,33,34 The 50 μL aliquots of glycogen samples were dried in vacuo and permethylated by reaction with 5 μL of saturated NaOH solution for 30 min and 150 μL of DMSO for 30 min in argon, followed by 40 μL of iodomethane for 50 min (Fig. 1b lower). Dichloromethane-water extraction was performed five times to remove the excess NaOH and DMSO. The organic layer was dried completely in vacuo and hydrolyzed with 100 μL of 4 M TFA at 100°C for 2 hrs. The samples were dried and underwent the same PMP derivatization as the glycogen quantification method. The dried samples were reconstituted in 100 μL of 70% methanol/water and analyzed with an Agilent 1290 Infinity II UHPLC coupled with an Agilent 6495 QqQ MS using dMRM. The data were analyzed with the Agilent MassHunter quantitative analysis software version B.08.00 (Fig. 1c lower). The precursor ions m/z 539.2, 553.6 and 567.2 and the product ion m/z 175.1 were used to quantify 4,6-glucose (at branching points), 4-glucose (at linear chains) and T-glucose (at termini), respectively. The product ion m/z 231.2 was monitored as a qualifier ion for these glycoside analytes. The relative abundance of the glucose units was calculated based on the integrated peak areas.
Glycogen degree of branching analysis using NMR.
The samples were prepared for 1H NMR (600 MHz Varian VNMRS Spectrometer) by dissolving 10 mg of the glycogen standard in 1 mL of deuterium oxide.35 The degree of branching was determined by comparing the peak integrals for the anomeric protons of α(1→6)-linked glucose residues (4.97 ppm) and the anomeric protons of α(1→4)-linked glucose residues (5.40 ppm) using MestReNova software.
Results and Discussion
Extraction of cell glycogen
Both the quantification and structural analysis of glycogen required the extraction and purification of glycogen. Without extensive purification, the accuracy of the analysis is compromised due to interference from free glucose, residues containing glycans and other biomolecules that react with the analytical reagents. Current methods for tissue glycogen extraction consist of sample homogenization followed by glycogen purification. Sample homogenization has been performed under various conditions and with different solutions. Hot alkaline solution had been used but was found to degrade glycogen compared to cold trichloroacetic acid solution, which produced glycogen of much larger molecular weights.38-40 Tris buffer was employed to inactivate enzymes that degrade glycogen.15,29,30 Formalin solution was also tested on liver samples that were already preserved in it.17 Glycogen purification has been conducted by direct ethanol precipitation17,41,42 or an additional step of fractionation using sucrose-density gradient centrifugation before ethanol precipitation15,29,30. Both methods were reported to produce glycogen of a similar size distribution but the use of a separation gradient yielded a higher purity of glycogen.
We compared the sample homogenization methods using boiling KOH solution and boiling HEPES buffer to minimize glycogen breakdown by cytosolic and lysosomal enzymes. We also optimized the glycogen purification by comparing the efficiency of ethanol precipitation, density gradient centrifugation and molecular weight cut-off (MWCO) centrifugal filters. These methods have not been compared systematically before, and we were able to characterize and compare their extraction and purification efficiency using the LC-MS-based methods through both monosaccharide and glycosidic linkage analyses (Fig. 2).
Figure 2.
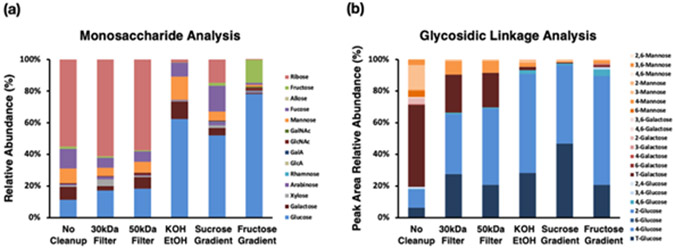
The cell glycogen extraction method was optimized based on the (a) monosaccharide composition analysis which characterized the absolute abundances of 14 monosaccharides and (b) glycosidic linkage analysis of the extracted samples which characterized the relative abundances of 21 glycosidic linkages.
The pellet obtained from the 50,000 × g ultracentrifugation was analyzed without cleanup as a control to compare with the glycogen extraction methods. The monosaccharide composition analysis revealed the presence of ribose, fucose, mannose and galactose in the pellet mixture, which potentially originated from RNA and glycoprotein sources. The linkage analysis also detected a large fraction of terminal and 2-linked galactose and 3- 6- and 3,6- linked mannose corresponding to the respective monosaccharide compositions. The analysis also yielded a 55.7% peak area ratio between T-Glc and 4-Glc. Due to the performance of the linkage analysis being largely based on the efficiency of permethylation and hydrolysis, the accuracy of the analysis would benefit from a cleaner reaction system. Therefore, multiple attempts at extracting and purifying glycogen from the complex cell mixture were conducted to ensure better results as described below.
The first cleanup method used MWCO centrifugal filters. The pellet was reconstituted in 400 μL of nanopure water and centrifuged in a 30 kDa or 50 kDa filter at 14,000 × g at 25°C. The sample was washed with 400 μL of nanopure water three times through the same centrifugation procedure. The final solution in the filter device was collected, dried and reconstituted for glycosidic linkage analysis. The 30 kDa and 50 kDa filtrations partially reduced the contamination of biomolecules containing ribose, galactose and mannose as compared to the control but still not efficiently.
The sucrose gradient29,30 composed of 25%, 50% and 75% sucrose solutions was then adapted for glycogen purification. The method provided moderate fractionation of the cellular mixture, which decreased the contamination from the RNA and glycoproteins as shown by lower ribose, galactose and mannose abundances. However, the sucrose from the gradient was found to remain in the samples after ethanol precipitation, where the glucose component of sucrose affected both the quantification and degree of branching analysis of glycogen. The ratio of T-Glc to 4-Glc (T-Glc/4-Glc) was 94.3%, determined to be much higher than the control and indicated the contamination of glucose from sucrose. Further removal of sucrose could be achieved by multiple washes with ethanol solution, however, with the risk of glycogen loss.
To minimize glucose interference, we replaced the sucrose with a fructose gradient (30%, 60% and 80%), which maintained the density and viscosity of sucrose43 for cell component fractionation by ultracentrifugation. The water solubility of fructose is nearly double that of sucrose thereby accelerating fructose removal during ethanol precipitation and significantly enhancing the glycogen cleanup for further reactions. The gradient composition was optimized to achieve a high glycogen recovery of 92.1%. The fructose gradient was effective in minimizing the contamination of glycogen as shown by the minimal signals for monosaccharides other than glucose. Fructose could still be detected, but was distinguishable from glucose due to the large separation in retention time. The degree of branching analysis resulted in a T-Glc/4-Glc ratio of 29.9%. Due to the purity of the acquired glycogen, the linkage analysis of glycogen further yielded quantitation of the bisecting 4,6-linked glucose residues. The ratio of the branched point 4,6-Glc versus 4-Glc may further yield structural information.
Additionally, minimal ribose was found in the enriched glycogen sample using the KOH method, indicating the RNA was degraded in the alkaline environment and removed during ethanol precipitation prior to glycogen analyses. The degree of branching analysis of the pellet yielded a 44.9% T-Glc/4-Glc ratio, higher than the result from HEPES buffer-fructose gradient method, indicating glycogen degradation in alkaline solution. Thus, the HEPES buffer-fructose gradient method outperformed the other methods and was employed in the following cell treatment experiments.
Quantification of glycogen
To determine the glycogen content with greater rigor, the absolute quantitation of glucose derived from glycogen was required. Therefore, efficient hydrolysis of glycogen polymer was crucial for accurate quantification. We investigated two methods, one with amyloglucosidase (AMG) and another with trifluoroacetic acid (TFA), to achieve the best hydrolysis efficiency and LC-MS detection. Different amounts of a commercial rabbit liver glycogen standard (5 pg to 5 μg, 85% purity) were hydrolyzed using the two methods, and the glucose content was quantified with LC-MS (Fig. 3). The LOD of AMG and TFA methods were below 5 pg of glycogen. The lowest amounts (LOQ) within the linear ranges of calibration curves of both methods was 5 ng of glycogen. The correlation coefficients of the calibration curves were 0.9996 and 0.9985 within the linear range from 5 to 1250 ng of glycogen. The two methods also shared similar coefficients of variation, 5% for the AMG method and 6% for the TFA method. With the regression line slope of 0.3 under the AMG method, a calibration curve of glycogen standards would be necessary to quantify unknown samples and resolve the biased signal response. Additionally, it would be difficult to search for the right type of glycogen standards that resemble the samples. In comparison, the TFA method had a regression line slope of 0.9, so the glycogen amount could be determined with much higher accuracy by direct quantification of the derivatized glucose. The variation between the two methods might arise from one step deviation in the AMG method workflow thus allowing for introduction of impurities, therefore the TFA method was selected for glycogen quantification in this work. Compared to previous methods,36 our method showed a 20-fold-lower limit of quantification, enabling the quantification of glycogen of limited sample size such as that from cells, and a wider linear range for comprehensive coverage of glycogen content differences among samples.
Figure 3.

TFA and AMG methods resulted in different LC-MS responses when same amount of rabbit liver glycogen was hydrolyzed and injected. The x-axis has been adjusted according to the purity of the standard. Both methods yielded comparable limits of quantification (5 ng), linear ranges (5-1250 ng) and coefficients of variance (5-6%). The regression equations for the two methods were y = 0.8669x – 0.0012 (R2 = 0.9996) and y = 0.3233x + 0.0300 (R2 = 0.9985). The error bars represent the standard deviations based on triplicates.
Commercial glycogen samples processed from rabbit liver, bovine liver, oyster and blue mussel of over 75%-85% purities were analyzed for method validation. The average glycogen recovery rate and coefficient of variance were 82% and 5%, respectively (Fig. 4a).
Figure 4.

Commercial glycogen standards were analyzed directly for their (a) glycogen contents (data adjusted according to the purities of the standards) and (b) degree of branching. Higher relative abundances of terminal glucose and 4,6-linked glucose compared to 4-linked glucose indicated a higher degree of branching.
Determination of the degree of branching
The degree of branching has been recognized to be an important property of glycogen. For example, in Lafora disease and Andersen disease, low branching frequency causes the glycogen particles to be insoluble, forming the pathological polyglucosan bodies.37 In this study, the degree of branching was characterized by comparing the relative abundances of terminal glucose and 4-glucose using the linkage analytical method. We propose that the greater the abundance of terminal glucose, the greater the branching.
In the glycosidic linkage analysis, the glycogen molecules were permethylated and hydrolyzed. The glucose units were differentiated based on the degree of permethylation (DoPe) of their corresponding hydrolysates. For example, a glucose unit at the terminus of a glycogen chain (T-Glc) was only linked at the anomeric hydroxyl position, and therefore had four free hydroxyl groups available for permethylation (DoPe = 4). After hydrolysis, the glucose was labelled with PMP at the anomeric end and subjected to LC-MS analysis. A glucose unit on the linear glycogen chain (4-Glc) was linked at both the anomeric and (1→4)-hydroxyl positions, so only three hydroxyl groups were methylated (DoPe = 3). The hydrolysis yielded a monomer with three methoxy and one hydroxyl groups. Similarly, a glucose unit at the branching point (4,6-Glc) of glycogen was linked at both (1→4)- and (1→6)-hydroxyl positions (DoPe = 2), resulting in a monomer with two methoxy and two hydroxyl groups after hydrolysis. These derivatized linkage residues with different DoPe were separated by reverse phase chromatography. Their relative abundance was calculated based on the relative peak area.
A higher relative abundance of terminal or branching glucose over linear-chain glucose indicated a higher branched structure, therefore, the ratios of terminal glucose to 4-linked glucose (T-Glc/4-Glc) and the abundance of branching 4,6-Glc normalized to 4-Glc (4,6-Glc/4-Glc) were examined to represent the degree of branching. Commercial glycogen standards from rabbit liver, bovine liver and oyster were examined to develop and validate this method. Amylopectin, a less branched storage polysaccharide found in plants, was also analyzed for comparison. The glycogen from rabbit liver was found to have the highest ratio and therefore the most branched with T-Glc/4-Glc ratio of 68.0% followed by glycogen from oyster and bovine liver (42.6% and 40.0%, respectively) (Fig. 4b). Amylopectin was the least branched with a ratio of 13.3%. The ratios of 4,6-Glc/4-Glc of the standards followed similar trends but did not correlate as strongly.
We further employed 1H NMR (which required 1000 times more material) to determine the branching frequency by comparing the ratios of intensities of protons at the α(1→6) and α(1→4) positions. The results showed similar trends thereby validating the use of T-Glc/4-Glc to measure the degree of branching (Fig. S1).
The ratio 4,6-Glc/4-Glc could also be an indicator of branching, however, the peak abundance of 4,6-Glc was significantly smaller than that of 4-Glc and T-Glc due to less efficient ionization and column retention and the ratio did not correlate as strongly with the ratio T-Glc/4-Glc. We therefore did not pursue the use of 4,6-Glc further.
Analysis of glycogen from insulin-stimulated and insulin-resistant Hep G2 cells
To demonstrate the sensitivity, specificity and robustness of the method, we analyzed the changes of Hep G2 cell glycogen content and structure under insulin treatments. Insulin is a vital hormone that regulates glucose homeostasis in human body. Insulin deficiency and resistance impair the insulin-mediated glucose uptake of cells, resulting in elevated blood glucose level (hyperglycemia) and eventual diabetes mellitus if left untreated.44 Diabetes has been recognized to affect the glycogen content in multiple human tissues, as both type 1 and type 2 diabetes lead to decreased glycogen level in liver and skeletal muscle tissues and increased glycogen level in heart and kidney tissues.12 However, little information is known regarding the structural change of these glycogen molecules (Table 1). Human hepatoma Hep G2 cells have been widely used as an alternative to primary hepatocytes to study glucose metabolism and insulin modulation because they express many differentiated hepatic functions such as glycogen synthesis and insulin signaling.27,45,46 We applied our methods to evaluate the effects of insulin concentrations on glucose metabolism and glycogen phenotypes using the Hep G2 cell model.
In order to establish insulin-stimulated and insulin-resistant cell models, Hep G2 cells were treated with 1 x 10⁴, 1 x 10³, 1 x 10², 10, 1 nM insulin in DMEM containing 25 mM D-glucose for 24 hrs. The cell glucose consumption was calculated by subtracting the glucose concentration of the medium at the end of the incubation from the initial concentration. The collected medium was diluted by 100 times and a 5 μL aliquot was used for the analysis. The glucose concentration was determined by free monosaccharide analysis performed in the same manner as the monosaccharide compositional analysis excluding the initial acid hydrolysis step. The glucose consumption of the cells increased with rising insulin concentration from zero to 10 nM and suddenly dropped when insulin reached 1 x 10² nM which simulated the state when the cell is receiving no insulin. The glucose consumption increased slowly when insulin concentration continued rising to 1 x 10⁴ nM (Fig. 5a). A similar trend was observed in the cell glycogen content as it increased significantly when the cells were stimulated with 10 nM insulin and dropped when the insulin level increased to 1 x 10² nM (Fig. 5b). In this experiment, the insulin-resistant state of the cell was triggered by insulin at concentration of 1 x 10² nM determined by the decrease in the cell’s response to insulin stimulation through glucose consumption and glycogenesis. The glycogen became significantly less branched under insulin stimulation condition (Fig. 5c). This trend has not been previously reported for human cells. One possible reason is that insulin stimulates glycogen synthesis through activation of glycogen synthase (GS) by inactivating glycogen synthase kinase 3 and protein kinase A that phosphorylate and inhibit GS,12 and during the process, the activity of glycogen branching enzyme (GBE) stays intact. Therefore, we hypothesized that more glycogen with less branching was generated due to normal GBE and elevated GS activity triggered by insulin. Within the nominal insulin concentration range of human blood (below 2 nM)47 we observed a lower average in glycogen branching with increasing insulin level. This observation of Hep G2 cell glycogen structural change appeared to have a similar trend with the result of a previous study on mouse-liver glycogen, showing that the liver glycogen from diabetic mice, a model for type 2 diabetes, had longer chains (lower branching frequency) on average than that of wild-type mice.48 The same trend was also shown in mouse skeletal muscle in models with overexpression of GS where the increase of GBE activity was insufficient compared with the increase of GS activity to produce normally branched glycogen.49 While the insulin level increased further to trigger the Hep G2 cell insulin-resistant state, the glycogen branching frequency increased, as an opposing trend to the insulin stimulation. There was a significant drop in degree of branching when insulin reached 1 x 10⁴ nM. The formation of “abnormal” glycogen could be attributed to the much higher-than-normal insulin level used for the treatment.
Figure 5.

Changes of Hep G2 cell (a) glucose consumption, (b) glycogen content and (c) glycogen degree of branching under treatments of different concentrations of insulin (increasing from left to right). Cell insulin-resistant states were identified when a less-than-expected cell response was noticed for the treatment and were labelled with red arrows. Statistical significance was determined with unpaired t-test (n = 3). *P < 0.05, **P < 0.01, ***P < 0.001. The data are presented as mean ± standard deviation.
Conclusion
We presented an optimized workflow that enabled the highly sensitive quantification and structural elucidation of cell glycogen. The method consisted of cell glycogen extraction through a novel fructose gradient fractionation, followed by absolute quantification measuring the glucose derived from glycogen, and degree of branching analysis comparing the relative abundance of glucose residues at the terminal and linear chain positions using UHPLC/QqQ-MS. The method improved the sensitivity in both glycogen quantification and structural analysis compared to existing protocols utilizing colorimetric methods for quantification, and NMR spectroscopy for degree of branching analysis, which largely reduced the required sample size while still providing accurate and precise information. We successfully applied the workflow to investigate the effect of insulin concentration on Hep G2 cell glycogen. We discovered that these cells produced more but less-branched glycogen under treatments with increasing levels of insulin before hitting the cell’s insulin-resistant state, at the point when the trend reversed and the cells produced less but higher-branched glycogen. Our method will be useful to study glycogen of small sample sizes such as cell and blood samples allowing for a better understanding of the role of glycogen in health and disease by developing cell glycogen as a biomarker to improve diagnosis, prognosis, and therapy.
Supplementary Material
Acknowledgments
Research reported was supported by General Medicine of the National Institutes of Health under the award numbers R01GM049077, R01 AG062240, R01 DK124193.
Footnotes
Declaration of interests
The authors declare that they have no known competing financial interests or personal relationships that could have appeared to influence the work reported in this paper.
Reference
- 1.Rocha Leão MHM In Encyclopedia of Food Sciences and Nutrition (Second Edition); Caballero B, Ed.; Academic Press: Oxford, 2003, DOI: 10.1016/B0-12-227055-X/00563-0. [DOI] [Google Scholar]
- 2.Engelking LR In Textbook of Veterinary Physiological Chemistry (Third Edition); Engelking LR, Ed.; Academic Press: Boston, 2015, DOI: 10.1016/B978-0-12-391909-0.50023-2. [DOI] [Google Scholar]
- 3.Ellingwood SS; Cheng A Biochemical and clinical aspects of glycogen storage diseases. Journal of Endocrinology 2018, 238 (3), R131, doi: 10.1530/JOE-18-0120. [DOI] [PMC free article] [PubMed] [Google Scholar]
- 4.Ashcroft FM; Rohm M; Clark A; Brereton MF Is Type 2 Diabetes a Glycogen Storage Disease of Pancreatic β Cells? Cell Metab 2017, 26 (1), 17, doi: 10.1016/j.cmet.2017.05.014. [DOI] [PMC free article] [PubMed] [Google Scholar]
- 5.Liu Q; Li J; Zhang W; Xiao C; Zhang S; Nian C; Li J; Su D; Chen L; Zhao Q et al. Glycogen accumulation and phase separation drives liver tumor initiation. Cell 2021, 184 (22), 5559, doi: 10.1016/j.cell.2021.10.001. [DOI] [PubMed] [Google Scholar]
- 6.Zois CE; Harris AL Glycogen metabolism has a key role in the cancer microenvironment and provides new targets for cancer therapy. Journal of Molecular Medicine 2016, 94 (2), 137, doi: 10.1007/s00109-015-1377-9. [DOI] [PMC free article] [PubMed] [Google Scholar]
- 7.Adeva-Andany MM; González-Lucán M; Donapetry-García C; Fernández-Fernández C; Ameneiros-Rodríguez E Glycogen metabolism in humans. BBA Clinical 2016, 5, 85, doi: 10.1016/j.bbacli.2016.02.001. [DOI] [PMC free article] [PubMed] [Google Scholar]
- 8.Burda P; Hochuli M Hepatic glycogen storage disorders: what have we learned in recent years? Current Opinion in Clinical Nutrition & Metabolic Care 2015, 18 (4). [DOI] [PubMed] [Google Scholar]
- 9.Shin YS Diagnosis of glycogen storage disease. Journal of Inherited Metabolic Disease 1990, 13 (4), 419, doi: 10.1007/BF01799499. [DOI] [PubMed] [Google Scholar]
- 10.Berg JM; Tymoczko JL; Gatto GJ; Stryer L Biochemistry; Eighth ed.; W.H. Freeman & Company, 2015. [Google Scholar]
- 11.Voet D; Voet JG; Pratt CW Fundamentals of Biochemistry: Life at the Molecular Level; Fifth ed.; Wiley, 2016. [Google Scholar]
- 12.Sullivan MA; Forbes JM Glucose and glycogen in the diabetic kidney: Heroes or villains? EBioMedicine 2019, 47, 590, doi: 10.1016/j.ebiom.2019.07.067. [DOI] [PMC free article] [PubMed] [Google Scholar]
- 13.Templeton M. Microdetermination of glycogen with anthrone reagent. J Histochem Cytochem 1961, 9, 670, doi: 10.1177/9.6.670. [DOI] [PubMed] [Google Scholar]
- 14.Schaubroeck KJ; Leitner BP; Perry RJ An optimized method for tissue glycogen quantification. Physiological Reports 2022, 10 (4), e15195, doi: 10.14814/phy2.15195. [DOI] [PMC free article] [PubMed] [Google Scholar]
- 15.Deng B; Sullivan MA; Chen C; Li J; Powell PO; Hu Z; Gilbert RG Molecular Structure of Human-Liver Glycogen. 2016, (1932-6203 (Electronic)). [DOI] [PMC free article] [PubMed] [Google Scholar]
- 16.Oe Y; Baba O; Ashida H; Nakamura KC; Hirase H Glycogen distribution in the microwave-fixed mouse brain reveals heterogeneous astrocytic patterns. Glia 2016, 64 (9), 1532, doi: 10.1002/glia.23020. [DOI] [PMC free article] [PubMed] [Google Scholar]
- 17.Sullivan MA; Li S; Aroney ST; Deng B; Li C; Roura E; Schulz BL; Harcourt BE; Forbes JM; Gilbert RG A rapid extraction method for glycogen from formalin-fixed liver. 2014, (1879-1344 (Electronic)). [DOI] [PubMed] [Google Scholar]
- 18.Nilsson GS; Gorton L; Bergquist K-E; Nilsson U Determination of the Degree of Branching in Normal and Amylopectin Type Potato Starch with 1H-NMR Spectroscopy Improved resolution and two-dimensional spectroscopy. Starch - Stärke 1996, 48 (10), 352, doi: 10.1002/star.19960481003. [DOI] [Google Scholar]
- 19.O’Shea MG; Samuel MS; Konik CM; Morell MK Fluorophore-assisted carbohydrate electrophoresis (FACE) of oligosaccharides: efficiency of labelling and high-resolution separation. Carbohydrate Research 1998, 307 (1), 1, doi: 10.1016/S0008-6215(97)10085-4. [DOI] [Google Scholar]
- 20.Sullivan MA; Li J; Li C; Vilaplana F; Stapleton D; Gray-Weale AA; Bowen S; Zheng L; Gilbert RG Molecular Structural Differences between Type-2-Diabetic and Healthy Glycogen. Biomacromolecules 2011, 12 (6), 1983, doi: 10.1021/bm2006054. [DOI] [PMC free article] [PubMed] [Google Scholar]
- 21.Matsui M; Kakut M; Misaki A Fine structural features of oyster glycogen: mode of multiple branching. Carbohydrate Polymers 1996, 31 (4), 227, doi: 10.1016/S0144-8617(96)00116-6. [DOI] [Google Scholar]
- 22.Yoo S-H; Keppel C; Spalding M; Jane J.-l. Effects of growth condition on the structure of glycogen produced in cyanobacterium Synechocystis sp. PCC6803. International Journal of Biological Macromolecules 2007, 40 (5), 498, doi: 10.1016/j.ijbiomac.2006.11.009. [DOI] [PubMed] [Google Scholar]
- 23.Au - Fermont L; Au - Szydlowski N; Au - Colleoni C Determination of Glucan Chain Length Distribution of Glycogen Using the Fluorophore-Assisted Carbohydrate Electrophoresis (FACE) Method. JoVE 2022, (181), e63392, doi: 10.3791/63392. [DOI] [PubMed] [Google Scholar]
- 24.Broberg S; Koch K; Andersson R; Kenne L A comparison between MALDI-TOF mass spectrometry and HPAEC-PAD analysis of debranched starch. Carbohydrate Polymers 2000, 43 (3), 285, doi: 10.1016/S0144-8617(00)00152-1. [DOI] [Google Scholar]
- 25.Amicucci MJ; Galermo AG; Nandita E; Vo T-TT; Liu Y; Lee M; Xu G; Lebrilla CB A rapid-throughput adaptable method for determining the monosaccharide composition of polysaccharides. International Journal of Mass Spectrometry 2019, 438, 22, doi: 10.1016/j.ijms.2018.12.009. [DOI] [Google Scholar]
- 26.Galermo AG; Nandita E; Barboza M; Amicucci MJ; Vo T-TT; Lebrilla CB Liquid Chromatography–Tandem Mass Spectrometry Approach for Determining Glycosidic Linkages. Analytical Chemistry 2018, 90 (21), 13073, doi: 10.1021/acs.analchem.8b04124. [DOI] [PMC free article] [PubMed] [Google Scholar]
- 27.Huang Q; Chen L; Teng H; Song H; Wu X; Xu M Phenolic compounds ameliorate the glucose uptake in HepG2 cells' insulin resistance via activating AMPK: Anti-diabetic effect of phenolic compounds in HepG2 cells. Journal of Functional Foods 2015, 19, 487, doi: 10.1016/j.jff.2015.09.020. [DOI] [Google Scholar]
- 28.Kim JJY; Tan Y; Xiao L; Sun Y-L; Qu X Green Tea Polyphenol Epigallocatechin-3-Gallate Enhance Glycogen Synthesis and Inhibit Lipogenesis in Hepatocytes. BioMed Research International 2013, 2013, 920128, doi: 10.1155/2013/920128. [DOI] [PMC free article] [PubMed] [Google Scholar]
- 29.Sullivan MA; Powell PO; Witt T; Vilaplana F; Roura E; Gilbert RG Improving size-exclusion chromatography separation for glycogen. Journal of Chromatography A 2014, 1332, 21, doi: 10.1016/j.chroma.2014.01.053. [DOI] [PubMed] [Google Scholar]
- 30.Sullivan MA; Vilaplana F; Cave RA; Stapleton D; Gray-Weale AA; Gilbert RG Nature of α and β Particles in Glycogen Using Molecular Size Distributions. Biomacromolecules 2010, 11 (4), 1094, doi: 10.1021/bm100074p. [DOI] [PubMed] [Google Scholar]
- 31.Amicucci MJ; Nandita E; Galermo AG; Castillo JJ; Chen S; Park D; Smilowitz JT; German JB; Mills DA; Lebrilla CB A nonenzymatic method for cleaving polysaccharides to yield oligosaccharides for structural analysis. Nat Commun 2020, 11 (1), 3963, doi: 10.1038/s41467-020-17778-1. [DOI] [PMC free article] [PubMed] [Google Scholar]
- 32.Xu G; Amicucci MJ; Cheng Z; Galermo AG; Lebrilla CB Revisiting monosaccharide analysis – quantitation of a comprehensive set of monosaccharides using dynamic multiple reaction monitoring. Analyst 2018, 143 (1), 200, doi: 10.1039/C7AN01530E. [DOI] [PMC free article] [PubMed] [Google Scholar]
- 33.Amicucci MJ; Nandita E; Galermo AG; Castillo JJ; Chen S; Park D; Smilowitz JT; German JB; Mills DA; Lebrilla CB A nonenzymatic method for cleaving polysaccharides to yield oligosaccharides for structural analysis. Nature Communications 2020, 11 (1), 3963, doi: 10.1038/s41467-020-17778-1. [DOI] [PMC free article] [PubMed] [Google Scholar]
- 34.Galermo AG; Nandita E; Castillo JJ; Amicucci MJ; Lebrilla CB Development of an Extensive Linkage Library for Characterization of Carbohydrates. Analytical Chemistry 2019, 91 (20), 13022, doi: 10.1021/acs.analchem.9b03101. [DOI] [PMC free article] [PubMed] [Google Scholar]
- 35.Fernandez C; Rojas Cc Fau - Nilsson L; Nilsson L Size, structure and scaling relationships in glycogen from various sources investigated with asymmetrical flow field-flow fractionation and 1H NMR. (1879-0003 (Electronic)). [DOI] [PubMed] [Google Scholar]
- 36.Fuller M; Duplock S; Turner C; Davey P; Brooks DA; Hopwood JJ; Meikle PJ Mass spectrometric quantification of glycogen to assess primary substrate accumulation in the Pompe mouse. Analytical Biochemistry 2012, 421 (2), 759, doi: 10.1016/j.ab.2011.12.026. [DOI] [PubMed] [Google Scholar]
- 37.Sullivan MA; Nitschke S; Skwara EP; Wang P; Zhao X; Pan XS; Chown EE; Wang T; Perri AM; Lee JPY et al. Skeletal Muscle Glycogen Chain Length Correlates with Insolubility in Mouse Models of Polyglucosan-Associated Neurodegenerative Diseases. Cell Reports 2019, 27 (5), 1334, doi: 10.1016/j.celrep.2019.04.017. [DOI] [PMC free article] [PubMed] [Google Scholar]
- 38.Stetten M; Katzen H; Stetten D METABOLIC INHOMOGENEITY OF GLYCOGEN AS A FUNCTION OF MOLECULAR WEIGHT. Journal of Biological Chemistry 1956, 222 (2), 587, doi: 10.1016/S0021-9258(20)89918-9. [DOI] [PubMed] [Google Scholar]
- 39.Stetten MR; Katzen HM Degradation of Glycogen by Alkali. Journal of the American Chemical Society 1961, 83 (13), 2912, doi: 10.1021/ja01474a029. [DOI] [Google Scholar]
- 40.Somogyi M. THE SOLUBILITY AND PREPARATION OF PHOSPHORUS- AND NITROGEN-FREE GLYCOGEN. Journal of Biological Chemistry 1934, 104 (2), 245, doi: 10.1016/s0021-9258(18)75759-1. [DOI] [Google Scholar]
- 41.Suzuki Y; Lanner C; Kim J-H; Vilardo Pier G; Zhang H; Yang J; Cooper Lori D; Steele M; Kennedy A; Bock Cheryl B et al. Insulin Control of Glycogen Metabolism in Knockout Mice Lacking the Muscle-Specific Protein Phosphatase PP1G/RGL. Molecular and Cellular Biology 2001, 21 (8), 2683, doi: 10.1128/MCB.21.8.2683-2694.2001. [DOI] [PMC free article] [PubMed] [Google Scholar]
- 42.Yan F; Zhang J; Zhang L; Zheng X Mulberry anthocyanin extract regulates glucose metabolism by promotion of glycogen synthesis and reduction of gluconeogenesis in human HepG2 cells. Food Funct 2016, 7 (1), 425, doi: 10.1039/c5fo00841g. [DOI] [PubMed] [Google Scholar]
- 43.Telis VRN; Telis-Romero J; Mazzotti HB; Gabas AL Viscosity of Aqueous Carbohydrate Solutions at Different Temperatures and Concentrations. International Journal of Food Properties 2007, 10 (1), 185, doi: 10.1080/10942910600673636. [DOI] [Google Scholar]
- 44.Rahman MS A. U. H. K. S. A. U. D. S. K. S. A. E. O. A. U. R. M. A. A. U. H.; Disease: An, U. In International Journal of Molecular Sciences, 2021; Vol. 22. [Google Scholar]
- 45.Molinaro A; Becattini B; Solinas G Insulin signaling and glucose metabolism in different hepatoma cell lines deviate from hepatocyte physiology toward a convergent aberrant phenotype. Scientific Reports 2020, 10 (1), 12031, doi: 10.1038/s41598-020-68721-9. [DOI] [PMC free article] [PubMed] [Google Scholar]
- 46.Donato MT; Tolosa L; Gómez-Lechón MJ In Protocols in In Vitro Hepatocyte Research; Vinken M; Rogiers V, Eds.; Springer New York: New York, NY, 2015, DOI: 10.1007/978-1-4939-2074-7_5. [DOI] [Google Scholar]
- 47.Elrick H; Stimmler L; Hlad CJJ; Arai Y Plasma Insulin Response to Oral and Intravenous Glucose Administration1. The Journal of Clinical Endocrinology & Metabolism 1964, 24 (10), 1076, doi: 10.1210/jcem-24-10-1076. [DOI] [PubMed] [Google Scholar]
- 48.Hu Z; Deng B; Tan X; Gan H; Li C; Nada SS; Sullivan MA; Li J; Jiang X; Li E et al. Diurnal changes of glycogen molecular structure in healthy and diabetic mice. Carbohydrate Polymers 2018, 185, 145, doi: 10.1016/j.carbpol.2018.01.003. [DOI] [PubMed] [Google Scholar]
- 49.Pederson BA; Csitkovits AG; Simon R; Schroeder JM; Wang W; Skurat AV; Roach PJ Overexpression of glycogen synthase in mouse muscle results in less branched glycogen. Biochemical and Biophysical Research Communications 2003, 305 (4), 826, doi: 10.1016/S0006-291X(03)00862-3. [DOI] [PubMed] [Google Scholar]
Associated Data
This section collects any data citations, data availability statements, or supplementary materials included in this article.