Abstract
At present, the cutting fabric thickness of the high-ply cutter can reach 100 mm, which requires high vacuum pressure resistance performance, and the fatigue reliability of the cutter body is an important indicator of cutting performance. In this paper, the cutter body was analyzed by finite element simulation, the equivalent structural stress and Von Mises stress at key positions were calculated separately. Then, the master S-N curve method and traditional method were used to evaluate fatigue damages at key locations of the cutter body, which are compared and analyzed with the fatigue damage of measured dynamic stress. The results show that the maximum fatigue damage calculated by the master S-N curve method is 0.223, which is the safest. it verifies the effectiveness and reliability of the master S-N curve method in evaluating the fatigue damage of the cutter body. Meanwhile, the fatigue damage of the three measuring points calculated by the three methods is all below 0.5, and it indicates that the design of the cutter body is reasonable. In addition, the master S-N curve method and equivalent structural stress method were first applied to the fatigue damage assessment of high-ply cutter body, which provides an efficient and high-precision approach for the anti-fatigue design of cutter body.
Keywords: Master S-N curve, Equivalent structural stress, Fatigue damage assessment, Finite element simulation, High-ply cutter
Subject terms: Mechanical engineering, Mathematics and computing
Introduction
High-ply and intelligent cutter is a high-tech product that organically integrates mechatronics technology, computer control technology, artificial intelligence control technology, network information technology, etc. It is widely used for cutting leather, specialized fabrics, and special fabrics in aviation, aerospace, military, automotive, clothing, and other industries. The maximum thickness of the fabric cut by the high-ply cutter can reach 100 mm, and the adsorption vacuum pressure is high. Therefore, the cutter body needs to have good pressure bearing function. In addition, the cost of high-ply cutter is high, and their body is a large welded structural component, the fatigue reliability of the body directly affects the overall performance and economic benefits.
The high-ply cutter body belongs to large welded structural components, and the weak positions of large welded structural components often appear in the weld toe area of the welded joint, especially in the weld at the stiffness mutation, which is more prone to fatigue cracks1–4. At present, there are many studies on the fatigue strength evaluation methods of welded joints, and the most commonly used method is still the nominal stress method recommended by various national standards, which calculates the fatigue strength of welded components by combining it with S-N curves of different grades of welded joints5–8. The BS standard9and IIW standard10provide rich fatigue resistance design data for steel and aluminum alloy welded joints; The AAR standard11provides a large amount of fatigue design data for steel welded joints. Although the relevant parameters and data provided by each standard consider the influence of residual stress, they do not separately provide the gradient effect of stress concentration on the welded joint12–17. Moreover, due to the geometric discontinuity of welded joints, it is difficult to obtain the nominal stress and elastic stress concentration coefficient at the weld joint from the finite element model18–20. In addition, due to the fact that the evaluation of weld grade is not only related to the geometric shape of the joint, but also to the load mode of the welded part, there is a certain subjectivity in selecting the S-N curve of the welded joint to calculate fatigue damage21–24.
In view of the above analysis, hot spot stress method uses linear extrapolation to solve the hot spot stress value at the weld toe of the welded joint25, and this method effectively solves the problem of weld toes being difficult to solve due to geometric discontinuities in welded joints26–28. However, in finite element analysis, this hot spot stress value is affected by the element type and mesh size29. Dong Pingsha30proposed a fatigue strength evaluation method based on the combination of equivalent structural stress and principal S-N curve. This new method is given from the perspective of force balance, so stress is not affected by the size and type of elements. This method has been widely used for fatigue life assessment of products such as aviation31,32, railway vehicles33,34, and ships35,36, etc37,38. Meanwhile, it has been included in ASME standards39. However, this method has not yet been applied to the fatigue strength assessment of high-ply cutter.
In order to provide a highly accurate fatigue damage assessment method for the cutter body and a reference for the anti-fatigue design of the high-ply cutter. In this paper, based on the characteristics of high negative pressure and high requirements for the rigidity and strength of high-ply cutter, the finite element model of the cutter body with the contour of the weld is established and simulated by finite element method. Then, according to the finite element simulation results, the positions of stiffness mutation are determined, and the equivalent structural stress at that positions are calculated. Finally, traditional fatigue damage assessment methods, master S-N curve method, and dynamic stress test method were used to evaluate the fatigue damage of key positions on the cutter body, and the fatigue damage results were compared and analyzed.
Theoretical background
Structural stress method
Due to the gap in the weld toe, the stress distribution of the weld along the thickness direction is nonlinear, so it is difficult to solve the stress distribution directly. This nonlinear stress was decomposed into structural stress and notch stress in literature40. Although the notch stress contains the nonlinear part, it is independent of the external force and is in self-equilibrium. However, the structural stress is only related to external forces and does not consider the influence of nonlinear stress. Its value is the sum of membrane stress and bending stress, and the mathematical expression is
 |
1 |
Where  is the structural stress,
  and
and  are the membrane stresses and bending stresses along the plate thickness, respectively.
When the plate thickness is given, the uniformly distributed membrane stress and the bending stress in the section are:
 |
2 |
Where t is the plate thickness,  is the y-direction line force of the unit welding wire,
  is the line moment around the x-axis.
Bring formula (2) into formula (1), the equation can be obtained
 |
3 |
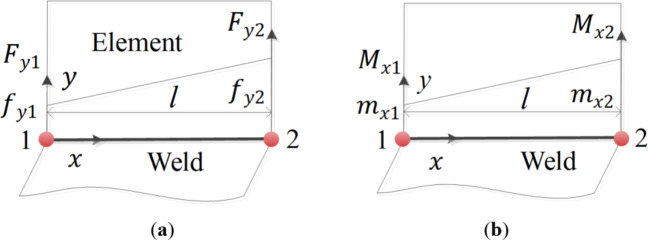
In the finite element simulation analysis, the distributed load on the element edge is converted to the node, and the structural stress method needs to transform the nodal force and moment obtained by the finite element into line force and line moment. When the equivalent structural stress method is applied to the plate-shell finite element model, the stress state of individual element is shown in Fig. 1.
Fig. 1.
Schematic representation of the line forces and line moments for individual element (a) line force and (b) line moment.
Where l is the length of individual element,  and
and  are the nodal forces of nodes 1 and 2 in the y-direction,
  and
and  are the line forces of nodes 1 and 2 in the y-direction,
  and
and  are the line moments of nodes 1 and 2 around the x-axis,
  and
and  are the line moments of nodes 1 and 2 around the x-axis.
According to Fig. 1, the force balance equation and moment balance equation are established from the force state of the element:
 |
4 |
 |
5 |
By performing inverse transformations on formulas (4) and formulas (5), then bring them into formula (3), it can be concluded that:
 |
6 |
Generally, when a section of weld is divided into n elements, the node number is from 1 to n, the distance of each node on the welding line is  to
to  , and the structural stress equation can be written as:
 |
7 |
where
 |
8 |
Master S-N curve method
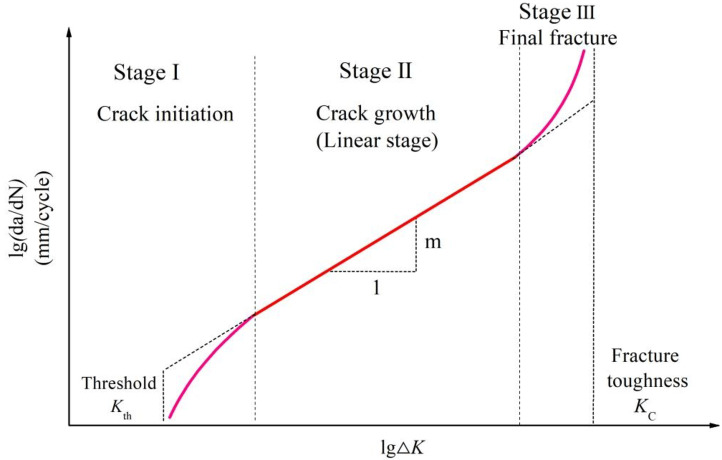
Fatigue crack growth can be divided into three stages: crack initiation stage, crack growth stage and final fracture stage41, as shown in Fig. 2. Paris crack growth rate can been unified into the following formula:
 |
9 |
Fig. 2.
Schematic diagram of three-stage fatigue crack growth.
Where a is crack length; N is number of endurance cycles;  is the stress strength factor amplification factor caused by the weld toe notch; n is the crack extension index of short crack extension stage, the empirical value is 2; m is the crack extension index of conventional Paris equation, the value is 3.6; C is crack extension parameter of the material;
  is the stress strength factor of the plate edge crack tip, and its value can be obtained by the formula (10).
 |
10 |
Where,  and
and  are the dimensionless weight functions determining the range of stress strength factors when membrane stress and bending stress alone, respectively.
  and
and  are obtained by formula (11) and formula (12).
 |
11 |
 |
12 |
By integrating formula (9), the prediction expression for fatigue life from short crack to penetrating plate is
 |
13 |
I(r) is a dimensionless function of the load bending ratio r, and its mathematical expression is
 |
14 |
In the welded structure, for the semi-elliptic crack propagation and a displacement controlled condition, the following formula can be obtained.
 |
15 |
From the above analysis, the equivalent structural stress expression is
 |
16 |
Combining formula (16), the constant in formula (13) needs to be corrected using a large amount of experimental data. The corrected formula can be expressed as
 |
17 |
Where  and hare experimental constants, which can be obtained in reference42.
The fatigue assessment method of BSI standard
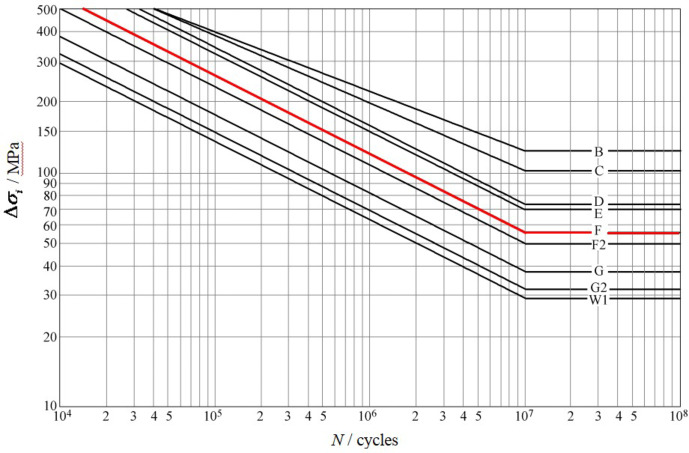
“Guide to fatigue design and assessment of steel products”9 is the most representative of the anti-fatigue design and evaluation methods based on nominal stress, which is widely used for fatigue strength assessment of welded joints in railway vehicles, automobiles, aerospace, bridges, and other industries. The S-N curve in this standard was obtained through a large number of fatigue tests, and the S-N curve considers the effects of local stress concentration, maximum allowable discontinuity in size and shape, and welding process effects, etc43. This standard provides S-N curves at different levels, as shown in Fig. 3. The specific welding joint details and fatigue performance parameters can refer to this standard, the F-level parameters (m = 3, Sr=40 MPa) of T-joint is used for the fatigue damage assessment of the high-ply cutter body in this paper.
Fig. 3.
S-N curves of BSI standard.
where  is the stress range; N is the number of endurance cycles.
The fatigue resistance design and evaluation method of steel structures given in this standard is based on the Palmgren-Miner cumulative damage theory, and the damage ratio is defined as:
 |
18 |
where  is the number of cycles with stress range
  in the load spectrum;
  is the total number of cycles that lead to structural damage when the stress range is
  ;
;  is the stress range when the evaluation point is
  ; m is the slope of the S-N curve.
Applicability of master S-N curve approach in high-ply cutter
The structure of high-ply cutter body and loading method
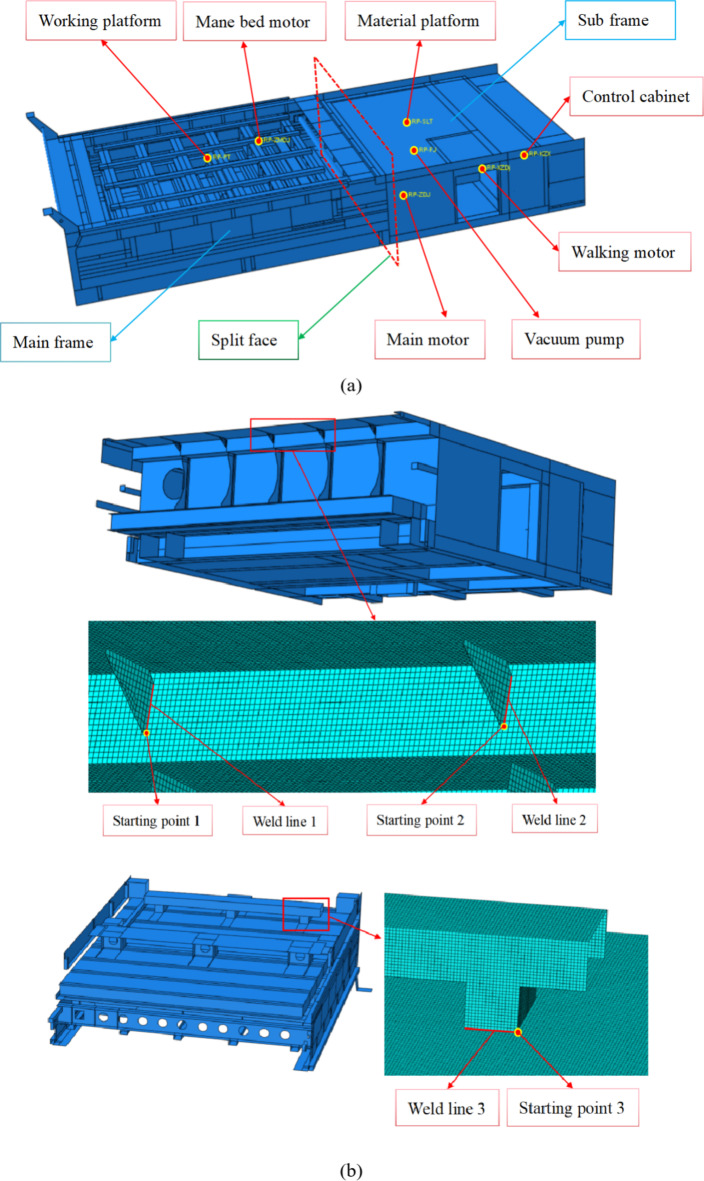
The high-ply cutter body is all-steel welded structure, it mainly consists of the main frame and sub frame, which is shown in Fig. 4(a). Meanwhile, the split face, the main platform, the control cabinet, and the installation positions of vacuum pump, main motor, mane bed motor, walking motor are shown in Fig. 4(a).
Based on design experience and finite element simulation results of similar cutter bodies, the fatigue strength analysis of the three key welds is focused in this article, their weld lines and welding starting points are shown in Fig. 4(b). In order to better simulate the stress state at the weld, the contour of the weld at this location needs to be considered in FEM model. Taking into account the computational complexity, accuracy, and actual situation of the entire structure, the modeling quality control of the three welds meets the requirements of ASME standard.
Fig. 4.
High-ply cutter body. (a) Main structures and installation positions of key components and (b) Weld line and welding starting point of key welds.
The material used for the cutter body is Q235B, and its chemical compositions and mechanical properties are shown in Tables 1 and 2, respectively44.
Table 1.
Chemical compositions of Q235B.
| Element (%) | C | Si | Mn | P | S |
|---|---|---|---|---|---|
| Q235B | ≤ 0.20 | ≤ 0.35 | ≤ 1.40 | ≤ 0.045 | ≤ 0.045 |
Table 2.
Mechanical properties of Q235B.
| Performance index | Lower yield strength(MPa) | Tensile strength (MPa) | Elongation after fracture (%) | Impact property (J) |
|---|---|---|---|---|
| Q235B | 235 | 370 ~ 500 | 26 | 27 |
The load position and constraint position of the finite element model are determined based on the actual working cavity vacuum pressure and the weight of each main functional component. The load under normal cutting conditions is shown in Table 3, and the corresponding force positions are shown in Fig. 4(a).
Table 3.
The load under normal cutting conditions.
| Number | Load name | weight |
|---|---|---|
| 1 | Vacuum pressure | 0.025 (MPa) |
| 2 | Working platform | 500 (kg) |
| 3 | Mane bed motor | 60 (kg) |
| 4 | Material platform | 150 (kg) |
| 5 | Control cabinet | 200 (kg) |
| 6 | Main motor | 300 (kg) |
| 7 | Vacuum pump | 200 (kg) |
| 8 | Walking motor | 26 (kg) |
Stress comparison analysis
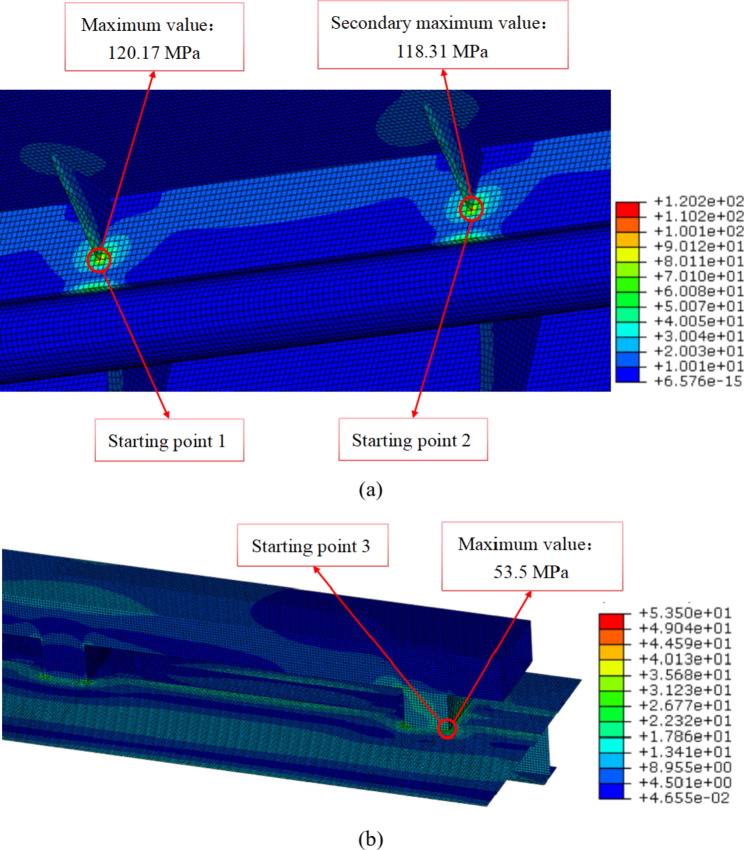
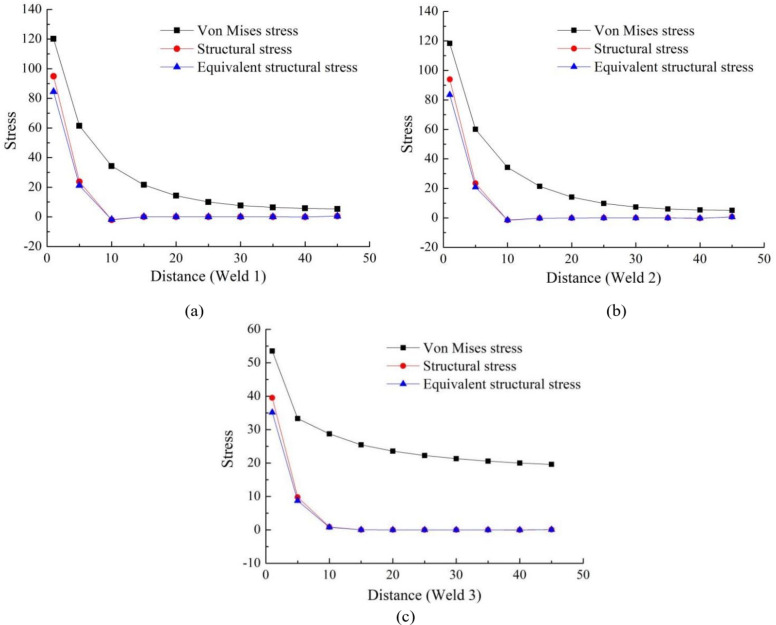
According to the finite element simulation results of cutter body, the Von Mises stresses of three starting points are shown in Fig. 5. Meanwhile, the Von Mises stresses of the three welds are extracted, and the structural stresses and equivalent structural stresses of the three welds are calculated, which are shown in Fig. 6. According to the Fig. 6, The following conclusions can be drawn:
Fig. 5.
The local maximum stresses of three starting points. (a) point 1 and point 2 and (b) point 3.
Fig. 6.
The stresses distribution of welds. (a) Weld 1, (b) Weld 2 and (c) Weld 3.
On the whole, the stresses variation trends of the three welds are basically the same, gradually decreasing from the starting point. According to the positions of the three welds in Fig. 4(b), it can be seen that the starting points of three welds are all stiffness mutation positions. Therefore, the stiffness mutation is the main reason for the high stresses of the welds, especially for weld 1 and weld 2. In addition, the stress distribution of the three welds is that Von Mises stress is the highest, followed by structural stress, and equivalent structural stress is the lowest.
According to Fig. 6 (a) and Fig. 6 (b), the three types of stresses in weld 1 and weld 2 are relatively similar, due to the fact that the external dimensions and functions of the two support plates are the same and the distance is relatively close. Meanwhile, the stress of the two welds is relatively high at the starting point, which requires special attention in fatigue strength assessment.
According to Fig. 6 (c), compared to the stress of weld 1 and weld 2, the stress of weld 3 is relatively low. However, during the loading and unloading of the cutter body, the rectangular steel is an important connector connected to the crane cable, and its working condition is relatively harsh. Therefore, the point of maximum stress on weld 3 needs to be paid special attention.
Fatigue damage analysis
According the master S-N curve method, the equivalent structural stress of the three welds in Fig. 6 is substituted into formula (16), and the fatigue damage of the three welds can be obtained, as shown in Fig. 7.
Fig. 7.
The fatigue damage of three welds.
According to the Fig. 7, the fatigue damage of the three welds did not exceed 0.25, especially when the distance exceeded 5 mm, the fatigue damage was below 10−4, which meets the design requirements. In addition, the fatigue damages of weld 1 and weld 2 at starting points is 0.23 and 0.22, respectively, and weld 1 is slightly larger than weld 2. It indicates that the support plate near the air outlet is required to withstand a greater negative pressure.
Discussion
Dynamic stress test
In order to verify the applicability of the main S-N curve method and traditional fatigue damage assessment methods in the anti-fatigue design of cutters, the dynamic stress test was conducted.
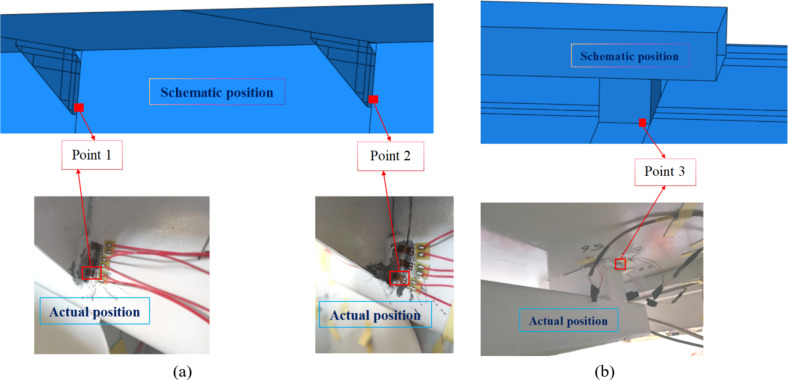
According to the calculation results of finite element simulation, in order to avoid the welding arc starting position, all three measuring points are at a distance of 5 mm from the starting point, as shown in Fig. 8. For ease of description, “measuring point” is abbreviated as “point”. The 120 strain gauges are arranged in a full bridge to eliminate the influence of environmental temperature and test wire resistance on the data signal. Meanwhile, in order to ensure the integrity of the experimental data, the sampling frequency was set to 105 Hz. The experimental duration is 10 days.
Fig. 8.
The schematic diagrams and measuring points’ positions (a) Point 1, Point 2 and (b) Point 3.
Stress amplitude spectrum
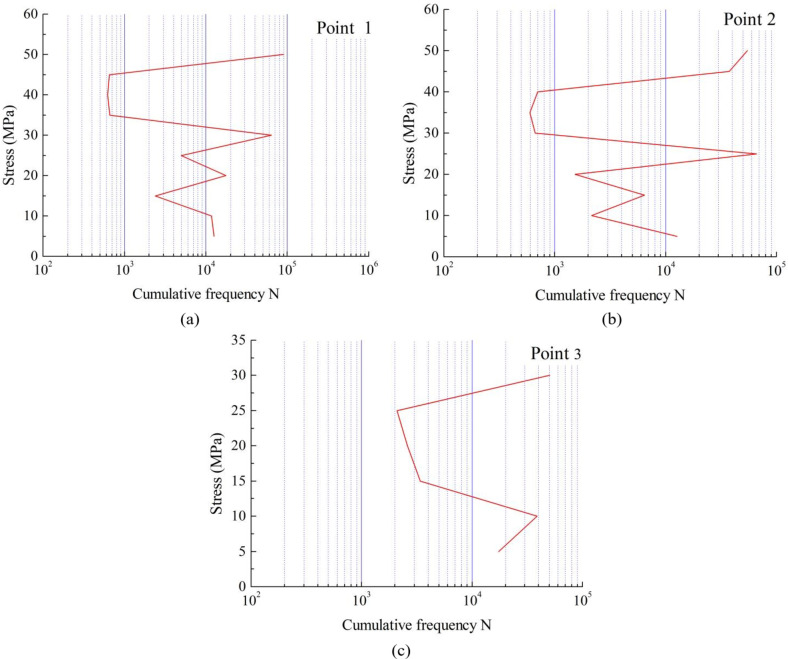
The measured data of the cutter body have been treated by glitch signal processing, zero drift processing removal, and interference filtering. Then, the rainflow counting method is used to perform mathematical statistics on the stress time history, and an equivalent 1-year stress amplitude spectrum is compiled. The influence of small amplitude stress is ignored during data processing, and the stress amplitude spectrum of three key measuring points are finally obtained, as shown in Fig. 9.
Fig. 9.
The stress spectrum curves of (a) Point 1, (b) Point 2 and (c) Point 3.
According to the Fig. 9, The following conclusions can be drawn:
On the whole, the three points all showed the maximum cumulative frequency at two specific stress points. The reason for this is that according to the specific cutting fabric and thickness, there are two working states in the high-ply cutter during operation, namely two different vacuum pressure. It results in the main cumulative frequency being concentrated on two specific stresses.
According to Fig. 9(a) and Fig. 9(b), we can see that the variation trends of the two stress amplitude spectrum are similar, but the overall stress amplitude spectrum of point 2 is smaller than that of point 1. Figure 9(b) is equivalent to moving Fig. 9(a) downward and to the right as a whole. This phenomenon indicates that not only is the overall stress at point 2 smaller than that at point 1, but the number of cycles at the same stress is also smaller than that at point 1.
According to Fig. 9(c), compared to points 1 and 2, the overall stress at point 3 is smaller and its cumulative frequency is similar to point 2, but the minimum value is slightly higher than the other two points. It can be seen that the dynamic stress of point 3 is mainly concentrated between 10 MPa-30 MPa in actual work, and indicating that the fatigue damage at this position is relatively small under normal working conditions.
Fatigue damage evaluation
According to the finite element simulation results of cutter body, the Von Mises stresses of the three key points are extracted, and combining the load spectrum of high-ply cutter, S-N curve and Miner’s linear cumulative damage theory, the fatigue damages of three key points with Von Mises stresses have been calculated, as shown in Table 4. According to the stress amplitude spectrum shown in Fig. 9, S-N curve in the BS7608 standard and Miner’s linear cumulative damage theory, the design life of high-ply cutter is 30 years, so the fatigue damage corresponding to the measured stress spectrum is equivalent to 30 years of fatigue damage, as shown in Table 4. In addition, fatigue damages of three key points with master S-N curve were extracted from Fig. 7, as shown in Table 4.
Table 4.
Fatigue damage at three points.
| Measuring point | 1 | 2 | 3 |
|---|---|---|---|
| Master S-N curve | 0.223 | 0.215 | 1.44E-02 |
| Von Mises stress method | 0.217 | 0.155 | 1.17E-03 |
| Measured stress spectrum | 0.193 | 0.168 | 1.23E-02 |
In practical engineering applications, safety margins must be considered in the anti-fatigue design of welded structural components. According to reference45, the fatigue damage of welded structural components generally should not exceed 0.5. According to Table 4, The fatigue damage of the three measuring points calculated by the three methods is all below 0.5, and it indicates that the design of the cutter body is relatively reasonable.
According to Table 4, the fatigue damage of the three points calculated by master S-N curve is higher than that obtained by the other two methods, which indicates that master S-N curve is more safety in evaluating the fatigue damage of the high-ply cutter body. Due to the fact that all three measuring points are 1 mm away from the arc starting points of the welds, and the points of both simulation methods are located at the starting point (which are stiffness mutation points) of the weld, which leads to higher fatigue damage obtained by simulation methods than measured. In addition, in the fatigue damage of Von Mises stress method, the stresses at point 1 and point 2 are similar, but there is a significant difference in fatigue damage values. The reason is that the load cycles at point 2 is smaller than that at point 1.
Conclusions
The structural stress method and master S-N curve method is first applied to fatigue damage assessment of the high-ply cutter body, and the calculation process is systematically given in this paper.
The fatigue damages obtained by the master S-N curve, Von Mises stress method, measured stress spectrum did not exceed 0.5, and the fatigue damage at measuring point 1 and point 2 was around 0.2. In the subsequent structural optimization, the positions need to be paid special attention.
By comparing and analyzing the fatigue damages obtained by three methods (the master S-N curve, Von Mises stress method, measured stress spectrum), it can be seen that the fatigue damage calculated by the master S-N curve method is the safest. This indicates that the master S-N curve method is feasible for evaluating the fatigue damage of high-ply cutter body, and it can provide a basis for the anti-fatigue design and structural optimization of high-ply cutters.
Author contributions
Wenfei Liu and Bo Chen wrote the main manuscript text and supervised the project; Chao Zhou reviewed the manuscript; Wei Li and Hengji Yu carried out the experiments and data processing. All authors contributed to the discussion.
Funding
This research has been sponsored by the Zhejiang province public welfare technology application research project, China (Grant No. LGG22E050014).
Data availability
The datasets used and/or analysed during the current study available from the corresponding author on reasonable request.
Declarations
Competing interests
The authors declare no competing interests.
Footnotes
Publisher’s note
Springer Nature remains neutral with regard to jurisdictional claims in published maps and institutional affiliations.
References
- 1.Collins, J. A. Failure of Materials in Mechanical Design (Jone Wiley &Sons, 1981). [Google Scholar]
- 2.Koutiri, I., Bellett, D. & Morel, F. The effect of mean stress and stress biaxiality in high-cycle fatigue. Fatigue Fract. Eng. M. 41 (2), 440–455 (2018). [Google Scholar]
- 3.Liu, W. F. et al. Research and application of nodal stress correction at stiffness mutation position for fatigue life evaluation. Trans. Can. Soc. Mech. Eng.47, 398–409 (2023). [Google Scholar]
- 4.Zhang, H. P., Liu, H. J. & Kuai, H. D. Stress intensity factor analysis for multiple cracks in orthotropic steel decks rib-to-floorbeam weld details under vehicles loading. Eng. Fail. Anal.164, 108705 (2024). [Google Scholar]
- 5.Zhao, W. Z., Li, X. W. & Dong, P. S. Theory and Method of anti-fatigue Design for Welded Structures (China machine, 2017). [Google Scholar]
- 6.Dimitrios, G. & Pavlou The theory of the S-N fatigue damage envelope: generalization of linear, double-linear, and non-linear fatigue damage models. Int. J. Fatigue. 110, 204–214 (2018). [Google Scholar]
- 7.Al-Assaf, Y. & Kadi, H. E. Fatigue life prediction of composite materials using polynomial classifiers and recurrent neural networks. Compos. Struct.77 (4), 561–569 (2007). [Google Scholar]
- 8.Liu, W. F. et al. Improved maximum likelihood method for P-S-N curve fitting method with small number specimens and application in T-welded joint. Sci. Rep-UK. 13 (1), 19202 (2023). [DOI] [PMC free article] [PubMed] [Google Scholar]
- 9.British Standard Institute. BS7608: 2014 + A1:2015, Guide to Fatigue Design and Assessment of Steel Products (BSI, 2015). [Google Scholar]
- 10.IIW Joint Working Group. XIII-2151r1-07/XV-1254r1-07 IIW Document Recommendations for Fatigue Design of Welded Joints and Components (IIW IIS, 2007). [Google Scholar]
- 11.Association of American Railroads. Manual of Standards and Recommended Practices Section C-Part II, Design, Fabrication, and Construction of Freight Cars (AAR, 2007).
- 12.Barsoum, Z., Khurshid, M. & Barsoum, I. Fatigue strength evaluation of friction stir welded aluminium joints using the nominal and notch stress concepts. Mater. Des.41, 231–238 (2012). [Google Scholar]
- 13.Park, Y. K. & Shin, J. G. Fatigue strength evaluation of a welded structure by a concentrated load close to the welded joint. J. Mech. Sci. Technol.31 (4), 1789–1796 (2017). [Google Scholar]
- 14.Xiao, Z. G., Chen, T. & Zhao, X. L. Fatigue strength evaluation of transverse fillet welded joints subjected to bending loads. Int. J. Fatigue. 38, 57–64 (2012). [Google Scholar]
- 15.Gyoko, O. Effective stress and fatigue life prediction with mean stress correction models on a ferritic stainless steel sheet. Int. J. Fatigue 157. (2022).
- 16.Warren, A. P. et al. The effect of phase transformations on predicted values of residual stresses in welded ferritic components. Mater. Sci. Forum 524–525 :827–832. (2006).
- 17.Li, F. L. et al. Enhancing impact resistance of hybrid structures designed with triply periodic minimal surfaces. Compos. Sci. Technol.245, 1–17 (2024). [Google Scholar]
- 18.Mahur, B. P., Bhardwaj, Y. K. & Bansal, V. Review on finite element analysis for estimation of residual stresses in welded structures. Materials today: proceedings. 4(9):10230–10234. (2017).
- 19.Fricke, W. & Kahl, A. Numerical and experimental investigation of Weld root fatigue in fillet-welded structures. Int. Shipbuild. Prog. 55 (1–2), 29–45 (2008). [Google Scholar]
- 20.Sonsino, C. M. Effect of residual stresses on the fatigue behaviour of welded joints depending on loading conditions and weld geometry. Int. J. Fatigue. 31 (1), 88–101 (2009). [Google Scholar]
- 21.D’Angelo, L. & Nussbaumer, A. Estimation of fatigue S-N curves of welded joints using advanced probabilistic approach. Int. J. Fatigue. 97, 98–113 (2017). [Google Scholar]
- 22.Davide, L., Maljaars, J. & Snijder, H. H. Fitting fatigue test data with a novel S-N curve using frequentist and bayesian inference. Int. J. Fatigue. 105, 128–143 (2017). [Google Scholar]
- 23.Nguyen, N. T. & Wahab, M. A. The effect of undercut, misalignment and residual stresses on the fatigue behaviour of butt welded joints. Fatigue Fract. Eng. M. 19 (6), 769–778 (2007). [Google Scholar]
- 24.Ferro, P. & Berto, F. Quantification of the influence of residual stresses on fatigue strength of Al-alloy welded joints by means of the local strain energy density approach. Strength. Mater.48 (3), 426–436 (2016). [Google Scholar]
- 25.Lotsberg, I. & Sigurdsson, G. Hot spot stress S-N curve for fatigue analysis of plated structures. J. Offshore Mech. Arct.128 (4), 330–336 (2006). [Google Scholar]
- 26.Shiratsuchi, T. et al. The thickness effect of hot spot S-N curves for welded aluminum joints. Weld. World64(9). (2020).
- 27.Tomioka, N. et al. Effect of sheet thickness on fatigue strength of spot-welded joints. Trans. Soc. Automot. Eng. Japan. 49 (2), 492–497 (2018). [Google Scholar]
- 28.Man, Z. et al. Misalignment effect on the fatigue failure behavior of load-carrying cruciform welded joints. Int. J. Fatigue. 160, 106847 (2022). [Google Scholar]
- 29.Dong, P. S., Hong, J. K. & Jesus, A. M. P. Analysis of recent fatigue data using the structural stress procedure in ASME DIV2 rewrite. J. Press. Vess-T Asme. 129 (3), 355–362 (2007). [Google Scholar]
- 30.Dong, P. S. et al. Master S-N curve method for fatigue evaluation of welded components. Weld. Res. Council Bull.474, 1–44 (2002). [Google Scholar]
- 31.Wang, Y. R. et al. Method for notched fatigue life prediction with stress gradient. J. Aerosp. Power. 28 (6), 1208–1214 (2013). [Google Scholar]
- 32.Klemenc, J. & Nagode, M. Design of step-stress accelerated life tests for estimating the fatigue reliability of structural components based on a finite-element approach. Fatigue Fract. Eng. M. 44 (6), 1562–1582 (2021). [Google Scholar]
- 33.Liu, W. F. et al. Structural optimization of the heavy haul wagon body based on MPSO-BP algorithm. Trans. Can. Soc. Mech. Eng.45, 461–472 (2021). [Google Scholar]
- 34.Liu, W. F. et al. Research on stress intensity factor and fatigue crack propagation rate of the general-purpose gondola car body. Trans. Can. Soc. Mech. Eng.45, 297–307 (2021). [Google Scholar]
- 35.Dong, P. S. A Robust Structural Stress Method for Fatigue Analysis of Offshore/Marine structures. J. Offshore Mech. Arct.127 (1), 68–74 (2005). [Google Scholar]
- 36.Feng, L. et al. Simplified method for calculating ultimate bending moment of box girder. J. Harbin Eng. Univ.38, 351–355 (2017). [Google Scholar]
- 37.Zhang, Z. et al. A hybrid distribution characteristics of equivalent structural stress method for fatigue evaluation of welded structures. Int. J. Fatigue :179. (2024).
- 38.Liu, Z. et al. A developed fatigue analysis approach for composite wind turbine blade adhesive joints using finite-element submodeling technique. Eng. Fail. Anal.164, 108701 (2024). [Google Scholar]
- 39.Dong, P. S. et al. The Master S-N Curve Method: An Implementation for Fatigue Evaluation of Welded Component in the ASME B&PV Code Section VIII, Division 2 and API579-1/ASME FFS-1 (WRC Bulletin, 2010). [Google Scholar]
- 40.Dong, P. S. et al. A structural strain method for low-cycle fatigue evaluation of welded components. Int. J. Pres. Ves Pip.119, 39–51 (2014). [Google Scholar]
- 41.Pugno, N., Ciavarella, M. & Cornetti, P. A generalized Paris’ law for fatigue crack growth. J. Mech. Phys. Solids. 54 (7), 1333–1349 (2006). [Google Scholar]
- 42.Yaghoubshahi, M., Alinia, M. M. & Milani, A. S. Master S-N curve approach to fatigue prediction of breathing web panels. J. Constr. Steel Res.128, 789–799 (2017). [Google Scholar]
- 43.Liu, W. F. et al. The anti-fatigue design of 80 t depressed-center gondola car body. Processes10 (8), 1618 (2022). [Google Scholar]
- 44.GB/T 700. Carbon structural steels; Standardization administration: Beijing, China, (2006).
- 45.Huo, L. X. Fracture Behavior and Evaluation of Welded Structures (China machine, 2002). [Google Scholar]
Associated Data
This section collects any data citations, data availability statements, or supplementary materials included in this article.
Data Availability Statement
The datasets used and/or analysed during the current study available from the corresponding author on reasonable request.


