

Abstract
Studies have shown that drug targets with human genetic support are more likely to succeed in clinical trials. Hence, a tool integrating genetic evidence to prioritize drug target genes is beneficial for drug discovery. We built a genetic priority score (GPS) by integrating eight genetic features with drug indications from the Open Targets and SIDER databases. The top 0.83%, 0.28% and 0.19% of the GPS conferred a 5.3, 9.9 and 11.0-fold increased effect of having an indication, respectively. In addition, we observed that targets in the top 0.28% of the score were 1.7, 3.7 and 8.8-fold more likely to advance from phase I to phase II, III and IV, respectively. Complementary to the GPS, we incorporated the direction of genetic effect and drug mechanism into a directional version of the score called the GPS with direction of effect (GPS-DOE). We applied our method to 19,365 protein-coding genes and 399 drug indications and make all results available through a web portal.
INTRODUCTION
The cost of research and development of a new therapeutic has steadily increased over time and is estimated to cost billions of dollars1. This cost is mainly driven by the high number of clinical trial failures, primarily due to poor efficacy of the therapeutic1-3. These failures highlight inefficiencies in current preclinical and clinical models in drug development and highlight a critical need to improve the prioritization of drug candidates during the early stages of drug discovery.
Several studies have shown that drug indications with human genetic support are more likely to advance through clinical trials and be approved2,4,5. Human genetic support indicates that genetic variation naturally occurring in genes targeted by drugs can predict the resulting phenotypes when those drugs act on the genes and their corresponding proteins. Studies have shown that drugs with support from Mendelian loci and genome-wide association studies are twice as likely to be approved in clinical trials4,6. Furthermore, identifying the direction of genetic effect from these studies can give insight into the mechanism of target modulation required7. For example, the direction of genetic effect can be determined using the effect allele estimates from quantitative trait loci (QTL) studies and the identification of gain-of-function (GOF) and loss-of-function (LOF) variants.
Multiple levels of genetic support have been shown to be associated with drug indications and side effects8-10, suggesting that genetically-identified causal biological links are informative when choosing drug targets. As a result, there is currently intense interest in using human genetics to inform drug development programs. However, drug prioritization frameworks that incorporate direction of effect and leverage data from a wide array of genetic and functional resources, such as phenome-wide studies performed in electronic health record (EHR)-linked biobanks, rare coding variant associations, common variant associations, gene expression and protein expression, are lacking11-13. Furthermore, with advances in targeted gene editing, protein degradation and RNA interference therapeutics, prioritization of drug candidates beyond conventional drug targets is also needed.
In this study, we developed a genetic priority score (GPS) for 19,365 protein-coding genes and 399 drug indications based on the presence of genetic evidence for eight genetic features. We show that the GPS is enriched for drug indications and can effectively prioritize drug targets for a given drug indication. Furthermore, we show that drug indications supported by the GPS were more likely to progress through clinical trials. We developed a directional version called the GPS with direction of effect (GPS-DOE), that incorporates the direction of genetic effect and drug mechanism to inform the direction of pharmacological modulation. We ascertained the GPS and GPS-DOE for 14,899 genes and 399 drug indications and the results are publicly available at https://rstudio-connect.hpc.mssm.edu/geneticpriorityscore/.
RESULTS
Construction of the drug-genetic dataset
We built a GPS to inform drug target prioritization for a large number of genes and drug indications. We summarize the steps, data sources and filtering processes in Fig. 1. We used eight phenotype-specific features from three different types of human genetic evidence. This includes: 1) clinical variants: clinically relevant genetic variants and disease from ClinVar filtered by clinical significance and submission confidence (ClinVar) 13-15, disease causing and likely disease causing genes for human inherited diseases from the Human Gene Mutation Database (HGMD)16 and pathogenic gene annotation in Online Mendelian Inheritance in Man (OMIM)17, 2) coding variants: coding missense and pLOF single-variants (Single Variant) and gene burden tests (Gene Burden)18 in 394,841 individuals from the UK Biobank in the Genebass database19 3) genome-wide association loci: genes with a shared association between a GWA phenotype from the Pan-UK Biobank20 and an expression quantitative trait loci (eQTL phenotype),20 genes from genome-wide significant lead variants (P < 1 × 10⁻⁸) identified by the Open Targets Genetics “locus-to-gene” machine learning model with a score ≥ 0.5 (Locus2gene)21 and genes with a shared association between a GWA phenotype from the GWAS-catalog and a protein quantitative trait loci (pQTL Phenotype)22. We provide a detailed description of each genetic feature in the Methods and Table 1. For the discovery stage of the study, we used the Open Targets platform13 to extract data for drugs, gene targets and drug indications (Supplementary Table 1). We integrated the Open Targets drug dataset with the eight genetic features, as described in the Methods. We mapped the drug indications and the genetic phenotypes to phecode terms, a classification that defines clinically meaningful phenotypes from EHR data23. Following quality control (Methods), our integrated dataset comprised 1,213 drugs, 778 genes and 282 drug indications. For the validation stage of the study, we used the SIDER 4.1 resource24 to extract data for drug indications (Supplementary Table 1). We repeated the same mapping procedure described above in the Open Targets dataset. The resulting validation dataset comprised 733 drugs, 658 genes and 325 drug indications.
Fig. 1. Workflow to build the genetic priority score for drug indications.

A schematic diagram of the data sources and methodological steps to create the genetic priority score (GPS) and genetic priority score with direction of effect (GPS-DOE) for drug indications. OMIM, Online Mendelian Inheritance in Man; HGMD, Human Gene Mutation Database; eQTL, expression Quantitative Trait Loci; pQTL, protein Quantitative Loci; OT; Open Targets; DG, drug genetic; GPS, genetic priority score; GPS-DOE, genetic priority score with direction of effect.
Table 1.
Summary of the number of genes and phenotypes for genetic features in the Open Targets and SIDER datasets
| Open Targets | SIDER | ||||||
|---|---|---|---|---|---|---|---|
| Evidence Category |
Feature | Number of genes |
Number of phenotypes |
Mean number of phenotypes per gene (SD) |
Number of genes |
Number of phenotypes |
Mean number of phenotypes per gene (SD) |
| Clinical variants | ClinVar | 282 | 156 | 2.7(2.4) | 225 | 118 | 2.5(2.1) |
| HGMD | 638 | 218 | 4.7(4.8) | 533 | 196 | 4.4(4.2) | |
| OMIM | 386 | 248 | 9(7.5) | 316 | 225 | 8.4(6.8) | |
| Coding mutations | Gene Burden | 12 | 24 | 2.2(2.1) | 5 | 8 | 1.8(1.1) |
| Single Variant | 66 | 57 | 1.7(1.6) | 34 | 44 | 1.9(1.9) | |
| GWAS phenotypes | eQTL Phenotype | 223 | 105 | 2.7(5) | 180 | 97 | 2.8(4.7) |
| Locus2gene | 282 | 185 | 3.4(3.5) | 207 | 158 | 3.1(3.1) | |
| pQTL Phenotype | 196 | 70 | 3.7(4.9) | 123 | 55 | 3.3(4.9) | |
SD, standard deviation; OMIM, Online Mendelian Inheritance in Man; HGMD, Human Gene Mutation Database; eQTL, expression Quantitative Trait Loci; pQTL, protein Quantitative Trait Loci.
Association of genetic features with drug indications
We performed univariate association of each of the eight genetic features with drug indication, adjusting for phecode categories and the number of gene targets as covariates. We observed a significant association across all eight genetic features with drug indications (Fig. 2) (Supplementary Table 2). Furthermore, the strength of the majority of these associations increased across all predictors, except for Single Variant, when we restricted to drugs with one gene target (Supplementary Fig. 1) (Supplementary Table 2). We observed similar results among those features that had genetic evidence in the validation dataset (Supplementary Fig. 2) (Supplementary Table 3). Nearly all features were independent, with weak correlation observed between related groups of features and no significant correlations across feature categories (Supplementary Fig. 3). As a sensitivity analysis, we permuted the drug indication variable and performed the same logistic regression models for each genetic feature in the Open Target dataset. For 10,000 permutations, we obtained an expected null average OR of 1.0 and a controlled empirical false positive rate of approximately 5% for each genetic feature (Supplementary Table 4).
Fig. 2. Association of genetic features with drug indications in the Open Target dataset.

Shown is a forest plot of odds ratios (ORs) with 95% confidence intervals (CI) represented as circles and error bars. These ORs were calculated for each genetic feature with drug indications using a logistic regression model in the Open Target dataset (n= 919,809 independent drug-gene-phenotype combinations). The model included 14 phecode categories and the number of gene targets per drug, binarized into drugs with a single gene target and drugs with multiple gene targets, as covariates. The features are grouped by color according to their genetic evidence category. On the y-axis, the number of unique genes for each feature is recorded in red and the number of unique phenotypes is recorded in blue. We show associations with all genetic features with drug indications, with strong effects observed for Gene Burden, Single Variant and ClinVar. OMIM, Online Mendelian Inheritance in Man; HGMD, Human Gene Mutation Database; eQTL, expression Quantitative Trait Loci; pQTL, protein Quantitative Loci.
Construction of the GPS
We constructed the GPS based on the cumulative effects of the eight significant genetic features with drug indication. We used 80% of the data as the training set and applied a multivariable Firth logistic regression model of the eight genetic features with drug indication to obtain effect sizes from the association of each genetic feature with drug indication. Then, we used the remaining 20% of the data as the testing set to calculate the GPS as the sum of observations corresponding to a genetic feature, weighted by the effect size estimate of each of the genetic features with drug indication, obtained from the multivariable Firth model performed in the training set. We repeated the training and test steps five times with independent sets of the integrated drug genetic dataset in a five-fold cross-validation framework. Consistent effects of each genetic feature with drug indication were observed between the five cross-validated sets (Extended Data Fig. 1). Importantly, we observed that multiple genetic features with varying effects, rather than a single feature with a very strong effect, contributed to the highest genetic priority scores (Extended Data Fig. 2 and Extended Data Fig. 3). We repeated this analysis, restricting to drugs with one gene target and observed similar results (Extended Data Fig. 1).
Association of the high GPS extremes with drug indication
We evaluated the overall association of the GPS with drug indication. We observed that a standard deviation increase in the GPS resulted in a 2.7-fold increase in drug indication (95% confidence interval [CI] = 2.6 – 2.8, P < 2.2 × 10−308). Furthermore, we evaluated the association of the GPS within each cross-validated test set (Supplementary Table 5). Subsequently, we chose the beta coefficients from the Firth regression model in the cross-validated sample which yielded the maximum odds ratio (OR) to calculate the GPS in the SIDER dataset.
We next determined whether the extremes of a high GPS are more likely to yield a drug indication. In the Open Targets dataset, using 0.3 increment cutoffs of the GPS, we observed that the top 1.5%, 0.40% and 0.27% of the GPS (equivalent to a GPS greater than 0.9, 1.5 and 2.1) conferred 4.8, 8.8 and 9.7-fold increased effect of having a drug indication, respectively (Extended Data Fig. 4). We replicated these findings using the SIDER dataset, where we observed similar results: the top 0.83%, 0.28% and 0.19% of the GPS (equivalent to a GPS greater than 0.9, 1.5 and 2.1) conferred 5.3, 9.9 and 11.0-fold increased effect of having a drug indication, respectively (Fig. 3). As expected, as the GPS increased, the support from multiple genetic features also increased (Supplementary Table 6). For example, a GPS cutoff of 0.9, 1.5 and 1.2 corresponded to genetic support from an average of 1.7, 2.7 and 3.0 features in Open Targets and 1.9, 2.8 and 3.1 features in SIDER. Notably, we observed a range of increasing GPS for gene targets with one, two and three or more genetic features (Supplementary Table 7).
Fig. 3. Association of the genetic priority score at increments of 0.3 with drug indication in the SIDER dataset.

The association of increasing genetic priority scores with drug indications was investigated by binning the SIDER drug dataset (n=1,005,550 independent drug-gene-phenotype combinations) into 0.3 increments of the genetic priority score (GPS) and comparing genetic priority scores greater or equal to each increment with genetic priority scores equal to zero. For each bin, a logistic regression model was performed with drug indication as the outcome variable and the GPS bin as the predictor variable, adjusting for phecode categories as covariates and the number of gene targets per drug binarized into drugs with a single gene target and drugs with multiple gene targets. Odds ratios (ORs) with 95% confidence intervals (CI) are defined in the forest plot as circles and error bars. GPS, genetic priority score.
Analysis to evaluate the robustness of the GPS
We performed a series of analyses to evaluate the robustness of the GPS. First, we compared the associations with and without cancer-related phenotypes since cancer-related drugs primarily target the tumor microenvironment, rather than germline mutations25. We observed comparable odds ratios at each GPS increment with and without cancer-related phenotypes (Supplementary Fig. 4). Second, we stratified the GPS by phenotype category and observed significant variability among the 14 indication categories due in part to smaller sample sizes, with the strongest enrichments seen in the musculoskeletal, endocrine/metabolic and hematopoietic categories, similar to Nelson et al4 (Supplementary Fig. 5). Third, we evaluated the GPS with drug indications after restricting to drugs with only one gene target. We observed a stronger enrichment in both Open Targets and SIDER in drugs with one gene target (Extended Data Fig. 5). Fourth, we evaluated the GPS with drug indication as a function of indications with differing number of approved drugs. We demonstrate the GPS can adequately distinguish gene targets with a higher percentage of approved drugs (Supplementary Table 8). Fifth, we compared the performance of the GPS to the Locus2gene score, a score that prioritizes likely causal genes at a GWA loci and has been shown to be enriched for approved drug targets21 (Supplementary Table 9). The GPS exhibited stronger enrichments than the Locus2gene score at comparable thresholds. Sixth, we performed a leave-one-out analysis for each of the eight features to evaluate whether the GPS was overly affected by any one particular feature (Supplementary Fig. 6). Overall, the association of the GPS with drug indication was consistent across all cutoffs and features in the leave-one-out analysis; however, we observed larger error bars when the clinical variant features were each excluded for scores ≥ 1.8, due to a small number of observations in these groups. Finally, we simulated the impact of false negatives on the association of the GPS with drug indication by setting to zero a percentage of each genetic feature, where the genetic evidence had originally supported the main indication (Supplementary Fig. 7). We observed that as the percentage of false negatives increased, the association of the GPS with drug indications decreased.
Simulation of drug target prioritization
To evaluate the performance of our method in prioritizing successful drug targets, we conducted simulated drug target prioritization experiments using the SIDER dataset. We randomly selected 1,000 candidate drug target gene-phenotype observations and tested whether a gene with a high GPS had a higher occurrence of being a drug indication than one that was randomly selected (Methods). In contrast to our previous analyses where we compared genes with a high GPS above a certain cutoff to those below, these simulations simulate a more realistic scenario where a gene target is randomly selected across the entire range of possible genetic priority scores. In 1,000 permutations, we observed that gene targets with a high GPS in the top 0.83%, 0.28% and 0.19% (equivalent to a greater than 0.9, 1.5 and 2.1 GPS respectively) resulted in a 2.2, 3.6 and 4.6-fold increased effect of harboring an indication respectively, compared to a random selection (Fig. 4).
Fig. 4. Simulation of a drug prioritization framework.
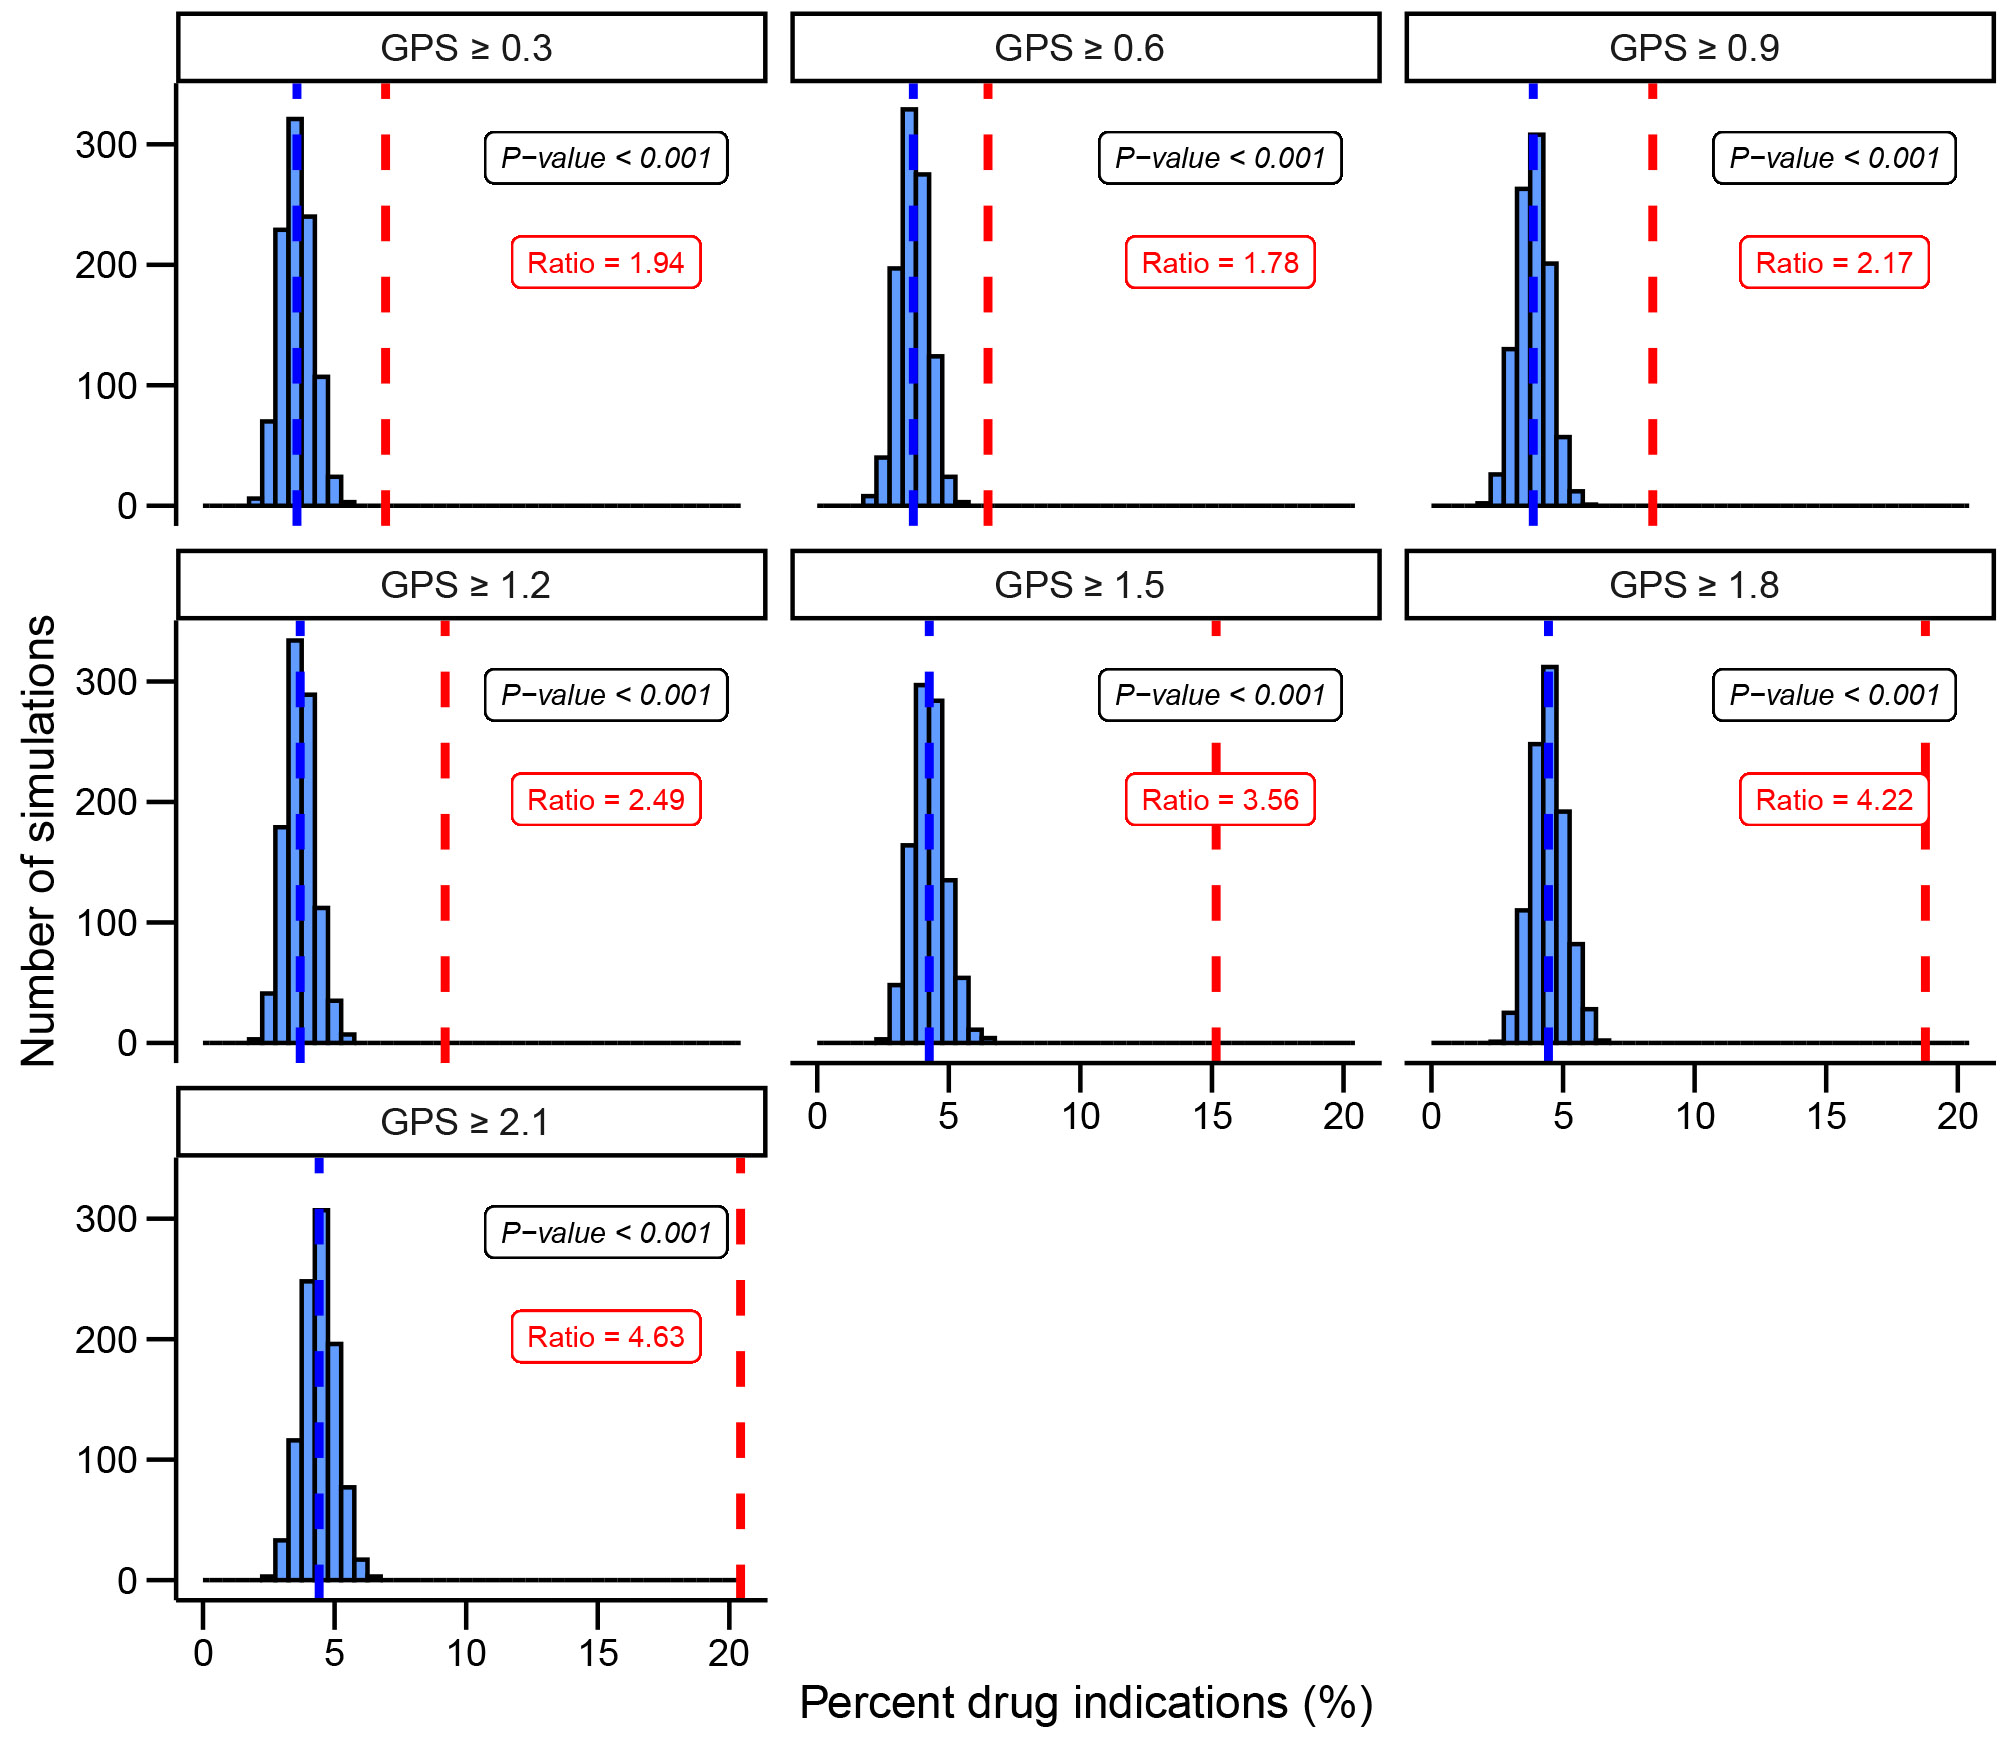
We evaluate the ability of the genetic priority score (GPS) to prioritize drug targets in a simulation framework. Increments of 0.3 are selected as thresholds for the GPS from the calculated scores in SIDER. We selected N=1000 gene-phenotypes with high genetic priority scores and reported how many were therapeutic targets. We recorded the fold difference in red. We selected N=1000 gene-phenotypes randomly and matched the phenotypes to the phenotypes with high genetic priority scores. We reported how many were therapeutic targets and repeated N=1000 to obtain the mean drug indications % recorded in blue. The empirical P-value was calculated for each GPS cutoff. We demonstrate that drug gene targets with higher genetic priority scores are more likely to harbor an actual drug indication. GPS, genetic priority score.
A high GPS informs drug targets in clinical phase trials.
We next tested whether an increased proportion of drug indications have a high GPS as drugs progress through the clinical trial pipeline. We observed that the strength of association of the GPS increased from clinical trial phase I to phase IV (Fig. 5a). Furthermore, drug indications with a high GPS greater than 1.5 which corresponds to having genetic support from an average of 2.7 features, in the Open Target dataset were 1.7, 3.7 and 8.8 times more likely to advance from phase I to phase II, III and IV, respectively, compared to drug indications without genetic evidence. The magnitude of this fold increase was even more pronounced when a more stringent GPS cutoff of 2.1 was considered (Fig. 5b). These findings corroborate previous studies which have shown that phase III clinical trials and approved drugs are enriched with genetic support and consequently have a higher probability of success.
Fig. 5. Association of the genetic priority score with drug indication by clinical trial phase.

a) Association results of the genetic priority score (GPS) in standard deviation units with drug indication in the Open Target dataset (n=919,809 independent drug-gene-phenotype combinations) by clinical trial phase are shown. The plot shows a forest plot of odds ratios (ORs) with 95% confidence intervals (CI) represented as circles and error bars for each logistic regression model with the 14 phecode categories and the number of gene targets per drug binarized into drugs with a single gene target and drugs with multiple gene targets as covariates. On the y-axis, the number of unique drug indications for each clinical phase are recorded in red and the number of unique drugs in blue. Filled circles indicate an OR with a significant P-value. We demonstrate that the GPS has a strong association with drug indications as the clinical trial phase advances from phase I to phase IV. b) Shown is the fold enrichment of drug indications with support from a high GPS using score thresholds of 0.9,1.5 and 2.1 compared to those without genetic evidence in each targeted phase (e.g., phase II, III or IV) divided by the total sum observed in phase I.
Incorporating direction of genetic effect
An important question is how direction of genetic effect and drug mechanism can be incorporated into drug discovery to direct pharmacological modulation. A limitation of the GPS is that it is non-directional. Hence, we developed a directional version of the GPS, called the GPS with direction of effect (GPS-DOE), that incorporates the direction of genetic effect and mechanism of the drug indication using predictions of gain-of-function (GOF) and loss-of-function (LOF) for each of the eight features in the Open Target dataset (see Methods) (Extended Data Fig. 6). To infer the direction of the associated genetic effect, we used the machine learning method LoGoFunc26 which generates predictions of pathogenic GOF, pathogenic LOF and neutral genetic variants genome-wide and estimates of effect from quantitative trait loci. We provide a summary of the number of genes and phenotypes for each of the genetic features in Supplementary Table 10 and Supplementary Table 11. GPS-DOE has both negative and positive values which represents GOF and LOF predictions, respectively. A GPS-DOE with a high negative score provides targets for drug inhibition, while genes with positive scores, conversely, provides targets for drug activation7. The GPS-DOE was highly correlated with the GPS (Pearson R=0.85, Supplementary Fig. 8). We evaluated the overall association of the GPS-DOE with drug indication and observed that a standard deviation increase in the absolute value of GPS-DOE resulted in a 3.0-fold (CI = 2.9 - 3.1, P < 2.2 × 10−308) increase in drug indication. Restricting to negative values of GPS-DOE solely resulted in a 2.4-fold (CI = 2.2 - 2.5, P < 1.8 × 10−137) increase whereas positive values of GPS-DOE resulted in a 3.6-fold (CI = 3.3 - 3.8, P < 2.2 × 10−308) increase. Similar to the GPS, we evaluated the association of the GPS-DOE within each cross-validated test set (Supplementary Table 12) to select the beta coefficients to calculate the GPS-DOE in the SIDER dataset.
We next considered whether extremes of the GPS-DOE were more likely to yield a drug indication, similar to that observed with the GPS. In the Open Targets dataset, we observed that the top 0.69 %, 0.25% and 0.17% of the absolute value of the GPS-DOE (equivalent to a GPS-DOE greater than 0.9, 1.5 and 2.1) conferred a 5.3, 7.5 and 8.2-fold increased effect of having a drug indication, respectively (Extended Data Fig. 7) (Supplementary Table 13). We replicated these findings using the SIDER dataset where the top 0.44%, 0.18% and 0.14% of the absolute value of the GPS-DOE (which corresponds to values greater than 0.9, 1.5 and 2.1 respectively) were associated with a 5.6, 10.0 and 10.8 -fold increased effect of having a drug indication, respectively (Fig. 6) (Supplementary Table 13). Similar results were observed when restricting to only negative or positive values (Fig. 6 and Extended Data Fig. 7). Furthermore, similar to the GPS, we observed that the strength of association of the GPS-DOE increased from clinical trial phase I to phase IV (Extended Data Fig. 8a). Moreover, drug indications in the Open Target dataset with a high GPS-DOE greater than 1.5, were 2.0, 2.8 and 7.9 times more likely to advance from phase I to phase II, III and IV, respectively, compared to drug indications without genetic evidence (Extended Data Fig. 8b).
Fig. 6. Association of the genetic priority score with direction of effect with drug indication in the SIDER dataset.

For genetic priority scores with direction of effect, the association of the increasing absolute values of the genetic priority score with direction of effect (GPS-DOE) with drug indications was investigated by binning the SIDER drug dataset (n=695,082 independent drug-gene-indication combinations) into 0.3 increments of the GPS-DOE and comparing scores greater or equal to each increment with scores equal to zero. For each bin, a logistic regression model was performed with drug indication as the outcome variable and the GPS-DOE bin as the predictor variable, adjusting for phecode categories as covariates and the number of gene targets per drug binarized into drugs with a single gene target and drugs with multiple gene targets. Odds ratios (ORs) with 95% confidence intervals (CI) are defined in the forest plot as circles and error bars and we repeated the associations for GPS-DOE restricted to LOF predictions and GOF predictions only. GPS, genetic priority score; GPS-DOE, genetic priority score with direction of effect; GOF, gain-of-function; LOF, loss-of-function.
Finally, we highlight known activator and inhibitor target gene examples with high GPS-DOE where the direction of genetic effect informs the direction of target modulation (Supplementary Table 14). Although these results demonstrate that a high GPS-DOE is associated with drug indications, we note that the GPS-DOE relies on GOF and LOF inference (see Methods). Hence, GPS-DOE is bounded by the limitations of the GOF/LOF inference whereas the GPS is not. As a result, we suggest using the GPS as the primary score for prioritization of drug targets, and then secondarily, using the GPS-DOE as a complementary score to gain insights into the direction of genetic effect and mechanism of the drug indication.
Extending the GPS to 19,365 genes and 399 phenotypes
After demonstrating the ability of the GPS to inform drug indications with a limited set of 1,003 drug target genes and 362 phenotypes in the Open Target and SIDER datasets, we next extended the approach to 19,365 protein-coding genes and 399 phenotypes. We perform a similar extension for the GPS-DOE to infer direction of effect. Using the GPS, we identified 14,899 genes linked to 399 phenotypes, for a total of 104,870 observations linking a gene to a phenotype, that have support from at least one genetic feature (equivalent to a greater 3.7-fold increased drug indication effect). Recapitulating known therapeutic targets, we observed 675 approved drug indications from Open Targets and SIDER, as well as 341 drug indications currently in clinical trial phase I to III, with a GPS. However, we note that 98.3% (103,086 of 104,870) of observations linking a gene to a phenotype with a GPS were not found in either the Open Targets or SIDER resources, indicating potential new drug targets. Moreover, of these, 89.0% do not have evidence of Locus2gene at a 0.5 cutoff.
Using selected examples below, we demonstrate how the GPS can potentially inform different stages of the drug development pipeline. First, the GPS can broadly identify potential therapeutic targets for a number of drug indications that could be informative at the onset of a drug development program. Restricting to a GPS ≥ 1.5, which corresponds to a cutoff of approximately two or more genetic features (Supplementary Table 6), we highlight five examples which show promise as therapeutic targets for a given drug indication with consistent direction of effect with the GPS-DOE in Supplementary Table 15, none of which have approved drugs to date nor have been prioritized by the Locus2gene score greater than 0.5. These examples include gene targets for cardiomyopathy, Parkinson’s Disease, dementia, osteoporosis and degenerative diseases of the spinal cord. For the aforementioned indications, we highlight additional prioritized targets in Supplementary Table 16 which encompass both known and potential therapeutic targets. Second, we believe the GPS can potentially inform drugs that are already being evaluated in clinical trials. We highlight five phase II clinical trials supported by a high GPS and a GPS-DOE that aligns with the direction of effect for the drug mechanism. This includes clinical trials for breast cancer, chronic bronchitis, achondroplasia, autism and trichotillomania (hair-pulling disorder) (Supplementary Table 17). We share the GPS and GPS-DOE for 14,899 protein-coding genes and 399 drug indications in a user-friendly repository (https://rstudio-connect.hpc.mssm.edu/geneticpriorityscore/ and https://github.com/rondolab/Genetic-priority-score). The GPS and GPS-DOE output in tabular form is also available at https://doi.org/10.5281/zenodo.10044666. In addition, we provide the weights used to create the GPS and GPS-DOE (Extended Data Table. 1).
DISCUSSION
In this study, we developed the GPS to aid in the prioritization of therapeutic targets in drug discovery. Our study demonstrates how the GPS may help facilitate the prioritization of targets with a greater probability of success. The strength of this score resides in the integration of numerous genetic features and annotations. The contribution of multiple phenotype-specific genetic features (comprised of both rare and common variant association signals) to genes with high likelihood of being a successful drug target lend credence to the notion that a well-validated drug target is best supported by the allelic series1,27.
The utility of LoGoFunc26 and quantitative trait loci in this study allowed us to infer the direction of the associated genetic effect, GOF or LOF, with the effect modulated therapeutically either by inhibition or activation7. For each genetic feature, this enabled us to propose the direction required for pharmacological modulation for each prioritized gene. Genes with a high negative GPS-DOE would be suitable targets for drug activators, while genes with a high positive GPS-DOE would be more suitable for drug inhibition.
We note several limitations. First, differences exist in the ascertainment of drugs for the Open Targets and SIDER datasets. Notably, drug data from Open Targets are ascertained from clinical trial phase I to IV, whereas SIDER only contains drug data from the post-clinical phase. We observed a higher enrichment of the genetic priority scores with drug indication in the validation set, perhaps due to the drug data being post clinical phase. Second, we used phecode terminology to enable the integration of the drug data and the genetic data. Although the phecode terminology retains clinically meaningful disease terms, a subset of phenotypes was not successfully mapped by our pipeline, and as a result, misclassification may occur. Third, the absence of a genetic feature for a drug target does not equate to genetic evidence against that drug target, as each genetic feature is subject to missing evidence for a variety of reasons, including lack of genetic studies for a particular phenotype or a lack of statistical power for a genetic association test. As a result, a gene and phenotype with a low GPS should not be interpreted as a drug target with genetic support against it. Fourth, human genetics support represents lifelong perturbation of gene activity, whereas a drug intervention typically entails short-term perturbation. Fifth, the GPS-DOE is dependent on LOF and GOF predictions from LoGoFunc26, which were obtained using a machine learning model. It is important to note that these predictions are based on inference rather than direct experimental measurements. Furthermore, in determining the direction of genetic effect we only considered the strongest prediction and hence, for genes with both GOF and LOF annotations only one direction was chosen. This can lead to weakened GPS-DOE for gene-phenotypes with opposite predictions. Therefore, while we recommend implementing a GPS ≥ 1.5, we don’t further implement a threshold for GPS-DOE to allow for the possibility of misclassified predictions and gene-phenotypes with opposing predictions. Sixth, a larger proportion of our genetic predictions are LOF and thus activation of these gene targets is the predicted therapeutic mechanism. However, historically it has generally been easier to modulate GOF changes using small molecule inhibitors compared to rescuing LOF28. Nonetheless, advancement in drug design and mechanisms29,30, coupled with the fact that many druggable targets have already been extensively pursued31, highlight the potential these LOF gene targets represent as a powerful source of unexplored therapeutic targets. Seventh, the GPS required the use and complex integration of several large-scale datasets, repositories and phenotypes. Inaccuracies in these datasets and repositories (e.g. submissions for clinical variant repositories) may exist. Furthermore, inaccuracies in mapping phenotypes to enable integration of the different datasets and repositories is possible. We emphasize the importance of carefully following up a gene target supported by the GPS, focusing on a detailed examination of the gene’s expected biological effect on a phenotype.
In summary, we have developed the GPS to inform the prioritization of gene targets in drug development. We believe that the GPS has utility ranging from suggesting potential therapeutic targets in the preclinical stages of drug development to informing current therapeutic targets in advanced phases of clinical trials. We expect that the performance of the GPS will improve further with larger drug data resources, improved approaches to allow better mapping of clinical drug data with genetic data, inclusion of additional genetic features and the expansion of large-scale exome sequencing and genome sequencing datasets in EHR-linked biobanks.
METHODS
Ethic Statement
This study complies with all relevant ethnical regulations; no specific approval was needed.
Drug, gene target and drug indication data
We collected drug, gene target, drug indication and drug mechanism of action data from the Open Targets Platform (Version 22.06)13. We included FDA-approved drugs as well as experimental drugs undergoing clinical trials. The drug indications are described using the Experimental Factor Ontology (EFO) classification. We used two disease mapping files: a Disease/Phenotype file from the Open Targets Platform, where we extracted EFO, Monarch Disease Ontology (MonDO) and Human phenotype ontology (HPO) terms mapped to Unified Medical Language System (UMLS)32 and International Classification of Diseases (ICD) codes and a curated file from EMBL-EBI Ontology Lookup Service (EBISPOT OLS) which maps UK Biobank traits to EFO terms33. We further mapped the UMLS codes to ICD codes using the available UMLS Metathesaurus file and then mapped all ICD codes to phecodes using the ICD10CM and ICD10 files from the PheWAS resources23. We restricted the phecode terms to the integer part in order to aggregate similar codes and removed the following phecode categories: ‘infectious diseases’, ‘pregnancy complications’, ‘injuries and poisonings’ and ‘null’. This resulted in 297 phecode integer terms. We removed drug classes ‘Anti-infectives for systemic use’ (ATC J) using the Anatomical Therapeutic Chemical (ATC) classification (version 2022AA). We removed this class because these drugs focus on the infectious organism and are less relevant to human genetics, which is the focus of the genetic features used in this study. We removed any drug indications which did not map to a phecode term and removed any drugs without a gene target. Gene targets from the Open Target platform were sourced from Chembl and consisted of targets classified as single protein, protein family and protein complex34. We classified drug mechanism of action into two categories: inhibitor drugs, which included mechanisms labelled as ‘inhibitor’, ‘blocker’, ‘antagonist’, ‘disrupting agent’, ‘sequestering agent’, ‘negative allosteric modulator’, ‘inverse agonist’, ‘allosteric antagonist’, ‘antisense inhibitor’, ‘rnai inhibitor’, ‘disrupting agent’ and ‘proteolytic enzyme’ and activator drugs, which encompassed 'agonist', 'positive modulator', 'opener', 'activator', 'releasing agent' and ’positive allosteric modulator'. We removed any drugs from our Open Target dataset that were also present in the replication dataset, SIDER. In total, we extracted 1,213 drugs, 778 genes and 282 drug indications mapped to phecode integers.
SIDER drug data
We used the SIDER database (Version 4.1)24 as our drug validation set and extracted drugs and drug indication data, mapped to Medical Dictionary for Regulatory Activities (MedDRA) v20.0 terminology with corresponding concept unique identifier (CUI) terms. We restricted our study to CUI terms annotated as preferred terms and removed the same ATC class and phecode categories previously mentioned. We identified the gene targets of these drugs using three sources: Drugbank35 (filtered to targets with known pharmacological action), Chembl36,37 and a published list of FDA drugs approved therapeutic efficacy targets38. In total, we extracted 733 drugs, 658 genes and 325 drug indications mapped to phecode integers.
Genetic Databases
We collected genetic features from four types of genetic evidence (clinical variants, coding variants, GWAS phenotypes and constraint) to investigate the association between human genetic variation in drug target genes and drug indications. We collected these data from several publicly available sources. To allow comparison between the drug and genetic datasets, we mapped all genetic phenotypes to phecodes and restricted these to phecode integer terms. All phecodes mapping to the phecode categories ‘infectious diseases’, ‘pregnancy complications’, ‘injuries and poisonings’ and ‘null’ were excluded from the analysis. We restricted each gene set to protein-coding genes, for which we obtained a list of 19,365 protein-coding genes from Ensembl (release 105)39. Each of these genetic features is described below.
Clinical variants
EVA-ClinVar:
The Open Target Platform summarizes genetic evidence from multiple datasets containing associations between targets and disease, described by EFO terms13. One source is ClinVar14, a curated database of associations between clinically relevant genetic variants, diseases and the variant’s clinical significance. These data were processed and curated by European Variation Archive (EVA)15 before being added to the Open Target platform. We extracted ClinVar evidence from the Open Target platform (version 22.06) based on two steps. First, evidence was filtered on clinical significance terms: ‘likely pathogenic', 'association', 'confers sensitivity', 'drug response' and 'pathogenic'. Secondly, we filtered based on the confidence of the submission assigned as: 'criteria provided, single submitter'; 'criteria provided, conflicting interpretations'; 'criteria provided, multiple submitters, no conflicts'; 'reviewed by expert panel' and 'practice guideline'. We mapped the EFO terms to phecodes using the previously mentioned disease mapping files from the Open Targets Platform, EBISPOT OLS, UMLS and PheWAS resource. In total, there were 2,824 genes associated with 3,513 phenotypes that mapped to 257 phecode integers.
HGMD:
The HGMD professional (accessed 12 March 2022)16 contains gene mutations underlying human inherited diseases, curated from the scientific literature. We extracted 12,795 disease-causing and likely disease-causing genes associated with 16,810 phenotypes mapped to 1,722 UMLS codes. We mapped the UMLS codes to phecodes via ICD codes using the available UMLS Metathesaurus file and ICD10CM and ICD10 files from the PheWAS resource23. There were 322 phecode integers associated with 11,767 genes.
OMIM:
The OMIM17 database (accessed 8 February 2022) contains genes involved in rare Mendelian diseases. We extracted 15,846 genes associated with 7,053 Mendelian traits from the OMIM database and mapped these to 7,216 HPO terms using a publicly available HPO annotation file40. We used a curated mapping file from the phenome-wide association studies (PheWAS) catalog23 to map the HPO terms to phecodes. In total, 5,972 phenotypes were mapped to 333 phecode integers associated with 4,233 genes.
Coding variants
Genebass:
Gene-based Association Summary Statistics (Genebass)19 is a resource of exome-based association statistics from the UK Biobank. We used the 500K exome dataset, encompassing 4,529 phenotypes across 394,841 individuals with gene-based and single-variant testing. We used both sets as individual features, restricting our study to associations labelled either predicted loss-of-function (pLOF) or missense and traits labeled ‘ICD first occurrence’ and 40 categorical traits that we had manually mapped to phecodes. We used a P < 4.3 × 10⁻⁷ 18 to restrict the single variant and gene burden associations. For the single variant results, we extracted 923 genes associated with 381 ICD codes and categorical traits that mapped to 202 integer phecodes. For the gene-burden results we extracted 104 genes associated with 93 ICD codes and categorical traits that mapped to 83 integer phecodes.
Genome-wide association study phenotypes
eQTL phenotype:
We defined eQTL phenotype, using the updated Pan-UK Biobank20, as genes with a GWA phenotype driven by gene expression regulation through shared variants. The Pan-UK Biobank is a multi-ancestry genetic analysis of the UK Biobank across six continental ancestry groups and 7,228 phenotypes. All variants were obtained on hg19 coordinates and we used the liftOverPlink package (https://github.com/sritchie73/liftOverPlink/blob/master/liftOverPlink.py) to convert these to hg38 for compatibility41 and extracted all genome-wide significant single nucleotide variants (P < 5 × 10⁻⁸). We restricted the trait types and obtained summary statistics for 1,252 phenotypes: 487 ICD-10 traits, 730 phecodes and 39 continuous traits that we had manually mapped to phecodes from the UK Biobank Neale. To identify the putative causal genes underlying these traits, we used eQTL summary statistics from GTEX v842 across 49 tissues and extracted significant variants for each tissue with a nominal P less than the gene level threshold. We intersected these variants with the Pan-UK Biobank significant variants to obtain the linked gene for each trait, collapsing across tissues. We mapped all ICD traits to phecodes and across the 49 tissues, there were 4,711 genes associated with 472 phenotypes that mapped to 208 integer phecodes.
Locus2gene:
The Locus2gene model is a machine learning method from the Open Targets Genetics Portal which prioritizes likely causal genes at each GWAS locus by integrating fine-mapped associations with functional genomic features21. A set of gold standard positive (GSP) genes are used in this method where the causal gene has been confidently assigned. To define the Locus2gene feature, we restricted the study to genes prioritized by the model with a score greater than 0.5. We mapped the disease traits to phecodes using the disease mapping files from the Open Targets Platform, EBISPOT OLS, UMLS and PheWAS resources. We extracted 4,197 genes classified as causal for 2,056 traits mapped to 310 phecode integers.
pQTL phenotype:
We defined pQTL phenotype as genes with a GWAS phenotype that are in high linkage disequilibrium (r2>0.80) with at least one cis or trans pQTL. We utilized the large-scale plasma proteome study conducted by Ferkingstad et al22, which measured the plasma levels of 4,907 proteins in a cohort of 35,559 Icelandic individuals, identifying 18,084 pQTL. For our analysis, we used supplementary table 12 from this study, which integrates pQTL associations with 45,334 disease and trait associations data from the GWAS catalog. This supplementary table reports 5,458 variants from the GWAS catalog that are in high linkage disequilibrium (r2>0.80) with a primary pQTL variant for 3,973 genes encoding the target protein and 1,111 unique Experimental Factor Ontology (EFO) traits. Using this dataset, we mapped 135 EFO trait names to phecodes which resulted in 2,899 genes and 100 phecode integer terms.
Constraint:
We used the OE score to measure the constraint per gene and its intolerance to loss of function mutations43. Genes with missing values were imputed using a random forest-based algorithm (missForest version 1.4)44. We used the suggested cutoff of < 0.35 of the upper bound of the OE confidence interval to identify genes under high constraint and identified 2,854 genes.
Generation of the integrated drug genetics dataset
We combined the drug dataset with the nine genetic features described above at the gene and phecode integer level. In cases where drugs had multiple gene targets, they were repeated as multiple rows in the dataset to allow comparison between the drug indication and genetic feature at the gene level. Each feature and drug indication were binarized across the 282 drug indication phecode integers. We repeated this with the SIDER dataset as our validation set.
Genetic priority score
We constructed the GPS to inform drug indication outcomes using multiple phenotypic specific genetic data sources from clinical variants, coding variants and GWA phenotypes. To attribute a weight to each genetic feature contributing to the score, we used a Firth logistic regression model (using the “logistf” R package version 1.24.1) in a five-fold cross-validation framework and extracted the beta coefficients as weights. The Open Target dataset was randomly split into five non-overlapping groups and for each fold of the cross-validation, each group (20% of the data, n = 183,961) was used as the test set, whilst the remaining 80% was used as the training set in the Firth regression. The outcome variable was drug indication, and this was modeled against all phenotype specific features plus the 14 covariate categories, genetic constraint and the number of gene targets per drug which was binarized into drugs with a single gene target and drugs with multiple gene targets. In each of the tests sets, scores were calculated as the weighted sum for each of the phenotype specific features across each gene-phenotype as follows;
where = gene-phenotype, = feature, = number of features, is the estimated beta coefficient for the jth feature in the OT train dataset and is the value for the feature column (0/1) from the OT test dataset for each gene-phenotype.
We validated these scores using the SIDER dataset, using the beta coefficients from the CV sample that produced the maximum odds ratio in a logistic regression model (Supplementary Table 5) and then applied these weights to the SIDER dataset following the same method.
Association analysis of the GPS with drug indications
The enrichment for therapeutic targets with increasing genetic priority scores was investigated by binning the drug data into 0.3 increments of the GPS from 0 - 2.1. At each 0.3 score increase, the proportion of gene–phenotypes with a drug indication were determined by comparing gene – phenotypes with a GPS greater than each bin threshold with drug data with no genetic evidence in a logistic regression model, with drug indication as the response variable and adjusting for the 14 phecode categories and number of drug targets as covariates.
Simulation experiment for drug prioritization using the GPS
We simulated a prioritization experiment, comparing the percentage of therapeutic targets chosen when N = 1000 gene-phenotypes were sampled with replacement with a high GPS against sampling from the entire dataset. We matched the phenotypes selected within each sample and repeated the random selection of gene-phenotypes 1000 times. We varied the threshold to restrict the high genetic priority scores, using increments of 0.3 of the GPS. We calculated the empirical P-value for each threshold as the percentile of our observed values compared to the null distribution.
Clinical trial phase analysis using the GPS
We assessed the proportion of drug indications with support from a high GPS using score cutoffs of greater than 0.9, 1.5 and 2.1 for drugs in phase II, III and IV compared to phase I. We assessed the fold enrichment of drug indications with support from a high GPS compared to those without in each targeted phase (e.g. phase II, III or IV) divided by the total sum observed in phase I.
Simulations to evaluate false negatives
We considered the impact of false negative genetic associations on the enrichment of drug indications. We recalculated each GPS using a range of misclassification thresholds (1%, 2%, 5%,10%, 20%, 30%). To simulate the effect of false negatives, we randomly permuted each genetic feature where the genetic evidence supports the main indication to zero (both the outcome and genetic feature are equal to1) for each misclassification percentage. Subsequently, we recalculated the GPS from each permuted feature and re-estimated the effect of the GPS on drug indications to assess the impact of false negative assertions.
Genetic priority score with direction of effect
We incorporated direction of effect into our dataset for each genetic feature to construct a complementary version of the GPS, called the genetic priority score with direction of effect (GPS-DOE). We used two methods to identify the direction of effect of each genetic association for the eight phenotypic features to distinguish between suitable targets for inhibition and targets for activation. For the clinical variants, ClinVar, HGMD and OMIM and Genebass single variant feature, we used the method LoGoFunc by Stein et al26, to extract predictions of pathogenic LOF and GOF variants genome-wide. This is a machine learning model comprised of multiple LightGBM classifiers trained using pathogenic (GOF) and (LOF) variants extracted from the literature. The model utilizes a comprehensive set of 474 descriptors, including features derived from AlphaFold2 predicted protein structures, network features based on graph-based learning that represent interactions in the human protein interactome, measures of evolutionary constraint and conservation, and various other factors26. For genes with multiple variants with opposite predictions, we used the prediction with the highest predicted probability and excluded variants predicted as neutral. Secondly, for GWA phenotypes, we used the direction of effect from the quantitative trait loci along with the direction of effect from the genetic association from the GWAS study. Specifically, for the eQTL phenotype feature, we used eQTL data from GTEX v842; for Locus2gene, we used the QTL effect annotations for increased or decreased abundance of the gene product provided by Open Targets21; and for pQTL phenotype, we used the pQTL effect estimates22. If the estimate of effect from the GWAS and QTL variant was in the same direction, this was classified as GOF whereas if the estimates were in the opposite direction, this was classified as LOF. Similar to the LoGoFunc method, we used the strongest effect for genes with multiple variants with opposite effects.
We restricted the datasets to drugs classified as inhibitors or activators to compare the direction of therapeutic modulation with the direction of genetic effect. The Open Target dataset was subsetted to 1,128 drugs, 724 genes and 279 drug indications mapped to phecode integers. The SIDER dataset was subsetted to 599 drugs, 461 genes and 303 drug indications mapped to phecode integers. To build the GPS-DOE, we implemented Firth regression with five-fold cross validation as described for the GPS, but here we included mechanism of action, annotated as either inhibitor or activator as a covariate. We applied these weights to the remaining 20% test set with GOF annotated as −1, LOF annotated as 1 and no genetic evidence or estimates of neutral annotated as 0. The GPS-DOE was calculated for each gene-phenotype observation, with high negative scores denoting GOF gene targets and high positive scores denoting LOF gene targets. We validated these scores using the SIDER dataset, using the beta coefficients from the CV sample that produced the maximum odds ratio in a logistic regression model (Supplementary Table 12).
Statistical analysis
To assess the correlation between each genetic feature, we performed pairwise correlation using the rcorr function from the R package Hmisc (version 4.7.0) and generated the correlation plot using the R package corrplot (version 0.92). We tested each feature for association with drug indication in a univariate logistic regression model using the glm function, adjusting for the 14 phecode categories as covariates and the number of gene targets per drug which was binarized into drugs with a single gene target and drugs with multiple gene targets. Violin plots were generated using the geom_violin function and specifying the scale = width from the R Package ggplot2 (version 3.3.6) and circular plots were generated using the geom_bar and coord_polar functions also from the ggplot2 package (version 3.3.6). We built a Shiny app using R Shiny (version 1.7.1) for users to interactively explore the GPS and GPS-DOE results. All statistical analyses were performed using R (version 4.2.0)45 and software packages used included dplyr (version 1.0.9), sparklyr (version 1.7.7), sparklyr.nested (version 0.0.3), UCSC liftover (https://github.com/sritchie73/liftOverPlink/blob/master/liftOverPlink.py ), bedTools (version 2.29.2), spark (version 3.2.0) and Hail (version 0.2.105).
Extended Data
Extended Data Fig. 1. Association of genetic features with drug indications using Firth logistic regression in the Open Target dataset in all drugs and drugs with one gene target.

The Open Targets dataset was split into 80% training and 20% test sets in five-fold cross-validation. Firth logistic regression was run on the cross-validation training sets (n = 735,847 independent drug-gene-phenotype combinations) with drug indication as the outcome variable and the eight human genetic features, 14 phecode categories, genetic constraint and the number of gene targets per drug binarized into drugs with a single gene target and drugs with multiple gene targets as the predictor variables. Shown is a forest plot of beta coefficients with 95% CIs from the eight human genetic features included in the models in five-fold cross-validation. Each cross-validated sample is color labeled and filled circles indicate a beta coefficient with a significant P-value and the 95% CIs are defined as error bars.
Extended Data Fig. 2, Contribution of each genetic feature on the GPS.
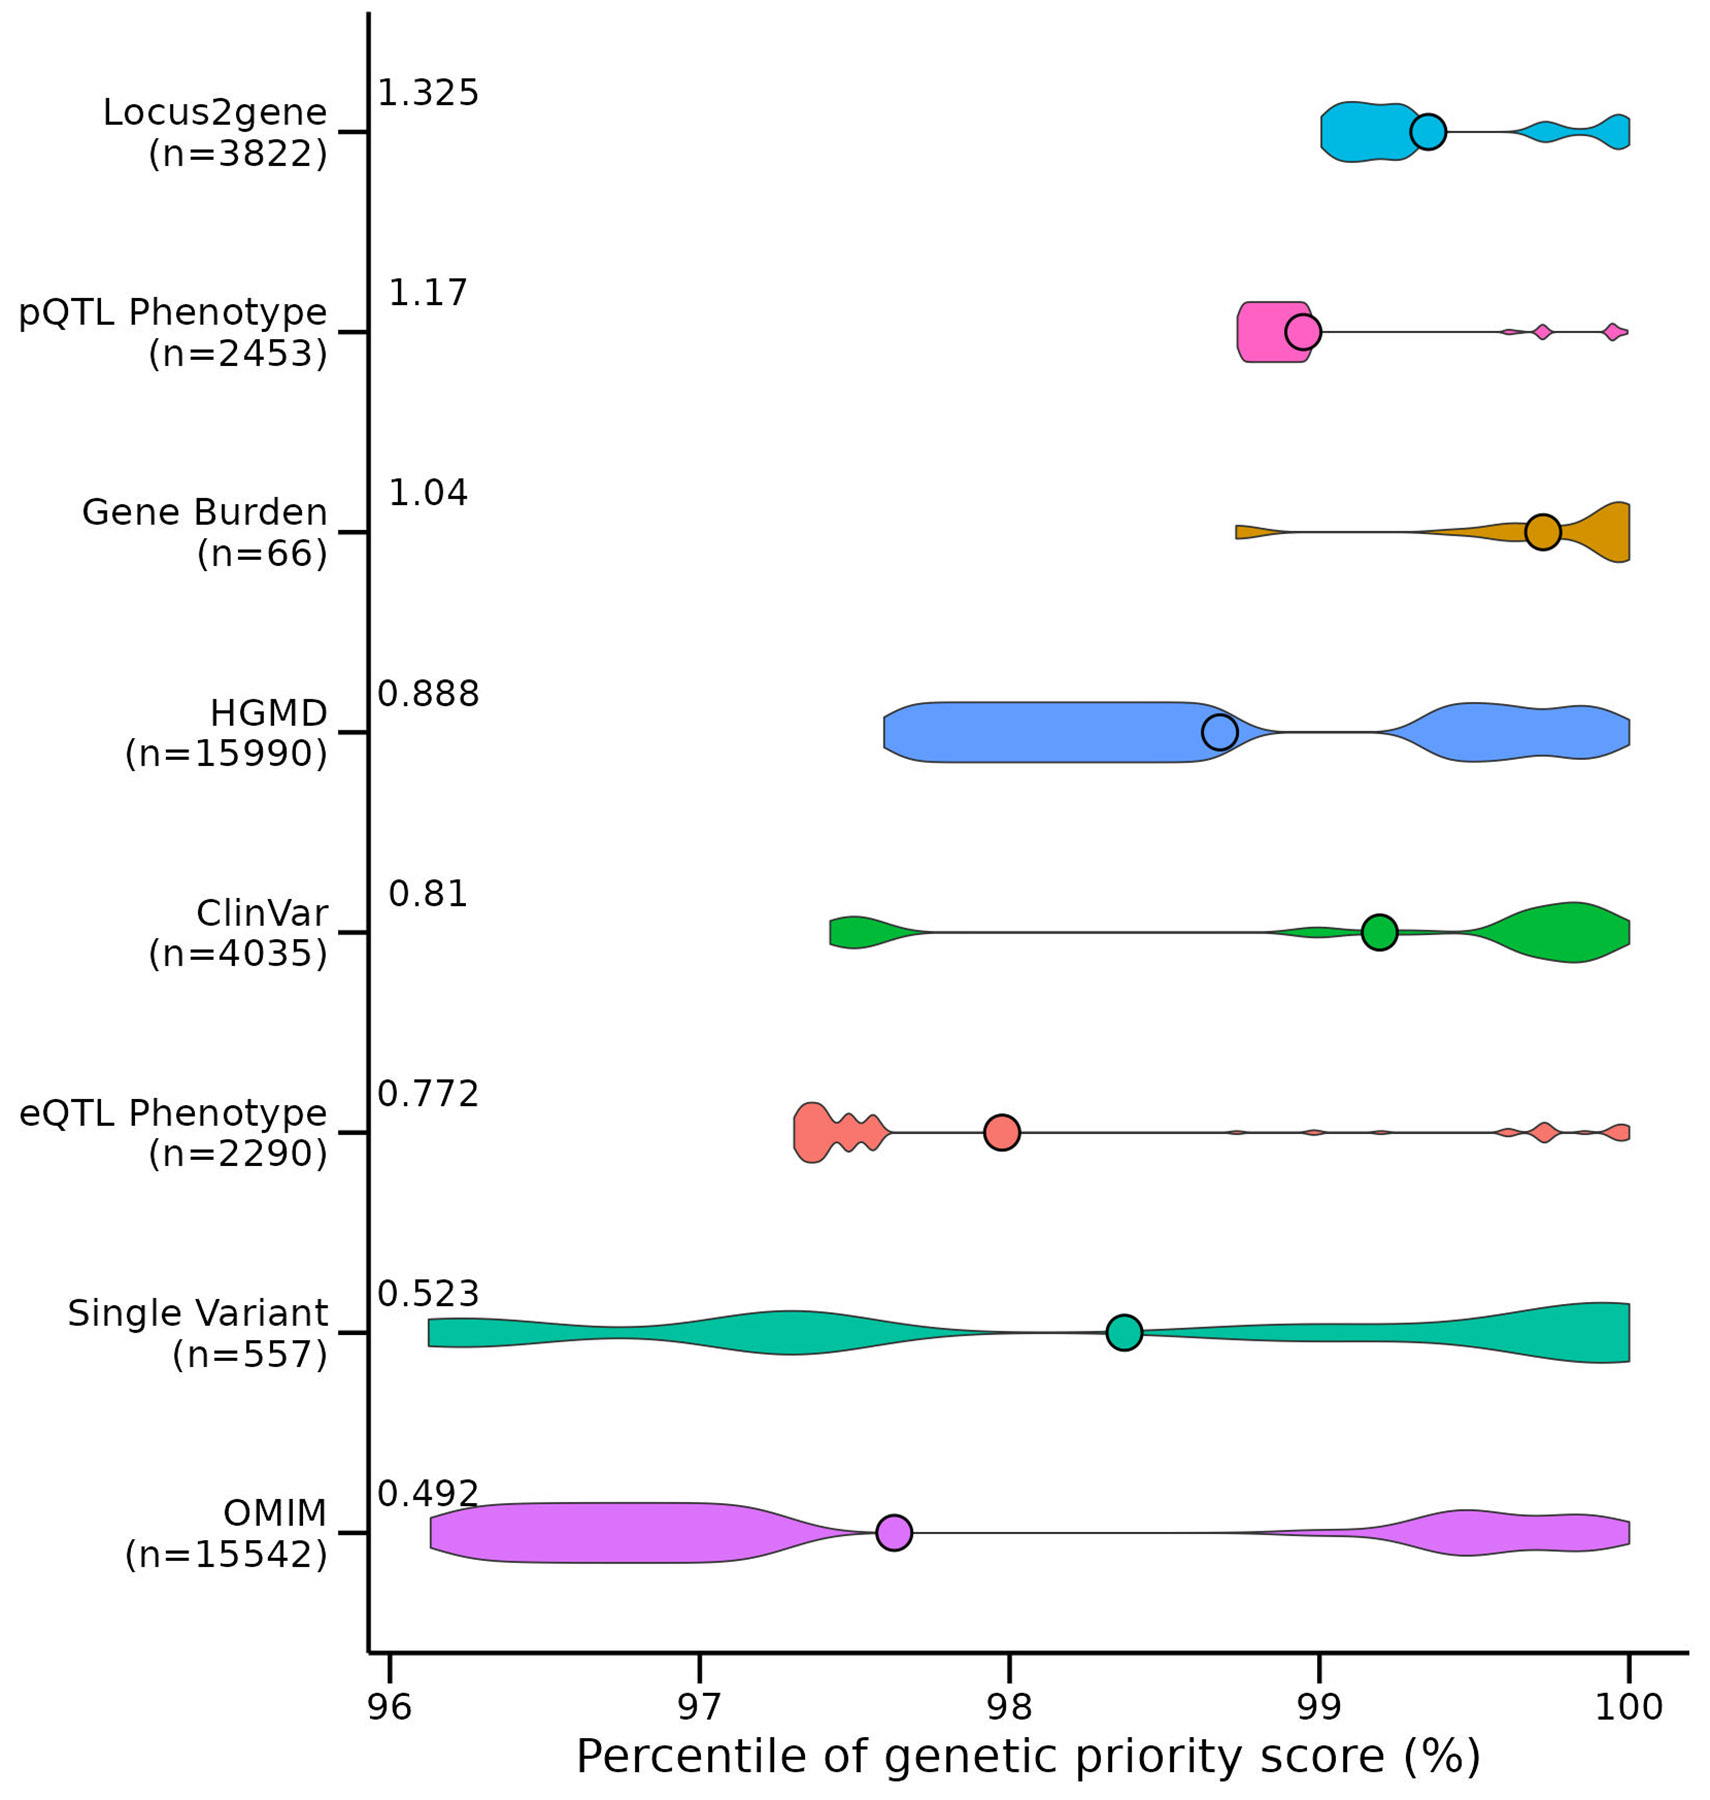
Shown is a violin plot demonstrating the contribution of each genetic feature to the 919,809 genetic priority scores in the Open Target dataset for n = 231,066 gene-phenotype combinations. The plot shows the contribution of each feature to the GPSs compared across all features and all scores, binned according to the percentile of the score. The violin width represents the density of the genetic feature at each percentile and the mean percentile for each feature is shown as a point. On the y-axis, the sample size (n) and mean weight of each genetic feature from the five cross-validated samples was recorded and the y-axis was ordered by increasing value of these weights. We demonstrate that many different genetic features contribute to the highest percentile ranked GPSs.
Extended Data Fig. 3. Contribution of genetic features to the GPS at each 0.3 increment bin.

Each bar plot shows the contribution of the genetic features to the GPSs at 0.3 increment bins in the Open Target dataset. As the GPS increases, the number of features which contribute to each score increases. On the x axis of each bar plot is the number of genetic features that contributes to each score, colored by each feature present. On the y-axis is the number of counts for each feature.
Extended Data Fig. 4. Association of the GPS at increments of 0.3 with drug indication in the Open Target dataset.
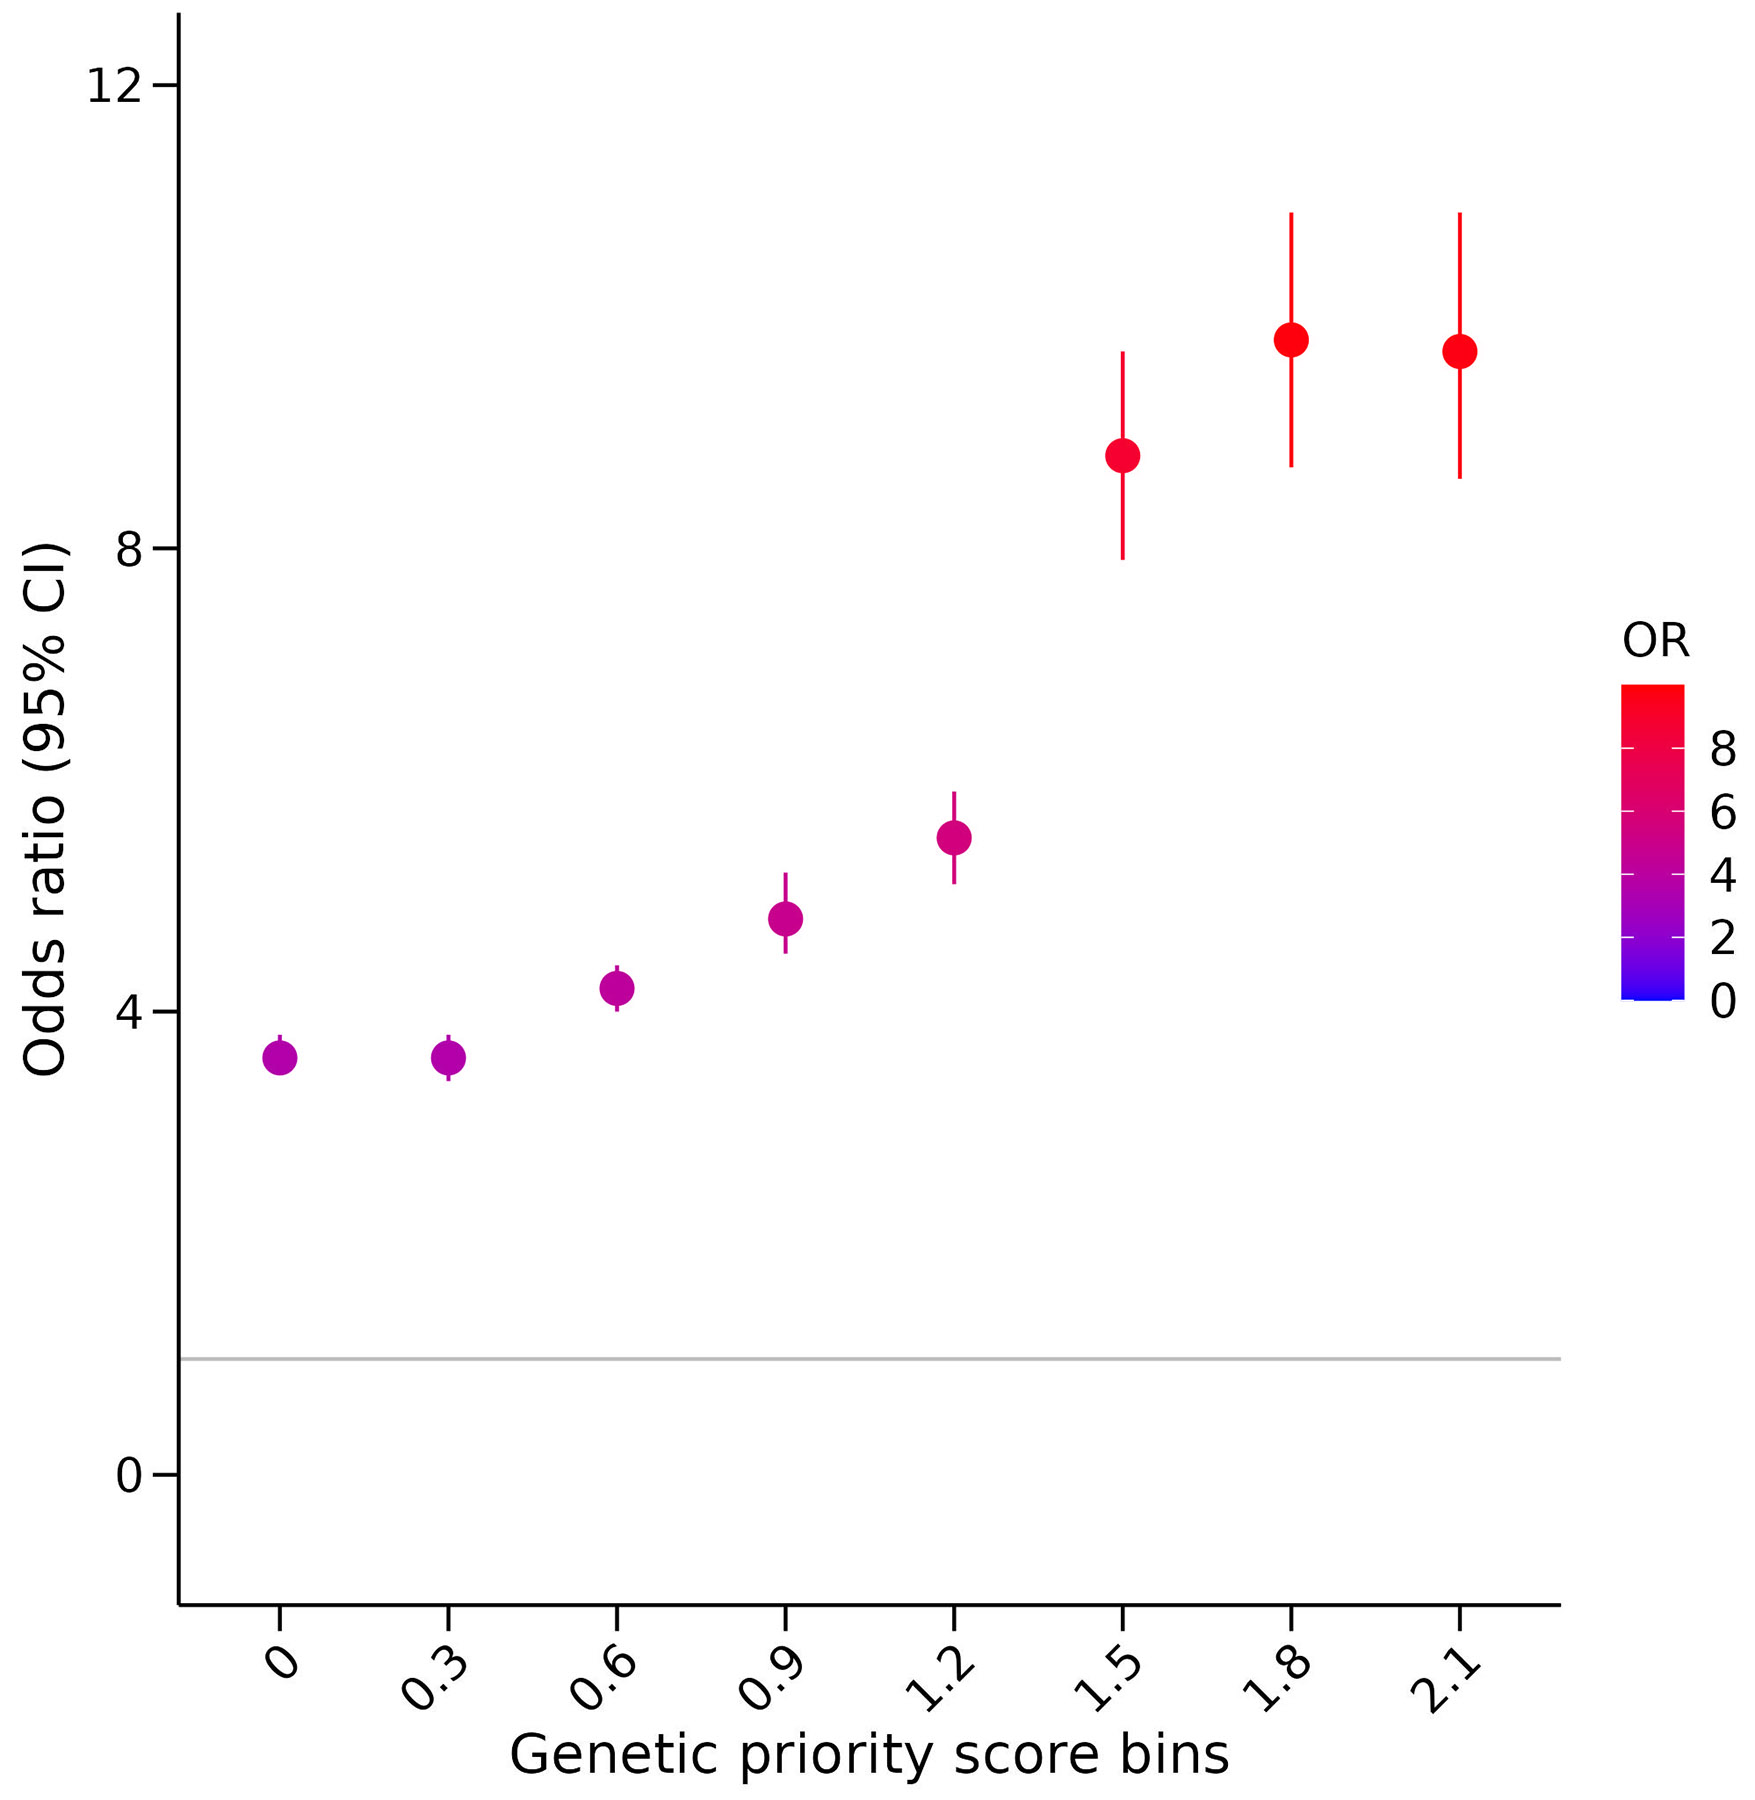
The association of increasing GPSs with drug indications was investigated by binning the Open Target drug dataset (n = 919,809 independent drug-gene-phenotype combinations) into 0.3 increments of the GPS and comparing GPSs greater or equal to each increment with GPSs equal to zero. For each bin, a logistic regression model was performed with drug indication as the outcome variable and the GPS bin as the predictor variable, adjusting for phecode categories as covariates and the number of gene targets per drug binarized into drugs with a single gene target and drugs with multiple gene target. ORs with 95% CI are defined in the forest plot as circles and error bars.
Extended Data Fig. 5. Association of the GPS at increments of 0.3 with drug indication in the Open Target and SIDER dataset in drugs with one gene target.

The association of increasing GPSs with drug indications was investigated by binning the Open Target drug dataset (n = 215,028 independent drug-gene-phenotype combinations) and the SIDER dataset (n = 66,792 independent drug-gene-phenotype combinations) into 0.3 increments of the GPS and comparing GPSs greater or equal to each increment with GPSs equal to zero. For each bin, a logistic regression model was performed with drug indication as the outcome variable and the GPS bin as the predictor variable, adjusting for phecode categories as covariates. We show the ORs with 95% CI from the logistic regression model assessed in the Open Targets and SIDER dataset, restricted to drugs with one gene target. ORs with 95% CI are defined in the forest plots as circles and error bars.
Extended Data Fig. 6. Schematic used to derive the desired direction of therapeutic modulation using direction of genetic effect.

An idealistic framework using direction of genetic effect to propose the direction of therapeutic modulation. Mutations which decrease gene function and subsequently increase disease risk model activator drugs and mutations which increase gene function and increase disease risk model inhibitor drugs.
Extended Data Fig. 7. Association of the GPS-DOE with drug indication in the Open Target dataset.

For GPS-DOE, the association of the increasing absolute values of the GPS-DOE with drug indications was investigated by binning the Open Target drug dataset (n = 839,752 independent drug-gene-phenotype combinations) into 0.3 increments of the GPS-DOE and comparing scores greater or equal to each increment with scores equal to zero. For each bin, a logistic regression model was performed with drug indication as the outcome variable and the GPS-DOE bin as the predictor variable, adjusting for phecode categories as covariates and the number of gene targets per drug binarized into drugs with a single gene target and drugs with multiple gene targets. ORs with 95% CI are defined in the forest plot as circles and error bars and we repeated the associations for GPS-DOE restricted to LOF predictions and GOF predictions only.
Extended Data Fig. 8. Association of the GPS-DOE with drug indication by clinical trial phase.

a) Association results of the absolute values of the GPS-DOE in s.d. units with drug indication in the Open Target dataset (n = 839,752 independent drug-gene-phenotype combinations) by clinical trial phase are shown. The plot shows a forest plot of ORs with 95% CI represented as circles and error bars for each logistic regression model with the 14 phecode categories and the number of gene targets per drug binarized into drugs with a single gene target and drugs with multiple gene targets as covariates. On the y-axis, the number of unique drug indications for each clinical phase is recorded in red and the number of unique drugs in blue. We demonstrate that the GPS-DOE has a strong association with drug indications as the clinical trial phase advances from phase I to phase IV. b) Shown is the fold enrichment of drug indications with support from a high GPS-DOE using score thresholds of 0.9,1.5 and 2.1 compared to those without genetic evidence in each targeted phase (for example, phase II, III or IV) divided by the total sum observed in phase I.
Extended Data Table 1.
Firth regression beta coefficients used to create the GPS and GPS-DOE in SIDER and across all genes and phenotypes.
| Genetic Features | GPS | GPS-DOE |
|---|---|---|
| ClinVar | 0.794 | 0.761 |
| HGMD | 0.880 | 0.892 |
| OMIM | 0.492 | 0.501 |
| Gene Burden | 0.971 | 1.281 |
| Single Variant | 0.625 | 0.564 |
| eQTL Phenotype | 0.654 | 0.746 |
| Locus2gene | 1.293 | 1.341 |
| pQTL Phenotype | 1.177 | 1.225 |
GPS, genetic priority score; GPS-DOE, genetic priority score with direction of effect, OMIM, Online Mendelian Inheritance in Man; HGMD, Human Gene Mutation Database; eQTL, expression quantitative trait loci; pQTL, protein quantitative trait loci.
Supplementary Material
Acknowledgements
Funding/Support: CML is supported by the NIH T32 Postdoctoral Research Award, Award Number 5T32HL00782424. RD is supported by the National Institute of General Medical Sciences of the NIH (R35-GM124836) and the National Heart, Lung and Blood Institute of the NIH (R01-HL139865 and R01-HL155915). MV is supported by the French National Research Agency (ANR) (ANR-21-CE45-0023-01). YI was funded by the Leducq Foundation (21CVD01) and by the Charles Bronfman Institute for Personalized Medicine, Icahn School of Medicine at Mount Sinai. DS was funded by the Helmsley Foundation Award (2209-05535). The content is solely the responsibility of the authors and does not necessarily represent the official views of the National Institutes of Health. The funders had no role in study design, data collection and analysis, decision to publish or preparation of the manuscript.
Footnotes
Competing Interests Statement
Dr. Do reported receiving grants from AstraZeneca, grants and nonfinancial support from Goldfinch Bio, being a scientific co-founder, consultant and equity holder for Pensieve Health and being a consultant for Variant Bio, all not related to this work. All other authors have reported that they have no relationships relevant to the contents of this paper to disclose.
Data availability:
The GPS and GPS-DOE for 14,899 genes and 399 drug indications are publicly available at https://rstudio-connect.hpc.mssm.edu/geneticpriorityscore/ and https://doi.org/10.5281/zenodo.10044666. Public data used in this study mentioned in the methods are available via the listed URLs:
Open Target genetic evidence and clinical trial data (v22.06), https://platform.opentargets.org/downloads
SIDER 4.1, http://sideeffects.embl.de/download/
Drugbank (5.1.9), (https://go.drugbank.com/releases/latest)
Chembl (release 29), (https://ftp.ebi.ac.uk/pub/databases/chembl/ChEMBLdb/releases/chembl_29/)
Supplementary table 2 from Santos et al34
Ensembl (release 105), http://ftp.ensembl.org/pub/release-105/gtf/homo_sapiens/.
Online Mendelian Inheritance in Man (OMIM) (accessed 8 February 2022), https://www.omim.org/downloads
Human Gene Mutation Database (HGMD) Professional (accessed 12 March 2022), https://www.hgmd.cf.ac.uk/ac/index.php
Gene Burden results from Genebass, gs://ukbb-exome-public/500k/results/results.mt
Single Variant association results from Genebass, gs://ukbb-exome-public/500k/results/variant_results.mt
Genebass (500K), gs://ukbb-exome-public/300k/results/variant_results.mt
GTEx Analysis V8, https://www.gtexportal.org/home/datasets
Pan-UK Biobank, https://pan.ukbb.broadinstitute.org/downloads/index.html
UCSC liftover chain file, https://hgdownload.cse.ucsc.edu/goldenpath/hg19/liftOver/
Benjamin Neale’s lab GWAS summary statistics in the UK Biobank, http://www.nealelab.is/uk-biobank.
SAIGE GWAS summary statistics in the UK Biobank, https://www.leelabsg.org/resources.
ATC classification (Version 2022AA, uploaded 08/09/2022), https://bioportal.bioontology.org/ontologies/ATC
UMLS (accessed 18 January 2022), https://www.nlm.nih.gov/research/umls/licensedcontent/umlsknowledgesources.html
HPO annotations (accessed 8 February 2022), http://purl.obolibrary.org/obo/hp/hpoa/phenotype.hpoa
HPO to phecode map, https://www.ncbi.nlm.nih.gov/pmc/articles/PMC5959723/ Table S12
Phecode Map 1.2b1 to ICD-10 (beta), https://phewascatalog.org/phecodes_icd10
Phecode Map 1.2b1 to ICD-10-CM (beta), https://phewascatalog.org/phecodes_icd10cm
Phecode definitions, https://phewascatalog.org/files/phecode_definitions1.2.csv.zip
EBISPOT OLS – https://github.com/EBISPOT/EFO-UKB-mappings.
Code availability:
All analysis code is available on Zenodo46 (https://doi.org/10.5281/zenodo.10044666).
REFERENCES
- 1.Plenge RM, Scolnick EM & Altshuler D Validating therapeutic targets through human genetics. Nat Rev Drug Discov 12, 581–94 (2013). [DOI] [PubMed] [Google Scholar]
- 2.Cook D et al. Lessons learned from the fate of AstraZeneca's drug pipeline: a five-dimensional framework. Nat Rev Drug Discov 13, 419–431 (2014). [DOI] [PubMed] [Google Scholar]
- 3.Dowden H & Munro J Trends in clinical success rates and therapeutic focus. Nat Rev Drug Discov 18, 495–496 (2019). [DOI] [PubMed] [Google Scholar]
- 4.Nelson MR et al. The support of human genetic evidence for approved drug indications. Nat Genet 47, 856–860 (2015). [DOI] [PubMed] [Google Scholar]
- 5.Ochoa D et al. Human genetics evidence supports two-thirds of the 2021 FDA-approved drugs. Nat Rev Drug Discov 21, 551 (2022). [DOI] [PubMed] [Google Scholar]
- 6.King EA, Davis JW & Degner JF Are drug targets with genetic support twice as likely to be approved? Revised estimates of the impact of genetic support for drug mechanisms on the probability of drug approval. PLoS Genet 15, e1008489 (2019). [DOI] [PMC free article] [PubMed] [Google Scholar]
- 7.Ghoussaini M, Nelson MR & Dunham I Future prospects for human genetics and genomics in drug discovery. Current Opinion in Structural Biology 80, 102568 (2023). [DOI] [PMC free article] [PubMed] [Google Scholar]
- 8.Fang H et al. A genetics-led approach defines the drug target landscape of 30 immune-related traits. Nat Genet 51, 1082–1091 (2019). [DOI] [PMC free article] [PubMed] [Google Scholar]
- 9.Duffy A et al. Tissue-specific genetic features inform prediction of drug side effects in clinical trials. Sci Adv 6, eabb6242 (2020). [DOI] [PMC free article] [PubMed] [Google Scholar]
- 10.Nguyen PA, Born DA, Deaton AM, Nioi P & Ward LD Phenotypes associated with genes encoding drug targets are predictive of clinical trial side effects. Nat Commun 10, 1579 (2019). [DOI] [PMC free article] [PubMed] [Google Scholar]
- 11.Yao J, Hurle MR, Nelson MR & Agarwal P Predicting clinically promising therapeutic hypotheses using tensor factorization. BMC Bioinformatics 20, 69 (2019). [DOI] [PMC free article] [PubMed] [Google Scholar]
- 12.Han Y, Klinger K, Rajpal DK, Zhu C & Teeple E Empowering the discovery of novel target-disease associations via machine learning approaches in the open targets platform. BMC Bioinformatics 23, 232 (2022). [DOI] [PMC free article] [PubMed] [Google Scholar]
- 13.Ochoa D et al. Open Targets Platform: supporting systematic drug-target identification and prioritisation. Nucleic Acids Res 49, D1302–D1310 (2021). [DOI] [PMC free article] [PubMed] [Google Scholar]
- 14.Landrum MJ et al. ClinVar: improving access to variant interpretations and supporting evidence. Nucleic Acids Res 46, D1062–D1067 (2017). [DOI] [PMC free article] [PubMed] [Google Scholar]
- 15.Cook CE et al. The European Bioinformatics Institute in 2016: Data growth and integration. Nucleic Acids Res 44, D20–D26 (2015). [DOI] [PMC free article] [PubMed] [Google Scholar]
- 16.Stenson PD et al. The Human Gene Mutation Database (HGMD(®)): optimizing its use in a clinical diagnostic or research setting. Hum Genet 139, 1197–1207 (2020). [DOI] [PMC free article] [PubMed] [Google Scholar]
- 17.Hamosh A et al. Online Mendelian Inheritance in Man (OMIM), a knowledgebase of human genes and genetic disorders. Nucleic Acids Res 30, 52–5 (2002). [DOI] [PMC free article] [PubMed] [Google Scholar]
- 18.Sveinbjornsson G et al. Weighting sequence variants based on their annotation increases power of whole-genome association studies. Nat Genet 48, 314–317 (2016). [DOI] [PubMed] [Google Scholar]
- 19.Karczewski KJ et al. Systematic single-variant and gene-based association testing of thousands of phenotypes in 394,841 UK Biobank exomes. Cell Genomics 2, 100168 (2022). [DOI] [PMC free article] [PubMed] [Google Scholar]
- 20.Pan-UKB team https://pan.ukbb.broadinstitute.org. (2020).
- 21.Mountjoy E et al. An open approach to systematically prioritize causal variants and genes at all published human GWAS trait-associated loci. Nat Genet 53, 1527–1533 (2021). [DOI] [PMC free article] [PubMed] [Google Scholar]
- 22.Ferkingstad E et al. Large-scale integration of the plasma proteome with genetics and disease. Nat Genet 53, 1712–1721 (2021). [DOI] [PubMed] [Google Scholar]
- 23.Denny JC et al. Systematic comparison of phenome-wide association study of electronic medical record data and genome-wide association study data. Nat Biotechnol 31, 1102–1111 (2013). [DOI] [PMC free article] [PubMed] [Google Scholar]
- 24.Kuhn M, Letunic I, Jensen LJ & Bork P The SIDER database of drugs and side effects. Nucleic Acids Res 44, D1075–D1079 (2016). [DOI] [PMC free article] [PubMed] [Google Scholar]
- 25.Hingorani AD et al. Improving the odds of drug development success through human genomics: modelling study. Scientific Reports 9, 18911 (2019). [DOI] [PMC free article] [PubMed] [Google Scholar]
- 26.Stein D et al. Genome-wide prediction of pathogenic gain- and loss-of-function variants from ensemble learning of a diverse feature set. bioRxiv, 2022.06.08.495288 (2022). [DOI] [PMC free article] [PubMed] [Google Scholar]
- 27.Estrada K et al. Identifying therapeutic drug targets using bidirectional effect genes. Nat Commun 12, 2224 (2021). [DOI] [PMC free article] [PubMed] [Google Scholar]
- 28.Chen B & Altman RB Opportunities for developing therapies for rare genetic diseases: focus on gain-of-function and allostery. Orphanet J Rare Dis 12, 61 (2017). [DOI] [PMC free article] [PubMed] [Google Scholar]
- 29.Kok BP et al. Discovery of small-molecule enzyme activators by activity-based protein profiling. Nat Chem Biol 16, 997–1005 (2020). [DOI] [PMC free article] [PubMed] [Google Scholar]
- 30.Kobayashi K et al. Class B1 GPCR activation by an intracellular agonist. Nature (2023). [DOI] [PMC free article] [PubMed] [Google Scholar]
- 31.Okuyama R Chronological Analysis of First-in-Class Drugs Approved from 2011 to 2022: Their Technological Trend and Origin. Pharmaceutics 15, 1794 (2023). [DOI] [PMC free article] [PubMed] [Google Scholar]
METHODS-ONLY REFERENCES
- 32.Bodenreider O The Unified Medical Language System (UMLS): integrating biomedical terminology. Nucleic Acids Res 32, D267–70 (2004). [DOI] [PMC free article] [PubMed] [Google Scholar]
- 33.Pendlington ZM. Mapping UK Biobank to the Experimental Factor Ontology (EFO) https://github.com/EBISPOT/EFO-UKB-mappings/blob/master/ISMB_Mapping_UK_Biobank_to_EFO.pdf. [Google Scholar]
- 34.Bento AP et al. The ChEMBL bioactivity database: an update. Nucleic Acids Res 42, D1083–90 (2014). [DOI] [PMC free article] [PubMed] [Google Scholar]
- 35.Wishart DS et al. DrugBank 5.0: a major update to the DrugBank database for 2018. Nucleic Acids Res 46, D1074–d1082 (2018). [DOI] [PMC free article] [PubMed] [Google Scholar]
- 36.Davies M et al. ChEMBL web services: streamlining access to drug discovery data and utilities. Nucleic Acids Res 43, W612–W620 (2015). [DOI] [PMC free article] [PubMed] [Google Scholar]
- 37.Gaulton A et al. The ChEMBL database in 2017. Nucleic Acids Res 45, D945–D954 (2016). [DOI] [PMC free article] [PubMed] [Google Scholar]
- 38.Santos R et al. A comprehensive map of molecular drug targets. Nat Rev Drug Discov 16, 19–34 (2017). [DOI] [PMC free article] [PubMed] [Google Scholar]
- 39.Cunningham F et al. Ensembl 2022. Nucleic Acids Res 50, D988–D995 (2021). [DOI] [PMC free article] [PubMed] [Google Scholar]
- 40.Köhler S et al. The Human Phenotype Ontology in 2021. Nucleic Acids Res 49, D1207–d1217 (2021). [DOI] [PMC free article] [PubMed] [Google Scholar]
- 41.Kuhn RM, Haussler D & Kent WJ The UCSC genome browser and associated tools. Brief Bioinform 14, 144–161 (2012). [DOI] [PMC free article] [PubMed] [Google Scholar]
- 42.Aguet F et al. The GTEx Consortium atlas of genetic regulatory effects across human tissues. Science 369, 1318–1330 (2020). [DOI] [PMC free article] [PubMed] [Google Scholar]
- 43.Karczewski KJ et al. The mutational constraint spectrum quantified from variation in 141,456 humans. Nature 581, 434–443 (2020). [DOI] [PMC free article] [PubMed] [Google Scholar]
- 44.Stekhoven DJ & Bühlmann P MissForest—non-parametric missing value imputation for mixed-type data. Bioinformatics 28, 112–118 (2011). [DOI] [PubMed] [Google Scholar]
- 45.R Core Team. R: A Language and Environment for Statistical Computing. R Foundation for Statistical Computing, Vienna, Austria. https://www.R-project.org/. (2022). [Google Scholar]
- 46.Duffy A & Do R Code and data repository for 'Development of a human genetics-guided priority score for 19,365 genes and 399 drug indications'. (Zenodo, 2023). [DOI] [PMC free article] [PubMed] [Google Scholar]
Associated Data
This section collects any data citations, data availability statements, or supplementary materials included in this article.
Supplementary Materials
Data Availability Statement
The GPS and GPS-DOE for 14,899 genes and 399 drug indications are publicly available at https://rstudio-connect.hpc.mssm.edu/geneticpriorityscore/ and https://doi.org/10.5281/zenodo.10044666. Public data used in this study mentioned in the methods are available via the listed URLs:
Open Target genetic evidence and clinical trial data (v22.06), https://platform.opentargets.org/downloads
SIDER 4.1, http://sideeffects.embl.de/download/
Drugbank (5.1.9), (https://go.drugbank.com/releases/latest)
Chembl (release 29), (https://ftp.ebi.ac.uk/pub/databases/chembl/ChEMBLdb/releases/chembl_29/)
Supplementary table 2 from Santos et al34
Ensembl (release 105), http://ftp.ensembl.org/pub/release-105/gtf/homo_sapiens/.
Online Mendelian Inheritance in Man (OMIM) (accessed 8 February 2022), https://www.omim.org/downloads
Human Gene Mutation Database (HGMD) Professional (accessed 12 March 2022), https://www.hgmd.cf.ac.uk/ac/index.php
Gene Burden results from Genebass, gs://ukbb-exome-public/500k/results/results.mt
Single Variant association results from Genebass, gs://ukbb-exome-public/500k/results/variant_results.mt
Genebass (500K), gs://ukbb-exome-public/300k/results/variant_results.mt
GTEx Analysis V8, https://www.gtexportal.org/home/datasets
Pan-UK Biobank, https://pan.ukbb.broadinstitute.org/downloads/index.html
UCSC liftover chain file, https://hgdownload.cse.ucsc.edu/goldenpath/hg19/liftOver/
Benjamin Neale’s lab GWAS summary statistics in the UK Biobank, http://www.nealelab.is/uk-biobank.
SAIGE GWAS summary statistics in the UK Biobank, https://www.leelabsg.org/resources.
ATC classification (Version 2022AA, uploaded 08/09/2022), https://bioportal.bioontology.org/ontologies/ATC
UMLS (accessed 18 January 2022), https://www.nlm.nih.gov/research/umls/licensedcontent/umlsknowledgesources.html
HPO annotations (accessed 8 February 2022), http://purl.obolibrary.org/obo/hp/hpoa/phenotype.hpoa
HPO to phecode map, https://www.ncbi.nlm.nih.gov/pmc/articles/PMC5959723/ Table S12
Phecode Map 1.2b1 to ICD-10 (beta), https://phewascatalog.org/phecodes_icd10
Phecode Map 1.2b1 to ICD-10-CM (beta), https://phewascatalog.org/phecodes_icd10cm
Phecode definitions, https://phewascatalog.org/files/phecode_definitions1.2.csv.zip
EBISPOT OLS – https://github.com/EBISPOT/EFO-UKB-mappings.
All analysis code is available on Zenodo46 (https://doi.org/10.5281/zenodo.10044666).