

Abstract
Inflammation is an important component of fibrosis but immune processes that orchestrate kidney fibrosis are not well understood. Here we apply single-cell sequencing to a mouse model of kidney fibrosis. We identify a subset of kidney tubule cells with a profibrotic-inflammatory phenotype characterized by the expression of cytokines and chemokines associated with immune cell recruitment. Receptor–ligand interaction analysis and experimental validation indicate that CXCL1 secreted by profibrotic tubules recruits CXCR2+ basophils. In mice, these basophils are an important source of interleukin-6 and recruitment of the TH17 subset of helper T cells. Genetic deletion or antibody-based depletion of basophils results in reduced renal fibrosis. Human kidney single-cell, bulk gene expression and immunostaining validate a function for basophils in patients with kidney fibrosis. Collectively, these studies identify basophils as contributors to the development of renal fibrosis and suggest that targeting these cells might be a useful clinical strategy to manage chronic kidney disease.
Fibrosis is the result of chronic inflammatory reactions induced by a variety of stimuli, including persistent infections, autoimmune reactions, allergic responses, chemical insults, radiation and tissue injury1. Renal fibrosis, the manifestation of chronic kidney disease (CKD) is the final pathway for end-stage renal failure. Overall, 850 million people suffer from CKD and its incidence is increasing2. CKD is one of the fastest-growing causes of death but treatment options are limited. Gaining a better understanding of the mechanism that regulates renal fibrosis is critically important to develop new therapeutic approaches to better manage this chronic condition.
Comprehensive genome-wide human kidney tissue transcriptomics identified changes in the expression of a large number of genes in fibrosis. Differentially expressed genes (DEGs) were enriched for metabolism and proximal tubule cell changes, indicating tubule cell dysfunction and loss in fibrosis3. As might be expected, inflammation and immune cell response signatures represented the second-largest gene cluster associated with kidney fibrosis3. However, a critical knowledge gap remains as the immune cells associated with kidney fibrosis have not been systematically characterized and the trigger for immune cell influx is poorly understood. Consequently, the immune cell interactions that contribute to the initiation and development of fibrotic processes in CKD are not well understood.
The activation of basophils, a rare innate immune cell type, is associated with a variety of allergic diseases4. Basophils respond to a wide array of stimuli including antibody–antigen complexes and cytokines such as interleukin (IL)-3, IL-18 and IL-33. Once activated, basophils release mediators of inflammation, including histamine, leukotrienes, prostaglandins, cytokines (IL-3, IL-4, IL-6, IL-9 and IL-13) and chemokines (CCL3 and CCL4)5. In addition to their effector functions, basophils have been shown to influence other immune cells such as macrophages and lymphocytes6,7. Basophils have been implicated in immune-mediated kidney disorders8; however, their role in kidney fibrosis remains to be defined. Exploring the role of basophils in renal fibrosis is rational and attractive considering recent reports demonstrating an association between basophils and cardiac allograft fibrosis9 and myocardial infarction10.
Mast cells were once thought to be basophils that migrated from the blood into their resident tissues, but they are now known to be distinct cell types11. In contrast to basophils, mast cells have been proposed to play important role in CKD and renal fibrosis12.
To unravel the molecular mechanism of kidney fibrosis development and disentangle the immune cell network, we performed single-cell RNA sequencing (RNA-seq) and analyzed the transcriptome of over 60,000 individual cells. This strategy identified alteration in proximal tubule cells and their interaction with basophils as an unappreciated and key pathway that contributes to renal fibrosis.
Results
The cellular atlas of kidney fibrosis.
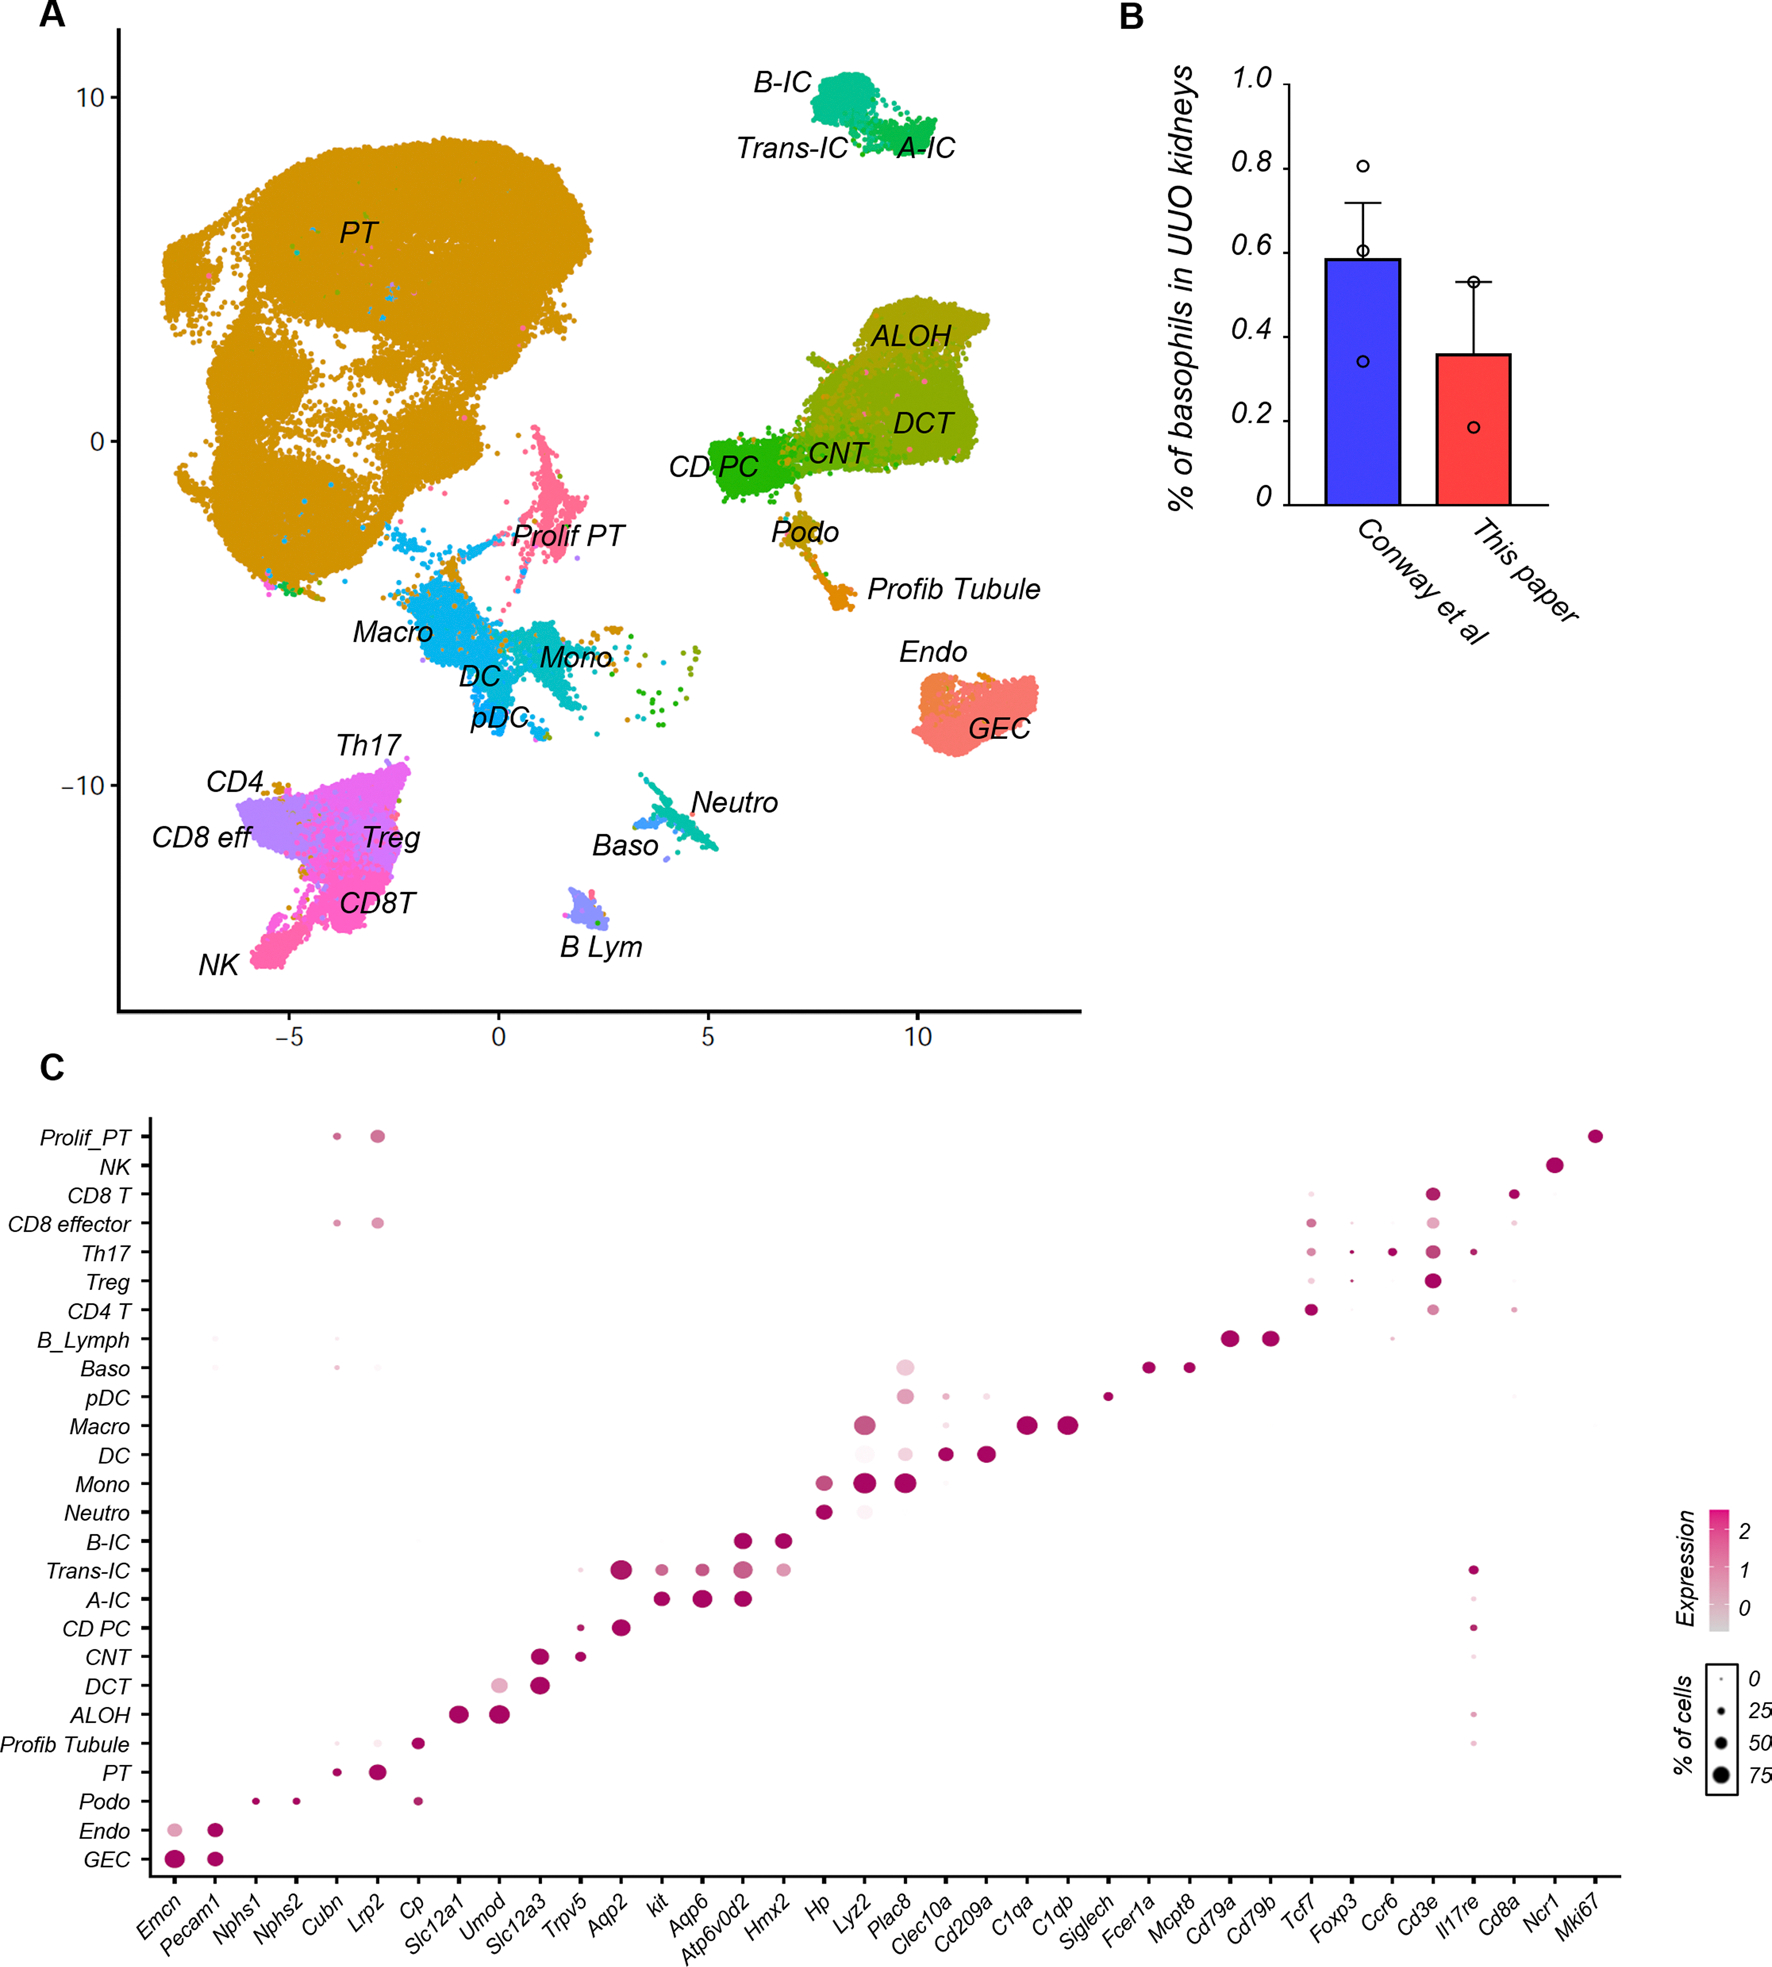
To develop a comprehensive overview of the cellular and molecular changes associated with kidney fibrosis, we analyzed the transcriptome of 77,393 individual cells from kidneys of wild-type mice subjected to sham or unilateral ureter obstruction (UUO) surgery (six kidneys from sham and two kidneys from UUO; 31,323 cells from sham and 46,070 cells from UUO; Fig. 1a). After initial dimension reduction, we excluded proximal tubules (PTs) (as they represented the majority of cells) to accurately cluster smaller cell populations. Unbiased clustering identified 28 cell populations (Fig. 1b). Cell clusters were annotated based on previously reported marker gene expression and identified kidney epithelial cells, including podocytes, epithelial cells from different tubule segments and immune cell populations that included different T cell populations and a variety of innate cell types (Fig. 1b, Supplementary Figs. 1 and 2 and Supplementary Table 1). Fibroblasts were part of cluster 2 (endothelial cells) and showed enrichment for classic fibroblast markers such as Col1a1, Col3a1, Dcn and Pdgfrb13,14 (Supplementary Fig. 3). Key cell type-specific markers were preserved in fibrotic samples and could be used to accurately identify cell types both in sham and UUO samples (Fig. 1c). As immune cells are often difficult to distinguish only based on gene expression information, reference gene expression datasets generated for sorted cells by the ImmGen database15 were leveraged. This approach revealed the presence of six different myeloid cells such as neutrophils, monocytes, macrophages, dendritic cells (DCs), plasmacytoid dendritic cells (pDCs) and basophils. For instance, we identified pDCs by the expression of Siglech, Cox6a2 and Cd300c in cluster 18 (Fig. 1d). These markers can specifically identify pDCs even when more than 200 immune cell types were profiled (Supplementary Fig. 4a,b). The reference datasets also allowed us to identify DCs and macrophages. Basophils were identified based on their expression of Mcpt8, Fcer1a and Cd200r3 (Fig. 1d and Supplementary Fig. 4a,b). Basophils did not express neutrophil (S100a8), eosinophil (Il5ra and Siglecf) and mast cell (Mcpt4 and Kit) markers (Extended Data Fig. 1a). The presence of Mcpt8-positive basophils in kidneys of UUO or folic acid injection-induced fibrosis was validated by in situ hybridization (Extended Data Fig. 1b). Using the ImmGen database we also detected six different clusters of T cells; CD4+ T, regulatory (Treg), TH17 subset of helper T, natural killer T (NKT), CD8+ effector and CD8+ T cells (Fig. 1e). The majority of immune cells were observed in UUO samples; only a few immune cells were detected in sham kidneys16 (Supplementary Fig. 5a,b), indicating the increased immune cell number and diversity in kidneys with fibrosis. For further validation, we also integrated our results with publicly available single-cell RNA-seq data obtained from UUO kidneys (collected at different time points)17. The percentage of basophils in UUO kidneys were similar in both datasets, demonstrating the robustness of our analysis (Extended Data Fig. 2a–c).
Fig. 1 |. Single-cell atlas of mouse kidney fibrosis.

a, Experimental procedure. Kidneys from six sham and two UUO wild-type (WT) mice were digested into single cells and subjected to single-cell RNA-seq using 10X Genomics. b, Uniform Manifold Approximation and Projection (UMAP) dimension reduction of 59,609 cells showing 28 distinct cell types identified by unsupervised clustering. GEC, glomerular endothelial cell; Endo, endothelial; Podo, podocyte; Profib, profibrotic; ALOH, ascending loop of Henle; DCT, distal convoluted tubule; CNT, connecting tubule; CD PC, collecting duct principal cell; A-IC, α intercalated cell; B-IC, β intercalated cell; Trans-IC, transitional intercalated cell; Prolif PT, proliferating PT; Neutro, neutrophil; Mono, monocyte; Macro, macrophage; Baso, basophil; B Lymph, B lymphocyte; Prolif Ly, proliferating lymphocyte. c, Bubble plots showing the expression of cell cluster marker genes in sham (red) and UUO kidneys (blue). d, Heat map showing gene expression patterns in myeloid cells (Neutro, Mono, DC, Macro, pDC and Baso). Each row represents one gene and each column represents a cell. Genes enriched in the basophil cluster were highlighted in red. e, Heat map showing gene expression patterns in lymphoid cells (CD4+, Treg, TH17, NKT, CD8+ effector and CD8+ T). Each row represents one gene and each column represents a cell.
The identification of profibrotic PT in kidney fibrosis.
Next, we examined cell-type-specific gene expression changes in fibrotic samples. The full list of cell-type-specific gene expression differences are in Supplementary Table 2. We found that PT cells had one of the largest numbers of DEGs. Subclustering and cell trajectory analyses were performed to identify disease-specific dynamic PT cell differentiation changes in UUO kidneys. Our previous studies identified five PT subclusters: precursor, S1-precursor, two S1 clusters and S3 clusters in control healthy kidneys3. Subclustering of UUO PT cells identified eight PT cell types, including precursor, S1, S2 and S3 PTs (Fig. 2a and Supplementary Table 3). The analysis revealed a subcluster with high Mki67 expression (Fig. 2b), likely representing proliferating PT cells. Notably, another subcluster expressed high levels of Pdgfb, well-known secreted molecules responsible for fibroblast activation18 (Fig. 2b). We labeled these cells ‘profibrotic PT’ cells. Profibrotic PT cells were positive for the well-known PT cell markers Lrp2 (encode megalin) and Slc34a1 (refs. 19,20), confirming that these cells are actual PT cells (Extended Data Fig. 3a).
Fig. 2 |. Profibrotic proximal tubule cell differentiation in uuo kidneys.
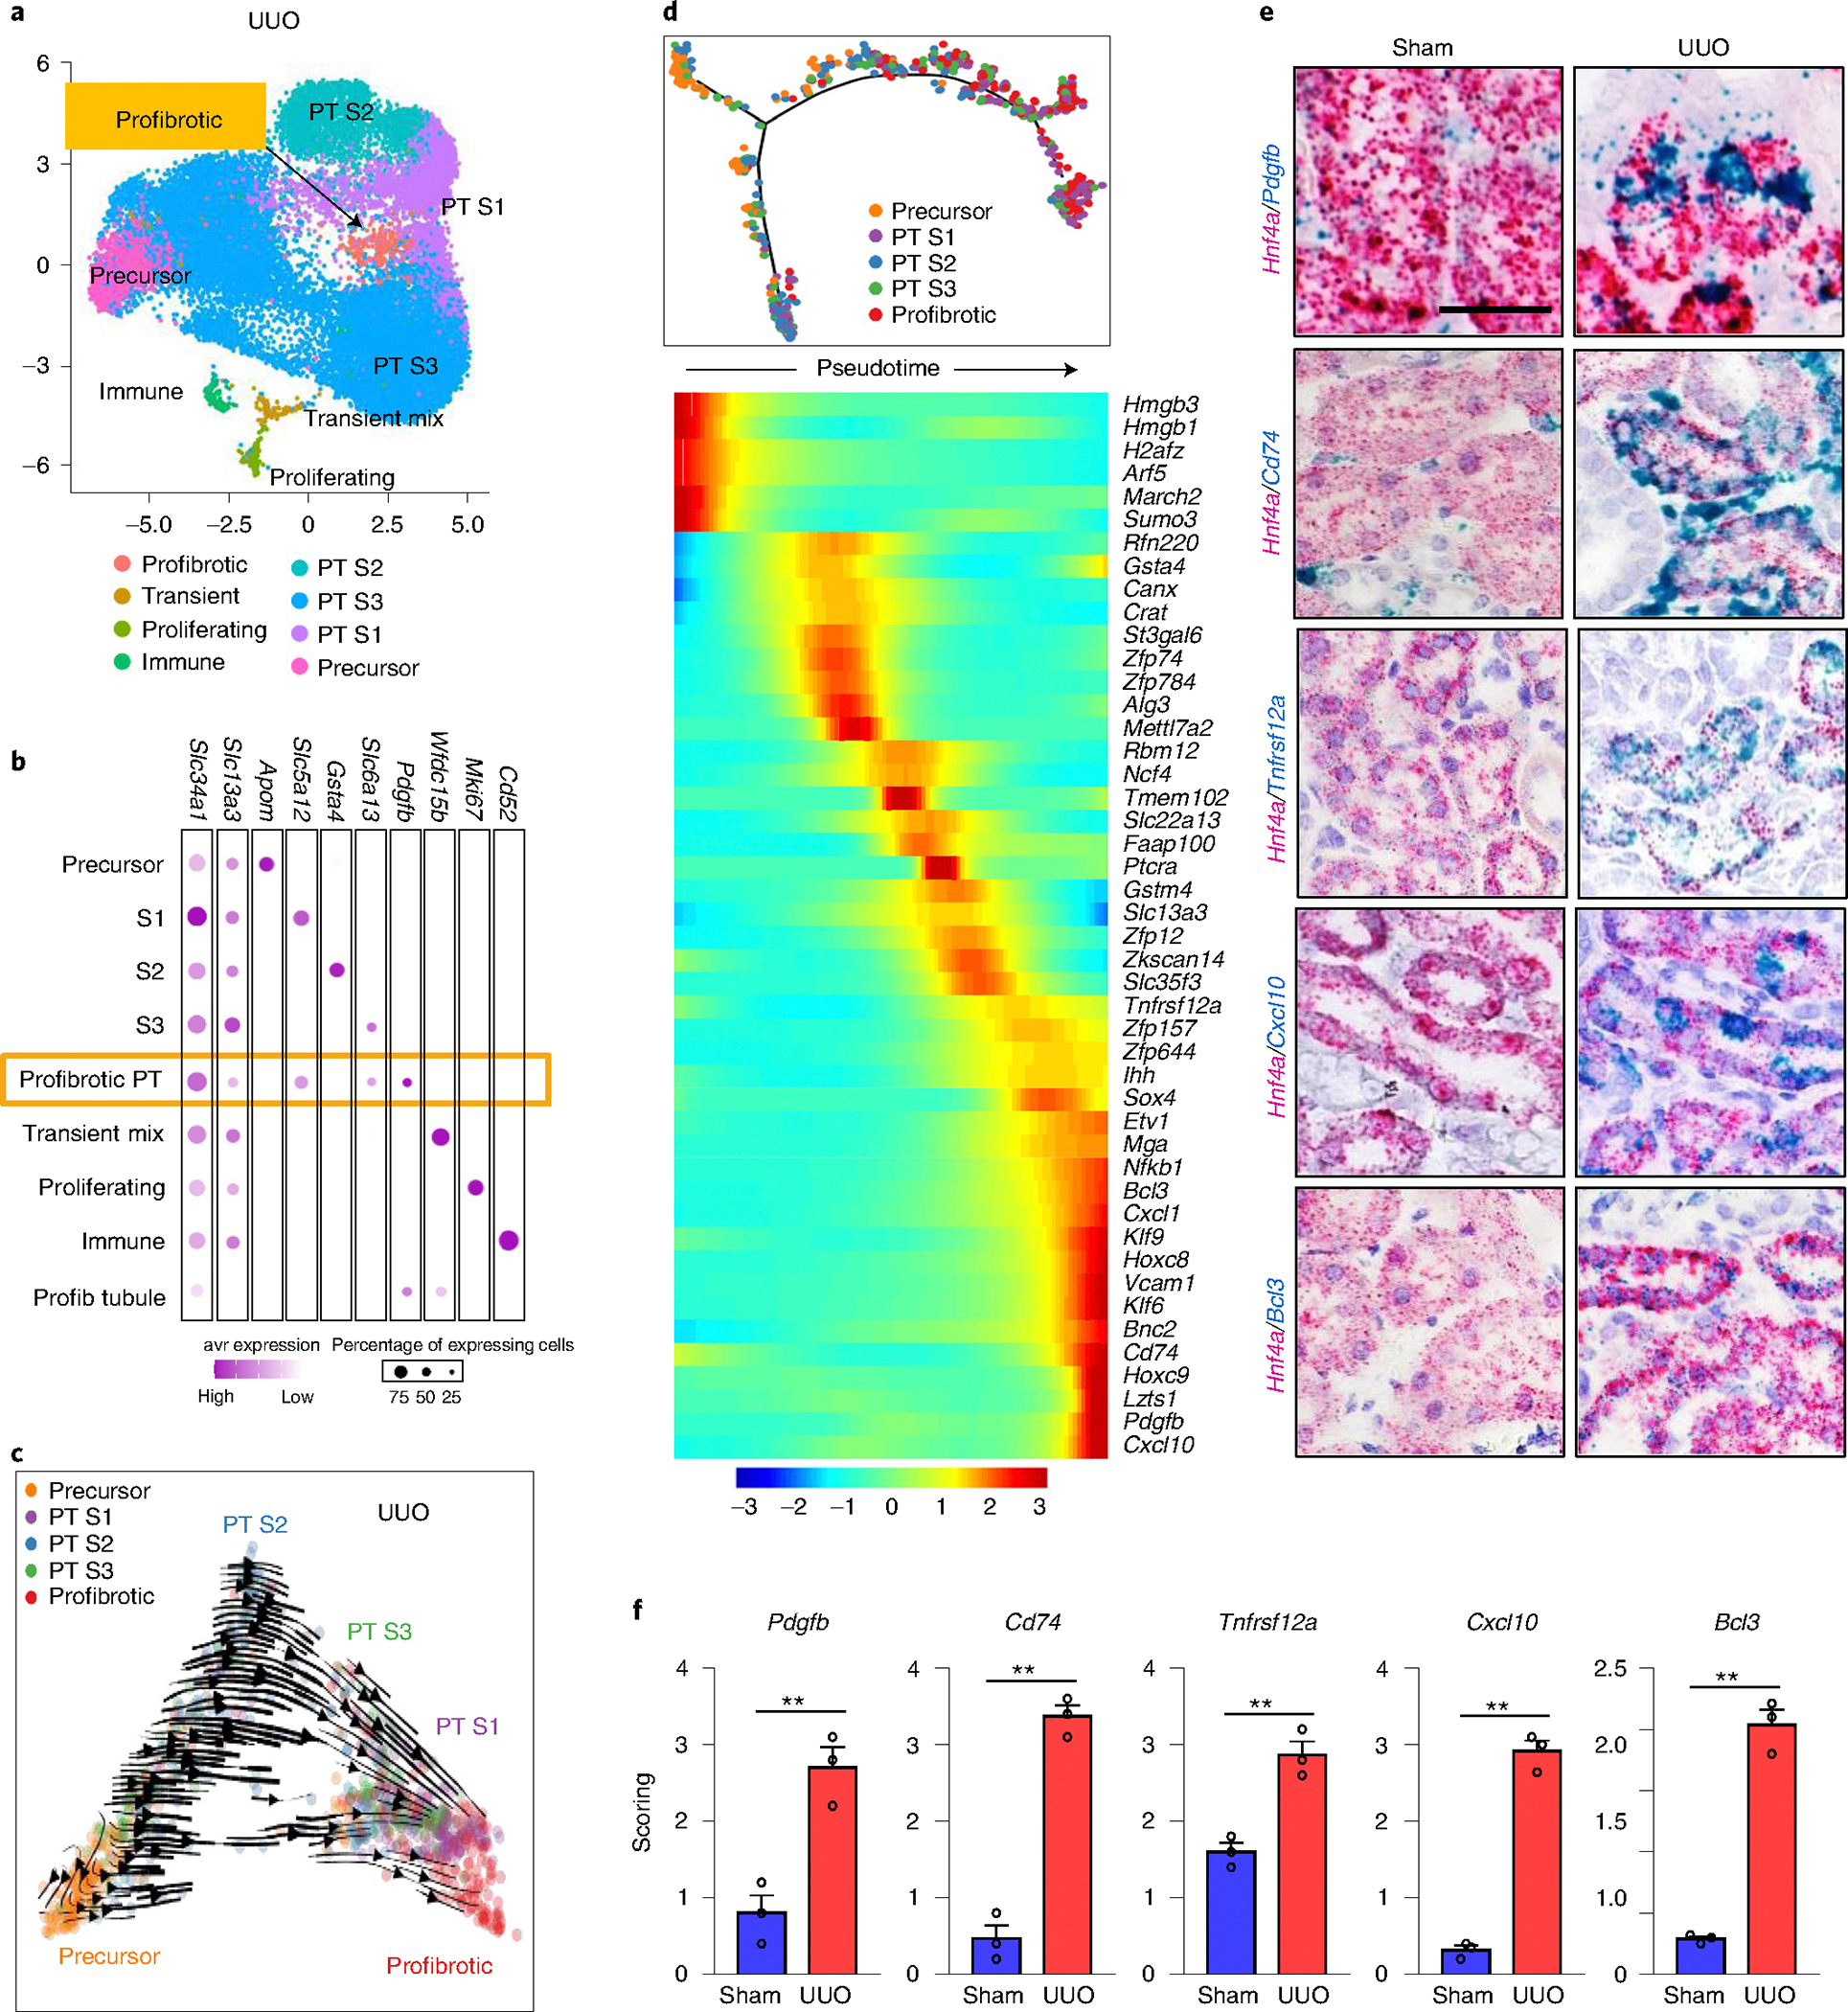
a, Subclustering analysis of PT in the UUO kidney. Profibrotic PT cluster is highlighted in orange. b, Bubble plot of representative genes in each subcluster Slc34a1, Slc13a3 (PT), Apom (precursor PT), Slc5a12 (S1), Gsta4 (S2), Slc6a13 (S3), Pdgfb (profibrotic PT), Wfdc15b (transient mixed PT), Mki67 (proliferating PT) and Cd52 (immune). c, RNA velocity cell trajectory analysis of proximal tubule cells in the UUO model of kidney fibrosis. d, Genes showing change in expression along the cell differentiation trajectory by Monocle. Red indicates higher expression, blue indicate lower expression. e, Representative double in situ hybridization images of Hnf4a (PT marker) and gene expressed by profibrotic PT cells, Pdgfb, Cd74, Tnfrsf12a, Cxcl10 and Bcl3 in sham and UUO kidneys. Scale bars, 20 μm. Data are representative of three independent experiments. f, Semi-quantification of the double in situ hybridization images for Pdgfb, Cd74, Tnfrsf12a, Cxcl10 and Bcl3 in sham and UUO kidneys (n = 3 in each). **P < 0.01. Data are presented as mean ± s.e.m. and were analyzed using a two-tailed Student’s t-test.
In total, this analysis identified 404 DEGs in profibrotic PT cells (adjusted P value <0.05; Supplementary Table 3), of which 82 overlapped with the profibrotic PT cell signature characterized in our ischemic injury model (Balzer et al. under review; Extended Data Fig. 3b). It is noteworthy that profibrotic PT cells also expressed a proinflammatory gene signature that included Cd74, Tnfrsf12a, Cxcl1, Cxcl10 and Cxcl16 (Supplementary Table 3).
In addition to the profibrotic PT cell cluster, we identified an another cluster expressing a profibrotic and inflammatory gene signature such as Pdgfb and Cxcl1 (cluster 5 in Figs. 1a and 2b and Supplementary Table 1). These cells expressed the tubule epithelial marker, Epcam and were weakly positive for PT markers Lrp2, Hnf4a and Slc34a1, but negative for others such as slc13a3 and slc22a6. They were also positive for descending loop of Henle markers Aqp1, Cryab and Cp21 (Fig. 2b and Extended Data Fig. 3a,c). The descending loop of Henle is the next tubule segment contiguous with the PT. We labeled these cells as profibrotic tubules.
To evaluate the potential origin and cellular differentiation of the profibrotic PT cluster, we performed RNA velocity analysis. Compared to the previously observed simple differentiation of precursor cells into S1 and S3 segment PT cells, we observed an alternative differentiation path from precursor PT cells toward profibrotic PT cells in UUO kidneys (Fig. 2c). Cell trajectory analysis depicted by Monocle further validated the alternative differentiation of profibrotic PT cells from precursor PT cells. Profibrotic PT cells were again enriched for the expression of a fibroinflammatory genes such as Cxcl1, Cxcl10, Pdgfb, Bcl3, Tnfrsf12a, Cd74 and Vcam1 (refs. 22,23; Fig. 2d). Regulon activity analysis for PT subclusters identified higher expression levels of Bcl3, Cebpb, Hes1, Stat3, Klf6, Stat5a and Ddit3. These transcription factors are known to directly regulate cytokine expression24 (Extended Data Fig. 4 and Supplementary Table 4).
To confirm and visualize profibrotic PT tubules, double in situ hybridization was performed in sham and UUO kidneys using probes for Pdgfb, Cd74, Tnfrsf12a, Cxcl10 or Bcl3; markers identified in profibrotic PT cells and Hnf4a, the well-established PT-specific marker. Cells expressing profibrotic markers (in blue) seemed to be distributed randomly within the Hnf4a-positive (in pink) PTs (Fig. 2e). Their expressions were markedly higher in UUO kidneys compared to sham (Fig. 2f).
Collectively, subclustering, RNA velocity, cell trajectory, regulon activity and in situ hybridization identified profibrotic PT cells in UUO kidneys, whereas their increased expression of cytokines and chemokines suggested that they could contribute to fibro-inflammation.
Profibrotic PT recruit basophils and other immune cells.
As profibrotic tubules expressed a large number of cytokines and chemokines, we explored cell–cell interactions in UUO kidneys using comprehensive receptor–ligand binding information. Particularly, we observed the expression of Il34, Cxcl16 and Cxcl10, in profibrotic PT cells and their receptors, Csf1r, Cxcr6 and Cxcr3 in lymphoid or myeloid cells, respectively (Fig. 3a). In addition, profibrotic PT cells expressed Pdgfb, a key profibrotic growth factor and its receptor, Pdgfrb, was expressed by fibroblasts (Fig. 3a). Together, these results suggest that profibrotic PT cells may contribute to the recruitment of myeloid and lymphoid cells and the local activation of fibroblasts25–27. In silico deconvolution of bulk RNA-seq data confirmed an increase in lymphoid and myeloid cells including basophils in UUO kidneys whereas the fraction of renal tubular epithelial cells was decreased (Fig. 3b).
Fig. 3 |. The interaction between profibrotic PT cells and basophils in kidney fibrosis.

a, Bubble plots showing the average gene expression levels and percentage of expressing cells across all cell types in sham and UUO kidneys. Arrows show the direction of ligand–receptor interaction. The following interaction are shown Il34–Csf1r, Cxcl16–Cxcr6, Cxcl10–Cxcr3 and Pdgfb–Pdgfrb. b, Heat map of the deconvolution analysis of bulk RNA-seq of sham and UUO kidneys. Red indicates higher relative cell fraction, blue indicates lower relative cell fraction. The cell clusters were ranked by the significance (between sham and UUO) from top to bottom. c, The flow cytometry strategy of kidney basophil detection and quantification in sham and UUO kidneys from WT mice (n = 3 in each). The gating strategy is also shown in Supplementary Fig. 6. **P < 0.01. d, Bubble plots showing the average gene expression levels and percentage of expressing Cxcl1-Cxcr2 in sham and UUO kidneys. e, Representative double in situ hybridization images of Hnf4a (PT marker) with Cxcl1 (profibrotic PT) and Mcpt8 (basophil marker) and Cxcr2 (basophil). Scale bars, 50 μm (top) and 5 μm (bottom). Data are representative of two independent experiments. f, Basophil chemotaxis assay. Basophils were isolated from WT mice by FACS and stimulated with culture medium or CXCL1 (10 nM). The migrated basophils were measured by fluorescent dye loading of cells (expressed as RFU, relative fluorescence units) (n = 6 in each condition). **P < 0.01. Data are presented as mean ± s.e.m. (c,f) and were analyzed using a two-tailed Student’s t-test.
We next focused on basophils as their role in kidney fibrosis has not been studied. First, we experimentally validated the presence and the increase in kidney basophils fraction in UUO kidneys by FACS using multiple established standard basophil markers, such as CD49b, CD200R3 and FcεR (Fig. 3c and Supplementary Fig. 6). In silico cell–cell interaction analysis indicated a predicted interaction between profibrotic PT cells expressing Cxcl1 and basophils expressing its receptor Cxcr2 (Fig. 3d). In situ hybridization confirmed the expression of Cxcl1 in PT cells in UUO kidneys (coexpressed with PT marker Hnf4a) and Cxcr2, the receptor for Cxcl1 in basophils (coexpressed with basophil marker Mcpt8) (Fig. 3e). Indeed, in vitro chemotaxis assay using flow-sorted basophils showed that CXCL1 treatment alone was sufficient to enhance basophil migration in vitro (Fig. 3f).
In summary, single-cell interaction analysis indicated that secreted cytokines and chemokines by profibrotic PT cells are likely responsible for the recruitment of immune cells in UUO kidneys. An unanticipated interaction of profibrotic PT cells with basophils identified the role of CXCL1 in basophils recruitment.
Depletion of basophils protected from renal fibrosis.
To explore the functional role of basophils in renal fibrosis, we crossed the Mcpt8Cre mice with diphtheria toxin receptor (DTR)-expressing mice. MCPT8 is a basophil-specific marker and Mcpt8Cre/DTR mice have been used to study the role of basophils in a variety of conditions28,29. We injected Mcpt8Cre/DTR mice with diphtheria toxin (DT), at a dose of 240 ng DT per 20 gr body weight29 (Fig. 4a). UUO was performed 3 d after the first DT injection and kidneys were collected 7 d after UUO. Flow cytometry analysis confirmed the successful depletion of basophils in kidneys of Mcpt8Cre/DTR mice (Fig. 4b). Expression of Col1a1, Col3a1, Timp1 and Acta2 was higher in UUO kidneys and their levels were observably lower in UUO kidneys of Mcpt8Cre-DTR mice compared to wild-type mice (Fig. 4c). The severity of tubular interstitial damage and renal fibrosis in UUO kidneys were mitigated in Mcpt8Cre/DTR mice (Fig. 4d,e).
Fig. 4 |. Mice with genetic or antibody-mediated depletion of basophils are protected from renal fibrosis.

a, Experimental design. Mcpt8Cre mice were crossed with DTR mice. Mcpt8Cre-DTR mice were treated with DT (240 ng per 20 g body weight) on D1, D5 and D9. UUO surgery was performed on D4 and mice were killed on D11. b, The percentage of basophil detected by FACS in kidney samples of experimental groups (n = 3). **P < 0.01. c, Relative transcript level of Col1a1, Timp1 and Acta2 in experimental groups (n = 6 in each group). Gene expression levels were normalized to Gapdh. *P < 0.05, **P < 0.01. d, The representative images and semi-quantitative analysis of hematoxylin and eosin (H&E) staining in experimental groups (n = 6 in each group). Scale bars, 20 μm. *P < 0.05. e, The representative images and quantitative analysis of Sirius red staining in experimental groups (n = 6 in each group). Scale bars, 20 μm. *P < 0.05. f, Experimental design. WT mice were injected intraperitoneally with the MAR-1 antibody or isotype control IgG for three consecutive days (D1, D2 and D3). UUO was performed at D4 and mice were killed on D11. g, Relative transcript level of Col3a1, Col1a1, Timp1 and Acta2 in sham and UUO kidneys of WT mice injected with isotype control IgG or MAR-1 antibody (n = 6 in each group). Gene expression levels were normalized to Gapdh. *P < 0.05, **P < 0.01. h, The representative images and semi-quantitative analysis of H&E staining in experimental groups (n = 6 in each group). Scale bars, 20 μm. *P < 0.05. i, Representative images and quantitative analysis of Sirius red staining in experimental groups (n = 6 in each group). Scale bars, 20 μm. *P < 0.05. Data are presented as mean ± s.e.m. (b–e,g–i) and were analyzed using a one-way analysis of variance (ANOVA) followed by Tukey post hoc test for multigroup comparison.
To investigate the therapeutic potential of basophil depletion in renal fibrosis, we tested the effect of the MAR-1 antibody. Antibody-mediated basophil depletion (by MAR-1 antibody) has been used in multiple previous studies7,30. We injected MAR-1 antibody for three consecutive days into wild-type mice, followed by UUO surgery and kidneys were collected 7 d later (Fig. 4f). Expression of fibrosis markers; Col1a1, Col3a1, Timp1 and Acta2 were higher in UUO kidneys, whereas their levels were lower in MAR-1 antibody-injected wild-type mice when compared to isotype control IgG-injected wild-type mice (Fig. 4g). Histological alterations, such as tubule atrophy and collagen accumulation were also attenuated in UUO kidneys of MAR-1 antibody-injected wild-type mice (Fig. 4h,i). Together, these two complementary approaches to basophil depletion identified the contribution of basophils in the development of renal fibrosis.
Basophils are the source of IL-6 in kidney fibrosis.
Next, we set out to explore the mechanism of basophil-mediated kidney fibrosis. Our single-cell analysis indicated higher expression of Il6, an important secreted cytokine in basophils of UUO kidneys (Fig. 5a). In addition, the expression of Il18r1 and Il1rl1 (receptors for Il18 and Il33, respectively) was also higher in basophils of UUO kidneys (Fig. 5a). Consistently, bulk RNA-seq data showed higher Il6, Il18r1 and Il1rl1 expression in UUO kidneys compared to shams, but Il4 expression levels did not show the observable difference (Fig. 5a,b).
Fig. 5 |. Basophil respond to IL-18 and IL-33 and release IL-6 in uuo kidneys.

a, Bubble plots showing the average gene expression and percentage of expressing cells Il4, Il6, Il18r1 and Il1rl1 in sham and UUO kidneys. b, The relative expression (FPKM) levels of Il4, Il6, Il18r1 and Il1rl1 in sham and UUO kidneys of WT mice by bulk RNA-seq (n = 3, respectively). *P < 0.05, **P < 0.01, ***P < 0.001; NS, not significant. Significance was determined using DESeq2. c, In vitro basophil stimulation assay. Basophils were cultured and stimulated with medium only, or recombinant IL-18 and IL-33 (rIL-18 and rIL-33) in the absence of IL-3. IL-6 levels were measured in the supernatant (n = 4 in each condition). ***P < 0.001. d, Representative double in situ hybridization images of Il6 with Mcpt8 (basophil) in sham and UUO kidneys of WT mice. Enlarged image of the box in the left image (right). Scale bars, 20 μm. Data are representative of two independent experiments. e, The mRNA and protein expression levels of IL-6 in sham and UUO kidneys of WT mice and mice with genetic depletion of basophils (Mcpt8Cre-DTR) (n = 6 in each group). Gene expression levels were normalized to Gapdh. IL-6 protein levels were normalized for total protein amount. **P < 0.01. f, The mRNA and protein expression levels of IL-6 in sham and UUO kidneys of WT mice with isotype control IgG or MAR-1 antibody injection (n = 6 in each group). Gene expression levels were normalized to Gapdh. IL-6 protein levels were normalized for total protein levels. *P < 0.05, **P < 0.01. Data are presented as mean values ± s.e.m. (b,c,e,f) and were analyzed using a one-way ANOVA followed by Tukey post hoc test for multigroup comparison.
To confirm basophil activation and cytokine secretion, we used FACS to isolate basophils and cultured them in the presence of IL-18 or IL-33 (Fig. 5c and Supplementary Fig 7a,b). Following recombinant IL-18 or IL-33 treatment, we observed markedly increased IL-6 levels (measured by ELISA) in the supernatant (Fig. 5c). In situ hybridization further validated high Il6 expression in basophils (Mcpt8-positive cells) in UUO kidneys (Fig. 5d). Consistent with the contribution of basophils as a source of IL-6, we found that the transcript and protein expression levels of IL-6 were observably lower in UUO kidneys following genetic (Mcpt8Cre-DTR) or antibody-mediated (MAR-1) basophil depletion (Fig. 5e,f). Il18 and Il33 mRNA and protein expressions were detected mainly in the stroma and their levels were higher in UUO kidneys compared to sham kidneys (Extended Data Fig. 5a–c). Collectively, these data indicate that basophils are a source of IL-6 and basophil activation is provoked in response to IL-18 and IL-33 in UUO kidneys.
IL-6 receptor blockage protected from renal fibrosis.
Our studies indicated the role of basophils in IL-6 production in UUO kidneys. To test the role of IL-6 in kidney disease development, we injected wild-type mice with anti-IL-6 receptor (IL-6R) antibody or isotype control IgG every 3 d and induced kidney fibrosis by UUO. Kidneys were collected 7 d after UUO (Fig. 6a). The expression levels of fibrosis markers, including Col1a1, Col3a1, Timp1 and Acta2 and collagen accumulation were lower in UUO kidneys of the anti-IL-6R antibody-treated wild-type mice compared to the isotype control IgG-treated wild-type mice (Fig. 6b,c).
Fig. 6 |. IL-6 receptor blockade protected from renal fibrosis and TH17 cell expansion.

a, Experimental design. The anti-IL-6R Ab (400 μg) or isotype control IgG were injected into WT mice intraperitoneally at D1, D4 and D7. UUO was performed at D2 and mice were killed at D9. b, Relative transcript level of Col1a1, Col3a1, Timp1 and Acta2 in sham and UUO kidneys of experimental groups (n = 4 in each group). Gene expression levels were normalized to Gapdh. *P < 0.05, **P < 0.01. c, The representative images and quantitative analysis of Sirius red staining in experimental groups (n = 4 in each group). Scale bars, 20 μm. **P < 0.01. d, Bubble plots showing the average gene expression and percentage of expressing cells of Il6st and Il6ra in sham and UUO kidneys. e, RNA velocity analysis of T lymphocytes in UUO kidneys, showing CD4+, CD8+, CD8+ effector, TH17, Treg cells, NK and NKT cells. f, Cell trajectory analysis by Monocle and heat map showing changes in expression of genes along the differentiation trajectory. g, Relative transcript level of Il17a and Tgfb1 in sham and UUO kidneys of WT mice and mice with genetic depletion of basophils (Mcpt8Cre-DTR) (n = 6 in each group). Gene expression levels were normalized to Gapdh. *P < 0.05. Data are presented as mean ± s.e.m. (b,c,g) and were analyzed using a one-way ANOVA followed by Tukey post hoc test for multigroup comparison.
Next, we wanted to understand the mechanism of basophil-mediated fibrosis development. First, we estimated immune cell fractions by quantitative PCR with reverse transcription (qRT–PCR) in UUO kidneys following basophil depletion. We found that levels of Ccr6, a top marker gene of TH17 cells were lower, whereas other immune cell type markers failed to show the observable change in UUO kidneys of mice with genetic depletion of basophils (Mcpt8Cre-DTR) (Extended Data Fig. 6 and Supplementary Table 1). We confirmed the reduction in TH17 cells in UUO kidneys following genetic basophil depletion by flow cytometric analysis. FACS analysis indicated no observable change in CD4+ T, CD8+ T, Treg and mast cells in kidneys of mice with genetic deletion of basophils (Extended Data Fig. 7a,b).
Multiple previous reports demonstrated the role of IL-6 in regulating TH17 cell differentiation from CD4+ T cells31. Consistently, our single-cell RNA-seq detected higher Il6ra and Il6st, receptors of Il6, in CD4+ T and TH17 cells in UUO kidneys (Fig. 6d). RNA velocity analysis indicated enhanced differentiation of TH17 cells from CD4+ T cells in UUO kidneys (Fig. 6e). Monocle trajectory analysis showed consistent CD4+ T cells differentiation toward TH17 and Treg cells (Fig. 6f). TH17 cells were enriched for Il17a and Tgfb1 (Fig. 6f). The expression levels of Il17a and Tgfb1 were higher in UUO kidneys, but their levels were lower in UUO kidneys of mice with basophil depletion (Fig. 6g).
In summary, these results demonstrated the contribution of IL-6 and TH17 as downstream mediators in kidney fibrosis.
Higher IL6 and basophil numbers in human kidney fibrosis.
Our animal model studies identified a role for basophils in the development of renal fibrosis. To determine relevance of these findings to human kidney fibrosis, a feature of CKD, we performed single-cell RNA-seq of human kidneys from healthy control and CKD samples. Following quality control and filtering low-quality cells, we identified 13,380 cells and 17 cell clusters. We were able to annotate basophil/mast cell clusters in human kidney samples and this cluster mainly (94% of cells) originated from the fibrotic kidney (Fig. 7a, Supplementary Fig 8 and Supplementary Table 5). We could not separate basophils and mast cells due to their similarities in the overall cell clustering, however, the subclustering analysis indicated the heterogeneous expression of KIT, a marker of mast cell and CD63, a marker of basophils, allowing us to differentiate these two cell types (Supplementary Fig. 9). Next, we stained basophils with CD203c (2D7), a marker of activated human basophils, in healthy control or CKD human kidney samples. Basophils were exceedingly rare in healthy control human kidneys, but their number was higher in CKD kidneys (Fig. 7b). Furthermore, deconvolution of bulk RNA-seq analysis of microarray samples obtained from kidneys of 95 patients with and without diabetes and hypertension with variable degree of fibrosis showed a clear correlation between basophil number and renal fibrosis (Fig. 7c and Supplementary Table 6). In addition, the degree of kidney fibrosis positively correlated with the number of CD4+ T, CD8+ effector T, TH17, Treg, NKT, DC, neutrophil or fibroblasts and negatively correlated with the percent of PT cells (Supplementary Fig 10).
Fig. 7 |. Increased number of basophils in kidneys of patients with CKD.

a, Single-cell analysis of healthy control and CKD human kidney samples. Basophil/mast cell cluster was highlighted with red arrow. Note that the increase in number of basophils/mast cells in CKD samples. b, Representative immunofluorescence staining of CD203c (activated basophils) and quantification of basophil numbers in healthy control and CKD kidneys (n = 6, respectively). Higher magnification image of image on left (right). Arrow points to basophils. Scale bars, 20 μm. **P < 0.01. Data are presented as mean ± s.e.m. Data were analyzed using a two-tailed Student’s t-test. c, In silico deconvolution analysis of bulk microarray data 95 human kidney samples with variable degree of fibrosis. The correlation plot of basophils fraction (determined by in silico deconvolution) (y axis) and the percentage (log expression) of renal fibrosis (x axis) is shown. d, RNA-seq data from 432 human kidney tubule samples. Correlation between the percentage of renal fibrosis (y axis) and normalized IL6 levels (x axis). e, Correlation between the percentage of renal fibrosis (y axis) and normalized expression levels of CXCL1, IL18, IL33 and IL17d (x axis) in human kidney samples. The r represents Pearson’s correlation coefficient values (c–e).
Finally, we looked into transcriptomics data obtained by RNA-seq of 432 microdissected human kidney samples (Supplementary Table 7). The analysis showed a positive correlation between IL6 expression levels and the severity of fibrosis and a negative correlation between IL6 expression levels and kidney function (estimated glomerular filtration rate; eGFR) (Fig. 7d and Extended Data Fig. 8a). In addition, CXCL1, IL18, IL33 and IL17d transcript levels positively correlated with the severity of fibrosis and IL6 levels, whereas they negatively correlated with eGFR (Fig. 7e and Extended Data Fig. 8a,b). In summary, human kidney analysis highlighted consistent correlations between renal fibrosis and basophil numbers. Furthermore, renal IL6, IL18 and IL33 expression correlated with CKD severity.
Discussion
While fibrosis is often viewed as unresolved inflammation32–34, systematic characterization of immune cells in renal fibrosis has not been performed. Here, our single-cell studies identified increased diversity of immune cells and an unappreciated role of basophils in renal fibrosis (Fig. 8). Growing evidence points to the contribution of proximal tubule cells in kidney disease and fibrosis development35. Genetic studies indicated enrichment of genes causing kidney dysfunction in PT cells36. Single-cell sequencing highlighted the plasticity of PT cells in kidney fibrosis. The overlap of the DEGs between the profibrotic PT cells observed in UUO kidneys and ischemic reperfusion injury and previous publications indicated a common mechanism of kidney injury22,37. ‘Profibrotic PT’ cells, interacted with resident fibroblasts via IHH and PDGFB and myeloid cells via IL-34 and lymphoid cells via CXCL16. The critical role of IL-34 and CXCL16 in renal fibrosis was established by previous studies27,38. Here we showed that profibrotic PT cells expressing CXCL1 were likely responsible for basophil recruitment although the roles of other pathways remain to be defined. A previous paper indicated the role of CXCL1 in recruiting granulocytes, including basophils39. CXCL1 expression was also enriched in tubule cells weakly expressing proximal tubule marker HNF4A and expressing markers of the descending loop of Henle, indicating the possibility that a similar altered cell population is extending to the bordering segment of PTs.
Fig. 8 |. Graphical abstract.

Injured profibrotic renal tubules release CXCL1, resulting in recruitment of CXCR2-positive basophils to the kidneys. The recruited basophils express IL-18R and IL1RL1 and are activated by their ligands; IL-18 and IL-33. Activated basophils produce IL-6 and promote TH17 cell expansion. IL-17a and transforming growth factor (TGF)-β released from TH17 contribute to the development of renal fibrosis. Antibody-mediated basophil depletion (MAR-1) and IL-6 receptor blockade protect from renal fibrosis.
Our single-cell studies highlighted the increased number of basophils in kidney fibrosis. Basophils show a strong resemblance to mast cells. Here we used a variety of methods to distinguish mast cells from basophils. Our single-cell studies indicated the expression of basophil marker, Mcpt8 and failed to show the mast cell marker, Mcpt4 (ref. 7). We further confirmed the Mcpt8 expression both by in situ hybridization and by genetic linage tagging. We validated our single-cell expression and in situ studies with gold standard flow cytometry using classic basophil markers such as CD49b, CD200R3 and FceR1. Overall, our comprehensive profiling studies indicated that the analyzed cells are basophils and not mast cells.
We used two complementary methods to define the role of basophils in renal fibrosis, first by genetic depletion using the Mcpt8Cre-DTR mice and second by antibody-mediated depletion using the MAR-1 antibody. Mice with genetic deletion or antibody-mediated depletion were protected from renal fibrosis development. We proposed that increased stromal expression of IL-18 and IL-33 likely play role in activating basophils and stimulating IL-6 secretion. Previous studies showed that blocking IL-18 and IL-33 ameliorated renal fibrosis40,41. IL-6 has a pleiotropic effect on inflammation and immune response, it could have context-dependent pro- or anti-inflammatory properties42. In our animal studies, IL-6R antibody-treated mice were partially protected from renal fibrosis. Previous studies also indicated the profibrotic role of IL-6 in cardiac43, lung44 and peritoneal45 fibrosis, indicating that IL-6 might be a common mediator of fibrosis. Previous studies, however, failed to identify the source of IL-6 in fibrosis. Here we clarified that basophils were a major source of IL-6 in renal fibrosis. This was consistent with a recent paper showing that basophils as the main source of IL-6 in lung development7.
Basophils have been shown to interact with TH17 cells and macrophages7,46. We found that TH17 cell number and IL17a expression were increased in UUO but they were lower in UUO kidneys of mice with basophil depletion. We confirmed the change in TH17 cells by FACS and by cell type-specific gene expression profiling. It is noteworthy that our single-cell analysis independently showed a shift toward TH17 cells in fibrosis. We failed to observe a quantitative change in macrophages; however, we cannot exclude functional differences. TH17 cells responding to IL-6 are likely to be the downstream mediator of basophils in kidney fibrosis. Our group previously illustrated the contribution of TH17 cells to renal fibrosis47 and their role in lung fibrosis has also been established. TH17 cells can interact with fibroblasts to orchestrate fibro-inflammation48,49.
Finally, we validated our observations in human kidney samples from patients with fibrosis. We were able to identify a basophil/mast cell cluster in human kidney single-cell sequencing data and we used KIT and CD63 to distinguish basophils and mast cells50. We performed immunostaining and in silico deconvolution studies to confirm the increase in basophil number in fibrotic kidneys. Finally, we also showed the increase in expression of CXCL1, a chemokine, in patients with kidney fibrosis. The severity of kidney fibrosis correlated with the expression levels of IL6, IL18 and IL33, indicating consistent changes between mouse models and patient samples.
Our results have several potential therapeutic implications. First, blocking the IL-6 pathway in renal fibrosis could be utilized. Tocilizumab, a monoclonal antibody to the IL-6 receptor, is approved to use for autoimmune diseases such as rheumatoid arthritis and is currently studied in systemic sclerosis and COVID19-related lung disease51,52. Second, antibody or cellular therapy-based depletion of basophils could also be considered.
In conclusion, here we demonstrated that the unique differentiation of proximal tubule cells (profibrotic PT) in kidney fibrosis and their interplay with basophils mediated by CXCL1, the chemokine likely responsible for basophil recruitment. Basophils secreted a large amount of IL-6 in response to IL-18 and IL-33 and interacted with TH17 cells, orchestrating kidney fibrosis development. Human kidney single-cell and bulk expression studies validated findings of mouse experimental studies. The unexpected and important contribution of basophils to renal fibrosis opens new potential therapeutic avenues for the management of CKD.
online content
Any methods, additional references, Nature Research reporting summaries, source data, extended data, supplementary information, acknowledgements, peer review information; details of author contributions and competing interests; and statements of data and code availability are available at https://doi.org/10.1038/s41590-022-01200-7.
Methods
Mice.
Animal studies were approved by the Institutional Animal Care and Use Committee of the University of Pennsylvania. Mcpt8Cre mice were provided by A. M. Piliponsky (Seattle Children’s Research Institute). DTR mice were purchased from the Jackson laboratory (009669). Mcpt8Cre-DTR mice were injected with DT every 4 d at 240 ng per 20 g body weight intraperitoneally. The left ureter was ligated with 4–0 silk to induce UUO injury. UUO was performed 3 d after the first DT injection. For antibody-mediated depletion of basophils, WT mice were injected intraperitoneally twice daily with 5 μg of Armenian anti-mouse FcεRIα antibody (16–5898-85, clone; MAR-1, eBioscience) for 3 d or isotype control IgG antibody (16–4888-85, Armenian hamster IgG, eBioscience). UUO was performed 1 d after last the MAR-1 antibody injection. For IL-6 receptor blockade, 400 μg anti-IL-6R (BE0047, clone 15A7; BioXCell) or isotype control IgG (BE0090, BioXCell) was injected every 3 d. UUO was performed 1 d after first the anti-IL-6R injection. In all experiments, mice were killed at 7 d after UUO surgery. All mice were C57BL/6 background and male mice were used at age 8–12 weeks in all experiments. Mice were housed under specific-pathogen-free conditions with a 12-h dark/light cycle, at 22–25 °C and 50–60% humidity with water and food provided ad libitum. No statistical methods were used to predetermine sample size, but our sample sizes are similar to those reported in previous publications53. Age-matched mice were randomly assigned to experimental conditions. Our research complies with the ethical regulations stipulated by the University of Pennsylvania.
Preparation of single-cell suspension.
Mice were perfused with chilled 1× PBS via the left heart. Samples were minced into 1-mm3 cubes and digested using the Multi Tissue dissociation kit (Miltenyi, 130–110-201). The tissue was homogenized using 21 G and 26 1/2 G syringes. Up to 0.25 g of the tissue was digested with 50 μl of Enzyme D, 25 μl of Enzyme R and 6.75 μl of Enzyme A in 1 ml of RPMI and incubated for 30 min at 37 °C. The reaction was deactivated by 10% fetal bovine serum (FBS). The solution was then passed through a 40-μm cell strainer. After centrifugation at 800g for 5 min, the cell pellet was incubated with 1 ml of RBC lysis buffer on ice for 3 min. Cell number and viability were analyzed using Countess AutoCounter (Invitrogen, C10227). This method generated single-cell suspension with greater than 80% viability.
Two fresh human samples were collected from the patients who were under nephrectomy. The tissues were checked by the pathologist to be free of tumor. The procedure was approved by the Institutional Review Board of the University of Pennsylvania. Nephrectomies were de-identified and as the corresponding clinical information was collected by an honest broker; the subjects were exempted from the consent. The single-cell suspension protocol was similar to mouse single-cell suspension preparation except for the longer incubation time (35 min). Briefly, the single-cell suspension was loaded onto a well on a 10X Chromium Single-Cell instrument (v.5.00, b01) (10X Genomics). The cDNA libraries were constructed using the 10X Chromium Single cell 3ʹ Library kit (CG000183) according to the manufacturer’s protocol. Libraries were sequenced on an Illumina HiSeq 2000 or NextSeq 550 2 × 150 paired-end kits.
Alignment and generation of data matrix.
The mouse and human kidney single cell data were aligned using CellRanger v.6.0.1 (10X Genomics) using mouse (GRCm38) and human genome reference Ensembl 93 (GRCh38). The filtered matrix output of CellRanger was used to make Seurat object for each sample with genes expressed in more than three cells and cells with at least 300 genes by using Seurat (v.4.0.3)54. The Seurat objects were merged and used for downstream analysis.
Quality control and unbiased clustering of single-cell RNA-seq.
The low-quality cells were filtered: such as cells with mitochondrial counts >50 % and n_Feature_RNA < 200 or n_Feature_RNA > 3,000 t. The top variable genes were identified using the ‘vst’ method. Next, the data was normalized and scaled in terms of n_Count_RNA and mitochondrial percentage genes. The scaled data were used for principal component analysis using 30 principal components. To remove batch effect, Harmony (v.1.0)55 was used. To cluster cells, the results of harmony were projected to UMAP, then a shared nearest-neighbor network was created based on Euclidian distances between cells in 30 principal component spaces. To identify DEGs in each cell types, the ‘FindAllMarkers’ function of the Seurat with the following parameters was used: logfc.threshold, 0.25 and adjusted P value <0.05. The ‘MAST’ test was used for DEG analysis.
Removal of doublet-like cells.
Doublet-like cells were identified using DoubletFinder (v.2.0.3)56 which is a computational doublet detection tool. The number of expected doublets was calculated for each sample based on the expected rates of doublets which are provided by 10X Genomics.
Integration of present dataset with publicly available data.
To understand similarities and differences with the publicly available UUO dataset (GSE140023), we performed an integrated analysis. Both datasets (present and published) were realigned using CellRanger 6.0.1 and then, the filtered matrix output was used to make Seurat object for each sample with genes expressed in more than three cells and cells with at least 300 genes by using Seurat (v.4.0.3) were created and then merged. Filtering, data normalization and unbiased clustering were performed on the merged dataset as described above. Harmony was used for batch correction and integration.
Cell trajectory analysis and RNA velocity.
To construct single-cell pseudotime trajectory and to identify genes that change as the cells undergo transition, the Monocle2 (v.2.4.0) algorithm was applied to proximal tubule and immune cells57. First, equal number of cells per cluster were randomly selected from each cell clusters. Genes were selected if they were expressed in ≥10 cells, their mean expression value was ≥0.1 and the dispersion empirical value was ≥2. Highly variable genes along the pseudotime were identified using differentialGeneTest function of Monocle2 with q value <0.01. Genes varying across branch points were analyzed using the BEAM function. To calculate RNA velocity of single cells, we used CellRanger 6-derived BAM files together with velocyto to generate a loom file containing the quantification of spliced and unspliced RNA. We then subsetted the matrix to randomly subsampled cells of interest using scanpy (v.1.8)58 and calculated RNA velocity using packages velocyto (v.0.6)59 and scvelo (v.0.2.4)60, respectively. For velocyto, we used function RunVelocity with parameters kCells, 25 and fit.quantile, 0.02 to compute velocity. For scvelo, we used stochastic modeling of RNA velocity in function scv.tl.velocity. Results were projected onto diffusion map reduction space produced with package destiny61.
Identification of cell–cell interaction changes.
Mouse orthologs of human ligand–receptor pairs were obtained from Ensembl BioMart (http://www.ensembl.org/biomart/martview). A ligand or receptor was defined as ‘expressed’ in a particular cell cluster if more than 20% of the cells in the cell cluster have non-zero unique molecular identifier counts for the gene encoding the ligand or receptor.
Gene regulatory network inference.
To identify transcription factors (TFs) and characterize cell states, we employed cis-regulatory analysis using the R package SCENIC (v.1.2.4)62, which infers the gene regulatory network based on coexpression and DNA motif analysis. The network activity is then analyzed in each cell to identify recurrent cellular states. In short, TFs were identified using GENIE3 (v.1.12.0) and compiled into modules (regulons), which were subsequently subjected to cis-regulatory motif analysis using RcisTarget with two gene-motif rankings: 10 kb around the transcription start site and 500 bp upstream. Regulon activity in every cell was then scored using AUCell. Finally, binarized regulon activity was projected onto UMAP space.
Mouse bulk RNA-seq analysis.
Total RNA were isolated using the RNeasy mini kit (QIAGEN). Sequencing libraries were constructed using the Illumina TruSeq RNA Preparation kit. High-throughput sequencing was performed using Illumina HiSeq4000 with 100-bp single-end according to the manufacturer’s instruction. Adaptor and low-quality reads were trimmed using Trim-galore. Reads were aligned to the Gencode mouse genome (GRCm38) using STAR (v.2.4.1d). The aligned reads were mapped to the genes (GRCm38, v.7 Ensembl 82) using HTSeq-0.6.1. DEGs between sham and UUO groups were identified using DESeq2 v.1.10.1.
Human bulk gene profiling data analysis.
The human study was deemed exempt by the Institutional Review Board of the University of Pennsylvanian as no personal identifiers were collected. Kidney tissues from 95 human patients (microarray) and 432 human patients (RNA-seq) were collected from the unaffected portion of surgical nephrectomies. The collected kidney was immersed into RNAlater and stored at −80 °C. Tubule compartments were manually microdissected from the tissue and subjected to RNA isolation. The rest of tissue was used for histopathological analysis. Gene expression analysis in microarray was performed using Affymetric U133A arrays (E-MTAB-2502). Raw expression levels of microarray datasets were normalized using the RMA algorithm and log transformed. Correlation analysis in RNA-seq for gene expression, fibrosis and eGFR were performed using Spearman’s correlation.
Estimation of cell proportions.
CIBERSORTx (https://cibersortx.stanford.edu/)63 was used to deconvolute (determine the percent of each cell type) the bulk RNA-seq data of mouse and human kidney samples.
Histology.
Kidney tissue was fixed in 10% formalin. Paraffin-embedded sections at 5-μm thick were used. H&E staining and Sirius red staining (24901, Polysciences) were performed according to manufacturer’s protocol. The degree of tubulointerstitial damage was scored semi-quantitatively on a 0 to 5+ scale, according to the percentage of the area affected by hyaline casts, tubular atrophy, tubular lumen dilation and interstitial immune cells infiltration (0, normal; 1, <10%; 2, 10–25%; 3, 26–50%; 4, 51–75%; and 5, >75%). The percentage of Sirius red-positive area was quantified using ImageJ (National Institutes of Health)64. A total of 5–8 independent fields in kidneys from each mouse were analyzed and the mean value was plotted.
For immunofluorescence staining, sections were deparaffinized using xylene, 100% alcohol, 95 alcohol, 70% alcohol and distilled water. Epitope retrieval was performed using Tris-EDTA buffer (10 mM Tris, 1 mM EDTA solution and 0.05% Tween 20, pH 9.0) at 95 °C for 10 min. Sections were immersed in 3% H2O2 for blocking endogenous peroxidase for 10 min. After blocking with 10% FBS, the sections were incubated with anti-basophil (2D7) (Abcam ab155577, 1:100 dilution) at 4 °C overnight. The next day, sections were incubated with donkey anti-rabbit Alexa Fluor 555 (A-31572, Thermo Fisher, 1:500 dilution). Sections then were mounted using ProLong Gold Antifade Mounting with 4,6-diamidino-2-phenylindole (P36935, Life Sciences). Basophils were counted on 5–8 independent fields under ×200 magnification.
In situ hybridization.
In situ hybridization was performed using formalin-fixed paraffin-embedded tissue samples and RNAscope 2.5 HD Duplex Detection kit (Bio-Techne, 322436). We followed the manufacturer’s original protocol. The following probes were used for the RNAscope assay: Mm-Hnf4a-C2 497651, Mm-Cxcl1 407721, Mm-Tnfrsf12a 429311, Mm-Bcl3 528431, Mm-Cd74 37501, Mm-Cxcl10 408921, Mm-Pdgfb 424651, Mm-Ihh 413091 Mm-Il18 416731, Mm-Il33 400591, Mm-Mcpt8 583151, Mm-Cxcr2-CDS-C2 487671 and Mm-Il6-C2 315891. For quantification of the target signal in proximal renal tubules, we used a semi-quantitative histological scoring methodology based on modified ACD scoring criteria (0, no dots per cell; 1, 1–2 dots per cell; 2, 3–5 dots per cell; 3, 6–10 dots per cell; 4, >10 dots per cell and/or >20% dots per cell). We counted the dots in 20–30 renal proximal tubule cells under high power field and plotted average scores per sample.
Flow cytometry.
Splenocytes were obtained by grinding spleens through a 70-μm filter and washing with RPMI supplemented with 5% FBS. Red blood cells were then lysed by incubating samples with ACK lysis buffer (Thermo Fisher Scientific) for 5 min before washing again with RPMI + 5% FBS. Cells were then washed with FACS Buffer (1× PBS, 0.2% bovine serum antigen and 1 mM EDTA) before incubating with Fc block (99.5 % FACS Buffer, 0.5% normal rat serum and 1 μg ml−1 2.4G2 IgG antibody) before staining. Cells were stained with the viability dye Ghost Dye Violet 510 (Tonbo Biosciences, 12–0870) and the following antibodies were used for subsequent staining (1:200 dilution for all antibodies): B220 FITC (RA3–6B2; BioLegend), CD3e PerCP-Cy5.5 (145–2C11; Invitrogen) BV785 (17A2; BioLegend), CD4 BV650 (RM4–5; BioLegend), CD8 PE-cf594 (53–6.7; BD Biosciences), CD19 PerCP-Cy5.5 (1D3/CD19; BioLegend), CD45 AF700 and APC-e780 (30-F11; BioLegend, Invitrogen), CD49b FITC and PerCP-ef710 (DX5; BD Biosciences, eBioscience), CD117/cKit APC-e780 (ACK2; Invitrogen), CD150/SLAM BV711 (TC15–12F12.2; BioLegend), CD200R3 PE (BA13; BioLegend), CXCR5 PE-Cy7 (SPRCL5; Invitrogen), FcEr APC (MAR-1; Invitrogen), Foxp3 ef450 (FJK-16s; Invitrogen), GR1 FITC (RB6–8C5; eBioscience), Ly6G Pacific Blue (1A8; BioLegend), NK1.1 FITC and PerCP-Cy5.5 (PK136; eBioscience, BioLegend), RORγT PE (B2D; eBioscience) and Tbet BV605 (4B10; BioLegend). Intracellular staining was performed using the Foxp3/Transcription Factor Staining Buffer Set (eBioscience) according to the manufacturer’s instructions. Samples were run on either a FACSCanto or LSR Fortessa (BD Biosciences) and analyzed using FlowJo (TreeStar).
In vitro basophil recruitment and activation.
WT mice were injected intravenously (i.v.) with a combination of 1 μg mouse recombinant IL-3 (R&D systems) and 0.5 μg of anti-IL-3 (BioLegend, clone MP2–8F8) in 200 μl of PBS 3 d before being killed. Single-cell suspensions from spleens were prepared and basophils were sort-purified as CD45+, CD3−, CD19−, NK1.1−, Ly6G−, Siglec-F−, cKit−, CD49b+ and CD200R+ cells using a FACSAriaII (BD Bioscience). Siglec-F was used to exclude eosinophils. Purity for all cell populations were determined to be 98% or greater. The gating strategy and cytology is shown in Supplementary Fig. 7a,b. For the chemotaxis assay, 30,000 cells were treated with 10 nM CXCL1 for 2 h. The recruited basophils were assessed according to manufacturer’s protocol (Cell Biolabs, CBA-105). For basophil activation, basophils were resuspended in 200 μl of culture medium and stimulated with 10 ng ml−1 rIL-18 or rIL-33 (R&D Systems) in the absence of IL-3 overnight and cell-free supernatant were evaluated for IL-6 by standard ELISA. Cells were stained with monoclonal anti-mouse fluorescently conjugated antibodies: CD45 (30-F11), CD3 (145–2C11), CD19 (1D3), NK1.1 (PK136), Ly6G (1A8), Siglec-F (E50–2440), cKit (2b8), CD200R1 (OX110), CD200R3 (Ba13) and CD49b (DX5) from eBioscience or BD Biosciences.
IL-6 quantification in kidney tissue.
Kidney tissue was homogenized in RIPA buffer containing proteinase inhibitor. After 10 min centrifugation at 4 °C, tissue lysates were used for IL-6 measurement according to manufacturer’s protocol (M6000B, R and D Mouse IL-6 Immunoassay). The IL-6 data were corrected for total protein levels measured by Pierce BCA Protein Assay kit (23225, Thermo Fisher).
Real-time quantitative PCR.
Sham and UUO kidneys were homogenized and total RNA were extracted using Trizol, according to manufacturer’s protocol (Thermo Fisher). Quality and concentration of extracted RNA were examined using nanodrop. Complementary DNA was generated using Reverse Transcription kit (Applied Biosystems) according to the manufacturer’s protocol. Real-time quantitative PCR were performed using Cyber green Master Mix Reagents (Thermo Fisher) with ViiA 7 System (Life Technologies) instrument. Primer sequences are listed in Supplementary Table 8.
Data statistics and analysis.
The data were expressed as mean ± s.e.m. Statistical significance was assessed by a two-tailed Student’s t-test for two-group comparisons or a one-way ANOVA for multigroup comparisons followed by Tukey post hoc test for subgroup comparisons. P < 0.05 was considered significant. Data distribution was assumed to be normal but this was not formally tested. Data collection and analysis were not performed blind to the conditions of the experiments. No data exclusion was performed. The clipart in the figure was created using images from Smart Servier Medical Art (https://smart.servier.com/).
Extended Data
Extended Data Fig. 1 |. Mcpt8 expression in basophils in kidney fibrosis.

(A) Bubble plots showing the average gene expression and percentage of expressing cells of S100a8, Il5ra, Siglecf, Mcpt8, Fcer1a, Mcpt4 and kit in the basophils. (B) Representative in situ hybridization image of Mcpt8 in kidney fibrosis following UUO or injection of folic acid. Scale bar: 50 μm. Data are representative of two independent experiments.
Extended Data Fig. 2 |. Integration analysis using published dataset.
(a) UMAP dimension reduction showing 26 distinct cell types identified by unsupervised clustering. Sample number, Sham; n = 7, UUO; n = 5. GEC: glomerular endothelial cells, Endo: endothelial, Podo: podocyte, PT: proximal tubule, ALOH: ascending loop of Henle, DCT: distal convoluted tubule, CNT: connecting tubule, CD PC: collecting duct principal cell, A-IC: alpha intercalated cell, B-IC: beta intercalated cell, Trans-IC: transitional intercalated cell, Neutro: Neutrophils, Mono: monocyte, DC: dendritic cell, Macro: macrophage, pDC: plasmacytoid DC, Baso: Basophile B Lymph: B lymphocyte, NK: natural killer cell. (b) The percentage of basophils detected in single-cell RNA-seq in UUO kidneys. n = 3 from the published database (Conway et al), n = 2 from this paper. Data are presented as mean values ± SEM. (c) Bubble plots showing the expression of cell cluster marker genes in the combined dataset.
Extended Data Fig. 3 |. Marker gene expressions of renal tubule cells in uuo kidneys.
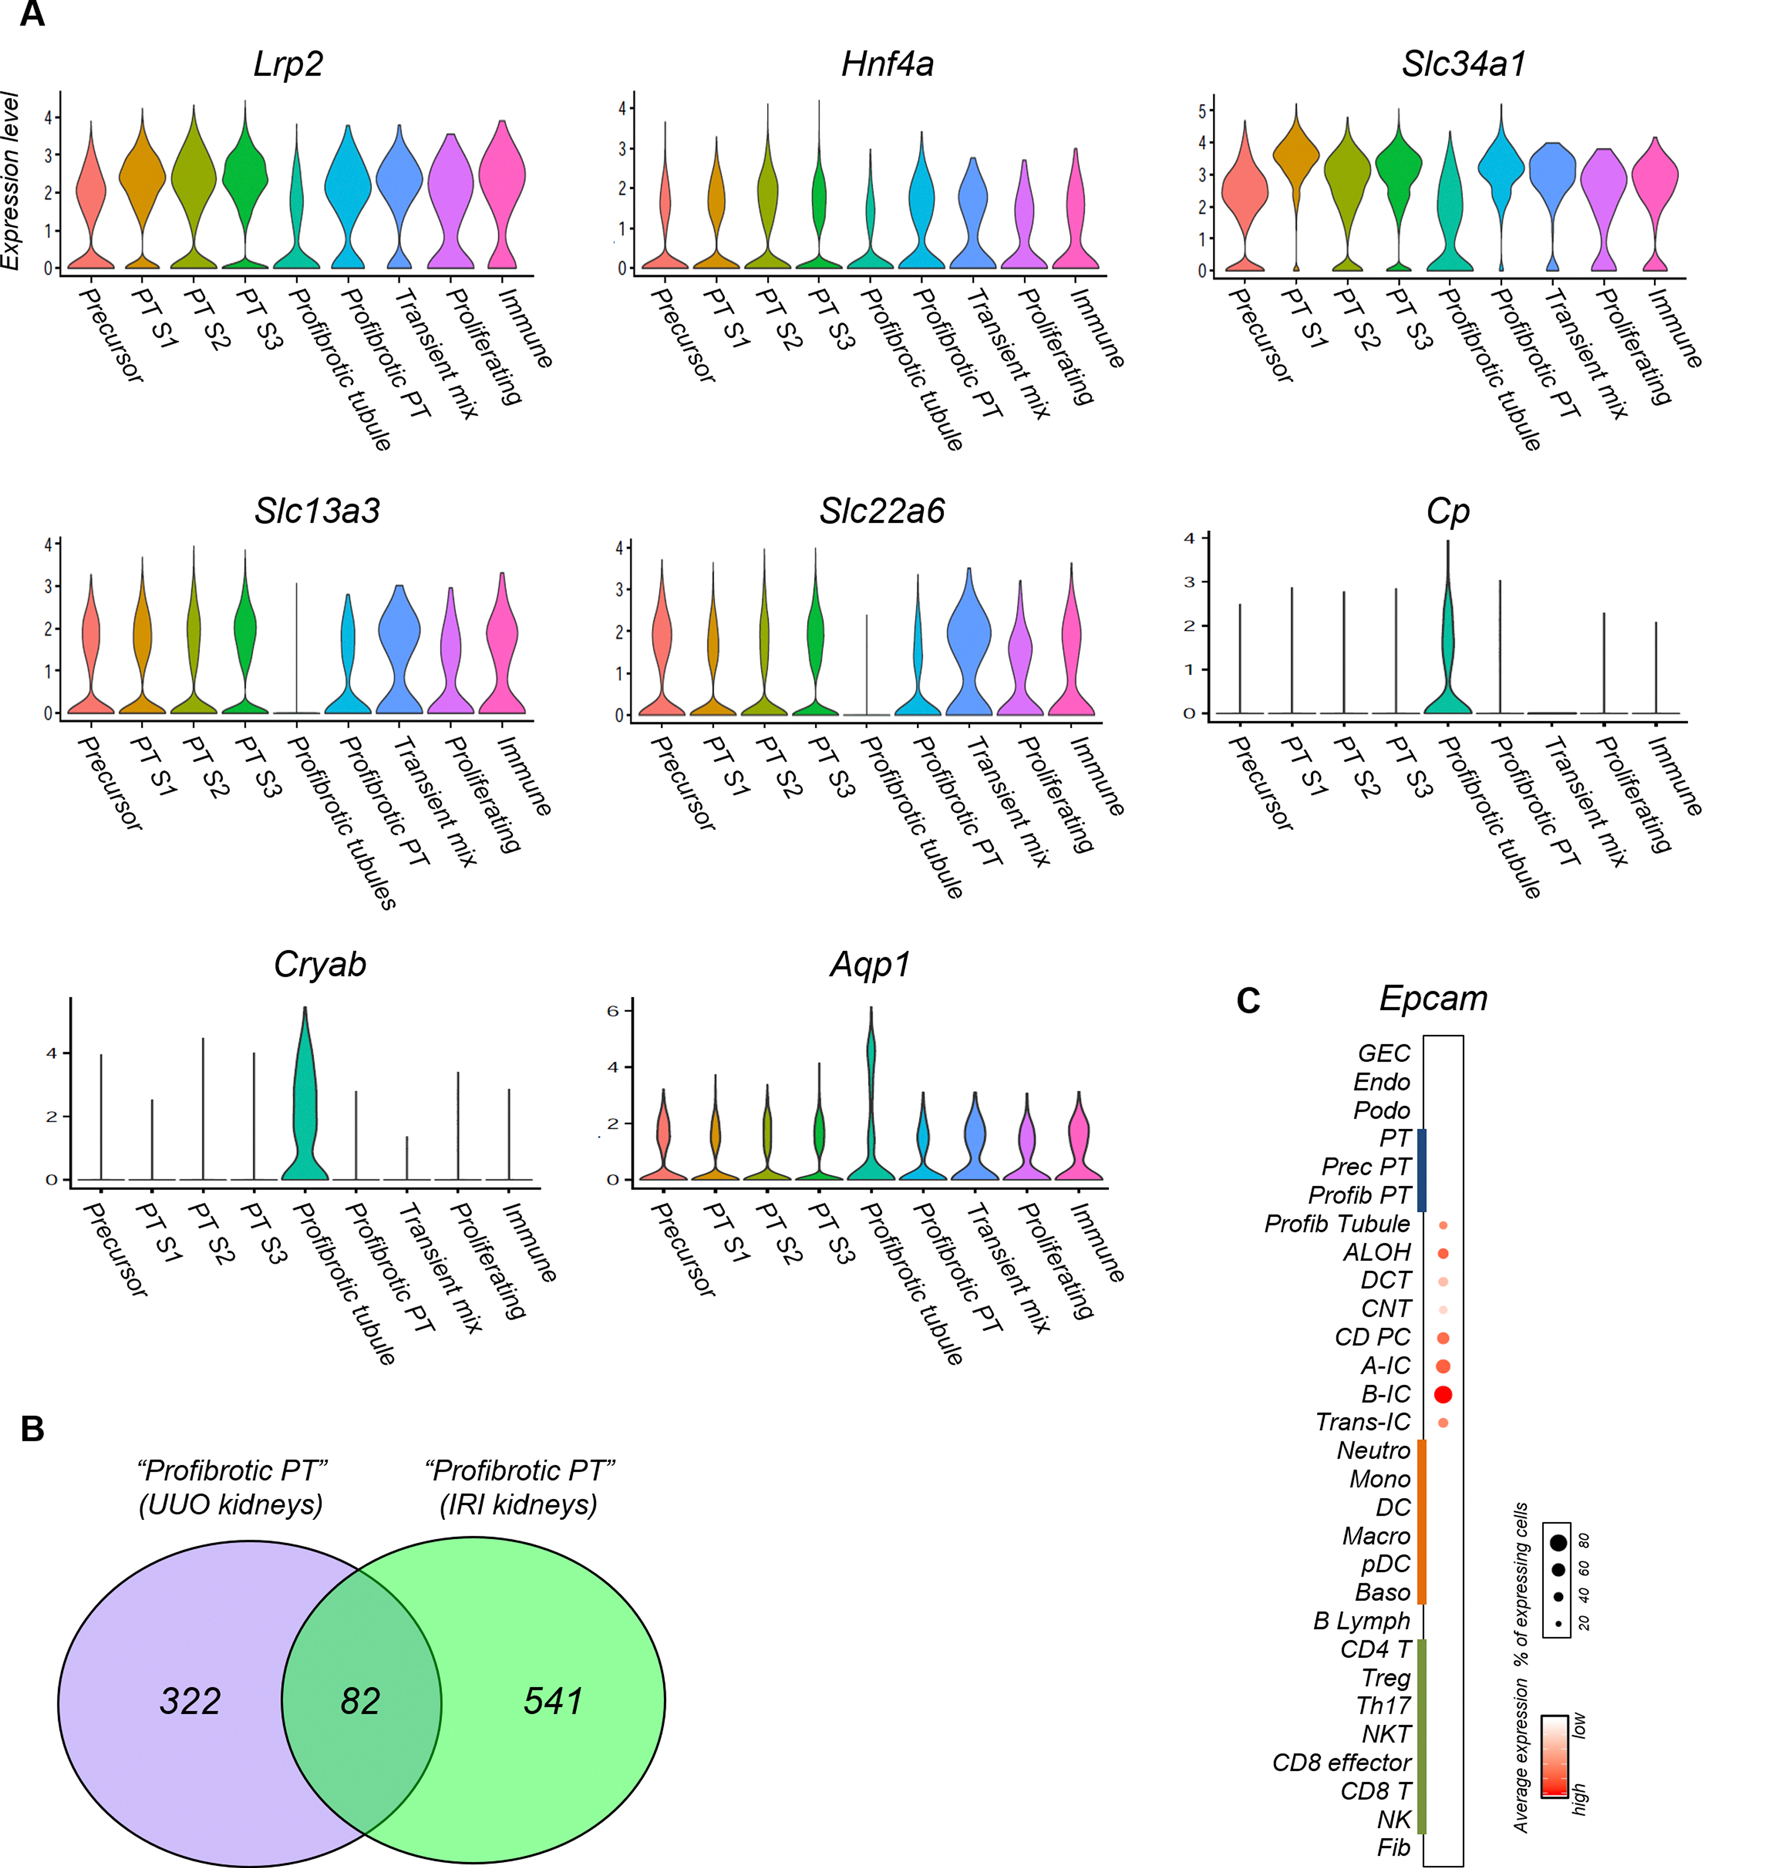
(a) Violin plots showing the average expression and percentage of cells expressing Lrp2, Hnf4a, Slc34a1, Slc13a3, Slc22a6, Cp, Cryab, and Aqp1 in the PT subcluster in UUO kidneys. (b) Venn diagram of differentially expression genes in profibrotic proximal renal tubules in UUO kidneys and ischemia reperfusion injury (IRI) kidneys. (c) Bubble plots showing the average expression and percentage of cells expressing Epcam in UUO kidneys.
Extended Data Fig. 4 |. SCeNIC regulon activity of PT clusters in uuo kidneys.

(Left panel) Heat map of predicted transcription factor activity in PT subclusters (Precursor, S2, S3, Transient mix, Proliferating, Immune, S1, and Profibrotic PT). Red indicates higher regulon activity, blue indicates lower regulon activity. (Right panel) Feature plots of the regulon activity (AUC) for representative transcription factors of Bcl3, Cebpb, Stat3, Klf6, Stat5a, and Ddit3.
Extended Data Fig. 5 |. The expression levels of Il18, Il33 in uuo kidneys.

(a) Whole kidney gene and protein expression levels in sham and UUO kidneys of wild-type (WT) mice (n = 3 respectively). (b) Bubble plots showing the average gene expression and percentage of expressing cells of Il18 and Il33 in sham and UUO kidneys. Gene expression levels are shown as FPKM values (quantified by RNA-seq) and protein levels (quantified by ELISA) are corrected with total protein levels. *p < 0.05, ***p < 0.001. Data are presented as mean values ± SEM. Data were analyzed using DEseq2. (c) The representative image of in situ hybridization of Il18 and Il33 with Hnf4a in sham and UUO kidneys. Scale bar; 20 μm. Data are representative of two independent experiments.
Extended Data Fig. 6 |. Immune cell survey of MCPT8Cre-DTR mice kidneys.

Relative transcript level of immune cell markers Tcf7, Cd8a, Foxp3, Ccr6, Ncr1, Cd79a, Adgre, Cd206, Clec10a, and Siglech in kidneys of experimental groups (n = 6 in each group). Gene expression levels in whole kidney samples were normalized to Gapdh. *p < 0.05. N.S. not significant. Data are presented as mean values ± SEM. All data were analyzed using a one-way ANOVA followed by Tukey post hoc test for multigroup comparison.
Extended Data Fig. 7 |. Changes in immune cell population in kidneys of Mcpt8cre-DTR mice.

(a) The number of Th17 cells in kidneys of experimental groups identified by FACS (n = 3 in WT sham, MCPT8Cre-DTR sham, and WT UUO. n = 4 in MCPT8Cre-DTR UUO). *p < 0.05, **p < 0.01. (b) The number of CD4, CD8, Treg, and mast cells in kidneys of experimental groups identified by flow sorting (n = 3 in WT sham, MCPT8Cre-DTR sham, and WT UUO. n = 4 in MCPT8Cre-DTR UUO). **p < 0.01. N.S. not significant. (a-b) Data are presented as mean values ± SEM. All data were analyzed using a one-way ANOVA followed by Tukey post hoc test for multigroup comparison.
Extended Data Fig. 8 |. Gene expression correlation in microdissected human kidney tubule samples.

(a) Correlation between IL6, CXCL1, IL18, IL33, IL17d normalized expression levels in human kidney samples (x axis) and eGFR (ml/min) (y axis). (b) Correlation between CXCL1, IL18, IL33, IL17d normalized expression levels (x axis) and IL6 normalized expression levels (y axis) in human kidney samples. Pearson’s correlation coefficient values are shown.
Supplementary Material
Acknowledgements
This work has been supported in the Susztak laboratory by the National Institutes of Health R01 DK087635, DK076077 and DK105821 and in the Lefebvre laboratory by the National Institutes of Health NIAMS R01 grant AR068308. M.S.B. is supported by a German Research Foundation (Deutsche Forschungsgemeinschaft) grant (BA 6205/2–1). The authors thank the Molecular Pathology and Imaging Core (P30-DK050306) and Diabetes Research Center (P30-DK19525) at University of Pennsylvania for their services.
Footnotes
Competing interests
The authors declare no competing interests.
Additional information
Extended data is available for this paper at https://doi.org/10.1038/s41590-022-01200-7.
Supplementary information The online version contains supplementary material available at https://doi.org/10.1038/s41590-022-01200-7.
Peer review information Nature Immunology thanks Matthias Mack and the other, anonymous, reviewer(s) for their contribution to the peer review of this work. Primary Handling Editor: Nicholas Bernard, in collaboration with the Nature Immunology team. Peer reviewer reports are available.
Reporting Summary.
Further information on research design is available in the Nature Research Reporting Summary linked to this article.
Code availability
The code is available at GitHub (https://github.com/ms-balzer/kidney_basophils).
Data availability
The mouse UUO single-cell data presented in this paper are newly deposited to GSE182256. The publicly available mouse UUO single-cell data were obtained from GSE140023. The human kidney gene expression data can be downloaded from GSE173343, GSE115098. GRCm38 and GRCh38 were used for mice and human reference genome assembly, respectively.
References
- 1.Wynn TA Cellular and molecular mechanisms of fibrosis. J. Pathol. 214, 199–210 (2008). [DOI] [PMC free article] [PubMed] [Google Scholar]
- 2.Jager KJ et al. A single number for advocacy and communication-worldwide more than 850 million individuals have kidney diseases. Nephrol. Dialysis Transplant. 34, 1803–1805 (2019). [DOI] [PubMed] [Google Scholar]
- 3.Dhillon P et al. The nuclear receptor ESRRA protects from kidney disease by coupling metabolism and differentiation. Cell Metab. 33, 379–394 (2021). [DOI] [PMC free article] [PubMed] [Google Scholar]
- 4.Galli SJ, Tsai M & Piliponsky AM The development of allergic inflammation. Nature 454, 445–454 (2008). [DOI] [PMC free article] [PubMed] [Google Scholar]
- 5.Voehringer D Protective and pathological roles of mast cells and basophils. Nat. Rev. Immunol. 13, 362–375 (2013). [DOI] [PubMed] [Google Scholar]
- 6.Inclan-Rico JM et al. Basophils prime group 2 innate lymphoid cells for neuropeptide-mediated inhibition. Nat. Immunol. 21, 1181–1193 (2020). [DOI] [PMC free article] [PubMed] [Google Scholar]
- 7.Cohen M et al. Lung single-cell signaling interaction map reveals basophil role in macrophage imprinting. Cell 175, 1031–1044 (2018). [DOI] [PubMed] [Google Scholar]
- 8.Bosch X, Lozano F, Cervera R, Ramos-Casals M & Min B Basophils, IgE, and autoantibody-mediated kidney disease. J. Immunol. 186, 6083–6090 (2011). [DOI] [PMC free article] [PubMed] [Google Scholar]
- 9.Schiechl G et al. Basophils trigger fibroblast activation in cardiac allograft fibrosis development. Am. J. Transplant. 16, 2574–2588 (2016). [DOI] [PubMed] [Google Scholar]
- 10.Sicklinger F et al. Basophils balance healing after myocardial infarction via IL-4/IL-13. J. Clin. Invest. 10.1172/JCI136778 (2021). [DOI] [PMC free article] [PubMed] [Google Scholar]
- 11.Franco CB, Chen CC, Drukker M, Weissman IL & Galli SJ Distinguishing mast cell and granulocyte differentiation at the single-cell level. Cell Stem Cell 6, 361–368 (2010). [DOI] [PMC free article] [PubMed] [Google Scholar]
- 12.Madjene LC et al. Mast cells in renal inflammation and fibrosis: lessons learnt from animal studies. Mol. Immunol. 63, 86–93 (2015). [DOI] [PubMed] [Google Scholar]
- 13.Higashi AY, Aronow BJ & Dressler GR Expression Profiling of fibroblasts in chronic and acute disease models reveals novel pathways in kidney fibrosis. J. Am. Soc. Nephrol. 30, 80–94 (2019). [DOI] [PMC free article] [PubMed] [Google Scholar]
- 14.Hewitt KJ et al. PDGFRβ expression and function in fibroblasts derived from pluripotent cells is linked to DNA demethylation. J. Cell Sci. 125, 2276–2287 (2012). [DOI] [PMC free article] [PubMed] [Google Scholar]
- 15.Heng TS & Painter MW The Immunological Genome Project: networks of gene expression in immune cells. Nat. Immunol. 9, 1091–1094 (2008). [DOI] [PubMed] [Google Scholar]
- 16.Park J et al. Single-cell transcriptomics of the mouse kidney reveals potential cellular targets of kidney disease. Science 360, 758–763 (2018). [DOI] [PMC free article] [PubMed] [Google Scholar]
- 17.Conway BR et al. Kidney single-cell atlas reveals myeloid heterogeneity in progression and regression of kidney disease. J. Am. Soc. Nephrol. 31, 2833–2854 (2020). [DOI] [PMC free article] [PubMed] [Google Scholar]
- 18.Klinkhammer BM, Floege J & Boor P PDGF in organ fibrosis. Mol. Asp. Med. 62, 44–62 (2018). [DOI] [PubMed] [Google Scholar]
- 19.Kusaba T, Lalli M, Kramann R, Kobayashi A & Humphreys BD Differentiated kidney epithelial cells repair injured proximal tubule. PNAS 111, 1527–1532 (2014). [DOI] [PMC free article] [PubMed] [Google Scholar]
- 20.Nielsen R, Christensen EI & Birn H Megalin and cubilin in proximal tubule protein reabsorption: from experimental models to human disease. Kidney Int. 89, 58–67 (2016). [DOI] [PubMed] [Google Scholar]
- 21.Chen L, Chou CL & Knepper MA Targeted single-cell RNA-seq identifies minority cell types of kidney distal nephron. J. Am. Soc. Nephrol. 32, 886–896 (2021). [DOI] [PMC free article] [PubMed] [Google Scholar]
- 22.Gerhardt LMS, Liu J, Koppitch K, Cippà PE & McMahon AP Single-nuclear transcriptomics reveals diversity of proximal tubule cell states in a dynamic response to acute kidney injury. PNAS 10.1073/pnas.2026684118 (2021). [DOI] [PMC free article] [PubMed] [Google Scholar]
- 23.Muto Y et al. Single cell transcriptional and chromatin accessibility profiling redefine cellular heterogeneity in the adult human kidney. Nat. Commun. 12, 2190 (2021). [DOI] [PMC free article] [PubMed] [Google Scholar]
- 24.Liu SS et al. Targeting degradation of the transcription factor C/EBPβ reduces lung fibrosis by restoring activity of the ubiquitin-editing enzyme A20 in macrophages. Immunity 51, 522–534 (2019). [DOI] [PubMed] [Google Scholar]
- 25.Petrovic-Djergovic D et al. CXCL10 induces the recruitment of monocyte-derived macrophages into kidney, which aggravate puromycin aminonucleoside nephrosis. Clin. Exp. Immunol. 180, 305–315 (2015). [DOI] [PMC free article] [PubMed] [Google Scholar]
- 26.Ruth JH et al. CXCL16-mediated cell recruitment to rheumatoid arthritis synovial tissue and murine lymph nodes is dependent upon the MAPK pathway. Arthritis Rheum. 54, 765–778 (2006). [DOI] [PMC free article] [PubMed] [Google Scholar]
- 27.Baek JH et al. IL-34 mediates acute kidney injury and worsens subsequent chronic kidney disease. J. Clin. Invest. 125, 3198–3214 (2015). [DOI] [PMC free article] [PubMed] [Google Scholar]
- 28.Sullivan BM et al. Genetic analysis of basophil function in vivo. Nat. Immunol. 12, 527–535 (2011). [DOI] [PMC free article] [PubMed] [Google Scholar]
- 29.El Hachem C et al. Treatment of MCPT8(DTR) mice with high- or low-dose diphtheria toxin leads to differential depletion of basophils and granulocyte-macrophage progenitors. Eur. J. Immunol. 48, 861–873 (2018). [DOI] [PubMed] [Google Scholar]
- 30.Denzel A et al. Basophils enhance immunological memory responses. Nat. Immunol. 9, 733–742 (2008). [DOI] [PubMed] [Google Scholar]
- 31.Yuk CM et al. Basophil-derived IL-6 regulates T(H)17 cell differentiation and CD4 T cell immunity. Sci. Rep. 7, 41744 (2017). [DOI] [PMC free article] [PubMed] [Google Scholar]
- 32.Tang PM, Nikolic-Paterson DJ & Lan HY Macrophages: versatile players in renal inflammation and fibrosis. Nat. Rev. Nephrol. 15, 144–158 (2019). [DOI] [PubMed] [Google Scholar]
- 33.Turner JE, Becker M, Mittrücker HW & Panzer U Tissue-resident lymphocytes in the kidney. J. Am. Soc. Nephrol. 29, 389–399 (2018). [DOI] [PMC free article] [PubMed] [Google Scholar]
- 34.Kurts C, Ginhoux F & Panzer U Kidney dendritic cells: fundamental biology and functional roles in health and disease. Nat. Rev. Nephrol. 16, 391–407 (2020). [DOI] [PubMed] [Google Scholar]
- 35.Gewin LS Renal fibrosis: primacy of the proximal tubule. Matrix Biol. 68–69, 248–262 (2018). [DOI] [PMC free article] [PubMed] [Google Scholar]
- 36.Qiu C et al. Renal compartment-specific genetic variation analyses identify new pathways in chronic kidney disease. Nat. Med. 24, 1721–1731 (2018). [DOI] [PMC free article] [PubMed] [Google Scholar]
- 37.Kirita Y, Wu H, Uchimura K, Wilson PC & Humphreys BD Cell profiling of mouse acute kidney injury reveals conserved cellular responses to injury. PNAS 117, 15874–15883 (2020). [DOI] [PMC free article] [PubMed] [Google Scholar]
- 38.Liang H et al. CXCL16 deficiency attenuates renal injury and fibrosis in salt-sensitive hypertension. Sci. Rep. 6, 28715 (2016). [DOI] [PMC free article] [PubMed] [Google Scholar]
- 39.Geiser T, Dewald B, Ehrengruber MU, Clark-Lewis I & Baggiolini M The interleukin-8-related chemotactic cytokines GRO α, GRO β, and GRO γ activate human neutrophil and basophil leukocytes. J. Biol. Chem. 268, 15419–15424 (1993). [PubMed] [Google Scholar]
- 40.Bani-Hani AH et al. IL-18 neutralization ameliorates obstruction-induced epithelial-mesenchymal transition and renal fibrosis. Kidney Int. 76, 500–511 (2009). [DOI] [PubMed] [Google Scholar]
- 41.Liang H et al. Interleukin-33 signaling contributes to renal fibrosis following ischemia reperfusion. Eur. J. Pharmacol. 812, 18–27 (2017). [DOI] [PubMed] [Google Scholar]
- 42.Hunter CA & Jones SA IL-6 as a keystone cytokine in health and disease. Nat. Immunol. 16, 448–457 (2015). [DOI] [PubMed] [Google Scholar]
- 43.González GE et al. Deletion of interleukin-6 prevents cardiac inflammation, fibrosis and dysfunction without affecting blood pressure in angiotensin II-high salt-induced hypertension. J. Hypertens. 33, 144–152 (2015). [DOI] [PMC free article] [PubMed] [Google Scholar]
- 44.Le TT et al. Blockade of IL-6 trans signaling attenuates pulmonary fibrosis. J. Immunol. 193, 3755–3768 (2014). [DOI] [PMC free article] [PubMed] [Google Scholar]
- 45.Fielding CA et al. Interleukin-6 signaling drives fibrosis in unresolved inflammation. Immunity 40, 40–50 (2014). [DOI] [PMC free article] [PubMed] [Google Scholar]
- 46.Wakahara K et al. Human basophils interact with memory T cells to augment Th17 responses. Blood 120, 4761–4771 (2012). [DOI] [PubMed] [Google Scholar]
- 47.Coppock GM et al. Loss of IL-27Rα results in enhanced tubulointerstitial fibrosis associated with elevated Th17 responses. J. Immunol. 205, 377–386 (2020). [DOI] [PMC free article] [PubMed] [Google Scholar]
- 48.Wilson MS et al. Bleomycin and IL-1β-mediated pulmonary fibrosis is IL-17A dependent. J. Exp. Med. 207, 535–552 (2010). [DOI] [PMC free article] [PubMed] [Google Scholar]
- 49.Cipolla E et al. IL-17A deficiency mitigates bleomycin-induced complement activation during lung fibrosis. FASEB J. 31, 5543–5556 (2017). [DOI] [PMC free article] [PubMed] [Google Scholar]
- 50.Mitsui H et al. Development of human mast cells from umbilical cord blood cells by recombinant human and murine c-kit ligand. PNAS 90, 735–739 (1993). [DOI] [PMC free article] [PubMed] [Google Scholar]
- 51.Khanna D et al. Tocilizumab in systemic sclerosis: a randomised, double-blind, placebo-controlled, phase 3 trial. Lancet Resp. Med. 8, 963–974 (2020). [DOI] [PubMed] [Google Scholar]
- 52.Guaraldi G et al. Tocilizumab in patients with severe COVID-19: a retrospective cohort study. Lancet Rheumatol. 2, e474–e484 (2020). [DOI] [PMC free article] [PubMed] [Google Scholar]
- 53.Doke T et al. Transcriptome-wide association analysis identifies DACH1 as a kidney disease risk gene that contributes to fibrosis. J. Clin. Invest. 10.1172/JCI141801 (2021). [DOI] [PMC free article] [PubMed] [Google Scholar]
- 54.Hao Y et al. Integrated analysis of multimodal single-cell data. Cell 184, 3573–3587 (2021). [DOI] [PMC free article] [PubMed] [Google Scholar]
- 55.Korsunsky I et al. Fast, sensitive and accurate integration of single-cell data with Harmony. Nat. Methods 16, 1289–1296 (2019). [DOI] [PMC free article] [PubMed] [Google Scholar]
- 56.McGinnis CS, Murrow LM & Gartner ZJ DoubletFinder: doublet detection in single-cell RNA sequencing data using artificial nearest neighbors. Cell Syst. 8, 329–337 (2019). [DOI] [PMC free article] [PubMed] [Google Scholar]
- 57.Qiu X et al. Reversed graph embedding resolves complex single-cell trajectories. Nat. Methods 14, 979–982 (2017). [DOI] [PMC free article] [PubMed] [Google Scholar]
- 58.Wolf FA, Angerer P & Theis FJ SCANPY: large-scale single-cell gene expression data analysis. Genome Biol. 19, 15 (2018). [DOI] [PMC free article] [PubMed] [Google Scholar]
- 59.La Manno G et al. RNA velocity of single cells. Nature 560, 494–498 (2018). [DOI] [PMC free article] [PubMed] [Google Scholar]
- 60.Bergen V, Lange M, Peidli S, Wolf FA & Theis FJ Generalizing RNA velocity to transient cell states through dynamical modeling. Nat. Biotechnol. 38, 1408–1414 (2020). [DOI] [PubMed] [Google Scholar]
- 61.Angerer P et al. Destiny: diffusion maps for large-scale single-cell data in R. Bioinforma. 32, 1241–1243 (2016). [DOI] [PubMed] [Google Scholar]
- 62.Aibar S et al. SCENIC: single-cell regulatory network inference and clustering. Nat. Methods 14, 1083–1086 (2017). [DOI] [PMC free article] [PubMed] [Google Scholar]
- 63.Steen CB, Liu CL, Alizadeh AA & Newman AM Profiling cell type abundance and expression in bulk tissues with CIBERSORTx. Methods Mol. Biol 2117, 135–157 (2020). [DOI] [PMC free article] [PubMed] [Google Scholar]
- 64.Schindelin J et al. Fiji: an open-source platform for biological-image analysis. Nat. Methods 9, 676–682 (2012). [DOI] [PMC free article] [PubMed] [Google Scholar]
Associated Data
This section collects any data citations, data availability statements, or supplementary materials included in this article.
Supplementary Materials
Data Availability Statement
The mouse UUO single-cell data presented in this paper are newly deposited to GSE182256. The publicly available mouse UUO single-cell data were obtained from GSE140023. The human kidney gene expression data can be downloaded from GSE173343, GSE115098. GRCm38 and GRCh38 were used for mice and human reference genome assembly, respectively.