

Abstract
The phenotypic and functional states of cells are modulated by a complex interactive molecular hierarchy of multiple omics layers, involving the genome, epigenome, transcriptome, proteome, and metabolome. Spatial omics approaches have enabled the study of these layers in tissue context but are often limited to one or two modalities, offering an incomplete view of cellular identity. Here we present spatial-Mux-seq, a multi-modal spatial technology that allows simultaneous profiling of five different modalities: two histone modifications, chromatin accessibility, whole transcriptome, and a panel of proteins at tissue scale and cellular level in a spatially resolved manner. We applied this technology to mouse embryos and mouse brains, generating detailed multi-modal tissue maps that identified more cell types and states compared to unimodal data. This analysis uncovered spatiotemporal relationships among histone modifications, chromatin accessibility, gene expression, and protein levels during neuron differentiation, and revealed a radial glia niche with spatially dynamic epigenetic signals. Collectively, the spatial multi-omics approach heralds a new era for characterizing tissue and cellular heterogeneity that single modality studies alone could not reveal.
Introduction
The intricate interplay between genotype and phenotype is shaped by a molecular hierarchy spanning multiple omics layers, involving the genome, epigenome, transcriptome, proteome, and metabolome1–3. In addition, the organization of cellular compartments, structures, and intercellular interactions is critical to the functional state of a cell in multicellular organisms3. Therefore, methodological and technological advances that allow simultaneous measurement of different layers of molecular information from cells within their native tissue context are crucial1. Recent advancements in multi-modal spatial omics have aided in resolving biological complexity by studying different molecular analytes within their original tissue contexts4–8. For example, parallel epigenomic profiling with gene expression uncovered new information of epigenetic priming, differentiation, and gene regulation within the tissue architecture4,5. Spatial co-mapping of the whole transcriptome and a panel of proteins substantially improved cell clustering and enhanced the discovery power across tissue regions, compared with unimodal measurements6–8. However, experimental integration of all these modalities is lacking, providing an incomplete representation of cellular states, and is inadequate to develop a fundamental understanding of the complex biological systems and their underlying regulatory mechanisms. In addition, cellular transcription programs are determined through the action of multiple epigenetic modalities, including transcription factors, and co-occurrence of synergistic or antagonistic histone marks9. The effects of these interactive chromatin regulatory factors on downstream gene or protein expression are missing from current single cell and spatial approaches.
In this study, we report a multi-modal spatial technology that allows simultaneous profiling of up to five different modalities, including open chromatin and two histone modifications, whole transcriptome, and a panel of proteins at tissue scale and cellular level in a spatially resolved manner. This was achieved by integrating microfluidic in situ barcoding4,7,10,11 and the nanobody-tethered transposition chemistry directly in tissue followed by high-throughput Next-Generation Sequencing (NGS)9,12. We applied this new technology to generate multi-modal tissue maps in mouse embryos and mouse brains, which enabled investigation of the intermolecular dynamics among chromatin states characterized by combinations of epigenetic factors, gene and/or protein expression, and tissue development, in a spatially resolved manner.
Results
The spatial-Mux-seq workflow
The spatial-Mux-seq technology for simultaneous chromatin accessibility, histone modifications, gene expression, and surface protein profiling on cryosections is depicted in Extended Data Fig. 1. In this workflow, frozen tissue sections are first fixed with formaldehyde, followed by in situ Tn5 transposition, which inserts barcoded DNA adaptors and a unique ligation linker into regions of accessible chromatin. The section is then incubated with two primary antibodies targeting different histone modifications. The species specific nanobody-Tn5 fusion proteins loaded with unique ligation linkers were added to enable the demultiplexing of different histone modification loci. For co-profiling of proteins, the fixed frozen tissue section was stained with a panel of poly-A-tailed oligo-conjugated antibodies, which recognize surface antigens. Next, in situ reverse transcription was performed using the biotinylated poly-T RT primer to capture both oligo-conjugated antibodies and mRNA. Next, barcodes A (A1-A50 or A1-A100) and barcodes B (B1-B50 or B1-B100) were sequentially flowed over the tissue using microchannels and were ligated to the universal ligation liker, which formed a two-dimensional grid of spatially barcoded tissue pixels (n =2,500 or 10,000), allowing all of modalities from the same pixel share the same spatial barcodes. Finally, barcoded complementary DNA (cDNA) and genomic DNA (gDNA) fragments were released by reverse crosslinking. cDNAs were separated from gDNA by streptavidin beads. Sequencing libraries for cDNAs and gDNA were then separately constructed. The protein library and mRNA library can be further separated by SPRI bead.
Spatial co-profiling of two histone modifications
Nanobody-based multimodal CUT&Tag had not previously been applied directly to tissues, so we first evaluated its specificity using species-specific nanobody-Tn5 fusion proteins (Fig. 1a). We targeted two mutually exclusive histone modifications: H3K27me3, a repressive mark involved in gene silencing and cell identity maintenance, and H3K27ac, an active mark found at enhancers and promoters associated with gene expression. These marks represent opposing chromatin states, making them ideal for testing the specificity of the nanobody-based in situ transposition method.
Fig. 1 |. Spatial-Mux-seq co-profiling of H3K27me3 and H3K27ac modifications in E13 mouse embryos with integrative analysis.
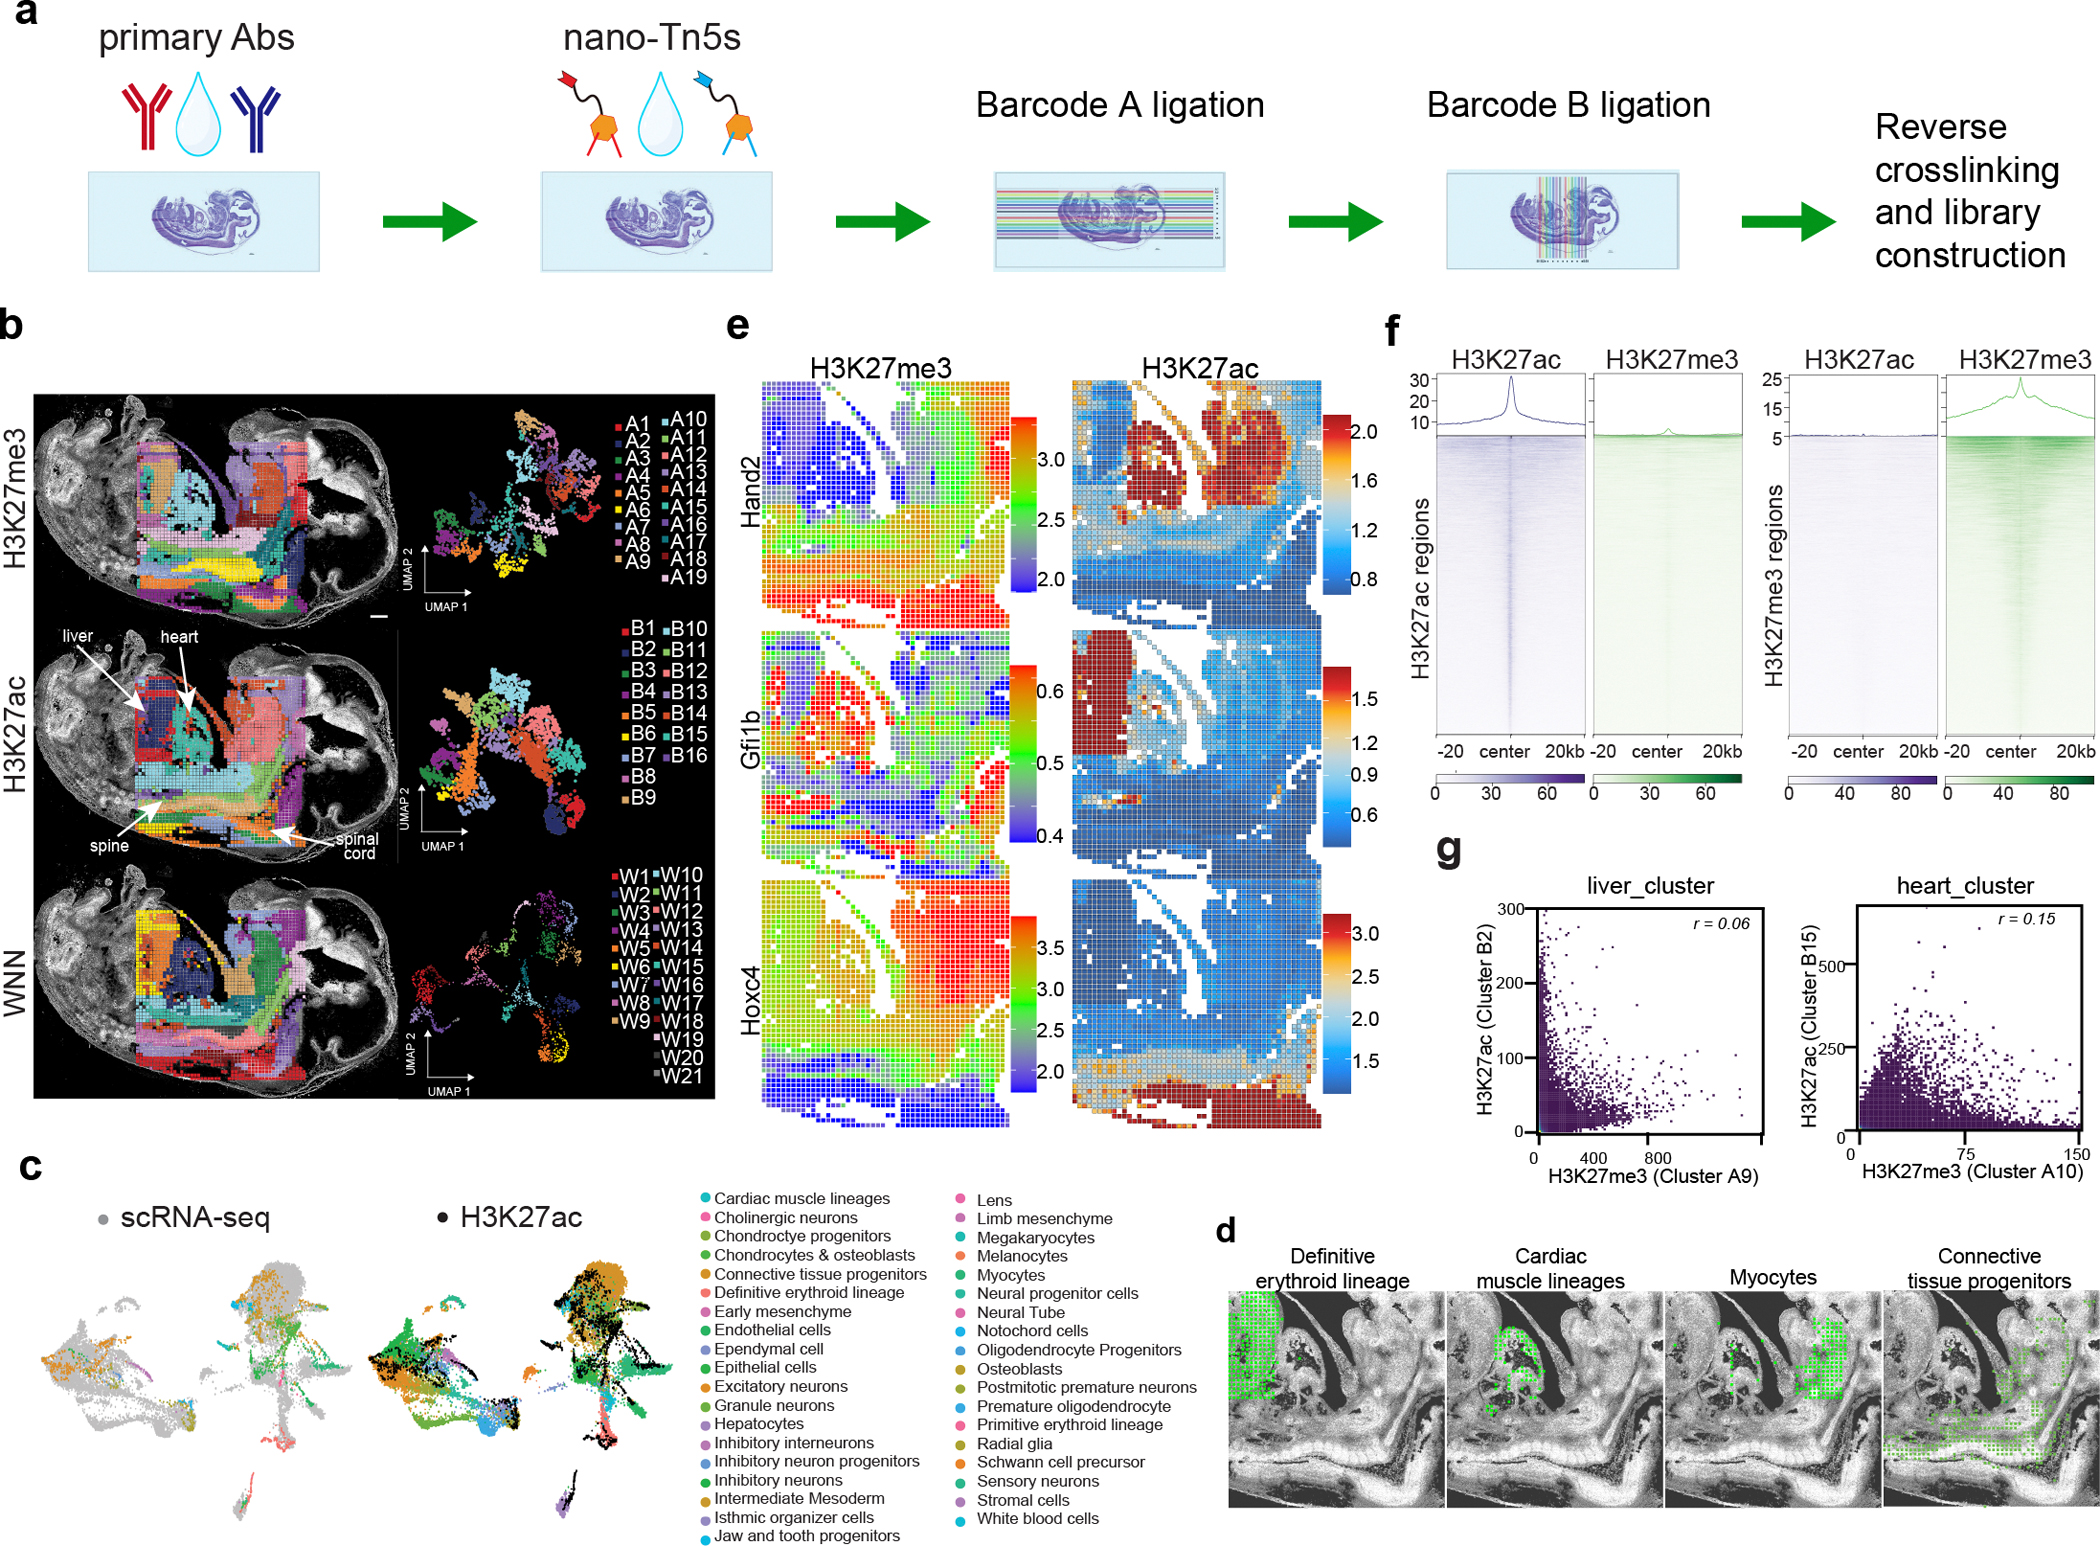
Sample: E13_50_μm_1. a, A schematic overview illustrating the workflow for spatial multimodal profiling of chromatin modifications at the tissue scale. b, Spatial distribution and Uniform Manifold Approximation and Projection (UMAP) embeddings derived from unsupervised clustering analysis of H3K27me3 and H3K27ac histone modifications. The integrated analysis uses the Weighted Nearest Neighbor (WNN) methodology. c, Integration of single-cell RNA sequencing (scRNA-seq) data14 with spatial-Mux-seq H3K27ac profiling. The alignment of cell types identified in scRNA-seq (left) with spatially resolved H3K27ac data (middle). The cell types identified through scRNA-seq are listed (right). d, Spatial mapping of selected cell types identified through label transfer from scRNA-seq to H3K27ac data. e, Spatial mapping of key developmental marker genes with H3K27me3 and H3K27ac histone modifications. f, Metagene plots showing the distribution of H3K27me3 and H3K27ac in fetal liver clusters obtained by spatial-Mux-seq around specific H3K27me3 and H3K27ac peaks. The peaks were defined from ENCODE datasets. g, Scatter plots showing correlation of H3K27me3 and H3K27ac signal in the liver and heart clusters. The peaks were defined from ENCODE datasets. r, Pearson correlation coefficient. scale bar: 500 μm.
We first benchmarked spatial-Mux-seq in E13 sagittal mouse embryo sections at 50-μm resolution (E13_50_μm_1), obtaining a median of 17,677 and 9,893 unique fragments per pixel for H3K27me3 and H3K27ac respectively (Supplementary Fig. 1a,b). These metrics aligned well with previously published single-modality spatial-CUT&Tag datasets11, demonstrating comparable transcriptional start site (TSS) enrichment scores for both modalities (Supplementary Fig. 1c). Reproducibility across replicates (E13_50_μm_1 and E13_50_μm_2) was high, with Pearson correlation of r = 0.93 for H3K27me3 and r = 0.91 for H3K27ac (Extended Data Fig. 2a–d). Additionally, consistent peaks were obtained across replicates (Extended Data Fig. 2e), and the expected nucleosomal phasing pattern for both histone marks was confirmed (Extended Data Fig. 2f).
Unsupervised clustering identified 19 clusters for H3K27me3 (An) and 16 clusters for H3K27ac (Bn), each showing distinct spatial patterns consistent with tissue histology of an adjacent section stained with hematoxylin and eosin (Fig. 1b and Supplementary Fig. 1d). For example, H3K27me3 cluster A10 and H3K27ac cluster B15 corresponded to the embryonic heart, while cluster A9 (H3K27me3) and B2 (H3K27ac) mapped to the liver. Integration of both modalities using weighted nearest neighbor (WNN) analysis13 improved and refined clusters by each histone mark (Fig. 1b and Supplementary Fig. 2a,b). Cell types were assigned by transferring labels from mouse embryonic (E13.5) scRNA-seq data14 to spatial-Mux-seq data (H3K27ac) (Fig. 1c), identifying cell types such as definitive erythroid cells in the liver, cardiac muscle lineages in the heart, and myocytes in both skeletal muscles (Fig. 1d).
We then explored the spatial patterns of specific marker genes to examine the interplay between active (H3K27ac) and repressive (H3K27me3) histone marks. For H3K27me3 and H3K27ac, the chromatin silencing score (CSS) and gene activity score (GAS) were calculated to predict the gene expression respectively15. Hand2, an important regulator of craniofacial and cardiac development16,17, was enriched for H3K27ac but not H3K27me3 in the jaw and heart region (Fig. 1e). In the liver, Gfi1b, crucial for erythroid and megakaryocytic lineages18, showed high GAS of H3K27ac and low CSS of H3K27me3 in that region. Similarly, region, H3K27ac was significantly enriched at Nprl3 locus in the liver (Extended Data Fig. 3a), emphasizing its role in the erythroid development19,20. The Sox2 was enriched for H3K27me3 in most regions except the spinal cord (Extended Data Fig. 3b), where it is required to maintain the properties of neural progenitor cells within that region21.
The correlation between epigenetic marks and transcript abundance was further studied by comparing the CSS and GAS with scRNA-seq data14. In excitatory neurons, we observed a positive correlation between H3K27ac and gene expression, alongside an anticorrelation with H3K27me3 (Extended Data Fig. 4a–c). Marker genes such as Ina, Crmp1, and Atp1a3 exhibited significant enrichment with H3K27ac and minimal enrichment with H3K27me3 in the excitatory neuron region (Extended Data Fig. 4d), highlighting the interplay between active (H3K27ac) and repressive (H3K27me3) histone marks in regulating gene expression.
We verified the specificity of each modality by analyzing highly specific peaks for H3K27me3 and H3K27ac in the liver. This revealed significant enrichment of the respective modifications within their corresponding marker peaks (Fig. 1f). Moreover, we analyzed H3K27me3 and H3K27ac signals in liver and heart clusters, finding no significant correlations between these histone marks (Fig. 1g). Collectively, these results highlight the robustness of spatial-Mux-seq in co-profiling epigenetic marks and its potential for studying complex developmental processes.
Four-modal profiling of epigenome and transcriptome
Single-cell nanobody-based CUT&Tag has been utilized for co-measurement of open chromatin9 or cell surface markers12, though transcriptomic analysis remains unexplored. To address this limitation, we developed a method for simultaneous profiling of chromatin accessibility (ATAC), two histone modifications (H3K4me3 and H3K27me3), and transcriptome in the same section at 50-μm resolution (E13_50_μm_3). We achieved a median of 39,014 unique fragments for ATAC, 6,657 for H3K4me3, and 8,496 for H3K27me3 per pixel (Supplementary Fig. 3a,b). These results were benchmarked by comparing with the individual omics data from spatial-CUT&Tag11 as well as co-profiled modalities from spatial-ATAC-RNA-seq4. Each modality exhibited similar counts of unique fragments and matched TSS enrichment scores, demonstrating that the inclusion of more modalities does not compromise data quality (Supplementary Fig. 1c). For the RNA portion, a total 22,171 genes were detected with an average of 1,569 genes and 2,538 UMIs per pixel, consistent with RNA results from spatial-ATAC-RNA-seq4 performed on the same tissue type (Supplementary Fig. 3b,c). Unsupervised clustering analysis revealed 10 clusters for ATAC (An), 7 clusters for H3K4me3 (Bn), 9 clusters for H3K27me3 (Cn), and 11 clusters for RNA (Rn), which showed concordance in cluster assignment and agreed with tissue histology (Fig. 2a). The heart region, for instance, was detected across all modalities: cluster A4 of ATAC, cluster B5 of H3K4me3, cluster C3 of H3K27me3, and cluster R6 of RNA data. However, the liver region could only be distinguished into two distinct clusters (A1 and A2) from ATAC data, which was not observed in the histone modification data (Fig. 2a), where canonical E2F activator E2f2 had stronger open chromatin signals in the A2 liver cluster compared with A1 liver cluster (Fig. 2b,c). Additionally, we intersected ATAC, H3K4me3, and H3K27me3 peaks from the liver cluster, and observed that H3K4me3 and ATAC peaks showed strong overlap (8,324 overlapping regions), and a subset of genomic regions demonstrated variability in all three modalities simultaneously (4,165 overlapping regions) (Supplementary Fig. 3d).
Fig. 2 |. Spatial co-profiling of ATAC, RNA, H3K4me3, and H3K27me3 in mouse embryos.
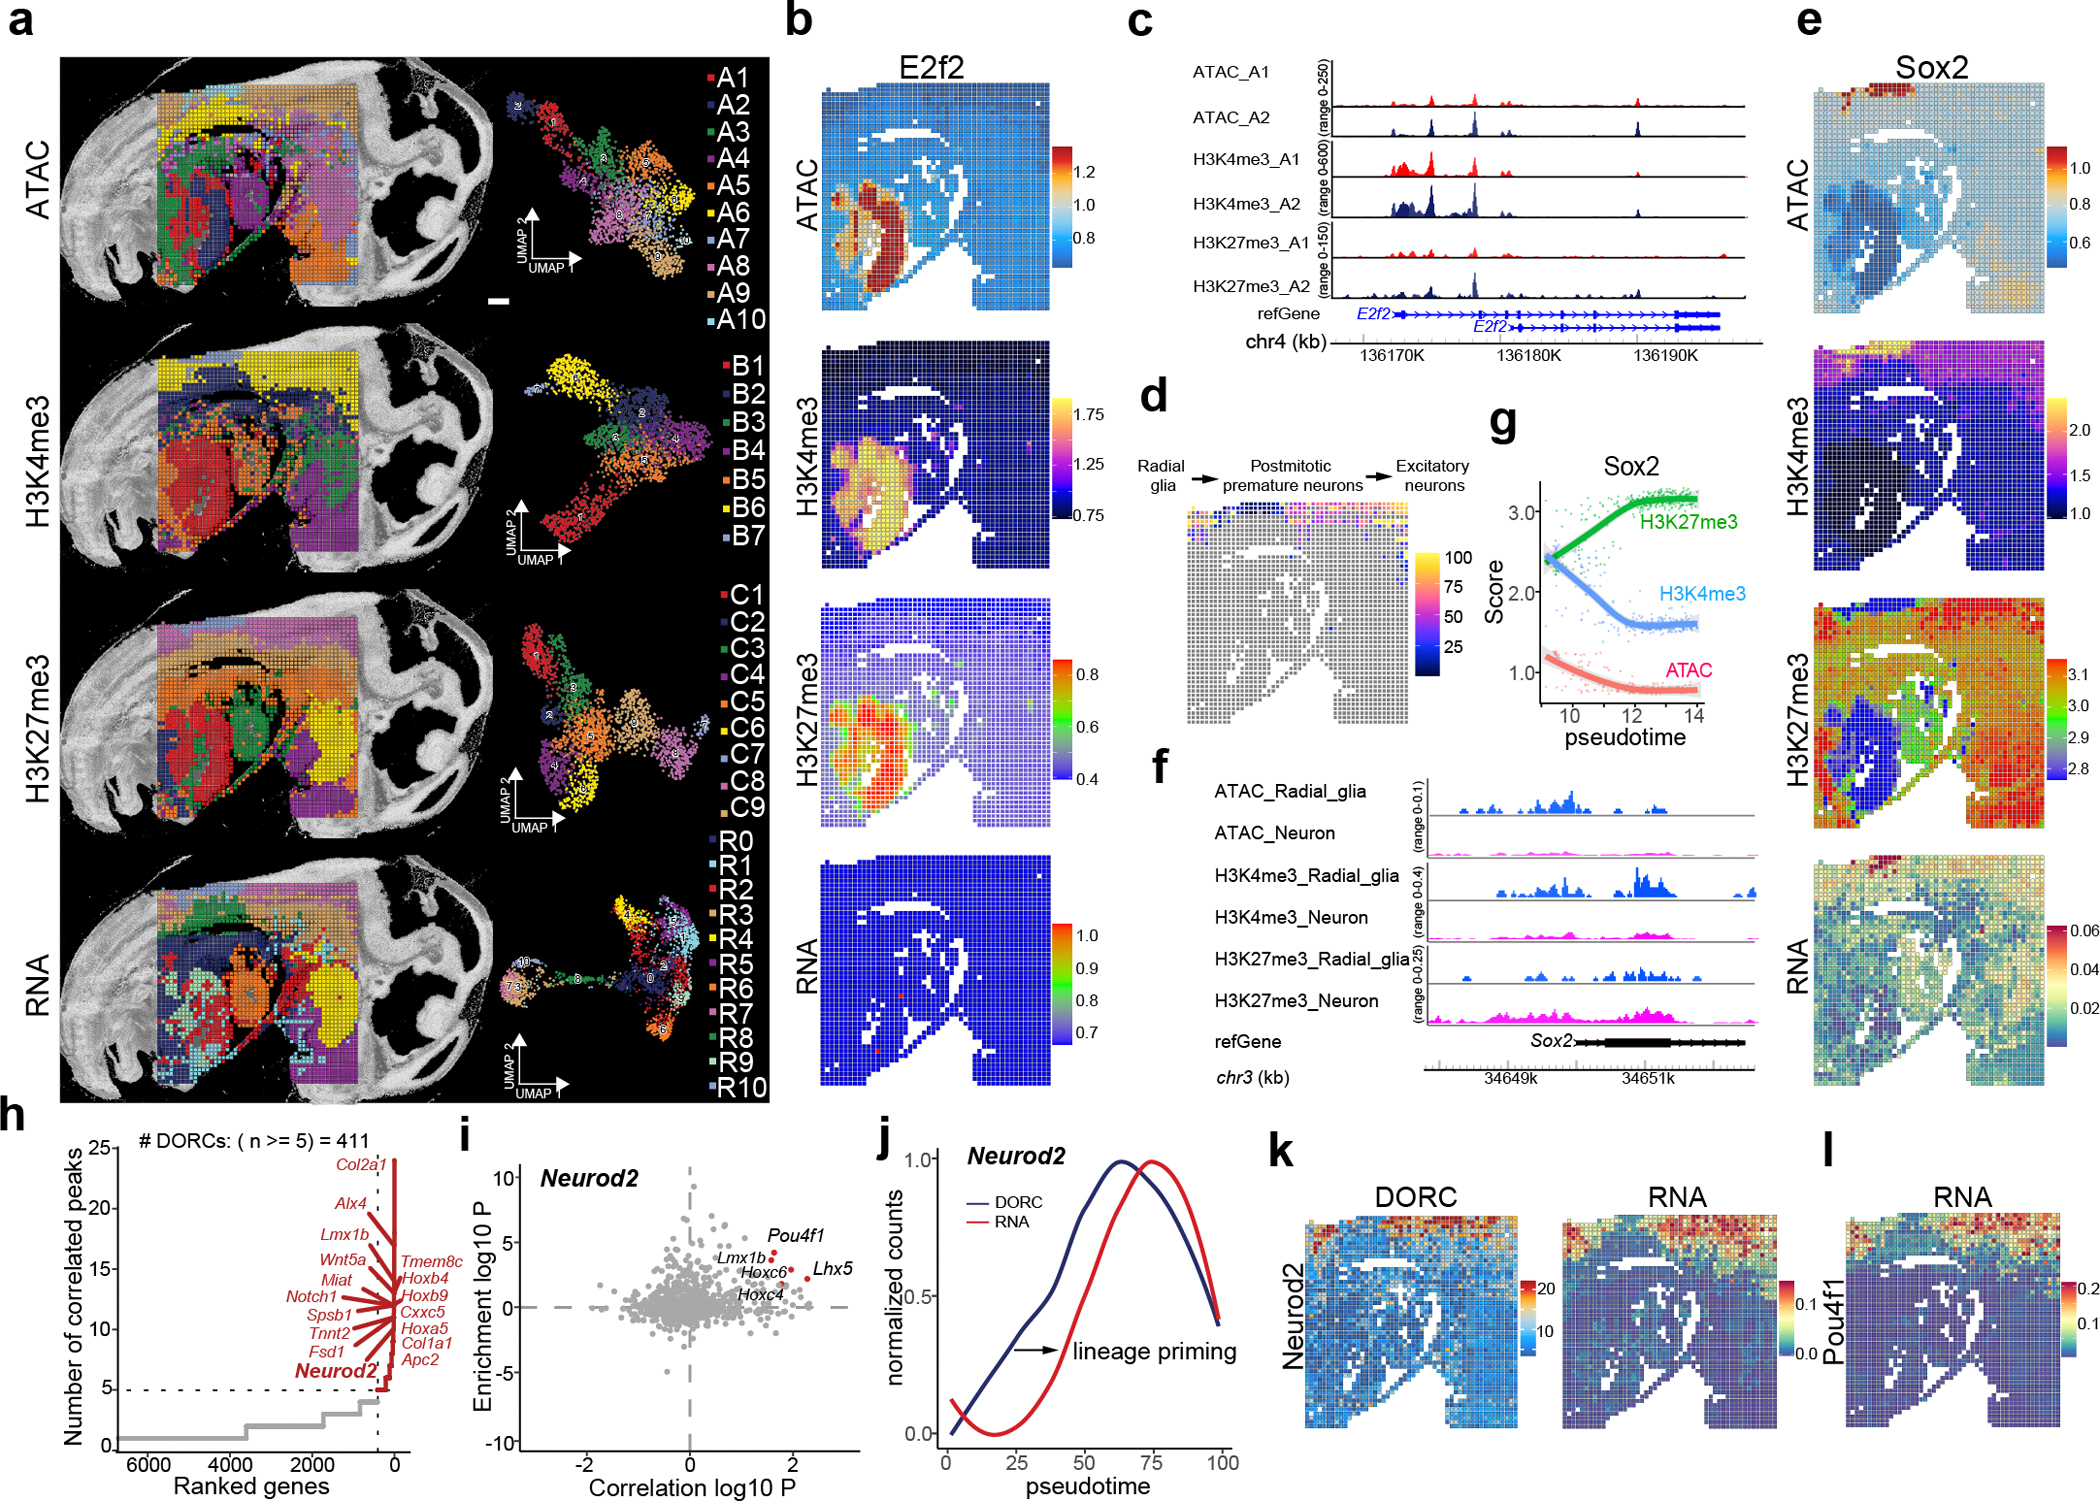
Sample: E13_50_μm_3. a, Spatial distribution and UMAP embeddings from unsupervised clustering analysis of four different modalities—ATAC, RNA, H3K4me3, and H3K27me3—profiling in E13 mouse embryos at a 50 μm pixel resolution. b, Spatial mapping of E2f2 gene with ATAC, RNA, H3K4me3 and H3K27me3 marks. c, Genome browser tracks of the E2f2 gene showing ATAC, H3K4me3, H3K27me3, and RNA expression in liver clusters A1 and A2, as defined by ATAC-seq clustering. d, Integration of ATAC data with scRNA-seq data14 from E13.5 mouse embryos, followed by pseudotime analysis. The pseudotime trajectory from radial glia to postmitotic premature neurons and excitatory neurons is plotted in spatial coordinates. e, Spatial mapping of the Sox2 gene across ATAC, RNA, H3K4me3, and H3K27me3 modalities in the developing mouse brain. f, Genome browser tracks of Sox2 gene in ATAC, H3K4me3, and H3K27me3 modalities. The selected cell types are radial glia and postmitotic premature neurons. g, Scatter plot showing the dynamics of ATAC, H3K4me3, and H3K27me3 signals for Sox2 locus across pseudotime as determined in (d). h, ATAC and RNA data are used for domains of regulatory chromatin (DORCs) analysis with FigR29 package. The plot highlights the top-hit genes based on the number of significant gene-peak correlations across all cell types. (one-tailed t-test, FDR < 1×10⁻⁴, and P < 0.05). i, Identification of candidate transcription factor regulators of Neurod2 using DORC analysis. Highlighted points represent top-hit TFs with regulation score ⩾ 1 (−log10 scale), with all other TFs shown in gray. j, Comparison of chromatin (DORC) dynamics versus gene expression (RNA-seq) for Neurod2. k, Spatial patterns of DORCs Neurod2 and its gene expression. l, Spatial gene expression of the transcription factor Pou4f1. Scale bar: 500 μm.
To further leverage the multimodal datasets, we conducted WNN analysis to integrate all trimodal and quadrimodal matrices. This approach enhanced the clustering identified by individual modality and revealed novel clusters that were not detectable with any single modality alone (Fig. 2a and Supplementary Fig. 4). For instance, the craniofacial region exhibited additional subclusters when analyzed through tri- or quadrimodal integration. Similarly, the heart region was further divided into two distinct subclusters through the integration of ATAC/H3K27me3/RNA or ATAC/H3K4me3/RNA modalities (Supplementary Fig. 4).
The co-profiling of chromatin accessibility and gene expression offers significant insights into the regulatory mechanisms of gene expression and cellular function4,22. However, there are situations that two modalities are not consistently correlated4, which could potentially be elucidated by considering additional epigenomic information. For example, E2f1–3 genes were lowly expressed during fetal liver development14,23, despite high chromatin accessibility was observed in the liver region (Fig. 2b and Supplementary Fig. 5a,b). This discrepancy could be explained by the co-measured H3K27me3 signals, which were also enriched at the promoter regions of E2f genes (Fig. 2c and Supplementary Fig. 5c,d), indicating bivalency of E2f promoter in fetal liver. To further explore cell identity, we integrated ATAC and H3K4me3 data with scRNA-seq mouse embryo dataset14. This revealed clusters that conformed well to known cell types (Extended Data Fig. 5a,b), such as chondrocytes and osteoblasts (cluster A5 and B4), excitatory neurons (cluster A9 and B6), and radial glia (cluster A10 and B7). Remarkably, the ATAC data exhibited a greater abundance of postmitotic premature neurons compared to the H3K4me3, suggesting potential differences in chromatin states between neuron clusters.
To explore the spatiotemporal relationship between gene expression, chromatin accessibility, and histone modifications, we examined the developmental trajectory from radial glia to differentiated neurons24. A radial glia niche in the dorsal spinal cord was revealed by all four modalities: cluster A10 of ATAC, cluster B7 of H3K4me3, cluster C7 of H3K27me3, and cluster R10 of RNA data (Fig. 2a and Extended Data Fig. 5b). Pseudotime analysis25 of ATAC data visualized this trajectory (Fig. 2d). Several marker genes were identified and showed dynamic changes along this trajectory. For instance, Sox2, a key regulator of neural development26, exhibited elevated chromatin accessibility and H3K4me3 with low levels of H3K27me3 in the radial glia (Fig. 2e–g). Furthermore, spatial RNA data revealed region-specific gene expression of Sox2 within the radial glia cluster. During the transition to postmitotic premature neurons and excitatory neurons, we observed a significant decrease in Sox2 gene expression, along with the inaccessible chromatin, reduced H3K4me3 enrichment, and increased levels of H3K27me3. Conversely, genes involved in neuronal development27 and synaptic transmission28, such as Ank3 and Gria2, showed increased gene expression, along with accessible chromatin, consistent H3K4me3 enrichment, and low H3K27me3 enrichment at their gene loci (Extended Data Fig. 5c–e). We further analyzed Geno Ontology (GO) with spatial RNA data from radial glia and differentiated neuron clusters, and the results agreed with the anatomical annotation (Extended Data Fig. 5f,g).
Developmental gene expression programs are orchestrated by a complex interplay between cis-regulatory elements and trans-acting factors, forming gene regulatory networks (GRNs). To infer GRNs, we integrated our multi-modal data for GRNs analysis using the FigR framework29, linking distal cis-regulatory elements with target genes. Analysis of co-profiled spatial ATAC-seq and RNA-seq datasets identified 411 lineage-determining genes marked as distinct domains of regulatory chromatin (DORCs)30 (Fig. 2h and Supplementary table 8), enriched for roles in lineage determination and development (Supplementary Fig. 6a). Notably, Neurod2 stands out as a critical gene known for its pivotal role in guiding the differentiation of neural progenitor cells into mature neurons31. The spatial distribution of Neurod2 showed high DORC accessibility and gene expression within clusters of postmitotic premature neurons and excitatory neurons (Fig. 2k), and changes in DORC accessibility of Neurod2 preceded that of its gene expression along the differentiation trajectory due to the lineage-priming (Fig. 2j). We then calculated the enrichment of transcription factor motifs within the Neurod2 DORC, to deduce potential TF activators (Fig. 2i). We identified Pou4f1, Lhx5, and Lmx1b as prominent transcriptional activators involved in dorsal spinal cord development32. Their elevated expression was confirmed in differentiated neurons (Fig. 2l and Supplementary Fig. 6b). Further GRN analysis revealed that Neurod2 could directly control Nfib expression (Supplementary Fig. 6c). Additionally, Neurod2 and Nfib co-regulated genes like Sec14l1, Ap2a1, and Lingo1, enriched in intermediate-stage neurons (Supplementary Fig. 6d). Collectively, our approach, offered a powerful tool to elucidate regulatory mechanisms driving neural development.
Co-profiling of protein, transcriptome, and epigenome
H3K4me3 and H3K27me3 are histone modifications with opposing roles in gene regulation. H3K4me3 is typically linked to active gene transcription, marking promoters of genes, while H3K27me3 is associated with gene repression, marking regions where gene expression is silenced. During development, the co-occurrence of these two marks at the promoters of developmental genes creates a “bivalent chromatin” state33, keeping genes in a poised condition for rapid activation or repression. However, the direct analysis of bivalent chromatin state and its downstream effects on gene and/or protein expression at the genome scale is still limited. To address this, we co-profiled H3K27me3/H3K4me3, gene expression, and a panel of 7 cell surface proteins from the E13 hindbrain at near single cell resolution (E13_20_μm, Supplementary Table 7). We obtained a median of 1,510 (H3K27me3) and 897 (H3K4me3) unique fragments per pixel (Supplementary Fig. 7a,b), with matched TSS enrichment scores for each histone modification (Supplementary Fig. 7c). For the RNA portion, total 22,165 genes were detected with an average of 1,258 genes and 1,999 UMIs per pixel (Supplementary Fig. 7b,e). To evaluate the impact of different pixel sizes on data quality, we compared samples E13_50_μm_3 and E13_20_μm, both derived from mouse embryonic day 13 tissue and sharing three modalities: H3K4me3, H3K27me3, and RNA. After downscaling to the same sequencing depth, the 50-μm samples captured more unique fragments, gene counts, and UMIs (Supplementary Fig. 7d,e), due to the larger area and higher number of nuclei per pixel.
Unsupervised clustering identified clusters with distinct spatial patterns across H3K27me3, H3K4me3, and RNA data, aligning with tissue morphology (Fig. 3a,b). H3K27me3 clusters A1-A9, H3K4me3 clusters B1-B5, and RNA clusters R1-R12 revealed cell type-specific spatial distributions, though H3K4me3 was less effective at discriminating cell types at this developmental stage. We then integrated RNA data with scRNA-seq dataset14 to assign cell types to each cluster (Fig. 3a,b and Extended Data Fig. 6a). Marker genes of spatial-RNA data identified major cell types, such as Col1a (osteoblasts), Elavl2 (sensory neurons), Hmga2 (epithelial cells), Sox2/Pax3 (radial glia), and Bcl11b (postmitotic premature neurons). In the hindbrain region, we explored the spatiotemporal relationship between H3K4me3, H3K27me3, and gene/protein expression. Radial glia and postmitotic premature neurons were enriched in overlapping clusters in both H3K27me3 (cluster A1–3) and H3K4me3 (cluster B4–5) datasets (Fig. 3a). Neural progenitor cells, derived from radial glia, were revealed only by integrated analysis (Fig. 3a). To investigate the dynamic changes in bivalency during the transition from radial glia to differentiated neurons, we identified active promoters specific to neural cell types and plotted H3K4me3 and H3K27me3 signals (Fig. 3b,c). Radial glia had the lowest H3K27me3 enrichment at H3K4me3-defined promoters, suggesting reduced bivalency compared to differentiating neurons.
Fig. 3 |. Spatial co-profiling of protein, RNA, H3K4me3, and H3K27me3 in mouse embryos.
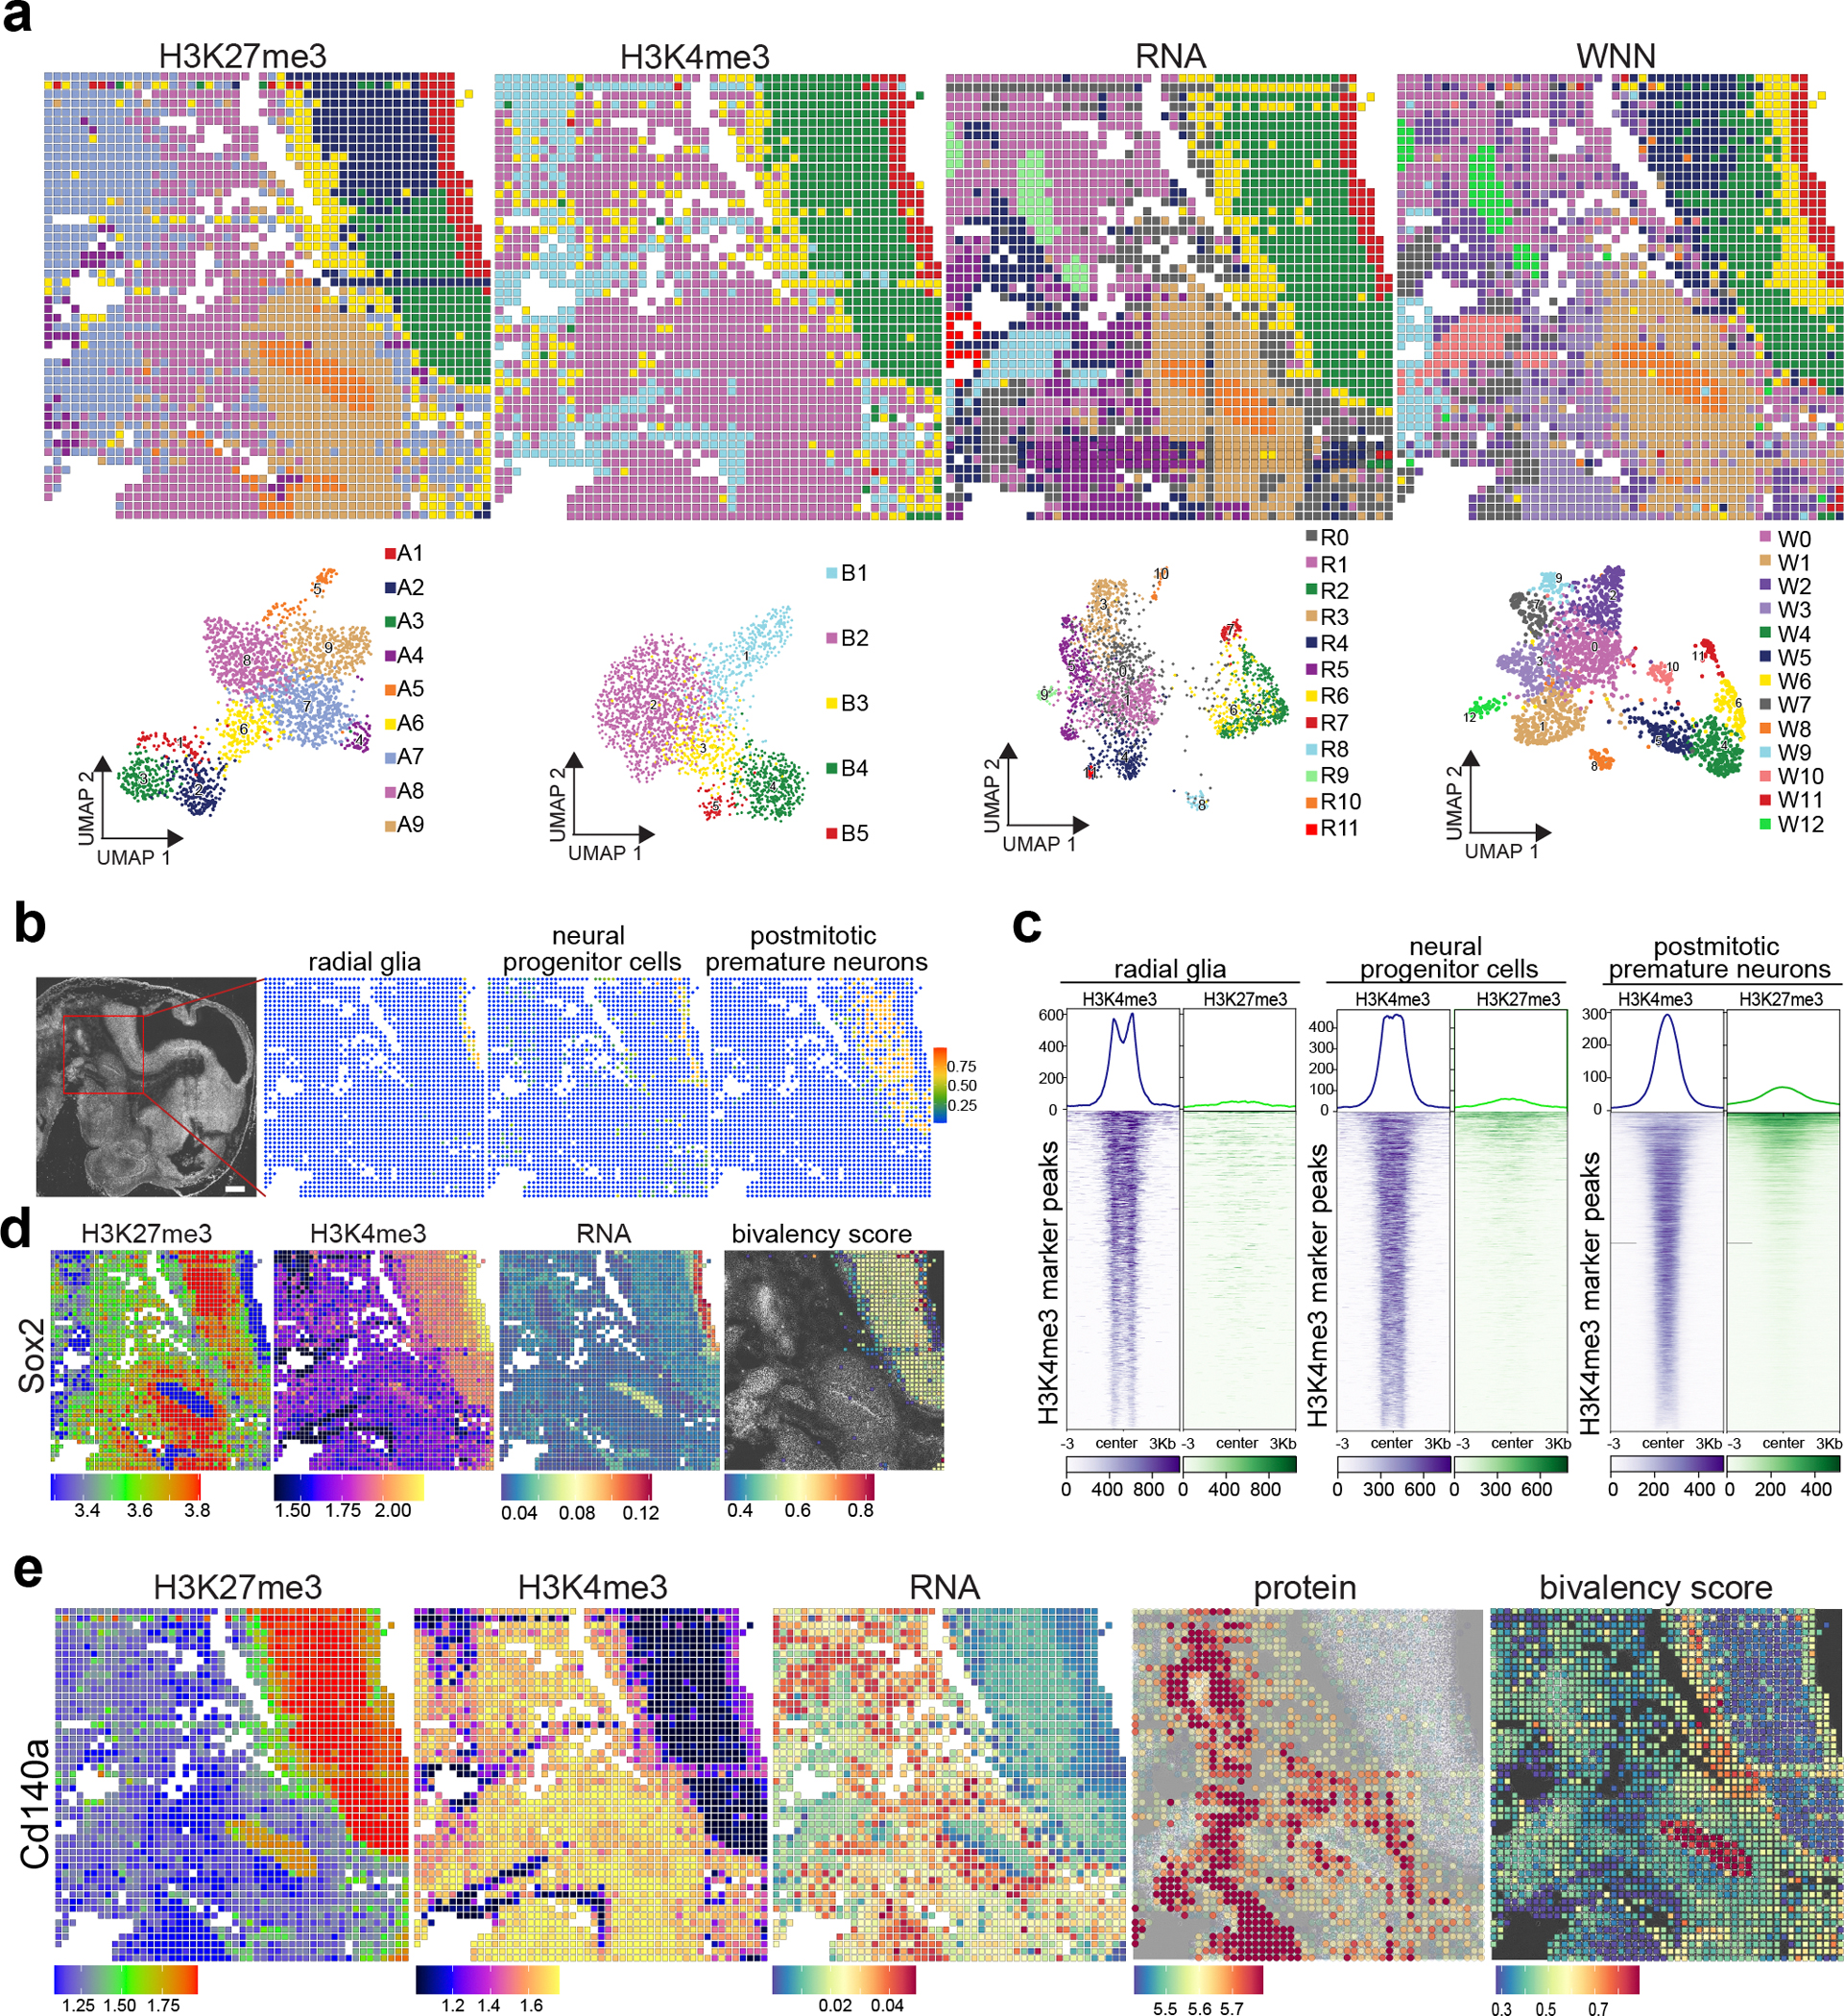
Sample: E13_20_μm. a, Spatial distribution and UMAP embeddings of unsupervised clustering analysis performed on each modality—H3K27me3, H3K4me3, RNA, and WNN integration—at a 20 μm pixel resolution in E13 mouse embryos. b, Integration of spatial RNA data with scRNA-seq data14 from E13.5 mouse embryos enables high-resolution mapping of selected cell types, including radial glia, neural progenitor cells, and postmitotic premature neurons. The red square highlights the region captured for spatial analysis. c, Deconvolution analysis of potential H3K4me3/H3K27me3 bivalency for clusters as determined in (b). d, Spatial mapping of the Sox2 gene across RNA, H3K4me3, H3K27me3 modalities, and the calculated Sox2 bivalency score. The bivalency score is calculated by chromatin bivalency analysis and described in Methods. e, Spatial patterns of the Cd140a gene, visualized across protein levels (using antibody-derived DNA tags), RNA expression, H3K4me3, H3K27me3, and the Cd140a bivalency score. Scale bar: 500 μm.
Bivalency scores34 provided a quantitative measure of bivalent chromatin domains, offering insights into gene regulation at specific loci. For example, the Sox2 and Pax3 loci showed higher bivalency scores in postmitotic premature neurons compared to radial glia cluster (Fig. 3d and Extended Data Fig. 6b), reflecting an increase in H3K27me3 and a decrease in H3K4me3 signals during differentiation. In contrast, the Alx1 gene showed decreased bivalency scores and H3K4me3 signals during differentiation, while H3K27me3 remained high, correlating with its gene repression (Extended Data Fig. 6b).
In parallel with epigenome and gene expression profiling, we expanded our investigation to include a detailed analysis of surface protein distribution within the tissue. Cd140a protein was mainly detected in non-neuronal region, consistent with its gene expression and H3K4me3 presence, but without H3K27me3 (Fig. 3e). In the epithelial cell cluster, bivalent H3K27me3/H3K4me3 at the Cd140a locus corresponded with undetectable gene expression and absence of the protein. Visualizing the expression of seven proteins revealed distinct spatial patterns (Supplementary Fig. 8), Cd133 and B220 exhibit distinct spatial patterns, which is consistent with the spatial distribution observed in the Allen mouse brain In Situ Hybridization (ISH) datasets (Supplementary Fig. 8a,b). The spatial distribution of Cd90 proteins was assessed using antibodies specific to Thy-1.1 (Cd90.1) and Thy-1.2 (Cd90.2), which differ by a single amino acid35. As shown in the Supplementary Fig. 8c, Cd90.1 proteins exhibited a distinct pattern in the hindbrain region. In contrast, Cd90.2 proteins demonstrated a broader distribution, with a noticeable presence in non-hindbrain regions. This differential expression underscores the importance of considering protein isoforms when assessing regional specificity during neurodevelopmental studies. In summary, spatial-Mux-seq enables the simultaneous measurement of modalities across two histone modifications, gene expression, and proteins from the same tissue section at nearly single-cell resolution.
Multiplexed spatial mapping of mouse brain
To evaluate the application of spatial-Mux-seq across different tissue types, we co-profiled H3K27me3/H3K27ac and transcriptome from the mouse postnatal day 21 hippocampus at near single cell resolution (P21_20_μm). A median of 3,571 (H3K27me3) and 1,249 (H3K27ac) unique fragments per pixel (Supplementary Fig. 9a–c) were obtained, and a total 23,090 genes were detected with an average of 1,499 genes and 2,848 UMIs per pixel (Supplementary Fig. 9b,e). Unsupervised clustering identified 11 H3K27me3 clusters (An), 10 H3K27ac clusters (Bn), and 9 RNA clusters (Rn), which aligned with the anatomical annotations in a hematoxylin and eosin (H&E)–stained adjacent tissue section (Fig. 4a,b). By integrating scRNA-seq dataset36 from the mouse brain atlas with spatial RNA-seq data, we deconvoluted major cell types using RCTD37. We generated single-cell resolved cell-type maps across the mouse brain, which revealed distinct spatial patterns that delineated various brain regions (Supplementary Fig. 9f). For instance, within the hippocampus, we identified distinct cell populations, including dentate gyrus granule neuroblasts and dentate gyrus granule neurons (DGGRC) localized to the dentate gyrus, while CA excitatory neurons (TEGLU) were mapped to the Cornu Ammonis region. In the thalamus, habenula cholinergic neurons (DECHO) and thalamus excitatory neurons (DEGLU) exhibited distinct spatial distributions, each corresponding to specific subregions.
Fig. 4 |. Spatial mapping of RNA, H3K27ac, and H3K27me3 in mouse juvenile brain.

Sample: P21_20_μm. a, Spatial distribution and UMAP embeddings of unsupervised clustering analysis of H3K27me3, H3K27ac, RNA, and WNN with mouse juvenile brain (P21: 20 μm pixel size). b, Hematoxylin and Eosin (H&E) stained image of an adjacent tissue section from the juvenile mouse brain (n = 1). c, Spatial mapping of two distinct hippocampal dentate gyrus subclusters: the dentate gyrus subgranular zone (DG-sgz) and the dentate gyrus granular cell layer (DG-sg). d, UMAP embeddings of the DG-sgz and DG-sg clusters, illustrating their distinct separation based on their molecular signatures. e, Differential expression of genes in DG-sgz clusters and DG-sg clusters. Volcano plot depicting the differentially expressed genes in DG-sgz clusters compared with DG-sg clusters (two-tailed t-test, P adj <0.05, logFC.threshold = 0.25). f, Spatial mapping of the Igfbpl1 gene, showing its expression across RNA, H3K27ac, and H3K27me3 modalities. g, Genome browser tracks for the Igfbpl1 gene within the DG-sg and DG-sgz clusters, detailing the chromatin landscape at this locus. The selected TSS region of Igfbpl1 was shown as a gray box. h-i, Pearson correlation between Igfbpl1 expression and histone mark H3K27ac (h) or H3K27me3 (i) gene scores. The gene scores are derived based on the gene model surrounding the transcription start site (TSS) covering the DG-sg and DG-sgz clusters. j, Correlation of H3K27ac GAS and RNA gene expression. k, Correlation of H3K27me3 CSS and gene expression. Scale bar: 500 μm.
Building on these findings, we examined the spatial distributions of specific markers to further distinguish cell types. We observed a robust enrichment of H3K27ac and elevated gene expression levels of Mbp specifically within the white matter of corpus callosum, whereas the H3K27me3 signal exhibited the strongest intensity in the medial habenula region (Extended Data Fig. 7a). Prox1 gene was highly expressed and was associated with strong enrichment of H3K27ac in the dentate gyrus of hippocampus. Remarkably Prox1 was heavily marked by H3K27me3 specifically in the hippocampal CA region. Additional marker genes, such as Scube1 and Gria1, exhibited specific H3K27me3 patterns in dentate gyrus or CA regions of hippocampus suggesting active involvement of H3K27me3 and polycomb repressive complex in the development of hippocampus in certain brain regions (Extended Data Fig. 7a).
We leveraged multimodal datasets by performing WNN analysis, which enhanced clustering and identified novel clusters. The integrative analysis effectively enhanced the clustering identified by each modality, and additionally captured novel clusters that could not be detected by any individual modality (Fig. 4a and Extended Data Fig. 7b). Within the thalamus region, further subdivision revealed three novel clusters: the stria medullaris (cluster W4), the central lateral nucleus of the thalamus (cluster W1), and the lateral dorsal nucleus of the thalamus (cluster W2). In adult mammals, radial glia-like cells generate granule cells from the dentate gyrus subgranular zone38. The maturation of granule cells occurs in the third postnatal week, which establishes a distinct granule cell identity39. To further reveal the diversity and molecular properties of mouse hippocampal progenitors, we subclustered the dentate gyrus granule cells and further identified two subclusters: dentate gyrus granule cell layer (DG-sg, cluster W6_0) and a thin layer of dentate gyrus granule subgranular zone (DG-sgz, cluster W6_1) (Fig. 4c,d). Differential gene expression analysis revealed that during the transition from DG-sgz to DG-sg, 243 genes were significantly downregulated, while 361 genes were significantly upregulated (P adj < 0.05, avg_logFC > 0.25) (Fig. 4e). For example, Igfbpl1 expression was reduced in DG-sg relative to DG-sgz (Fig. 4f), whereas Prox1 exhibited elevated expression in DG-sg compared to DG-sgz (Extended Data Fig. 7a). Upon analyzing their histone modifications along granular maturation, we noticed that the alteration in Igfbpl1 expression coincided with a decrease in its H3K27ac signal without substantial increase in H3K27me3 (Fig. 4g–i), whereas the change observed in Prox1 expression was associated with a decrease in H3K27me3 signal and an increase in H3K27ac signal (Extended Data Fig. 7c–e). In the hippocampal dentate gyrus, we observed a robust correlation between H3K27ac and gene expression and an anticorrelation between H3K27me3 and gene expression (Fig. 4j,k), including Prox1, Wipf2, and Bhlhe22, which exhibited significant enrichment with H3K27ac and minimal enrichment with H3K27me3, confirming the regulatory mechanism involving mutually exclusive H3K27me3/H3K27ac in gene expression regulation.
Five-modal profiling of epigenome, RNA, and protein
We applied spatial-Mux-seq to co-profile five modalities—chromatin accessibility, two histone modifications, transcriptome, and a large panel of cell surface proteins—in the same tissue section. By optimizing the sequential capture of different modalities, we generated ATAC/H3K27me3/H3K27ac, RNA, and 122 oligo-tagged antibody (Supplementary Table 7) libraries from an adult mouse brain section (Extended Data Fig. 8a). Most of the oligo-tagged antibodies present in the commercial panel are immune markers and thus we specifically analyzed the mouse model of neuroinflammation-experimental autoimmune encephalomyelitis (EAE), a widely used model for multiple sclerosis that replicates key disease features like immune activation and infiltration into the central nervous system40. Using a 100 × 100 barcode scheme, the mapping area covered almost one hemisphere of the mouse brain in a coronal section. We obtained a median of 1,930 (ATAC), 1,433 (H3K27me3) and 405 (H3K27ac) unique fragments per pixel (Extended Data Fig. 8b–d), and a total 25,515 genes were detected with an average of 1,458 genes and 2,976 UMIs per pixel (Extended Data Fig. 8e). For the cell surface markers, we detected a median of 88 proteins and 728 protein UMIs per pixel (Extended Data Fig. 8e).
Unsupervised clustering across modalities identified 4 ATAC clusters (An), 11 H3K27me3 clusters (Bn), 8 H3K27ac clusters (Cn), 17 RNA clusters (Rn), and 7 protein clusters (Pn) (Extended Data Fig. 9a). Integration with scRNA-seq data36 identified major cell types: Medium Spiny Neurons (MSN1/2) were predominantly located in the striatum, mature oligodendrocytes (MOL2) in the corpus callosum, and telencephalic glutamatergic neurons (TEGLU8) in the cortex (Extended Data Fig. 9b,c). Validation using region-specific markers confirmed spatial localization and cell-type specificity. For example, Bcl11b expression was predominantly in deep layer neurons and in the dorsal striatum, whereas H3K27me3 repressed it in superficial cortex layers and the corpus callosum (Supplementary Fig. 10a). Interestingly, despite the dorsal-specific expression of Bcl11b, H3K27ac was deposited in both dorsal and ventral striatum. Tbr1 exhibited open chromatin and H3K27ac signals predominantly in the cortex, with anticorrelated H3K27me3 deposition (Supplementary Fig. 10a). Dlx1 expression was predominantly localized to the lateral ventricle, as shown in the Supplementary Fig. 10a, with more widespread H3K27ac deposition and chromatin accessibility extending into the surrounding regions. Although Dlx1 expression was absent in the striatum, it was not marked by H3K27me3-mediated repression in this area. In contrast, Dlx1 was repressed by H3K27me3 in the cortex, highlighting region-specific regulatory mechanisms.
Comparing chromatin accessibility, histone modifications, RNA, and protein expression highlighted notable differences across these molecular layers. For example, in the corpus callosum, Cd140a protein, RNA, ATAC, and histone modifications revealed distinct variations (Extended Data Fig. 10a). Cd140a protein expression exhibited a highly localized and defined pattern, contrasting with the more diffuse RNA signal. Interestingly, chromatin accessibility closely mirrored the protein expression pattern, suggesting that regions with accessible chromatin correlate with Cd140a protein localization. The histone modifications added another layer of complexity to this regulatory landscape. H3K27ac, typically associated with active enhancers, displayed a more widespread distribution, which did not directly correspond with the spatially well-defined expression of the Cd140a protein. In contrast, H3K27me3 exhibited a distinct and opposing spatial pattern, suggesting that certain Cd140 isoforms might be epigenetically suppressed. Upon further analysis of individual Cd140 isoforms in the corpus callosum, we found that the longest Cd140 isoform showed higher RNA expression, correlating with a lower H3K27me3 signal at its transcription start site, compared with other isoforms (Extended Data Fig. 10b). This suggests that the epigenetic landscape may selectively allow the transcription of certain isoforms while repressing others, highlighting the role of epigenetic mechanisms in precisely regulating gene expression.
Discussion
The latest advances in spatial omics4,7,41, a rapidly evolving field, has enabled the investigation of complex biological systems with high-throughput quantifications of gene expression and epigenetic regulation within tissue context. However, gene and protein expression are regulated by different omics layers, such as DNA methylation42, chromatin remodeling43, histone modifications44, and genome architecture45. Despite recent single-cell technologies in trimodal measurements of RNA+ATAC+proteins46,47, H3K27me3+H3K27ac+protein12, or ATAC+H3K27me3+H3K27ac9, current spatial methods are limited to map two modalities at a time (such as ATAC+RNA4,5, CUT&Tag+RNA4, or protein+RNA6–8).
We developed spatial-Mux-seq that overcomes existing limitations in spatial multi-omics by simultaneously profiling multiple histone modifications, chromatin accessibility, gene expression, and cell surface protein markers within the same tissue sections. To validate its performance, we rigorously benchmarked spatial-Mux-seq against existing methods4,11, evaluating key metrics such as unique fragment counts, gene features, and UMIs. The results demonstrate that spatial-Mux-seq matches the performance of these techniques, confirming its capability to simultaneously profile multiple omics layers—histone modifications, chromatin accessibility, transcriptome, and proteins—without compromising the data quality from individual modality. To demonstrate the versatility of spatial-Mux-seq, we conducted four key tests: (1) Histone modification co-profiling: We validated spatial-Mux-seq by co-profiling two mutually exclusive histone marks, H3K27me3 and H3K27ac, confirming its accuracy in capturing distinct epigenetic landscapes. (2) Simultaneous profiling of four modalities: We profiled H3K27me3, H3K4me3, transcriptome, and chromatin accessibility, allowing us to study gene regulation during neural development. (3) Integration of protein profiling: We included surface proteins alongside mRNA and histone modifications, enabling comprehensive characterization of the epigenome, transcriptome, and proteome. (4) Comprehensive five-modality profiling: We simultaneously measured chromatin accessibility, two histone modifications (H3K27me3, H3K27ac), mRNA, and 122 surface proteins, providing deeper insights into cellular states and tissue biology.
Despite these advancements, spatial-Mux-seq is limited to co-profiling two histone modifications at a time, due to restricted nanobody-Tn5 availability12. Future improvements could overcome this limitation by developing additional nanobody-Tn5s from different species or by pre-conjugating primary antibodies with nanobody-Tn5s. Our study focuses on three critical histone marks: H3K27me3 (gene silencing), H3K4me3 (active promoters), and H3K27ac (active enhancers or promoters). While these marks are extensively used in epigenetic research for their significance in chromatin states and gene regulation, the exclusion of other histone marks may limit the scope of our conclusions. However, the selection was driven by antibody availability, reflecting technical constraints rather than a deliberate omission of other significant marks.
In conclusion, spatial-Mux-seq represents a significant advancement in spatial omics, offering a powerful tool for simultaneously assessing multiple regulatory layers within tissue context. By providing a more comprehensive understanding of complex biological systems and their underlying regulatory mechanisms, spatial-Mux-seq holds great promise for advancing our knowledge in fields such as developmental biology, disease research, and tissue engineering.
Methods
Preparation of tissue slides
Mouse C57 embryo sagittal frozen sections (MF-104–13-C57) were purchased from Zyagen. Juvenile mouse brain tissue (P21) was obtained from the C57BL/6 mice housed in the University of Pennsylvania Animal Care Facilities under pathogens-free conditions. All mice were maintained in 12 h light/12 h dark cycle at room temperatures ranging between 20–25 °C and humidities between 40–60%. All procedures used were pre-approved by the Institutional Animal Care and Use Committee. Juvenile (P21) and adult mice (5 months) were sacrificed by CO2, and brain was harvested and embedded in Tissue-Tek® O.C.T. compound (Sakura) and snap frozen using a mixture of dry ice and methylbutanol. 7–10 μm tissue sections were cut and collected on poly-L-lysine coated glass slides. The samples were stored at −80 °C.
Microfluidic device fabrication and assembly
Polydimethylsiloxane microfluidic molds were fabricated using standard photolithography. SU-8 photoresist (nos. SU-2025 and SU-2010, Microchem) was spin-coated onto silicon wafers (no. C04004, WaferPro) per the manufacturer’s guidelines, with feature heights of ~20 and 50 μm. The PDMS mixture (1:10 ratio of curing and base agents) was poured onto the molds, degassed for 30 min, and cured at 70°C for 2 hours. The fabrication and preparation of the PDMS device follow the published protocol48.
Nanobody-Tn5 production and preparation of the Tn5 transposome
Nanobody-Tn5 was purified and loaded with barcoded oligos following published protocols9. Unloaded Tn5 was purchased from Diagenode, and the transposome was assembled with Tn5MErev and Tn5ME-A or Tn5ME-B5/6/7 oligos. The oligo sequences used for transposome assembly were as follows:
Tn5MErev: 5′-/Phos/CTGTCTCTTATACACATCT-3′
Tn5ME-A: 5′-TCGTCGGCAGCGTCAGATGTGTATAAGAGACAG-3′
Tn5ME-B5 (wildtype Tn5): 5′-/Phos/CATCGGCGTACGACTTAGCCTAGATGTGTATAAGAGACAG-3′
Tn5ME-B6 (Mouse-nano-Tn5): 5’-/Phos/CATCGGCGTACGACTATAGAGAGATGTGTATAAGAGACAG-3′
Tn5ME-B7 (Rabbit-nano-Tn5): 5’-/Phos/CATCGGCGTACGACTCCTATCAGATGTGTATAAGAGACAG-3′
DNA oligos, DNA barcode sequences and other key reagents
DNA oligos used for library construction and PCR (Supplementary Table 4), DNA barcode sequences (A1–100, B1–100) (Supplementary Table 5 and 6) and all other key reagents (Supplementary Table 7) are provided.
Antibodies
Antibodies used are H3K27me3 (1:50, Abcam, ab6002), H3K27ac (1:50, cell signaling technology, 8173), H3K4me3 (1:50, cell signaling technology, 9751), and cell surface antibodies including CD3 (A0182), CD4 (A0001), CD34 (A0857), CD140a (A0573), CD133 (A1037), CD90.1 (A0380), CD90.2 (A0075), B220 (A0103), and mouse antibody cocktail (199901) are purchased from Biolegend (1:400 dilution).
Spatial co-profiling of ATAC, histone modifications, proteins, and RNA
Frozen tissue slides were first thawed for 1 min at 37 °C. Tissue was fixed with 0.2% formaldehyde for 5 min and quenched with 1.25 M glycine. Following fixation, tissue was washed DPBS and cleaned with ddH2O. RNase inhibitor was included in all RNA profiling experiments.
ATAC-seq: Tissue sections were permeabilized with lysis buffer (3 mM MgCl2, 0.01% Tween-20, 10 mM Tris-HCl pH 7.4, 0.01% NP40, 10 mM NaCl, 1% BSA, 0.001% digitonin) for 15 min and incubated with wash buffer (10 mM Tris-HCl pH 7.4, 10 mM NaCl, 3 mM MgCl2, 1% BSA, 0.1% Tween-20) for 5 min. Transposition mix (5 μl of Tn5 transposome, 33 μl of 1× DPBS, 50 μl of 2× Tagmentation buffer, 1 μl of 1% digitonin, 1 μl of 10% Tween-20, 10 μl of ddH2O) was added and incubated at 37 °C for 30 min. Transposition was stopped by adding EDTA.
Nanobody-based CUT&Tag: Tissue was washed with wash buffer (150 mM NaCl, 20 mM HEPES pH 7.5, one tablet of protease inhibitor cocktail, 0.5 mM Spermidine), followed by NP40-digitonin wash buffer (0.01% digitonin, 0.01% NP40 in wash buffer) for 5 min. The primary antibody (1:50 dilution with antibody buffer (0.001% BSA, 2 mM EDTA in NP40-digitonin wash buffer) was added and incubated at 4 °C overnight. A 1:100 dilution of nano-Tn5 adaptor complex mixture (rabbit-nano-Tn5/mouse-nano-Tn5) in 300-wash buffer (one tablet of Protease inhibitor cocktail, 300 mM NaCl, 0.5 mM Spermidine, 20 mM HEPES pH 7.5) was added and incubated at room temperature for 1 h, followed by a 5 min wash with 300-wash buffer. Tagmentation buffer (10 mM MgCl2 in 300-wash buffer) was added and incubated at 37 °C for 1 h. Transposition was stopped by adding EDTA.
Staining with cell surface markers: Tissue was washed with cell staining buffer and blocked with 1:20 mouse TruStain FcX™ in Cell Staining Buffer at 4°C for 15 min. Cell surface proteins are then detected with oligonucleotide-labeled Antibody-Derived Tags (ADT) diluted in Cell Staining Buffer (1:400) at 4°C for 15 min, followed by a 5 min wash with Cell Staining Buffer. A 1:25 dilution of Fab Fragment (goat anti-mouse IgG) in Cell Staining Buffer was added and incubated at 4°C for 15 min.
In situ reverse transcription: Tissue was re-fixed with 2% formaldehyde for 10 min and quenched with glycine for 5 min. The tissue was permeabilized with 0.5% Triton X-100 for 20 min. The tissue was then washed twice with 0.5× DPBS for 5 min. The reverse transcription reaction mix (12.5 μl of 5× RT buffer, 4.5 μl of ddH2O, 0.4 μl of Enzymatic RNase inhibitor, 3.1 μl of 10 mM dNTP, 6.2 μl of Maxima H Minus Reverse Transcriptase, 25 μl of 0.5× PBS and 10 μl of RT primer (100 μM)) was applied, incubated for 30 min at room temperature, then at 42°C for 90 min. After the RT reaction, tissues were washed with 1× NEBuffer 3.1 for 5 min.
Ligation of barcode A: : Barcode A was pre-annealed with ligation linker 1: 10 μl of 100 μM ligation linker, 10 μl of 100 μM individual barcode An oligo and 20 μl of 2× annealing buffer (20 mM Tris pH 7.5, 100 mM NaCl, 2 mM EDTA) was mixed and reacted for annealing (95 °C for 5 min and cycling from 95 °C to 12 °C, 0.01 °C per cycle). For the first barcode (barcode A) in situ ligation, the PDMS chip A was covered to the region of interest (ROI). For alignment purposes, a 10× objective lens (BZ-X800 Series, Keyence) was used to take a brightfield image. The PDMS device and tissue slide were clamped tightly with a homemade acrylic clamp. For each channel, 5 μl of ligation master mix containing individual barcode was loaded, it was prepared by mixing 2 μl of ligation mixture (27 μl of T4 DNA ligase buffer, 72.4 μl of ddH2O, 5.4 μl of 5% Triton X-100, 11 μl of T4 DNA ligase), 2 μl of 1× NEBuffer 3.1 and 1 μl of each annealed DNA barcode An (25 μM). Vacuum was used to load the ligation master mix into 50 channels of the device, followed by incubation at 37 °C for 30 min in a wet box. The PDMS chip and clamp were removed after incubation and washed with 1× NEBuffer 3.1 for 5 min. Then the slide was washed with water and dried with compressed air.
Ligation of barcode B: Barcode B was pre-annealed with ligation linker 2: 10 μl of 100 μM ligation linker, 10 μl of 100 μM individual barcode Bn oligo and 20 μl of 2× annealing buffer (20 mM Tris pH 7.5, 100 mM NaCl, 2 mM EDTA) was mixed and reacted for annealing (95 °C for 5 min and cycling from 95 °C to 12 °C, 0.01 °C per cycle). For the second barcode (barcode B) in situ ligation, the PDMS chip B was covered to the ROI and a further brightfield image was taken with the 10× objective lens. An acrylic clamp was applied to clamp the PDMS, and the tissue slide together. Annealing of barcodes Bn (25 μM) and preparation of the ligation master mix were carried out as for barcodes A. The tissue was then incubated at 37 °C for 30 min in a wet box. After incubation, the PDMS chip and clamp were removed, and tissue was washed with 1× for 5 min. The slide was then washed with water and dried with compressed air. A brightfield image covering each barcoding axis was then taken for further alignment.
Reverse crosslink: Lastly, the ROI on the tissue was digested with 100 μl of reverse crosslinking mixture (0.4 mg ml−1 proteinase K, 1 mM EDTA, 50 mM Tris-HCl pH 8.0, 200 mM NaCl, 1% SDS) at 58 °C for 2 h. The lysate was then collected in a PCR tube and incubated at 60 °C overnight.
gDNA and cDNA separation: For gDNA and cDNA separation, the lysate was purified with Zymo DNA Clean & Concentrator-5 column and eluted with 100 μl of ddH2O. 1× B&W buffer with 0.05% Tween-20 was used to wash 40 μl of Dynabeads™ MyOne™ Streptavidin C1 beads three times. Then, 100 μl of 2× B&W buffer with 2.5 μl of SUPERase•In™ inhibitor was used to resuspend the beads, which were mixed with the eluted DNA/cDNA mixture and allowed to bind the Biotinylated cDNA fragments at room temperature for 1 h with agitation.
-
Library construction: A magnetic rack was used to separate beads (containing cDNA/ADT) and supernatant (containing gDNA) in the eluent. The supernatant was collected and purified with with Zymo DNA Clean & Concentrator-5 and eluted with 20 μl of ddH2O for ATAC/nano-CUT&Tag library construction. 30ul of PCR mixture (25 μl of 2× NEBNext Master Mix, 2.5 μl of 10 μM indexed N7XX primer, 2.5 μl of 10 μM N501 PCR primer) was added to elute the gDNA. PCR reaction was first performed with the following program: 58 °C for 5 min, 72 °C for 5 min, 98 °C for 30 s and then cycling at 98 °C for 10 s, 60 °C for 30 s, 13 times. The final PCR product was purified by 1.3x SPRI beads (65 μl) and eluted in 20 μl of ddH2O.
The separated beads were used for cDNA/ADT library construction. They were first washed twice with 1× B&W buffer with 0.05% Tween-20 and once with 10 mM Tris pH 8.0 containing 0.1% Tween-20. The separated beads were washed with ddH2O. Streptavidin beads with bound cDNA/ADT molecules were resuspended in TSO solution (22 μl of 10 mM dNTP, 44 μl of 5× Maxima RT buffer, 44 μl of 20% Ficoll PM-400 solution, 88 μl of ddH2O, 5.5 μl of 100 uM template switch primer, 11 μl of Maxima H Minus Reverse Transcriptase, 5.5 μl of Enzymatic RNase Inhibitor) and were incubated at room temperature for 30 min and then at 42 °C for 90 min, with gentle shaking. After incubation, beads were washed once with 10 mM Tris and 0.1% Tween-20 and then with ddH2O. Washed beads were resuspended in PCR solution (110 μl of 2× Kapa HiFi HotStart Master Mix, 8.8 μl of 10 μM PCR primer 1 and primer 2, 0.3 μl of 10 μM primer 3 (cite-seq), 92.4 μl of ddH2O), then aliquoted 50ul beads mixture per PCR tube, and run on PCR thermocycling with the following program: 95 °C for 3 min and cycling at 98 °C for 20 s, 65 °C for 45 s and 72 °C for 3 min, 5 cycles. After the PCR reaction, beads were removed from the PCR product. 1× SYBR Green was added to the PCR product and run the following qPCR conditions: 95 °C for 3 min, cycling at 98 °C for 20 s, 65 °C for 20 s and 72 °C for 3 min, 15 times, followed by 5 min at 72 °C. The reaction was stopped once the qPCR curve signal began to plateau. The PCR product was then purified with 0.6xSPRI beads. The supernatant was saved for protein library and the separated SPRI beads were eluted in 20 μl of ddH2O for RNA library construction. The RNA library was performed according to the manufacturer’s guidenlines in the Nextera XT DNA Library Prep Kit.
For protein library, the saved supernatant was purified with 1.4x SPRI beads and eluted in 20 μl of ddH2O. The eluted sample was repurified with 2.0x SPRI beads and finally eluted in 45 μl of ddH2O. PCR master solution (50 μl of 2× Kapa HiFi HotStart Master Mix, 2.5 μl of 10 μM P5 oligo (cite-seq), 2.5 μl of 10 μM indexed N7XX primer) was added to the eluted sample and performed the PCR reaction with the following program: 95 °C for 3 min, cycling at 95 °C for 20 s, 60 °C for 30 s, 72 °C for 20 s and 72 °C for 5 min, for 6 cycles. The PCR product was purified with 1.6xSPRI beads to obtain the protein library.
Library QC and sequencing: The Agilent D5000 Screentape was used to determine the size distribution and concentration of the library before sequencing. NGS was conducted on an Illumina NovaSeq 6000/NovaSeq X Plus sequencer (paired-end, 150-base-pair mode).
A detailed step by step protocol for spatial-Mux-seq is available on protocols.io: (https://www.protocols.io/private/1EB1CC1B65A811EF8B450A58A9FEAC02).
Data preprocessing
For ATAC/CUT&Tag data, linkers 1 and 2 are used for targeted filtering, with alignment via BWA followed by sorting and indexing using Samtools. This process assigned genome sequences to the first read and incorporated barcodes A and B into the second read. The fastq files were aligned to mouse (GRCm38) reference genomes, producing fragment files enriched with spatial and genomic information through barcode pairs integration. ArchR v.1.0.249 was used to generate ArchRProject for downstream analysis. Peaks were called with pseudo-bulk bam files using MACS2 with parameters ‘--keep-dup=1 --llocal 100000 --min-length 1000 --max-gap 1000 --broad-cutoff=0.1’.
For RNA-seq data, read 2 was refined to extract barcode A/B, and UMI. The Spatial Transcriptomics pipeline (v1.7.2) mapped data to the mouse (GRCm38) genome references producing a gene matrix that captured both gene expression and spatial data. The gene matrix was then read into Seurat v.4.3.013 as a Seurat object.
For cDNAs from ADTs, the fastq file of Read 2 was reformatted in the same way as cDNAs from RNA. CITE-seq-Count 1.4.250 was used to count ADT UMIs per antibody, generating a protein expression matrix containing the spatial locations and protein expression levels.
Data clustering and visualization
Firstly, we identified the location of pixels on tissue from the brightfield image captured by Keyence fluorescence microscope BZ-X800, and then generated with a custom Python script (https://github.com/liranmao/Spatial_multi_omics).
For ATAC and CUT&Tag data, based on the ArchRProject, the normalization and dimension reduction were conducted using LSI and UMAP. Then we used the getGeneScore from ArchR package to get the GAS and the CSS scores. For spatial data visualization, to facilitate the mapping of data onto the original tissue, the gene score matrix derived from ArchR was imported into Seurat as a Seurat object. Then we plotted the spatial maps using SpatialPlot. The size of the pixels was adjusted for visualization by modifying the ‘pt.size.factor’ parameter within the Seurat package.
For RNA data, based on the Seurat object, we used the SCTransform function for the data normalization and variance stabilization. Then the dimensionality reduction was done by RunPCA. We then constructed the nearest neighbor graph on the first 30 PCs by the function FindNeighbors. The clusters were identified with appropriate resolutions. Ultimately, we computed a UMAP embedding leveraging the initial 30 principal components using RunUMAP. And SpatialPlot was used for spatial plot visualization.
Protein data were normalized using the centered log ratio (CLR) transformation method in Seurat v.4.3.0. All heat maps were plotted using ggplot2. And SpatialPlot was used for spatial plot visualization, which is the same as ATAC and CUT&Tag data.
Multi-omics integration
For our multi-omics data integration, we consolidated ATAC, CUT&Tag, and RNA datasets into a single Seurat object. The ATAC and CUT&Tag data integration utilized a peak matrix with 501-bp fixed-width peaks from the 1-bp summits generated by addReproduciblePeakSet from ArchR, applying Macs2 for peak calling. RNA data integration was based on a log-normalized gene expression matrix. We applied Weighted Nearest Neighbors (WNN) analysis with FindMultiModalNeighbors for clustering, utilizing UMAP and spatial mapping for visualization. Subsequently, cell type clusters were refined through FindSubCluster within Seurat, based on the wsnn graph. This streamlined approach facilitated a precise analysis of cellular heterogeneity within the multi-omics dataset. The detailed joint analysis of the data from Fig. 1 is available on GitHub (https://github.com/liranmao/Spatial_multi_omics/blob/main/Data_visualization/Fig1_joint_analysis.Rmd) and Figshare (DOI: 10.6084/m9.figshare.27265410).
Integrative data analysis and cell type identification
To delineate cell identities within each pixel, we employed the addGeneIntegrationMatrix function from ArchR, integrating chromatin accessibility or histone modification data with transcription data. To get a higher resolution cell type inference inside one pixel, we used robust cell type decomposition (RCTD)37 to decompose cell-type mixtures by leveraging cell type profiles learned from single-cell RNA-seq.
Downstream analysis
For assessing the correlation of CSS/GAS and gene expression, we performed the analysis for certain identified cell type clusters, dentate gyrus specifically. Marker genes from the RNA dataset were identified using the FindMarkers function, applying the Wilcoxon rank sum test with a log2 fold change threshold of 0.10. We further filtered the RNA markers based on an adjusted P-value threshold of 0.01. Similarly, for chromatin features, including gene activity score (GAS), and chromatin silencing score (CSS), we employed the FindMarkers function with identical parameters to determine the marker genes. Gene Ontology (GO) analysis was conducted using enrichGO function from R package clusterProfiler v.4.8.351.
Chromatin dynamics analysis
Pseudo-time analysis on RNA was performed using Slingshot v.2.2.1. The trajectory analysis on ATAC was conducted employing addTrajectory function from ArchR. For chromatin bivalency analysis, we considered genes exhibiting high levels of both H3K4me3 and H3K27me3 as bivalent. For a certain gene, the H3K4me3 and H3K27me3 signal of each pixel was calculated by getGeneScore function from ArchR package, identifying the subset of signals that were within the gene window weighted by distance. The bivalency score was calculated according to a previously published method34.
Gene regulation analysis
We used FigR v.0.1.029 to infer the transcriptional regulation by integrating ATAC and RNA data. The runGenePeakcorr function facilitated peak-gene association testing. Domains of regulatory chromatin (DORCs) were defined as genes with a relatively high number of significant peak-gene associations (n>=5). DORC accessibility scores were obtained using the getDORCScores function. To pinpoint potential transcription factors (TFs) regulating DORCs, the runFigGRN function was employed to identify TF binding motifs enriched within specific DORCs, indicating their potential role in driving DORC regulation.
Extended Data
Extended Data Fig. 1 |. Workflow of spatial-Mux-seq.
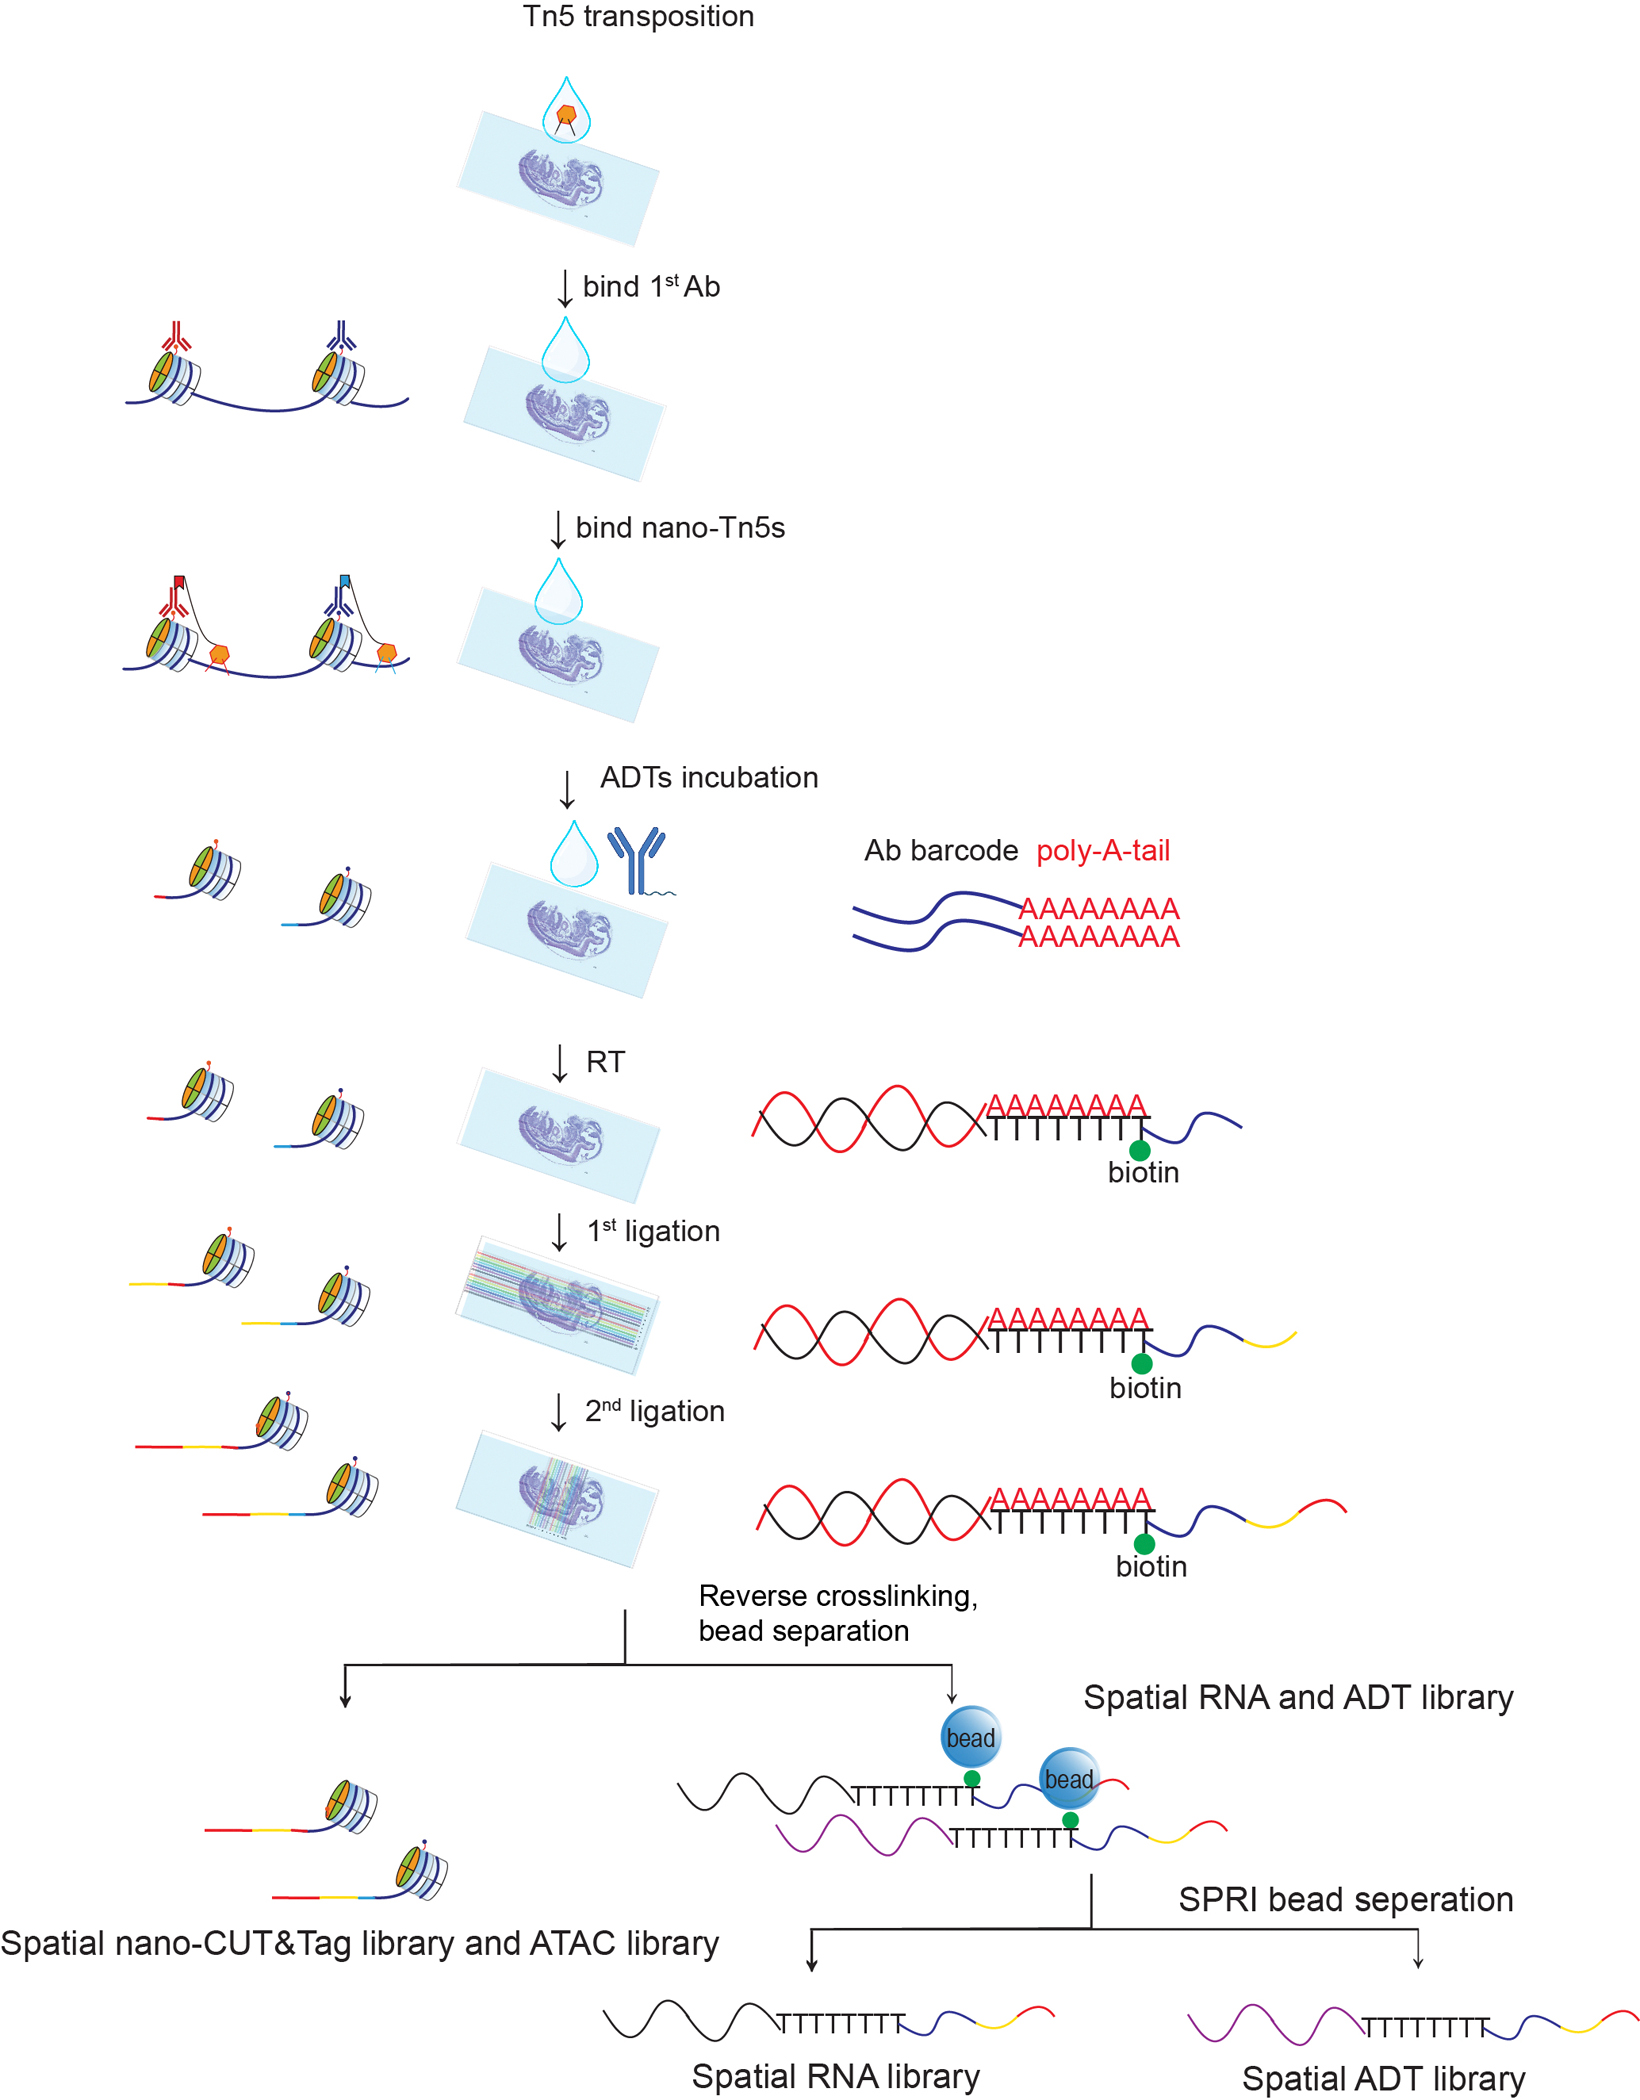
Schematic workflow for spatial co-profiling of ATAC, two histone modifications, transcriptomes, and cell surface proteins: A tissue section was first incubated with wildtype Tn5. Two primary antibodies against different histone marks were then added, followed by incubation with two secondary nanobody-Tn5s. Next, a panel of ADTs is used to label cell surface proteins. In situ reverse transcription was then performed, followed by two rounds of DNA barcoding to create a mosaic of tissue pixels. Finally, gDNA and cDNA were collected and separated, and library construction was completed with PCR amplification.
Extended Data Fig. 2 |. Reproducibility of Spatial-Mux-seq.

Spatial-Mux-seq profiling of a mouse embryo tissue section (sample: E13_50_μm_2). a, Scatterplots showing TSS enrichment score versus unique nuclear fragments per pixel. b, Unique fragment counts in spatial-Mux-seq epigenome mapping of sample E13_μm_2 (50 μm pixel size: H3K27me3 and H3K27ac). c, Unsupervised clustering analysis is performed, revealing the spatial distribution of clusters corresponding to H3K27me3 and H3K27ac mark. d, Reproducibility between two biological replicates (samples E13_μm_1 and E13_μm_2) is shown, comparing the data for H3K27me3 and H3K27ac histone modifications. e, Venn diagram shows the overlap of peaks from two different spatial-Mux-seq experiments (co-profiled H3K27me3/H3K27ac). f, Distribution of insert size for histone modification fragments in the spatial-Mux-seq datasets.
Extended Data Fig. 3 |. Spatial-Mux-seq (co-profiled H3K27me3/H3K27ac) mapping of marker genes in E13 mouse embryos.

The spatial mapping (top) and genome browser tracks (bottom) illustrate gene silencing marked by H3K27me3, and gene activity marked by H3K27ac modifications. Two marker genes are highlighted: Nprl3 (a), representing gene silencing through H3K27me3, and Sox2 (b), showcasing gene activity associated with H3K27ac modification. Nprl3 and Sox2 genes were shown as a gray box.
Extended Data Fig. 4 |. Spatial-Mux-seq (co-profiled H3K27me3/H3K27ac) mapping of marker genes in E13 mouse embryo.

a, Spatial mapping of excitatory neurons identified through label transferring, overlaid on a tissue section. Neuronal clusters are visualized with distinct patterns, emphasizing their spatial distribution within the embryo. b, Correlation of H3K27ac GAS and scRNA-seq data14 in the cluster of excitatory neurons, highlighting the transcriptional activity associated with these regions. c, Correlation of H3K27me3 CSS and scRNA-seq data14 in the cluster of excitatory neurons, emphasizing the gene silencing characteristics of these neurons. d, Heatmaps showing spatial mapping of marker genes associated with H3K27me3 and H3K27ac modifications, with variations in color intensity indicating differential expression and histone modification patterns across the embryo tissue.
Extended Data Fig. 5 |. Spatial-Mux-seq (co-profiled H3K4me3/H3K27me3/ATAC/RNA) mapping of E13 mouse embryos.

a, Spatial ATAC data and H3K4me3 data were integrated with scRNA-seq14 from mouse embryo (E13.5). Unsupervised clustering of the combined data was colored by different cell types. b, Spatial mapping of selected cell types identified by label transferring from scRNA-seq to spatial H3K4me3 data or spatial ATAC data. c, Spatial mapping of Ank3 and Gria2 genes with RNA, ATAC, H3K4me3, and H3K27me3 modalities. d-e, Scatter plot showing scaled values of Ank3 and Gria2 ATAC, H3K4me3, and H3K27me3 score across pseudotime from radial glia to differentiated neurons. f-g, GO enrichment analysis for genes from radial glia (f) to differentiated neurons (g). The P adj value indicates the Benjamini–Hochberg adjusted P value obtained from the one-tailed Fisher’s exact test. The top ten significant GO terms for each category are displayed.
Extended Data Fig. 6 |. Spatial co-profiling of protein, RNA, H3K4me3, and H3K27me3 in mouse embryos.

a, Spatial RNA data were integrated with scRNA-seq14 from E13.5 mouse embryos. This integration enabled the spatial mapping of specific cell types, including osteoblasts, sensory neurons, and epithelial cells within the embryonic tissue. The spatial patterns of marker genes of each cell type are performed with RNA modality. The red square highlights the region captured for spatial analysis. b, Spatial mapping of selected genes with RNA, H3K4me3, H3K27me3 and bivalency score. Scale bar: 500 μm.
Extended Data Fig. 7 |. Spatial co-profiling of RNA, H3K27ac, and H3K27me3 in mouse juvenile brain.

a, Spatial mapping of selected genes with RNA, H3K27ac, and H3K27me3 modalities. b, Unsupervised clustering analysis and spatial distribution of each modality with different resolution from Fig. 4a: H3K27me3 (Resolution: 3), H3K27ac (Resolution: 3), and RNA (Resolution: 5). c, Genome browser tracks of Prox1 gene in clusters DG-sg and DG-sgz. The selected TSS region of Prox1 was shown as a light blue box. d-e, Pearson correlation between Prox1 expression and histone mark H3K27me3 (d) or H3K27ac (e) gene scores. The gene scores are derived based on the gene model surrounding the transcription start site (TSS). Arrows indicate the high expression region of marker genes.
Extended Data Fig. 8 |. Quality control metrics for spatial-Mux-seq datasets.

Sample: 5M_20_μm. a, Spatial-Mux-seq profiling of ATAC, H3K27me3, H3K27ac, RNA, and proteins from EAE mouse brain section. Left: tissue scanning of the region of interest, aligned with the region annotation of a corresponding section from Allen Mouse Brain Atlas (P56). Middle and right: 20-μm-microfluidic device with 100×100 pixels. Two-time spatial barcodes (A1–100 and B1–100) were sequentially flowed over tissue section. The red square highlights the region captured for spatial analysis. b, Unique fragments, gene feature counts, and protein counts in spatial-Mux-seq mapping of five months mouse brain obtained with 20-μm pixel size. c, Scatterplots showing the TSS enrichment score vs unique nuclear fragments per pixel for three modalities: ATAC, H3K27me3 and H3K27ac. d, Violin plots of unique fragments and TSS enrichment values of ATAC, H3K27ac, and H3K27me3. e, Violin plots of gene counts and gene UMIs distribution. f, Violin plots of protein counts and protein UMIs distribution. d-f, Number of pixels in 5M_20_μm, 9,688. Box plots show the median (center line), the first and third quartiles (box limits) and 1.5x interquartile range (whiskers). Scale bar: 500 μm.
Extended Data Fig. 9 |. Spatial co-profiling of proteins, mRNA, H3K27me3, and H3K27ac in a EAE mouse brain.

Sample: 5M_20_μm. a, Spatial distribution and UMAP embeddings of unsupervised clustering analysis of ATAC (An), H3K27me3 (Bn), H3K27ac (Cn), RNA (Rn), and proteins (Pn) with five months old EAE mouse brain sample (20 μm pixel size). b, Spatial ATAC, H3K27ac, and RNA data were integrated with scRNA-seq36 from mouse brain. c, Spatial mapping of cell types identified by label transfer from scRNA-seq to ATAC (top), H3K27ac (middle), and RNA (bottom). MSN: medium spiny neurons. MOL: mature oligodendrocytes 2. TEGLU: Telencephalic Glutamatergic Neurons.
Extended Data Fig. 10 |. Spatial co-profiling of ATAC, H3K27me3, H3K27ac, protein, and RNA of selected genes for 5M-old mouse brain.

a, Spatial mapping marker genes: Cd63, Cd140a, Cd133, and Jaml by all five modalities: ATAC, H3K27me3, H3K27ac, protein, and RNA. b, Genome browser tracks of Cd140a (Pdgfra) gene expression and H3K27me3 signal in corpus callosum defined by spatial H3K27me3 data (cluster B8 from Extended Data Fig.18a). The selected TSS and 3’ coding regions of Cd140a longest isoforms were labeled with yellow and blue boxes respectively.
Supplementary Material
Acknowledgments
We acknowledge support from the Packard Fellowship for Science and Engineering (to Y.D.), John Q. Trojanowski Research Scholar Award from the Penn Institute on Aging (to Y.D.) and the US National Institutes of Health (grant numbers DP2AI177913 and R01AG085344 to Y.D.). Work in M.B.’s laboratory was supported by Swedish Research Council (grant no. 2021-01476), Swedish Foundation’s Starting Grant by Olle Engkvist Stiftelse (grant no. 226-0130), Cancerfonden Junior Investigator Award (grant no. 23 0758 JIA), Jaensson’s Stiftelse, Carl Tryggers Stiftelse (grant no. CTS22:2079) and Hjärnfonden. The data analysis was enabled by resources provided by the National Academic Infrastructure for Supercomputing in Sweden (NAISS), partially funded by the Swedish Research Council through grant agreement no. 2022-06725. We would like to thank T. Nyman, E. Strandback, H. Ampah-Korsah and the Karolinska Institute Protein Science facility for the nanobody-Tn5 constructs and the protein purification.
Footnotes
Competing interests
Y.D. and P.G. are inventors of a patent application related to this work. Y.D. is the scientific advisor of AtlasXomics Inc. M.L. receives research funding from Biogen Inc. unrelated to the current manuscript and is a co-founder of OmicPath AI LLC. The other authors declare no competing interests.
Code availability
The whole analysis pipeline and instructions for reproduction are available on GitHub (https://github.com/liranmao/Spatial_multi_omics) and archived at Zenodo (https://zenodo.org/records/13964086).
Data availability
Raw and processed data reported in this study are deposited in the Gene Expression Omnibus (GEO) with accession code GSE263333. Resulting fastq files were aligned to the mouse reference genome (GRCm38). Published data for data quality comparison and integrative data analysis include: mouse reference genome GRCm38: Mus musculus genome assembly GRCm38 - NCBI - NLM (nih.gov); mouse organogenesis cell atlas (MOCA): https://oncoscape.v3.sttrcancer.org/atlas.gs.washington.edu.mouse.rna/downloads; mouse embryo H3K27me3 and H3K27ac chip-seq (E13.5): https://www.encodeproject.org/; mouse brain cell atlas: http://mousebrain.org/adolescent/downloads.html; Allen Developing Mouse Brain Atlas: https://developingmouse.brain-map.org/; spatial-CUT&Tag data: GSE165217; spatial-ATAC-RNA-seq data: GSE205055.
References
- 1.Vandereyken K, Sifrim A, Thienpont B & Voet T Methods and applications for single-cell and spatial multi-omics. Nature Reviews Genetics 24, 494–515 (2023). 10.1038/s41576-023-00580-2 [DOI] [PMC free article] [PubMed] [Google Scholar]
- 2.Deng Y, Bai Z & Fan R Microtechnologies for single-cell and spatial multi-omics. Nature Reviews Bioengineering 1, 769–784 (2023). 10.1038/s44222-023-00084-y [DOI] [Google Scholar]
- 3.Baysoy A, Bai Z, Satija R & Fan R The technological landscape and applications of single-cell multi-omics. Nature Reviews Molecular Cell Biology 24, 695–713 (2023). 10.1038/s41580-023-00615-w [DOI] [PMC free article] [PubMed] [Google Scholar]
- 4.Zhang D et al. Spatial epigenome-transcriptome co-profiling of mammalian tissues. Nature 616, 113–122 (2023). 10.1038/s41586-023-05795-1 [DOI] [PMC free article] [PubMed] [Google Scholar]
- 5.Jiang F et al. Simultaneous profiling of spatial gene expression and chromatin accessibility during mouse brain development. Nat Methods 20, 1048–1057 (2023). 10.1038/s41592-023-01884-1 [DOI] [PubMed] [Google Scholar]
- 6.Ben-Chetrit N et al. Integration of whole transcriptome spatial profiling with protein markers. Nature Biotechnology 41, 788–793 (2023). 10.1038/s41587-022-01536-3 [DOI] [PMC free article] [PubMed] [Google Scholar]
- 7.Liu Y et al. High-Spatial-Resolution Multi-Omics Sequencing via Deterministic Barcoding in Tissue. Cell 183, 1665–1681.e1618 (2020). 10.1016/j.cell.2020.10.026 [DOI] [PMC free article] [PubMed] [Google Scholar]
- 8.Liu Y et al. High-plex protein and whole transcriptome co-mapping at cellular resolution with spatial CITE-seq. Nat Biotechnol 41, 1405–1409 (2023). 10.1038/s41587-023-01676-0 [DOI] [PMC free article] [PubMed] [Google Scholar]
- 9.Bartosovic M & Castelo-Branco G Multimodal chromatin profiling using nanobody-based single-cell CUT&Tag. Nat Biotechnol 41, 794–805 (2023). 10.1038/s41587-022-01535-4 [DOI] [PMC free article] [PubMed] [Google Scholar]
- 10.Deng Y et al. Spatial profiling of chromatin accessibility in mouse and human tissues. Nature 609, 375–383 (2022). 10.1038/s41586-022-05094-1 [DOI] [PMC free article] [PubMed] [Google Scholar]
- 11.Deng Y et al. Spatial-CUT&Tag: spatially resolved chromatin modification profiling at the cellular level. Science 375, 681–686 (2022). [DOI] [PMC free article] [PubMed] [Google Scholar]
- 12.Stuart T et al. Nanobody-tethered transposition enables multifactorial chromatin profiling at single-cell resolution. Nat Biotechnol 41, 806–812 (2023). 10.1038/s41587-022-01588-5 [DOI] [PMC free article] [PubMed] [Google Scholar]
- 13.Hao Y et al. Integrated analysis of multimodal single-cell data. Cell 184, 3573–3587.e3529 (2021). 10.1016/j.cell.2021.04.048 [DOI] [PMC free article] [PubMed] [Google Scholar]
- 14.Cao J et al. The single-cell transcriptional landscape of mammalian organogenesis. Nature 566, 496–502 (2019). 10.1038/s41586-019-0969-x [DOI] [PMC free article] [PubMed] [Google Scholar]
- 15.Wu SJ et al. Single-cell CUT&Tag analysis of chromatin modifications in differentiation and tumor progression. Nat Biotechnol 39, 819–824 (2021). 10.1038/s41587-021-00865-z [DOI] [PMC free article] [PubMed] [Google Scholar]
- 16.Charité J et al. Role of Dlx6 in regulation of an endothelin-1-dependent, dHAND branchial arch enhancer. Genes Dev 15, 3039–3049 (2001). 10.1101/gad.931701 [DOI] [PMC free article] [PubMed] [Google Scholar]
- 17.Anderson KM et al. Transcription of the non-coding RNA upperhand controls Hand2 expression and heart development. Nature 539, 433–436 (2016). 10.1038/nature20128 [DOI] [PMC free article] [PubMed] [Google Scholar]
- 18.Saleque S, Cameron S & Orkin SH The zinc-finger proto-oncogene Gfi-1b is essential for development of the erythroid and megakaryocytic lineages. Genes Dev 16, 301–306 (2002). 10.1101/gad.959102 [DOI] [PMC free article] [PubMed] [Google Scholar]
- 19.Kowalczyk MS et al. Nprl3 is required for normal development of the cardiovascular system. Mamm Genome 23, 404–415 (2012). 10.1007/s00335-012-9398-y [DOI] [PubMed] [Google Scholar]
- 20.Kowalczyk MS et al. Intragenic enhancers act as alternative promoters. Mol Cell 45, 447–458 (2012). 10.1016/j.molcel.2011.12.021 [DOI] [PubMed] [Google Scholar]
- 21.Graham V, Khudyakov J, Ellis P & Pevny L SOX2 functions to maintain neural progenitor identity. Neuron 39, 749–765 (2003). 10.1016/s0896-6273(03)00497-5 [DOI] [PubMed] [Google Scholar]
- 22.Cao J et al. Joint profiling of chromatin accessibility and gene expression in thousands of single cells. Science 361, 1380–1385 (2018). 10.1126/science.aau0730 [DOI] [PMC free article] [PubMed] [Google Scholar]
- 23.Chen H-Z et al. Canonical and atypical E2Fs regulate the mammalian endocycle. Nature Cell Biology 14, 1192–1202 (2012). 10.1038/ncb2595 [DOI] [PMC free article] [PubMed] [Google Scholar]
- 24.Kriegstein A & Alvarez-Buylla A The glial nature of embryonic and adult neural stem cells. Annu Rev Neurosci 32, 149–184 (2009). 10.1146/annurev.neuro.051508.135600 [DOI] [PMC free article] [PubMed] [Google Scholar]
- 25.Trapnell C et al. The dynamics and regulators of cell fate decisions are revealed by pseudotemporal ordering of single cells. Nature Biotechnology 32, 381–386 (2014). 10.1038/nbt.2859 [DOI] [PMC free article] [PubMed] [Google Scholar]
- 26.Gómez-López S et al. Sox2 and Pax6 maintain the proliferative and developmental potential of gliogenic neural stem cells In vitro. Glia 59, 1588–1599 (2011). 10.1002/glia.21201 [DOI] [PubMed] [Google Scholar]
- 27.Rueckert EH et al. Cis-acting regulation of brain-specific ANK3 gene expression by a genetic variant associated with bipolar disorder. Mol Psychiatry 18, 922–929 (2013). 10.1038/mp.2012.104 [DOI] [PMC free article] [PubMed] [Google Scholar]
- 28.Salpietro V et al. AMPA receptor GluA2 subunit defects are a cause of neurodevelopmental disorders. Nat Commun 10, 3094 (2019). 10.1038/s41467-019-10910-w [DOI] [PMC free article] [PubMed] [Google Scholar]
- 29.Kartha VK et al. Functional inference of gene regulation using single-cell multi-omics. Cell Genom 2 (2022). 10.1016/j.xgen.2022.100166 [DOI] [PMC free article] [PubMed] [Google Scholar]
- 30.Ma S et al. Chromatin Potential Identified by Shared Single-Cell Profiling of RNA and Chromatin. Cell 183, 1103–1116.e1120 (2020). 10.1016/j.cell.2020.09.056 [DOI] [PMC free article] [PubMed] [Google Scholar]
- 31.Fong AP et al. Genetic and epigenetic determinants of neurogenesis and myogenesis. Dev Cell 22, 721–735 (2012). 10.1016/j.devcel.2012.01.015 [DOI] [PMC free article] [PubMed] [Google Scholar]
- 32.Hernandez-Miranda LR, Müller T & Birchmeier C The dorsal spinal cord and hindbrain: From developmental mechanisms to functional circuits. Dev Biol 432, 34–42 (2017). 10.1016/j.ydbio.2016.10.008 [DOI] [PubMed] [Google Scholar]
- 33.Macrae TA, Fothergill-Robinson J & Ramalho-Santos M Regulation, functions and transmission of bivalent chromatin during mammalian development. Nature Reviews Molecular Cell Biology 24, 6–26 (2023). 10.1038/s41580-022-00518-2 [DOI] [PubMed] [Google Scholar]
- 34.Dainese R et al. A parallelized, automated platform enabling individual or sequential ChIP of histone marks and transcription factors. Proc Natl Acad Sci U S A 117, 13828–13838 (2020). 10.1073/pnas.1913261117 [DOI] [PMC free article] [PubMed] [Google Scholar]
- 35.Pont S Thy-1: a lymphoid cell subset marker capable of delivering an activation signal to mouse T lymphocytes. Biochimie 69, 315–320 (1987). [DOI] [PubMed] [Google Scholar]
- 36.Zeisel A et al. Molecular Architecture of the Mouse Nervous System. Cell 174, 999–1014.e1022 (2018). 10.1016/j.cell.2018.06.021 [DOI] [PMC free article] [PubMed] [Google Scholar]
- 37.Cable DM et al. Robust decomposition of cell type mixtures in spatial transcriptomics. Nature Biotechnology 40, 517–526 (2022). 10.1038/s41587-021-00830-w [DOI] [PMC free article] [PubMed] [Google Scholar]
- 38.Seri B, García-Verdugo JM, McEwen BS & Alvarez-Buylla A Astrocytes give rise to new neurons in the adult mammalian hippocampus. J Neurosci 21, 7153–7160 (2001). 10.1523/jneurosci.21-18-07153.2001 [DOI] [PMC free article] [PubMed] [Google Scholar]
- 39.Hochgerner H, Zeisel A, Lönnerberg P & Linnarsson S Conserved properties of dentate gyrus neurogenesis across postnatal development revealed by single-cell RNA sequencing. Nature Neuroscience 21, 290–299 (2018). 10.1038/s41593-017-0056-2 [DOI] [PubMed] [Google Scholar]
- 40.Barclay W & Shinohara ML Inflammasome activation in multiple sclerosis and experimental autoimmune encephalomyelitis (EAE). Brain Pathol 27, 213–219 (2017). 10.1111/bpa.12477 [DOI] [PMC free article] [PubMed] [Google Scholar]
- 41.Russell AJC et al. Slide-tags enables single-nucleus barcoding for multimodal spatial genomics. Nature 625, 101–109 (2024). 10.1038/s41586-023-06837-4 [DOI] [PMC free article] [PubMed] [Google Scholar]
- 42.Greenberg MVC & Bourc’his D The diverse roles of DNA methylation in mammalian development and disease. Nat Rev Mol Cell Biol 20, 590–607 (2019). 10.1038/s41580-019-0159-6 [DOI] [PubMed] [Google Scholar]
- 43.Clapier CR, Iwasa J, Cairns BR & Peterson CL Mechanisms of action and regulation of ATP-dependent chromatin-remodelling complexes. Nat Rev Mol Cell Biol 18, 407–422 (2017). 10.1038/nrm.2017.26 [DOI] [PMC free article] [PubMed] [Google Scholar]
- 44.Bannister AJ & Kouzarides T Regulation of chromatin by histone modifications. Cell Res 21, 381–395 (2011). 10.1038/cr.2011.22 [DOI] [PMC free article] [PubMed] [Google Scholar]
- 45.Rowley MJ & Corces VG Organizational principles of 3D genome architecture. Nat Rev Genet 19, 789–800 (2018). 10.1038/s41576-018-0060-8 [DOI] [PMC free article] [PubMed] [Google Scholar]
- 46.Mimitou EP et al. Scalable, multimodal profiling of chromatin accessibility, gene expression and protein levels in single cells. Nat Biotechnol 39, 1246–1258 (2021). 10.1038/s41587-021-00927-2 [DOI] [PMC free article] [PubMed] [Google Scholar]
- 47.Swanson E et al. Simultaneous trimodal single-cell measurement of transcripts, epitopes, and chromatin accessibility using TEA-seq. Elife 10 (2021). 10.7554/eLife.63632 [DOI] [PMC free article] [PubMed] [Google Scholar]
- 48.Su G et al. Spatial multi-omics sequencing for fixed tissue via DBiT-seq. STAR Protoc 2, 100532 (2021). 10.1016/j.xpro.2021.100532 [DOI] [PMC free article] [PubMed] [Google Scholar]
- 49.Granja JM et al. ArchR is a scalable software package for integrative single-cell chromatin accessibility analysis. Nature Genetics 53, 403–411 (2021). 10.1038/s41588-021-00790-6 [DOI] [PMC free article] [PubMed] [Google Scholar]
- 50.Roelli P, bbimber, Flynn B, santiagorevale & Gui G Hoohm/CITE-seq-Count: 1.4.2. Zenodo; (2019). 10.5281/zenodo.2590196 [DOI] [Google Scholar]
- 51.Wu T et al. clusterProfiler 4.0: A universal enrichment tool for interpreting omics data. Innovation (Camb) 2, 100141 (2021). 10.1016/j.xinn.2021.100141 [DOI] [PMC free article] [PubMed] [Google Scholar]
Associated Data
This section collects any data citations, data availability statements, or supplementary materials included in this article.
Supplementary Materials
Data Availability Statement
Raw and processed data reported in this study are deposited in the Gene Expression Omnibus (GEO) with accession code GSE263333. Resulting fastq files were aligned to the mouse reference genome (GRCm38). Published data for data quality comparison and integrative data analysis include: mouse reference genome GRCm38: Mus musculus genome assembly GRCm38 - NCBI - NLM (nih.gov); mouse organogenesis cell atlas (MOCA): https://oncoscape.v3.sttrcancer.org/atlas.gs.washington.edu.mouse.rna/downloads; mouse embryo H3K27me3 and H3K27ac chip-seq (E13.5): https://www.encodeproject.org/; mouse brain cell atlas: http://mousebrain.org/adolescent/downloads.html; Allen Developing Mouse Brain Atlas: https://developingmouse.brain-map.org/; spatial-CUT&Tag data: GSE165217; spatial-ATAC-RNA-seq data: GSE205055.