

ABSTRACT
Background
Idiopathic pulmonary fibrosis (IPF) is a lethal disease with an unknown etiology and complex pathophysiology that are not fully understood. The disease involves intricate cellular interplay, particularly among various immune cells. Currently, there is no treatment capable of reversing the fibrotic process or aiding lung regeneration. Hepatocyte growth factor (HGF) has demonstrated antifibrotic properties, whereas the adoptive transfer of modified T cells is a well‐established treatment for various malignancies. We aimed to understand the dynamics of T cells in the progression of lung fibrosis and to study the therapeutic benefit of adoptive T cell transfer in a bleomycin‐injured mouse lung (BLM) model.
Methods
T cells were isolated from the spleen of naïve mice and transfected in vitro with mouse HGF plasmid and were administered intratracheally to the mice lungs 7 days post‐bleomycin injury to the lung. Lung tissue and bronchoalveolar lavage were collected and analyzed using flow cytometry, histology, qRT‐PCR, ELISA, and hydroxyproline assay.
Results
Our findings demonstrate the successful T cell therapy of bleomycin‐induced lung injury through the adoptive transfer of HGF‐transfected T cells in mice. This treatment resulted in decreased collagen deposition and a balancing of immune cell exhaustion and cytokine homeostasis compared with untreated controls. In vitro testing showed enhanced apoptosis in myofibroblasts induced by HGF‐overexpressing T cells.
Conclusions
Taken together, our data highlight the great potential of adoptive T cell transfer as an emerging therapy to counteract lung fibrosis.
Keywords: adoptive transfer, bleomycin lung injury and fibrosis, immune exhaustion, T cells homeostasis
This study explores the potential of T cells as a therapeutic strategy against idiopathic pulmonary fibrosis (IPF), a progressive lung disease for which there is currently no treatment to reverse fibrosis or restore normal lung function. To investigate an innovative approach using adoptive T cell transfer, T cells isolated from healthy mice were genetically modified to carry a plasmid containing hepatocyte growth factor (HGF). The modified cells were delivered directly into the airways of mice with bleomycin‐induced lung fibrosis. The results showed a significant reduction in fibrotic scarring, improved immune regulation, and increased apoptosis of pathogenic myofibroblasts. These results highlight the potential of HGF‐engineered T cells as a promising therapeutic approach to combat IPF.

Abbreviations
- AETHER
Allogeneic Human Mesenchymal Stem Cells in Patients with Idiopathic Pulmonary Fibrosis via Intravenous Delivery
- APC
antigen presenting cells
- BALF
bronchoalveolar lavage fluid
- BLM
bleomycin
- DC
dendritic cells
- ECM
extracellular matrix
- EMT
epithelial–mesenchymal transition
- HGF
hepatocyte growth factor
- HGF‐CD3+ T cells
HGF‐transfected T cells
- i.t.
intratracheally
- IPF
idiopathic pulmonary fibrosis
- LDLN
lung draining lymph nodes
- LP
lung parenchyma
- MSCs
bone marrow mesenchymal cells
- PCLS
precision‐cut lung slices
- PGE
prostaglandins E
- pLN
peripheral lymph nodes
- PTGES
prostaglandin E synthase
1. Background
With a median survival of 3–5 years, idiopathic pulmonary fibrosis (IPF) is the deadliest and most aggressive form of lung fibrosis [1], and its prevalence is increasing worldwide [2, 3]. Although two drugs, pirfenidone and nintedanib, have been approved since 2014, the progression of this disease cannot be stopped, and one‐third of patients show significant intolerance to these drugs. It remains unclear how pirfenidone works [4]. The onset of IPF is associated with risk factors such as aging, air pollution, and smoking [5, 6]. The exact etiology and detailed pathophysiology of IPF are still not fully understood. IPF is known to emerge from the failure of the alveolar epithelium to heal in an orderly manner, triggering a cascade of proinflammatory and profibrotic mechanisms, activating various cell types, and releasing a plethora of cytokines. These processes wreak havoc within the alveolar compartment of the lung [7]. The roles of epithelial cells and fibroblasts in the course of IPF have been studied in depth, and several mechanistic insights have been detailed. Moreover, many therapeutic agents targeting molecular pathways related to these two cell types have been tested in clinical trials [8]. Unfortunately, no treatment has been established to halt or reverse the progression of IPF.
Immune cells, including macrophages, T cells, inflammatory monocytes, and neutrophils, play an important role in the complex cellular interactions. However, the precise relationship between IPF and immune cell–mediated signaling is not fully understood [9]. Of the pulmonary immune cells, macrophages have been studied in‐depth, and their role in IPF has been investigated in detail [10]. However, studies about T cells and their subsets are very controversial [11, 12, 13, 14]. In this study, our aim was to investigate the temporal dynamics of T cells using the model of bleomycin‐injured mouse lung (BLM model) and to examine the roles of T cells and their specific subsets. It is widely accepted that progressive IPF is associated with a shift toward T helper cell 2 (Th2) responses, which facilitate disease progression [15, 16, 17]. The Th17/regulatory T cells (Treg) axis has also been investigated, but with controversial conclusions [18, 19, 20, 21].
Other crucial immune cells include dendritic cells (DC), which function as professional antigen‐presenting cells (APCs) and activate cells of the adaptive immune system, such as naïve T cells, upon encountering potential pathogens entering the body [22, 23, 24]. DC appear to play different roles in human IPF lung when compared with the BLM‐injured lung. Fibroblasts from human fibrotic lungs have been shown to attract immature DC and to induce a profibrotic environment [25], whereas accumulation of immature DC is directly linked to a poor prognosis [18, 26]. Contrarily, it was demonstrated in the BLM model that depletion of specific subsets of DC mitigated fibrosis [27], making it difficult to confirm the role of these cell types in the pathophysiology of lung fibrosis.
Recently, CAR‐T cells were employed to treat certain types of cancer with promising results [28]. Therefore, we aim to test if the adoptive transfer of T cells restores immune homeostasis and could be a potential therapy for lung fibrosis. Moreover, hepatocyte growth factor (HGF), with morphogenic, motogenic, and mitogenic capacities, shows suppression of apoptosis in epithelial cells while inducing apoptosis in myofibroblasts [29]. HGF is a known antifibrotic agent and many antifibrotic mechanisms of HGF have been reported [30]. It is known to have a proliferative and a protective effect on epithelial cells; it induces DNA production in alveolar epithelial type II cells. It induces apoptosis of the myofibroblasts and stops the differentiation of fibroblasts to myofibroblasts [31]. HGF also reduces collagen deposition by myofibroblasts and reduces TGF‐β1 production by various cell types; it has also been shown to stop epithelial‐mesenchymal transition (EMT) [5].
Focusing on T cells, in this study, we investigated the dynamics of specific immune cell subsets dysregulation, following bleomycin administration to murine lungs in a time‐dependent manner. Subsequently, we explored the restoration of immune homeostasis through adoptive T cell transfer and its impact on lung repair and regeneration. Our findings demonstrate that adoptive transfer of both T cells and HGF‐CD3+ T cells promotes lung repair and regeneration in the BLM model, potentially by rebalancing pulmonary immune cells involved in homeostasis. This approach could form the basis for personalized therapies aimed at treating lung fibrotic diseases.
2. Materials and Methods
2.1. Ethical Approval
Animal experiments were approved by the Swiss Federal Veterinary Office and the Cantonal Ethical Committee for Animal Experiments (Amt für Landwirtschaft und Natur des Kantons Bern) under permission number BE 84/18. All mice received humane care in compliance with the “Principles of Laboratory Animal Care” formulated by the National Society for Medical Research and the “Guide for the Care and Use of Laboratory Animals” prepared by the Institute of Laboratory Animal Research. All experiments were performed in accordance with the standards of the European Convention of Animal Care.
2.2. Mice
Ten‐ to fifteen‐week‐old male C57BL/6jRJ mice (Janvier labs Le Genest Saint Isle Saint Berthevin, France) were used for the study. Mice were housed in a specific pathogen‐free facility at the Department of BioMedical Research, University of Bern (Bern, Switzerland) in individual cages with food and water ad libitum in controlled temperature and light condition.
2.2.1. Study Design
The study was divided in two parts: the first part of the study was designed to evaluate effect of bleomycin induced lung injury on immune cell homeostasis. In the second part of the study, the effect of adoptive transfer of T cells or HGF‐transfected T cells on the BLM model was evaluated in the BLM model. The mice were randomly divided into six groups with n = 6–12 in each group. For analysis, tissue samples of two mice were pooled.
2.3. Anesthesia
For administration of bleomycin and adoptive T cell transfer, an anesthetic cocktail solution of 1 mL was prepared as follows: 300‐μL ketalar (50 mg/mL, Ketaminum, Pfizer AG), 200‐μL Domitor (medetomidini hydrochloridum 1 mg/mL, Orion Pharma), 127‐μL fentanyl (fentanyli citras, 0.05 mg/mL, Sintetica), and 373‐μL saline 0.9% (Baxter) were mixed, 0.05 μL per mouse was injected intraperitoneally. Mice were kept on a heating mattress, and Bepanthen eye cream was applied to both eyes to prevent desiccation. For the reversal of anesthesia after the procedure, an anesthesia antagonist cocktail was injected. For 1 mL of antagonist solution, 100‐μL Revertor (5 mg/mL, atipamezoli hydrochloridum), 600 μL naloxone (0.4 mg/mL, naloxoni hydrochloridum, Orpha Swiss GmBH), and 300‐μL saline 0.9% (Baxter) were mixed. Mice received an intraperitoneal injection of 0.05 μL and were kept on the heating mattress until full awakening. After procedure, mice were checked for weight and physical condition every day to observe and monitor any decline in their health.
2.4. Euthanasia
Mice received an intraperitoneal injection of 100‐μL Esconarkon (300 mg/mL, pentobarbitalum natricum, Streuli Pharma AG) before the collection of organs.
2.5. Bleomycin Administration to the Lung
On Day 1 of the protocol, mice were anesthetized as described above, intubated with a 22‐gauge intravenous catheter (REF:381212 and 381223BD, BD Insyte), and instilled intratracheally with 1.52 U/mouse bleomycin (Cat. No: 2634B5012, Baxter, USA) in a volume of 50 μL of saline to both lungs; for equal distribution, a bolus of air was also instilled using the same syringe. The schematic representation of the experimental setup is elaborated in Figure 1. The selected bleomycin dosage (1.52 U) was chosen as it provided an optimal balance between efficacy and safety. This intermediate dose falls within the commonly used range of 1–2 U per mouse, ensuring sufficient lung injury to accurately model the disease while minimizing mortality and excessive inflammation. Importantly, higher doses would have resulted in excessive inflammation, which is not representative of human idiopathic pulmonary fibrosis (IPF) [32, 33, 34]. The control group was administrated 50 μL of saline. For the first part of the study to evaluate the role of immune cell homeostasis after intratracheal bleomycin administration, mice were sacrificed at 7, 10, or 14 days after bleomycin or saline administration. For the second part of the study to evaluate the effect of adoptive transfer of T cells or HGF‐overexpressing T cells, mice received 5 × 10⁵ CD3+ T cells that were either HGF‐transfected or nontreated CD3+ T cells 7 days after bleomycin instillation.
FIGURE 1.

Outline of BLM mouse model, histology, fibrosis scoring, and pulmonary collagen content in the course of fibrosis. (A) Mice were either instilled intratracheal with 50 μL of saline (control), or with BLM (1.52 U/kg) and sacrificed on Day 7, Day 10, and Day 14 following instillation. (B) H&E‐stained lung sections of mice treated as outlined above. (C) Ashcroft's scoring done on H&E‐stained lung sections. (D) Lung collagen content measured by hydroxyproline assay on lung homogenate. Mice treated as outlined under A. Data show mean ± SEM, n = 12 mice per group (one point represents two pooled mice).
2.6. HGF Plasmid and HGF‐Overexpressing CD3+ T Cells
Plasmid: Mouse HGF plasmid was obtained from Origene (MG226277). The plasmid purification was done employing the DNA purification kit (MACHEREY‐NAGEL, Germany) following the included protocol. The plasmid was suspended in RNAse‐free water for in vitro transfection. CD3+ T cells were isolated from murine spleen. Briefly, spleen was meshed on a 70‐μm strainer in ice‐cold PBS. After centrifugation, total CD3+ T cells were isolated using the EasySep Mouse T Cell Isolation Kit (Stemcell Technologies, 19851). Mouse T cell nucleofector kit (Lonza, Switzerland, VPA‐1006) was used following the supplied protocol. After transfection, 5 × 10⁵ of transfected cells suspended in 60 μL of PBS were administered intratracheally to the lung. The control group was administered with nontransfected CD3+ T cells only. Transfection efficiency is shown in Figure S8.
2.7. Assessment
In the first part of the study, the mice were sacrificed at 7, 10, or 14 after BLM administration. In the second part of the study, adoptive transfer of HGF‐overexpressing CD3+ T cells was performed 7 days after BLM injury to the lung, and the animals were sacrificed 7 days after adoptive transfer of CD3+ T cells. The mice were euthanized by intraperitoneal injection of 100‐μL phenobarbital sodium, and blood was collected by puncturing the heart with a 24G syringe before dissection. Lung, heart, and trachea were exposed by bilateral thoracotomy. Bronchoalveolar lavage fluid (BALF) was collected through a cut in the upper third part of the trachea in which a 24G cannula was introduced and 0.5 mL of ice‐cold PBS was instilled into the lung and aspirated back again for further analysis (this step was repeated three times with fresh PBS for a total of 1.5 mL of collected BALF). Thereafter, the heart was perfused through the right ventricle with a minimum of 5 mL of ice‐cold PBS, and organs were collected: lung parenchyma (LP), lung draining lymph nodes (LDLN), and peripheral lymph nodes (i.e., the axillary, brachial, and inguinal LN) (pLN).
2.8. Preparation of Single‐Cell Suspensions for Flow Cytometry
Preparation of single‐cell suspensions of LP, LDLN, and pLN was performed as described earlier [35]. Briefly, organs were collected in ice‐cold GKN + 10% FBS and finely minced using a scalpel blade. The minced organs were incubated in a mixture of Collagenase IV (Worthington, USA) and DNAse I (Sigma Aldrich, USA) in GKN + 10% FBS for 90 min for LP and 30 min for LDLN and PLN in a shaking water bath at 37°C. Digested organs were filtered through a 70‐μm mesh and centrifuged at 1640 rpm for 8 min, and pellets were resuspended in ice‐cold GKN + 5% FBS. Samples were kept on ice until further processing.
2.9. Flow Cytometry
Single‐cell suspensions of LP, LDLN, PLN, and BALF were incubated with FcR‐block for 10 min on ice. The list of used antibodies can be found in Table S1. Acquisition was performed using a LSRII SORP (upgraded) (BD Biosciences) flow cytometer, and data were analyzed with the software FlowJo X (Tree Star, Ashland, OR, USA). The gating strategy is shown in Figure S1.
2.10. Hydroxyproline Assay
Collagen content of the lung was analyzed as described previously [35]. Harvested lungs were weighed, snap frozen, and then homogenized in phosphate buffered saline (PBS); 300 μL of the homogenate was treated with 10% trichloric acid (TCA) and then hydrolyzed with 6‐M hydrochloric acid for 18 h at 110°C, and the pH was adjusted to 7. The oxidation process was started by a 20‐min incubation with 1 mL of chloramine T reagent at RT and stopped by the addition of 500 μL of 3.15‐M perchloric acid. Samples were then incubated in Ehrlich reagent (p‐dimethylaminobenzaldehyde added to methyle cellusolve) for 20 min at 55°C–65°C. Finally, the absorbance of each sample was measured at 557 nm, and a standard curve was calculated using known concentrations of reagent grade hydroxyproline (Sigma) as described before.
2.11. Hematoxylin and Eosin (H&E) Staining and Assessment of Fibrosis
H&E staining was performed as a routine procedure on formalin‐fixed and paraffin‐embedded sections, and a modified Ashcroft's score, ranging from 0 to 8, was used for a semiquantitative scoring of pathological lesions. Between 20 and 30 fields of view per lung were randomly sampled and rated based on published criteria [36] by an observer blinded to the samples.
2.12. Enzyme‐Linked Immunosorbent Assay
Murine BALF protein content was screened for HGF and TGF‐β with an ELISA kit from R&D Systems (catalog numbers: DY2207 and DY1679‐05). The assays were performed following manufacturer's instructions.
2.13. Real‐Time Quantitative PCR (qPCR)
Total RNA was extracted from lung tissue with the kit Nucleospin RNA (Macherey Nagel, Germany). Reverse transcription was done using Omniscript RT kit (Qiagen, Germany) according to the manufacturer's instructions. Quantitative RT‐PCR was performed using the FastStart Universal SYBR Green Master (Rox) (Merck, Germany) using the Quanstudio 6 Real‐Time PCR machine (ThermoFisher Scientific). The relative mRNA expression was calculated using the –ΔΔCt method and the fold change was obtained through FC = 2−ΔΔCt. Data were normalized to the housekeeping gene RPLP0. A list of qPCR primers is shown in Table S2.
2.14. Isolation of Murine Pulmonary Fibroblasts
Lung fibroblasts were isolated by sprouting as described earlier [37]. Briefly, lung was harvested as explained above and was cut into very small pieces of 1–2 mm in size with scissors and placed in a six‐well plate, coated with 10% PureCol (Sigma) in milliQ H2O for at least 30 min; 1 mL of DMEM with 10% FBS was added at the bottom of each well to stabilize the pieces, which were kept in culture for 3–5 days. Pieces were finally removed, and new media was added every 2 days until sufficient growth of murine fibroblasts was observed.
2.15. Co‐Culture of TGF‐β–Treated Fibroblasts and T Cells
Six‐well plates were coated with 10% Purecol (Sigma) for 60 min at 37°C. Following rinsing with ice‐cold PBS, 25,000 fibroblasts per well were seeded in 2‐mL DMEM 10% FBS 1% penicillin streptomycin (Gibco); 8 ng/μL of TGF‐β per well was added for 24 h to stimulate the fibroblasts. Twenty‐four hours later, 50,000 CD3+ T cells, either HGF+‐transfected or nontransfected CD3+ T cells, were added on top of stimulated fibroblasts. Co‐cultures were kept for 24 h before further analysis.
2.16. Incucyte‐S3 Live Cell Analysis of TGF‐β–Treated Fibroblasts and T Cells
Cells and co‐cultures were prepared as described above. Fibroblasts and T cells were stained using Vybrant Multicolor Cell‐labelling kit (REF: V22889, Molecular probes by Life Technologies). Five microliters of dye were added to 1 × 10⁶ cells/mL of PBS. Each cell type was incubated for 20 min at 37°C and washed two times using PBS and plated in six‐well plates. The plates were put in the Incucyte‐S3 Live Cell Analysis System (ThermoFisher Scientific), and images were taken every 10 min for 24 h and then once per hour for 72 h.
2.17. Precision‐Cut Lung Slices (PCLS)
The murine PCLS were prepared following the protocol from Lyons‐Cohen et al. [38] and adapted to our needs. Briefly, the mice were euthanized as described above and then maintained on a small polystyrene base. The abdominal cavity was opened, and the inferior vena cava was sectioned to remove blood from the lungs. Then, a tracheotomy was performed by carefully opening the upper area and removing the salivary glands. One incision was made in the upper part of the trachea in order to be able to insert a 22G needle. Then, with a 1‐mL syringe, approximately 0.8–1 mL of 40°C 2% low‐melting‐point agarose (Sigma) was carefully instilled in the lungs. The syringe was taped to the polystyrene base to ensure the correct agarose maintenance within the lungs. The whole mouse on the base still bearing the inserted syringe in the trachea was placed for at least 10 min in a refrigerator. When cold, the lungs were removed and placed in ice‐cold PBS. PCLS of 150 μm were cut using the Compresstome VF‐310‐0Z Vibrating Microtome (Precisionary, USA). Once sliced, the cuts were placed in ice‐cold PBS, and the remaining agarose was removed with forceps. Slices were incubated at least 2 h at 37°C, 5% CO2 before any analysis.
2.18. Staining of PCLS
Staining was done according to protocol adapted from published work [39]. Briefly, sections of PCLS were frozen in 10% DMSO / 90% FBS and then fixed for 3 h in 2% PFA followed by 2 h incubation in 40% sucrose at 4°C. PCLS were washed with PBS and blocked with PBS‐0.2% Triton plus 1% goat serum. Primary antibodies were incubated overnight in PBS‐0.2% Triton plus 1% goat serum and washed the next morning with PBS‐0.1%. Secondary antibodies were incubated for 3 h in PBS‐0.2% Triton plus 1% goat serum, washed, and mounted on slides before imaging on with a confocal microscope (LSM980, Zeiss, Feldbach, Switzerland).
2.19. Statistics
Statistical analysis was performed with GraphPad Prism 8.4.0 (GraphPad Software Inc., La Jolla, California, USA). A one‐way ANOVA followed by Dunnett's multiple comparisons test with a single pooled variance was performed. Data with p values of p < 0.01(*), p < 0.001(**), p < 0.0001(***), and p < 0.00001(****) were considered as significantly different. Each point value represents two pooled mice that received the same treatment, with organs harvested at the same time and processed in the same manner in order to reduce variability induced by bleomycin administration between mice. All endpoints were evaluated with at least six animals (n = 6) for Days 7 and 14 after bleomycin administration, nine animals (n = 9) were done for the Day 10, and 12 animals were done for the control group (instillation with saline).
3. Results
3.1. Administration of Bleomycin (BLM) Dysregulates Pulmonary Immune Cell Homeostasis in Different Compartments of the Murine Respiratory Tract
Mice were administered 1.52 U/kg of BLM intratracheally (i.t.) in 50‐μL volume, on Day 0 and sacrificed 7, 10, and 14 days following instillation (Figure 1A). Control mice received 50 μL of saline i.t. Mice showed interstitial infiltration on Days 7, 10, and 14 after BLM instillation (Days 7, 10, and 14), whereas controls did not show any infiltrate (Figure 1B). Fibrosis scoring done on representative histologic sections confirmed an increase in fibrotic area on Days 10 and 14 in comparison to control mice (Figure 1C). In accordance, the total lung collagen content showed an increasing trend on Day 7 and a significant increase compared with controls on Days 10 and 14 as measured by hydroxyproline assay (Figure 1D). In order to visualize the collagen deposition at the different time points post‐BLM exposure, we performed a Sirius Red staining where the red showed the collagen (Figure S3A–D). The red staining confirms an accumulation of collagen by Day 14 post‐BLM exposure in the mouse lung.
We analyzed frequencies of immune cells by flow cytometry in order to obtain an overview on the dynamics occurring over time after BLM assault (Figure 2, Table 1). The frequency of the various immune cells studied was observed within the total CD45+ population. CD45 molecules are expressed on all leukocytes and are important molecules in signal transduction on the cell membrane. They are involved in the development, maturation, function regulation, and signal transmission of lymphocytes, and their distribution can be used as a classification marker for certain T cell subgroups [40]. In the lung, CD4+ T cells (Figure 2A) showed a nonsignificant trend in decreasing frequency on Day 7 in comparison with control mice. This trend became significant on Day 14. In contrast, frequency of CD8+ T cells was not affected by BLM treatment (Figure 2A). With no significant change on Days 7 and 10, CD4+CD25+FoxP3+ Treg showed a significant decrease on Day 14. However, in BALF, CD4+ T cells showed a significant increase on Day 14 whereas no change was observed in the Treg subset (Figure 2C).
FIGURE 2.

Frequencies of T cell and DC subsets in lung and BALF following BLM instillation. (A) Frequency of lung CD4+, Treg (CD4+CD25+FoxP3+), and CD8+ T cells within total CD45+ cells. Mice were either instilled intratracheal with BLM (1.52 U/kg) or with 50 μL of saline (control) and sacrificed on Day 7, Day 10, and Day 14 following instillation. (B) Frequency of total lung DC and CD11bhigh and CD11blow subsets. (C) BALF CD4+ and Treg (CD4+CD25+FoxP3+). (D) BALF total DC (CD11C+MHCIIhigh) and CD11bhigh and CD11blow subsets relative to total CD45+ cells. All Groups received treatment as outlined under A. Data show mean ± SEM. Statistical significance was determined by a one‐way ANOVA followed by Tukey's multiple comparison post‐test. Values were considered significantly different comparing treatments with the control group, and significances reported as p < 0.05 (*), p < 0.05 (**), p < 0.005 (***), and p < 0.0005 (****), n = 12 mice per group (one point represents two pooled mice).
TABLE 1.
Summary of frequencies of T cell subsets shown by flow cytometry at different time points after bleomycin instillation.
| % of CD45+ cells | Control | BLM Day 7 | BLM Day 10 | BLM Day 14 | BLM Day 21 |
|---|---|---|---|---|---|
| CD4+ T cells | 4771 ± 0.705 | 5477 ± 0.573 | 4192 ± 0.738 | 2100 ± 1967 | 1720 ± 0.294 |
| CD8+ T cells | 0.719 ± 0.456 | 4168 ± 0.428 | 0.582 ± 0.306 | 0.521 ± 0.474 | 1032 ± 0.239 |
| Treg | 0.097 ± 0.018 | 0.1033 ± 0.027 | 0.093 ± 0.056 | 0.020 ± 0.017 | 0.048 ± 0.016 |
Other immune cell subsets analyzed in the lung showed varying trends after BLM injury: Total DC (CD11chighMHCIIhigh) as well as CD11blow and CD11bhigh subsets showed a significant decrease on Day 14 in comparison to the control group (Figure 2B). In contrast, in BALF, total DC showed a significant increase on Days 7 and 14. The CD11bhigh subset showed a significant increase on Day 7, whereas the CD11blow subset was increasing in frequency on Day 14 (Figure 2D). Cell frequencies are detailed in Table 1.
3.2. Adoptive Transfer of HGF‐CD3+ T Cells Restores the Immune Cell Homeostasis in the BLM Mouse Model
We wanted to investigate a potential beneficial effect induced by HGF‐overexpressing T cells (HGF‐CD3+ T cells) on the fibrotic lesions in comparison to adoptive transfer of CD3+ T cells only. Mice were treated with 50 μL of BLM i.t. on Day 0 and treated with 5 × 10⁵ HGF‐CD3+ T cells or CD3+ T cells on Day 7. On Day 14 (7 days post treatment), mice were sacrificed and organs collected (Figure 3A). As reported before, mice showed interstitial infiltration after BLM administration in comparison to control mice. A significant reduction in inflammatory infiltration was observed in mice treated with HGF‐CD3+ T cells compared with BLM‐injured mice (Figure 3B). Fibrosis scoring, done on representative histologic sections, confirmed improved histology and lung architecture after treatment with HGF‐CD3+ T cell compared with the BLM group. Interestingly, the nontransfected CD3+ T cell treatment group showed a significant decrease of fibrosis scoring (Figure 3C). The increase of total collagen content in the lung, observed 14 days post‐BLM treatment, was significantly reduced after treatment with HGF‐CD3+ T cells, whereas nontransfected CD3+ T cells did not have any effect (Figure 3E). Sirius red staining was conducted in both treatment groups. The results indicated a reduction in collagen deposition following HGF‐CD3+ T cell treatment compared with both the BLM Day 14 group and the nontransfected CD3+ T cell treatment group (Figure S3D–F). Finally, we assessed total HGF concentration in BALF by ELISA and observed, as expected, a significant increase of HGF concentration following instillation of HGF‐CD3+ T cells in comparison to the control group (Figure 3D). Immunofluorescence staining in PCLS confirmed the presence of instilled HGF‐CD3+ T cells in the BLM‐injured lung parenchyma 24 h after instillation, whereas confocal laser scanning imaging revealed localization of HGF‐CD3+ cells within the alveolar walls (Figure 4).
FIGURE 3.

Treatment approach employing nontransfected CD3 + T cells with resulting histology and pulmonary collagen content. (A) Timeline of treatment employing HGF‐CD3+ T cells. Mice were either administered intratracheal with BLM (1.52 U/kg) or with 50 μL of saline (control), and on Day 7, mice were treated either with HGF‐CD3+ T cells or nontransfected CD3+ T cells and sacrificed 7 days later (BLM group = Day 14). (B) Histologic changes in lung tissue following treatment with HGF‐transfected or nontransfected CD3+ T cells in comparison to the BLM group and control were analyzed with H&E staining (C) Ashcroft's scoring done on H&E‐stained mouse lung sections (D) Level of hepatocyte growth factor (HGF) measured in lung tissue by ELISA. (E) Total collagen content in the lung measured by hydroxyproline assay. Control = grey, BLM (Day 14) = light blue, nontransfected CD3+ T cell treatment = green. Data show mean and SEM, n = 8–12 mice per group, ****p < 0.00005, ***p < 0.0005, **p < 0.005, *p < 0.05.
FIGURE 4.

Immunofluorescence staining in precision‐cut lung slices (PCLS) from BLM‐treated mice instilled with HGF‐CD3 + T cells imaged with confocal laser scanning microscopy. Mice were treated with BLM. Seven days after BLM treatment, DiO‐labeled HGF‐CD3+ T cells were instilled intratracheal, and mice were sacrificed 24 h later. Each image shows confocal optical sections of the xy‐projection (large upper image), the xz‐projection (small lower image), and the yz‐projection (small right image). Blue: actin+ filaments, red: CD3+ T cells (arrowheads), green: DiO‐stained HGF‐CD3+ T cells (squares), yellow: co‐localization DiO dye and CD3+ cells (asterisks), A = alveolus. PCLS were scanned with a confocal microscope (Zeiss, LSM 980).
In order to elucidate potential effects of HGF‐CD3+ T cells and CD3+ T cells on local pulmonary immune cell subsets, single‐cell suspensions of lung tissue were analyzed by flow cytometry. As previously shown, frequency of CD4+ T cells decreased in the BLM group in comparison to the control group (Figure 2A). This decrease was not abrogated after treatment either with HGF‐CD3+ T cells or nontransfected CD3+ T cells (Figure 5A). Treg also showed a significant decrease in frequency in the nontreated BLM group in comparison to the control. Treatment with HGF‐CD3+ T cells and nontransfected CD3+ T cells induced a significant increase in frequency of Treg in comparison to the nontreated BLM group. Fourteen days after BLM administration, CD8+ T cells were not decreased; however, HGF‐CD3+ T cells showed a significant increase in frequency in comparison to nontreated BLM and the control groups (Figure 5A). Total DC (MHCIIhighCD11chigh) and both subsets CD11bhigh and CD11blow DC showed a significant increase in frequency following treatment with both HGF‐CD3+ T cells in comparison to the nontreated BLM group (Figure 5B). BALF CD4+ T cells and Treg showed a similar pattern as observed in the lung with an increase in frequency after treatment with HGF‐CD3+ T cells in comparison to the BLM group or negative control (Figure 5C). Total DC and the CD11blow subset were shown to increase in the nontreated BLM group, as described above (Figure 5D). Compared with the BLM group, treatment with nontransfected CD3+ T cells showed a decrease in total DC while no such decrease was observed following instillation of HGF‐CD3+ T cells. The CD11bhigh subset showed an increase after treatment with HGF‐CD3+ T cells, whereas there was no change in this subset in the BLM group and after treatment with nontransfected CD3+ T cells. It is interesting to mention that immunofluorescence staining in the treated rat lung showed less α‐smooth muscle cell actin (αSMA)—a keymarker for myofibroblasts—staining after HGF‐CD3+ T cell treatment in comparison to nontransfected CD3+ T cell treatment and BLM group (Figure S4).
FIGURE 5.
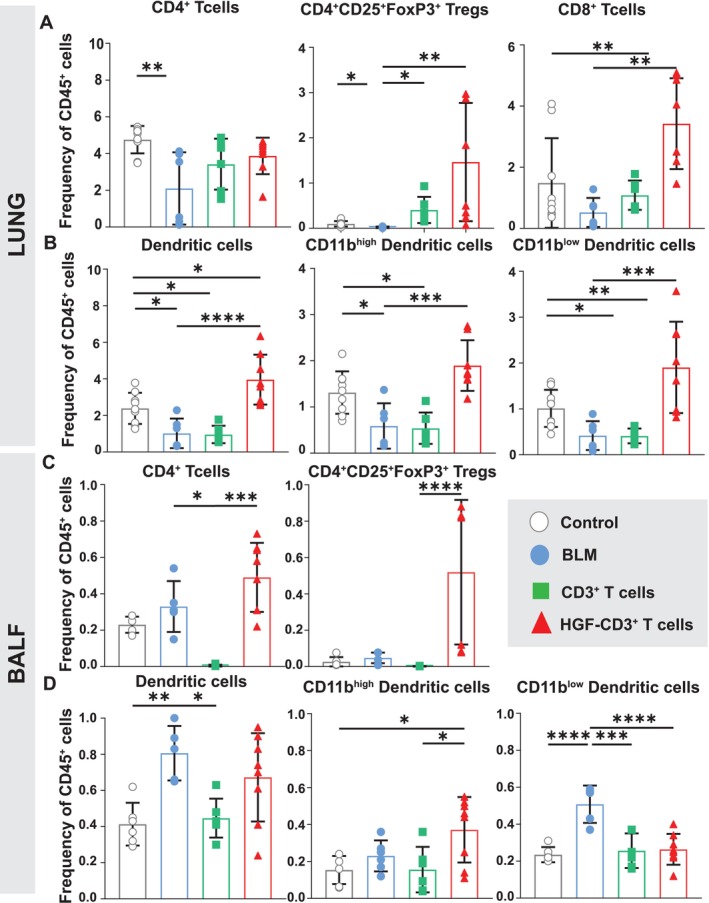
Frequencies of T cell and DC subsets in the lung and BALF of BLM treated mice following treatment with HGF‐CD3 + T and nontransfected CD3 + T cells. (A) Frequency of CD4+, Treg (CD4+CD25+FoxP3+), and CD8+ T cells within total CD45+ of lung parenchyma. On Day 0, mice were either instilled intratracheal with BLM (1.52 U/kg) or with 50 μL of saline (control). Seven days after BLM administration, mice were treated with either HGF‐CD3+ T cells or nontransfected CD3+ T cells or left nontreated and sacrificed 7 days later (BLM Day 14). (B‐D) Frequency of total lung DC (CD11C+MHCIIhigh), CD11bhigh and CD11blow subsets (B), total BALF CD4+ T cells, and Treg (CD4+CD25+FoxP3+) (C) and total BALF DC (CD11C+MHCIIhigh), CD11bhigh and CD11blow subsets (D). Data show mean and SEM, n = 8–12 mice per group, ****p < 0.00005, ***p < 0.0005, **p < 0.005, *p < 0.05.
3.3. Adoptive Transfer of HGF‐CD3+ T Cells Increases Relative Gene Expression of Antifibrotic Mediators in the BLM Mouse Model
In a next step, we investigated specific gene expression in lung tissue homogenates to investigate the mechanism behind BLM driven injury and fibrosis, and the protective effect by adoptive transfer of HGF‐CD3+ T cells (Figure 6). Relative mRNA levels of HGF (Figure 6A), prostaglandin E synthase gene (PTGES) (Figure 6C), IL‐10 (Figure 6D), IL‐13 (Figure 6E), and IL‐17 (Figure 6F) were significantly increased after treatment following treatment with HGF‐CD3+ T in comparison to the BLM group and mice treated with nontransfected CD3+ T cells, whereas TGF‐β gene expression was decreased in both treatment groups compared with the BLM group (Figure 6B).
FIGURE 6.

Relative mRNA expression of key inflammatory and regulatory markers, following treatment with T cells in the course of BLM‐induced lung injury. Relative mRNA expression levels measured by real‐time qPCR in lung tissue homogenates relative to nontreated control group. Relative mRNA expression of (A) HGF, (B) TGF‐β, (C) PTGES, (D) IL‐10, (E) IL‐13, and (F) IL‐17 in lung tissue normalized to the nontreated control group (i.t. instillation of 50‐μL saline) using housekeeping gene RPLP0. Data show mean and SEM, n = 4–6 mice per group, ****p < 0.00005, ***p < 0.0005, **p < 0.005, *p < 0.05.
3.4. HGF‐CD3+ T Cells Increase Apoptosis of TGF‐β–Activated Fibroblasts In Vitro
To further investigate the potential antifibrotic mechanisms of adoptive transfer of HGF‐CD3+ T cells in the lungs of BLM treated mice, we established an in vitro co‐culture model of primary murine fibroblasts and T cells. Prior to co‐culture, the fibroblasts were stimulated with TGF‐β for 24 h, in order to activate and differentiate them into myofibroblast‐like cells [41]. The TGF‐β–treated fibroblasts were cultured with either HGF‐CD3+ T cells or nontransfected CD3+ T cells for 24 h and then, labeled for αSMA, Desmin, CD140α, Collagen1α and Caspase 3 to be further analyzed by flow cytometry (see gating strategy in Figure S7). Double positive Desmin and collagen1α fibroblasts were significantly decreased after treatment with different T cells, i.e., nontransfected CD3+ T cells and HGF‐CD3+ T cells in co‐culture with TGF‐β–treated fibroblasts (Figure 7A). We observed a significant decrease of αSMA+ cells after any T cell treatment (Figure 7B). Mean fluorescence intensity (MFI) was measured for Caspase 3 and in double positive Desmin+ Col1α+ cells. Caspase 3 MFI showed an increase after HGF‐CD3+ T cell incubation in comparison to control TGF‐β fibroblasts (Figure 7C), whereas nontransfected did not induce apoptosis in TGF‐β–treated fibroblasts. In our co‐culture setting, we could observe a significant decrease of Col1α+Desmin+CD140α+ after adding HGF‐CD3+ T cells in comparison to TGF‐β–treated fibroblasts alone and the other T cell treatments (Figure 7D). Col1α+Desmin+CD140α+αSMA+ cells were also decreased in TGF‐β–treated fibroblasts after all T cell treatments (Figure 7E). MFI of caspase 3 in Col1α+Desmin+CD140α+αSMA+ cells was significantly increased after HGF‐CD3+ T cells in TGF‐β–treated fibroblasts (Figure 7F).
FIGURE 7.

Effect of HGF‐transfected and nontransfected T cells on TGF‐β–treated fibroblasts in vitro. (A) Frequency of total Collagen1α+Desmin+ cells; (B) frequency of total Collagen1α+Desmin+αSMA+ cells; (C) frequency of total Collagen1α+Desmin+αSMA+Caspase3+ cells; (D) frequency of total Collagen1α+Desmin+CD140α+ cells; (E) frequency of total Collagen1α+Desmin+CD140α+αSMA cells; (F) frequency of total Collagen1α+Desmin+CD140α+Caspase3+ cells. Twenty‐five thousand primary murine fibroblasts were seeded per well and treated with 8 ng/μL of TGF‐β for 24 h. Fifty thousand of nontransfected, HGF‐transfected or nontransfected CD3+ T cells were added for another 24 h before flow cytometry analysis. Control = TGF‐β–treated fibroblasts. Data show mean + SEM, n = 4–5, *p < 0.05, **p < 0.005, ***p < 0.0005, ****p < 0.00005.
4. Discussion
Our data strongly indicate that BLM‐induced lung injury and fibrosis disrupts immune homeostasis, resulting in reduced populations of CD4+ T cells and Tregs, alongside increased CD8+ T cells within the injured mouse lung. These changes progress in a time‐dependent manner, with the most pronounced alterations observed 14 days post‐BLM injury. Furthermore, our study underscores that adoptive transfer of T cells 7 days after bleomycin injury successfully restores pulmonary homeostasis of CD4+ T cells, Tregs, and DC, leading to reduced collagen deposition and improved lung architecture compared with untreated mice. Moreover, our innovative HGF‐CD3+ T cell therapy demonstrates a significant antifibrotic effect by increasing levels of antifibrotic cytokines in vivo and inducing caspase 3–mediated apoptosis of TGF‐β–treated fibroblasts in vitro and ex vivo. In conclusion, our findings strongly support the potential of T cell therapy as a highly effective and innovative treatment for lung fibrosis.
It is important to mention that in the BLM‐injured mouse lung model, fibrosis induced by a single intratracheal bleomycin instillation begins to regress around Day 21 and is minimal by Day 28, necessitating multiple‐dose regimens to sustain fibrosis [42]. Our study investigated the role of immune cells, particularly T cells, in bleomycin‐induced lung injury, selecting key time points based on dose‐optimization experiments. HGF was administered on Day 7, when fibrosis is established, and evaluated on Day 14, the peak fibrosis stage in control animals, to determine whether early immune modulation could alter disease progression. Because fibrosis naturally resolves by Day 28, administering HGF at Day 21 was not pursued, but we recognize the importance of later time points and plan to explore multiple‐dose models and treatment refinements in future studies.
Our current study sheds light on the crucial aspect of T cell exhaustion, which is a well‐known characteristic of IPF [43], an age‐related disease associated with various pathophysiological changes. Our research unveils notable trends in T cell exhaustion dynamics in the BLM model. There is a time‐dependent reduction in the frequency of CD4+, CD8+ T cells, and CD4+CD25+FoxP3+ Tregs, beginning on Day 10 post‐BLM administration and significantly declining on Day 14 when fibrosis is well established. Interestingly, this decline is absent in the BALF from the BLM‐injured mouse lung, contrasting observations in IPF patients, where the CD4+ and CD8+ T cell ratio in the BALF mirrors that in the lung interstitium [44]. This discrepancy may be attributed to the high degree of inflammation in the mouse lung after BLM administration in the early stages of injury [45]. Moreover, this could also point toward the possible recruitment of circulating helper T cell populations to aid in the recovery from fibrosis in the BLM mouse model [46, 47]. No major change in T lymphocyte subsets was observed in the lung draining lymph nodes (LDLN), pointing even more toward the possibility of recruitment from the circulatory system to the lung after BLM injury (Figure S2).
DC, as professional APC, prime lymphocytes in the LDLN upon encountering potential pathogens in the lung [48]. It has been reported that different DC subsets may show different involvement depending on the specific stage in the fibrotic process [49]. As reported earlier, the CD103+CD11blowDC subset cross‐presents antigen to CD8+ T cells to promote mucosal tolerance [50]. Our results are also in accordance, as we observed a higher frequency of CD11blow DC in the LDLN on BLM Day 7 in comparison to the control group, correlating with a significant increase of CD8+ T cells in the lung on BLM Day 7 (Figure S2). CD11bhigh DC are known to drive the priming of CD4+ T cells [51]. We observed a decreasing trend in the frequency of the CD11bhigh subset in LDLN on Day 14 in comparison to the control, correlating with a decrease of CD4+ T cells and Treg in the lung.
Observing a decrease in CD4+ T cells in BLM model lungs, we hypothesized that replenishing T cells could restore immune balance, initiating repair and reducing fibrosis. Seven days post‐BLM injury, we administered CD3+ T cells intratracheally, resulting in nonsignificant decrease of lung collagen and improved histology by BLM Day 14, accompanied by marginal increases in CD4+, Tregs, and CD8+ T cells. Lung DC showed no changes. However, BAL analysis revealed a significant decrease in DC population postadoptive transfer of CD3+ T cells, with CD11bhigh and CD11blow subsets returning to levels similar in healthy mice.
With recent advances, T cell–based therapies (CAR‐T cells) for treating particular cancers are now routinely employed [52, 53]. Building on this approach, we aimed to modify T cells to increase their efficacy following adoptive transfer in the BLM model with the goal to find a novel therapeutic strategy for treatment of lung fibrosis. HGF plays a crucial role in organogenesis [54], exhibiting antifibrotic and regenerative effects in vitro and preclinical settings, suggesting its significance in lung repair and regeneration [55, 56, 57, 58, 59, 60]. However, the poor half‐life of HGF is a major obstacle [61]. In our previous study, we utilized HGF‐overexpressing bone marrow mesenchymal cells (MSCs) to demonstrate antifibrotic effect in bleomycin‐injured rat lung model [62]. Clinical translation faced hurdles because of age‐related loss of MSCs plasticity, as reported [63], and marginal effects observed in the AETHER clinical trial for IPF patients [64]. To address the limitations of HGF‐transfected MSCs, we explored T cells as modified cells overexpressing HGF for the treatment of pulmonary fibrosis. Murine CD3+ T cells transfected with HGF were administered 7 days post‐BLM injury, resulting in improved lung architecture, reduced total collagen content, and increased HGF concentration in the lung and BALF compared with control mice. However, mice treated with T cells alone also showed a significant decrease of fibrosis scoring and collagen content. One of the main markers of myofibroblasts is αSMA. In our study, we observed an increase in αSMA staining at every time point after BLM treatment. In the second part of this project, although αSMA staining remained detectable following HGF‐CD3+ T cell treatment, it appeared less intense compared with mice treated with nontransfected CD3+ T cells (Figure S4). Another important point of the T cell treatment is to ensure where the cells are migrating after transfer in the animals. Analyzing mouse PCLS, HGF‐CD3+ T cells were still present in the alveolar septa 24 h post‐transfer in BLM‐treated mice (Figure 4). Further research is necessary to ascertain the duration of their retention in the lungs post‐transfer and their subsequent migration pathways. Based on our previous data where we administered mesenchymal stem cells in the bleomycin‐injured lung, we speculate that the T cells should also stay in the injured lung for at least 7–10 days post‐administration [65]. However, a study to evaluate the long‐term effect of adoptive transfer is warranted.
HGF regulates PGE, inhibiting EMT, a profibrotic process [66]. Adoptive transfer in our study restores PTGES synthesis, suggesting an antifibrotic mechanisms. Also, increased IL‐13 and IL‐17 transcription levels were observed. IL‐13, a type 2 cytokine, may have reparative effects, whereas IL‐17, implicated in epithelial cell homeostasis, needs further investigation in the context of HGF [67, 68]. An attempt to target the IL‐13/IL‐4 axis as a treatment for IPF did not show any promising outcomes. IL‐13 is involved in effective repair after acute lung injury, and in the context of acute lung damage, it is suggested that IL‐13 has tissue‐protective functions and regulates epithelial cell responses during type 2 immunity [69]. In our study, the elevated IL‐13 expression may indicate a reparative effect, but the direct impact of HGF on the regulation of IL‐13 requires additional investigation. IL‐17 is a pleiotropic cytokine and has shown both beneficial and detrimental effects in the respiratory tract. In the context of lung function, IL‐17 and IL‐22 play a role in maintaining epithelial cell homeostasis and facilitating repair/regeneration after inflammation [69]. Although the detailed relationship between HGF and IL‐17 remains unexplored, IL‐17 has been found to enhance HGF‐induced growth of vascular epithelial cells. These findings necessitate further investigation to unravel the specific pathways connecting HGF, IL‐17, and IL‐13 [70]. Importantly, nontransfected CD3+ T cell treatments did not lead to significant increases in HGF, IL‐10, IL‐13, and IL‐17. TGF‐β levels were reduced in all treatment groups compared with untreated mice.
Although HGF‐CD3+ T cells did not fully restore local immune cell homeostasis 14 days after BLM exposure, they reversed a considerable amount of pulmonary dysregulation induced by BLM treatment. CAR‐T cells are commonly produced by virus transduction [71], but we have used the nonviral method of in vitro electroporation to transfect HGF with good efficiency, suggesting that this as a valid alternative for T cell modification (Figures S5 and S6). These preliminary data demonstrate the significant reduction of lung fibrosis and improved architecture by adoptive transfer of T cells, especially when combined with HGF treatment. Together, these findings propose a highly effective approach for treating lung fibrosis and promoting repair through a combination of adoptive T cell transfer and HGF treatment.
In vitro studies have demonstrated the ability of HGF to promote epithelial regeneration [55, 58, 72, 73], especially in settings where fibroblasts from IPF patients exhibit defective HGF secretion [74]. PDGF receptor‐α (CD140α) increases expression in pulmonary fibrogenesis, and its inactivation has led to alleviated fibrosis in a BLM model [75]. Moreover, it was also observed that blocking PDGF receptor‐α and ‐β could help alleviate fibrosis in a BLM model [76]. To assess the impact of HGF‐CD3+ T cells on fibroblasts, we cultured murine pulmonary fibroblasts treated with TGF‐β, to induce differentiation to a myofibroblast‐like phenotype [77] (Figure S7). Co‐culture of fibroblasts with HGF‐CD3+ T cells or nontransfected CD3+ T cells reduced the frequency of αSMA+ cells and collagen production. In our co‐culture experiment, HGF induced myofibroblasts apoptosis, confirmed by increased Caspase 3 activity. We also observed reduced collagen production in TGF‐β–treated fibroblasts co‐cultured with HGF‐CD3+ T cells. To verify this phenomenon in our treatment, we analyzed the expression of Caspase 3 and observed increased Caspase 3 activity in co‐cultures of TGF‐β–treated fibroblasts and HGF‐CD3+ T cells. Live cell imaging on co‐cultures demonstrated affinity of HGF‐CD3+ T cells toward TGF‐β–treated fibroblasts, and close contact between both cell types was observed. Our findings suggest a decrease in the frequency of αSMA+ cells, as well as a reduction in collagen deposition in co‐cultures of HGF‐CD3+ T cells and TGF‐β–treated fibroblasts. This outcome likely results from enhanced myofibroblasts apoptosis in the presence of transfected T cells. Fibroblast–T cell interaction, crucial in tissue remodeling, occurs in a contact‐dependent manner and regulates immune responses. Activated T cells decrease collagen production, whereas CD8+ T cells induce myofibroblasts apoptosis in renal fibrosis [70].
Our study has some limitations, particularly the electroporation method, which was shown to activate T cells. Ex vivo FACS experiments revealed increased activation of the different T cell subsets, indicated by elevated mean fluorescence intensity of CD25 and CD69, post‐electroporation (with or without plasmid), but not in nonelectroporated CD3+ T cells (Figure S9). This suggests that electroporation alone can induce T cell activation, warranting further investigation. This could explain why fibrosis scoring was decreased following treatment with nontransfected CD3+ T cells, as these cells were not activated, having bypassed the electroporation process. In contrast, HGF‐CD3+ T cell treatment, which likely involved cell activation through electroporation, may have diminished the beneficial effects of HGF release on fibrosis because of the high activation levels in the T cells. Testing a viral vector for T cell activation would also be valuable. We initially transferred the whole pool of CD3+ T cells because of difficulty in acquiring sufficient number of Tregs to see if HGF‐transfected CD3+ T cells could alleviate fibrosis in the BLM model. Investigating a later treatment time point may also benefit fibrosis reversal. Given that IPF primarily affects older individuals, using aged mice to test our refined treatment approach would be interesting. Additionally, experiments are needed to identify which cells are targeted by the released HGF and determine how long T cells remain in the lungs post‐transfer. This is crucial because the main receptor for HGF, c‐Met, is involved in many cancerous processes. Careful investigation of T cell retention in the lungs is needed to avoid activating c‐Met signaling throughout the body.
4.1. Perspectives and Significance
Our feasibility study demonstrates that adoptive transfer of HGF‐CD3+ T cells is a promising therapy for reversing established lung fibrosis in a murine model of bleomycin‐induced lung injury. Despite limitations such as the short experiment duration and the use of total CD3+ T cells instead of a subset of Treg, we anticipate refining T cell transfection techniques, identifying more efficient T cell subsets, and exploring additional antifibrotic mediators beyond HGF in follow‐up experiments. These findings will offer insights for enhancing antifibrotic therapeutics and exploring novel cell‐based treatments for IPF.
Author Contributions
SMM performed all experiments. CF and MS assisted in experimental work. AG, FB, and KF designed and supervised the project. SM contributed to the fibrosis scoring of lung sections. All authors contributed to the design of the study, the discussion, and manuscript preparation.
Disclosure
The authors declare that the research was conducted in the absence of any commercial or financial relationships that could be construed as a potential conflict of interest.
Supporting information
Figure S1. Gating strategy for analysis of single cell suspensions from LP, LDLN and BAL by flow cytometry. Following gating of single cells, debris and dead cells were excluded (SSC/FSC, Zombie Aqua/SSC). Leukocytes were identified employing a SSC/CD45 plot for both gating strategies (i.e. T cells and other immune cells). A. Gating strategy for T cells: following gating of leukocytes (CD45+; CD45/SSC plot) CD3+ cells were gated (CD3/CD45 dot plot), followed by gating for CD4+ and CD8+ T cells (CD4/CD8 plot). Finally, in order to gate the Treg cell population, CD4+ cells were analysed for CD25 and FoxP3 expression and CD25+FoxP3+ cells were gated (CD25/FoxP3 Plot). B. Gating strategy for other immune cells: Following gating of leukocytes (CD45+; CD45/SSC plot), the Ly6G+ population was selected to gate for neutrophils (Ly6G/SSC plot). The negative population was selected for further analysis of macrophage (CD11chiMHCIIlo; AM) and dendritic cell (CD11chiMHCIIhi; DC) populations (MHCII/CD11c plot). The DC population was further analysed based on expression of CD11b (CD11b/SSC plot). Plots show representative gating strategy done in LP.
Figure S2. Frequencies of T cell and DC subsets in LDLN of mice instilled with BLM after receiving different T cell treatments. A. Frequency of lung CD4+ T cells, Treg (CD4+CD25+FoxP3+), CD8+ T cells relative to total CD45+ cells. Mice were either instilled intratracheal with BLM (1.52 U/kg) or with 50 μL of saline (control) and sacrificed on day 7 (D7), day 10 (D10) and day 14 (D14) following instillation. B. Frequency of LDLN DC (CD11C+MHCIIhigh) and CD11bhigh and CD11blow subsets relative to total CD45+ cells. C. Frequency relative to CD45+ cells in LDLN CD4+ T cells, Treg (CD4+CD25+FoxP3+), CD8+ T cells. Mice were either instilled intratracheal with BLM (1.52 U/kg) or with 50 μL of saline (control) on Day 0. Mice were treated with either HGF transfected CD3+ T cells or non‐transfected CD3+ T cells on day 7 after BLM instillation. Seven days after T cell administration (BLM) mice were sacrificed. D. Frequency of lung DC (C D11C+MHCIIhigh) and CD11bhigh and CD11blow subsets relative to total CD45+ cells. Groups received treatment as outlined under C. All treated mice were sacrificed 7 days after treatment (BLM). Data show mean and SEM, n = 4–8 mice per group, **** p < 0.00005, *** p < 0.0005, ** p < 0.005, * p < 0.05
Figure S3. Sirius Red staining of BLM‐treated mice lungs 7, 10 and 14 days post injury and treated with HGF‐ and only CD3+ T cells imaged by widefield microscopy. A. Sirius Red staining of control mouse lung. Mice were treated with BLM. Seven days after BLM treatment, HGF‐ or only‐CD3+ T cells were instilled intratracheal, and mice were sacrificed 7 days later. The lungs were fixed in PFA 4% before paraffin embedding. The red staining shows the collagen fibers. B, C, D. BLM treated mouse lung at 7, 10 and 14 post instillation. E. HGF‐CD3+ T cells treated BLM mouse lung and F. CD3+ T cells treated BLM mouse lung.
Figure S4. Immunofluorescence staining of BLM‐treated mice lungs treated with HGF‐ and only CD3 + T cells. Mice were either instilled intratracheal with 50 μL of saline (control), or with BLM (1.52 U/kg) and sacrificed on day 7, day 10 and day 14 following instillation. Treatments; Mice were treated with BLM. Seven days after BLM treatment, HGF‐ or only‐CD3+ T cells were instilled intratracheal and mice were sacrificed 7 days later. The lungs were fixed in PFA 4% before paraffin embedding. Green: actin+ filaments, red: α smooth muscle actin (αSMA; myofibroblasts) (arrowheads), blue: DAPI (nucleus). Sections were scanned using a fluorescence microscope (Nikon Ti‐E Eclipse).
Figure S5. Frequencies of T cell subsets in Lung, BALF and LDLN after HGF‐T cells plus electroporation treatments in mice instilled with BLM. A. Frequency of lung CD4+ T cells, Treg (CD4+CD25+FoxP3+), CD8+ T cells relative to total CD45+ cells. Mice were either instilled intratracheal with BLM (1.52 U/kg) or with 50 μL of saline (control), on Day 0. Mice were treated with HGF instillation plus extracorporeal electroporation on day 7 after BLM instillation. Seven days after T cell administration (BLM) mice were sacrificed. B. Frequency of BALF CD4+, Treg (CD4+CD25+FoxP3+), CD8+ T cells relative to CD45+ cells. Groups received treatment as outlined under A. C. Frequency of LDLN CD4+ T cells, Treg (CD4+CD25+FoxP3+), CD8+ T cells relative to total CD45+ cells. Groups received treatment as outlined under A. All treated mice were sacrificed 7 days after treatment (BLM). Data show mean and SEM, n = 4–8 mice per group, **** p < 0.00005, *** p < 0.0005, ** p < 0.005, * p < 0.05
Figure S6. Frequencies of DC subsets in LP, BALF and LDLN after treatment with HGF‐T cells plus electroporation treatments in mice instilled with BLM. A. Frequency of Lung DC (CD11C+MHCIIhigh) and CD11bhigh and CD11blow subsets relative to total CD45+ cells. Mice were either instilled intratracheal with BLM (1.52 U/kg) or with 50 μL of saline (control), on Day 0. Mice were treated with HGF instillation plus extracorporeal electroporation on day 7 after BLM instillation. Seven days after T cell administration (BLM) mice were sacrificed. B. Frequency of BALF DC (CD11C+MHCIIhigh) and CD11bhigh and CD11blow subsets relative to total CD45+ cells. Groups received treatment as outlined under A. C. Frequency of LDLN DC (CD11C+MHCIIhigh) and CD11bhigh and CD11blow subsets relative to total CD45+ cells. Groups received treatment as outlined under A. All treated mice were sacrificed 7 days after treatment (BLM). Data show mean and SEM, n = 4–8 mice per group, **** p < 0.00005, *** p < 0.0005, ** p < 0.005, * p < 0.05
Figure S7. Gating strategy for analysis of co‐cultures of myofibroblasts or fibroblasts with HGF‐, or empty‐vector, or non‐transfected CD3 + T cells. Non‐lymphocytic cells were identified by size exclusion. Following gating of single cells, debris and dead cells were excluded (SSC‐A/SSC‐H, Zombie Aqua/SSC). Successively, alpha smooth muscle actin (αSMA)+ cells were gated followed by gating of Desmin+ cells to identify fibroblasts. Then, cells double positive for collagen and Caspase 3 were gated.
Figure S8. Percentage of GFP + T cells after transfection with electroporation, analysed by flow cytometry. CD3+ T cells isolated from murine splenocytes plus specific plasmids underwent electroporation (EP) with the Nucleofector Transfector machine. Two millions CD3+ T cells were added and the first machine program was run for 10s. Groups were prepared as follows: Control = no EP, CD3+ T cell = EP, GFP kit only = CD3+ T cells + GFP from the manufacturer kit, HGF‐CD3+ T cells = CD3+ T cells + plasmid HGF.
Figure S9. E xpression (Mean Fluorescence Intensity; MFI) of the T cell activation markers CD25 and CD69 in different subsets of transfected T cells. CD3+ T cells isolated from murine splenocytes plus specific plasmids underwent electroporation (EP) with the Nucleofector Transfector machine. Two millions CD3+ T cells were added, and the first machine program was run for 10s. Flow cytometry analysis and gating strategy were performed as stated in Supplemental Figure 1A. Green = non transfected CD3+ T cells (control), black = electroporated CD3+ T cells without plasmid and red = HGF transfected CD3+ T cells. Data show mean and SEM, n = 3 sample per group, ****p < 0.00005*** p < 0.0005, ** p < 0.005, * p < 0.05
Table S1. List of employed anti‐mouse antibodies for flow cytometry
Table S2. List of employed real‐time quantitative PCR primers.
Acknowledgements
The authors are grateful for the valuable scientific inputs and help from Dr. Carlos Machahua, Dr. Mario Amacker, and Sandra Barnowski. Many thanks to the Microscopy Imaging Center (MIC) of the University of Bern and the Live Cell Imaging (LCI) Core facility of the Department of BioMedical Research for their support with microscopy techniques. Many thanks to the Flow Cytometry and Cell Sorting Facility (FCCS) of the University of Bern for the performance of flow cytometry with devices supported by the FCCS.
Funding: This work was supported by the Swiss Lungenliga, the Bernese Lungenliga, and the Directorate Lehre Forschung from the University hospital of Bern, Inselspital.
Contributor Information
Amiq Gazdhar, Email: amiq.gazdhar@unibe.ch.
Fabian Blank, Email: fabian.blank@unibe.ch.
Data Availability Statement
Data will be made available upon reasonable request.
References
- 1. Gross T. J. and Hunninghake G. W., “Idiopathic Pulmonary Fibrosis,” New England Journal of Medicine 345 (2001): 517–525, 10.1056/NEJMRA003200. [DOI] [PubMed] [Google Scholar]
- 2. Lee A. S., Mira‐Avendano I., Ryu J. H., and Daniels C. E., “The Burden of Idiopathic Pulmonary Fibrosis: An Unmet Public Health Need,” Respiratory Medicine 108 (2014): 955–967, 10.1016/J.RMED.2014.03.015. [DOI] [PubMed] [Google Scholar]
- 3. Navaratnam V., Fleming K. M., West J., et al., “The Rising Incidence of Idiopathic Pulmonary Fibrosis in the UK,” Thorax 66 (2011): 462–467, 10.1136/THX.2010.148031. [DOI] [PubMed] [Google Scholar]
- 4. Finnerty J. P., Ponnuswamy A., Dutta P., Abdelaziz A., and Kamil H., “Efficacy of Antifibrotic Drugs, Nintedanib and Pirfenidone, in Treatment of Progressive Pulmonary Fibrosis in Both Idiopathic Pulmonary Fibrosis (IPF) and Non‐IPF: A Systematic Review and Meta‐Analysis,” BMC Pulmonary Medicine 21 (2021): 411, 10.1186/S12890-021-01783-1. [DOI] [PMC free article] [PubMed] [Google Scholar]
- 5. Checa M., Hagood J. S., Velazquez‐Cruz R., et al., “Cigarette Smoke Enhances the Expression of Profibrotic Molecules in Alveolar Epithelial Cells,” PLoS ONE 11 (2016): e0150383, 10.1371/JOURNAL.PONE.0150383. [DOI] [PMC free article] [PubMed] [Google Scholar]
- 6. Behr J. and Nowak D., “Tobacco Smoke and Respiratory Disease [Online],” 14 Feb. 2025, https://www.researchgate.net/publication/251883915.
- 7. King T. E., Pardo A., and Selman M., “Idiopathic Pulmonary Fibrosis,” Lancet 378 (2011): 1949–1961, 10.1016/S0140-6736(11)60052-4. [DOI] [PubMed] [Google Scholar]
- 8. Glass D. S., Grossfeld D., Renna H. A., et al., “Idiopathic Pulmonary Fibrosis: Current and Future Treatment,” Clinical Respiratory Journal 16 (2022): 84–96, 10.1111/CRJ.13466. [DOI] [PMC free article] [PubMed] [Google Scholar]
- 9. Desai O., Winkler J., Minasyan M., and Herzog E. L., “The Role of Immune and Inflammatory Cells in Idiopathic Pulmonary Fibrosis,” Frontiers in Medicine 5 (2018): 43, 10.3389/FMED.2018.00043. [DOI] [PMC free article] [PubMed] [Google Scholar]
- 10. Wynn T. A., “Integrating Mechanisms of Pulmonary Fibrosis,” Journal of Experimental Medicine 208 (2011): 1339–1350, 10.1084/JEM.20110551. [DOI] [PMC free article] [PubMed] [Google Scholar]
- 11. Chavez‐Galan L., Becerril C., Ruiz A., et al., “Fibroblasts From Idiopathic Pulmonary Fibrosis Induce Apoptosis and Reduce the Migration Capacity of T Lymphocytes,” Frontiers in Immunology 13 (2022): 820347, 10.3389/FIMMU.2022.820347/BIBTEX. [DOI] [PMC free article] [PubMed] [Google Scholar]
- 12. Lacy S. H., Epa A. P., Pollock S. J., et al., “Activated Human T Lymphocytes Inhibit TGFβ‐Induced Fibroblast to Myofibroblast Differentiation via Prostaglandins D2 and E2 ,” American Journal of Physiology. Lung Cellular and Molecular Physiology 314 (2018): L569–L582, 10.1152/AJPLUNG.00565.2016. [DOI] [PMC free article] [PubMed] [Google Scholar]
- 13. Butler M. W. and Keane M. P., “The Role of Immunity and Inflammation in IPF Pathogenesis.”
- 14. Karman Id J., Wang J., Bodea C., and Cao S., Levesque M. C., “Lung Gene Expression and Single Cell Analyses Reveal Two Subsets of Idiopathic Pulmonary Fibrosis (IPF) Patients Associated With Different Pathogenic Mechanisms.” [DOI] [PMC free article] [PubMed]
- 15. Strieter R. M. and Keane M. P., “Innate Immunity Dictates Cytokine Polarization Relevant to the Development of Pulmonary Fibrosis,” Journal of Clinical Investigation 114 (2004): 165–168, 10.1172/JCI22398. [DOI] [PMC free article] [PubMed] [Google Scholar]
- 16. Spagnolo P., Tonelli R., Samarelli A. V., et al., “The Role of Immune Response in the Pathogenesis of Idiopathic Pulmonary Fibrosis: Far Beyond the Th1/Th2 Imbalance,” Expert Opinion on Therapeutic Targets 26 (2022): 617–631, 10.1080/14728222.2022.2114897. [DOI] [PubMed] [Google Scholar]
- 17. Selman M. and Pardo A., “Idiopathic Pulmonary Fibrosis: From Common Microscopy to Single‐Cell Biology and Precision Medicine,” American Journal of Respiratory and Critical Care Medicine 209 (2024): 1074–1081, 10.1164/RCCM.202309-1573PP/SUPPL_FILE/DISCLOSURES.PDF. [DOI] [PubMed] [Google Scholar]
- 18. Galati D., De Martino M., Trotta A., et al., “Peripheral Depletion of NK Cells and Imbalance of the Treg/Th17 Axis in Idiopathic Pulmonary Fibrosis Patients,” Cytokine 66 (2014): 119–126, 10.1016/J.CYTO.2013.12.003. [DOI] [PubMed] [Google Scholar]
- 19. Geng J. J., Zhang K., Chen L. N., et al., “Enhancement of CD147 on M1 Macrophages Induces Differentiation of Th17 Cells in the Lung Interstitial Fibrosis,” Biochimica et Biophysica Acta (BBA) ‐ Molecular Basis of Disease 1842 (2014): 1770–1782, 10.1016/J.BBADIS.2014.06.008. [DOI] [PubMed] [Google Scholar]
- 20. Chakraborty K., Chatterjee S., and Bhattacharyya A., “Modulation of CD11c+ Lung Dendritic Cells in Respect to TGF‐β in Experimental Pulmonary Fibrosis,” Cell Biology International 41 (2017): 991–1000, 10.1002/CBIN.10800. [DOI] [PubMed] [Google Scholar]
- 21. Chen Q. H., Wu F., Liu L., et al., “Mesenchymal Stem Cells Regulate the Th17/Treg Cell Balance Partly Through Hepatocyte Growth Factor In Vitro,” Stem Cell Research & Therapy 11 (2020): 1–11, 10.1186/S13287-020-01612-Y/FIGURES/7. [DOI] [PMC free article] [PubMed] [Google Scholar]
- 22. Vermaelen K. and Pauwels R., “Pulmonary Dendritic Cells,” American Journal of Respiratory and Critical Care Medicine 172 (2012): 530–551, 10.1164/RCCM.200410-1384SO. [DOI] [PubMed] [Google Scholar]
- 23. Banchereau J., Briere F., Caux C., et al., “Immunobiology of Dendritic Cells,” Annual Review of Immunology 18 (2000): 767–811, 10.1146/ANNUREV.IMMUNOL.18.1.767. [DOI] [PubMed] [Google Scholar]
- 24. Vermaelen K. Y., Carro‐Muino I., Lambrecht B. N., and Pauwels R. A., “Specific Migratory Dendritic Cells Rapidly Transport Antigen From the Airways to the Thoracic Lymph Nodes,” Journal of Experimental Medicine 193 (2001): 51–60, 10.1084/JEM.193.1.51. [DOI] [PMC free article] [PubMed] [Google Scholar]
- 25. Freynet O., Marchal‐Sommé J., Jean‐Louis F., et al., “Human Lung Fibroblasts May Modulate Dendritic Cell Phenotype and Function: Results From a Pilot In Vitro Study,” Respiratory Research 17 (2016): 1–6, 10.1186/S12931-016-0345-4. [DOI] [PMC free article] [PubMed] [Google Scholar]
- 26. Bocchino M., Zanotta S., Capitelli L., and Galati D., “Dendritic Cells Are the Intriguing Players in the Puzzle of Idiopathic Pulmonary Fibrosis Pathogenesis,” Frontiers in Immunology 12 (2021): 664109, 10.3389/FIMMU.2021.664109. [DOI] [PMC free article] [PubMed] [Google Scholar]
- 27. Bantsimba‐Malanda C., Marchal‐Sommé J., Goven D., et al., “A Role for Dendritic Cells in Bleomycin‐Induced Pulmonary Fibrosis in Mice?,” American Journal of Respiratory and Critical Care Medicine 182 (2012): 385–395, 10.1164/RCCM.200907-1164OC. [DOI] [PubMed] [Google Scholar]
- 28. Mehrabadi A. Z., Ranjbar R., Farzanehpour M., et al., “Therapeutic Potential of CAR T Cell in Malignancies: A Scoping Review,” Biomedicine & Pharmacotherapy 146 (2022): 112512, 10.1016/J.BIOPHA.2021.112512. [DOI] [PubMed] [Google Scholar]
- 29. Shukla M. N., Rose J. L., Ray R., Lathrop K. L., Ray A., and Ray P., “Hepatocyte Growth Factor Inhibits Epithelial to Myofibroblast Transition in Lung Cells via Smad7,” American Journal of Respiratory Cell and Molecular Biology 40 (2012): 643–653, 10.1165/RCMB.2008-0217OC. [DOI] [PMC free article] [PubMed] [Google Scholar]
- 30. Nakamura T., Sakai K., Nakamura T., and Matsumoto K., “Hepatocyte Growth Factor Twenty Years on: Much More Than a Growth Factor,” Journal of Gastroenterology and Hepatology 26, no. Suppl 1 (2011): 188–202, 10.1111/J.1440-1746.2010.06549.X. [DOI] [PubMed] [Google Scholar]
- 31. Fytianos K., Schliep R., Mykoniati S., et al., “Anti‐Fibrotic Effect of SDF‐1β Overexpression in Bleomycin‐Injured Rat Lung,” Pharmaceutics 14 (2022): 1803, 10.3390/PHARMACEUTICS14091803. [DOI] [PMC free article] [PubMed] [Google Scholar]
- 32. Seyran M., Melanie S., Philip S., Amiq G., and Fabian B., “Allies or Enemies? The Effect of Regulatory T Cells and Related T Lymphocytes on the Profibrotic Environment in Bleomycin‐Injured Lung Mouse Models,” Clinical and Experimental Medicine 23 (2022): 1075–1088. [DOI] [PMC free article] [PubMed] [Google Scholar]
- 33. Orlando F., Paolini C., Agarbati S., et al., “Induction of Mouse Lung Injury by Endotracheal Injection of Bleomycin,” JoVE (Journal of Visualized Experiments) 2019 (2019): e58922, 10.3791/58922. [DOI] [PubMed] [Google Scholar]
- 34. Moroncini G., Paolini C., Orlando F., et al., “Mesenchymal Stromal Cells From Human Umbilical Cord Prevent the Development of Lung Fibrosis in Immunocompetent Mice,” PLoS ONE 13 (2018): e0196048, 10.1371/JOURNAL.PONE.0196048. [DOI] [PMC free article] [PubMed] [Google Scholar]
- 35. Woessner J. F., “The Determination of Hydroxyproline in Tissue and Protein Samples Containing Small Proportions of This Imino Acid,” Archives of Biochemistry and Biophysics 93 (1961): 440–447, 10.1016/0003-9861(61)90291-0. [DOI] [PubMed] [Google Scholar]
- 36. Hübner R. H., Gitter W., El Mokhtari N. E., et al., “Standardized Quantification of Pulmonary Fibrosis in Histological Samples,” BioTechniques 44 (2008): 507–517, 10.2144/000112729. [DOI] [PubMed] [Google Scholar]
- 37. Khan P., Fytianos K., Tamò L., et al., “Culture of Human Alveolar Epithelial Type II Cells by Sprouting 06 Biological Sciences 0601 Biochemistry and Cell Biology,” Respiratory Research 19 (2018): 1–7, 10.1186/S12931-018-0906-9/FIGURES/2. [DOI] [PMC free article] [PubMed] [Google Scholar]
- 38. Lyons‐Cohen M. R., Nakano H., Thomas S. Y., and Cook D. N., “Imaging Precision‐Cut Lung Slices to Visualize Leukocyte Localization and Trafficking,” Methods in Molecular Biology 1799 (2018): 237–246, 10.1007/978-1-4939-7896-0_18/FIGURES/4. [DOI] [PMC free article] [PubMed] [Google Scholar]
- 39. Guler S. A., Machahua C., Geiser T. K., et al., “Dehydroepiandrosterone in Fibrotic Interstitial Lung Disease: A Translational Study,” Respiratory Research 23 (2022): 1–11, 10.1186/S12931-022-02076-9/TABLES/3. [DOI] [PMC free article] [PubMed] [Google Scholar]
- 40. Altin J. G. and Sloan E. K., “The Role of CD45 and CD45‐Associated Molecules in T Cell Activation,” Immunology and Cell Biology 75 (1997): 430–445, 10.1038/icb.1997.68. [DOI] [PubMed] [Google Scholar]
- 41. Midgley A. C., Rogers M., Hallett M. B., et al., “Transforming Growth Factor‐β1 (TGF‐β1)‐Stimulated Fibroblast to Myofibroblast Differentiation Is Mediated by Hyaluronan (HA)‐Facilitated Epidermal Growth Factor Receptor (EGFR) and CD44 Co‐Localization in Lipid Rafts,” Journal of Biological Chemistry 288 (2013): 14824–14838, 10.1074/JBC.M113.451336. [DOI] [PMC free article] [PubMed] [Google Scholar]
- 42. Izbicki G., Segel M. J., Christensen T. G., Conner M. W., and Breuer R., “Time Course of Bleomycin‐Induced Lung Fibrosis,” International Journal of Experimental Pathology 83 (2002): 111–119, 10.1046/J.1365-2613.2002.00220.X. [DOI] [PMC free article] [PubMed] [Google Scholar]
- 43. Shenderov K., Collins S. L., Powell J. D., and Horton M. R., “Immune Dysregulation as a Driver of Idiopathic Pulmonary Fibrosis,” Journal of Clinical Investigation 131 (2021): 143226, 10.1172/JCI143226. [DOI] [PMC free article] [PubMed] [Google Scholar]
- 44. Papiris S. A., Kollintza A., Kitsanta P., et al., “Relationship of BAL and Lung Tissue CD4+ and CD8+ T Lymphocytes, and Their Ratio in Idiopathic Pulmonary Fibrosis,” Chest 128 (2005): 2971–2977, 10.1016/S0012-3692(15)52722-0. [DOI] [PubMed] [Google Scholar]
- 45. O'Dwyer D. N. and Moore B. B., “Animal Models of Pulmonary Fibrosis,” in Methods in Molecular Biology, (Springer New York, 2018): 363–378, 10.1007/978-1-4939-8570-8_24. [DOI] [PubMed] [Google Scholar]
- 46. Reinert T., Baldotto C. S., Nunes F. A., and Scheliga A. A., “Bleomycin‐Induced Lung Injury,” Journal of Cancer Research 2013 (2013): 480608, 10.1155/2013/480608. [DOI] [Google Scholar]
- 47. Luther S. A., Bidgol A., Hargreaves D. C., et al., “Differing Activities of Homeostatic Chemokines CCL19, CCL21, and CXCL12 in Lymphocyte and Dendritic Cell Recruitment and Lymphoid Neogenesis,” Journal of Immunology 169 (2002): 424–433, 10.4049/JIMMUNOL.169.1.424. [DOI] [PubMed] [Google Scholar]
- 48. Torti N., Walton S. M., Murphy K. M., and Oxenius A., “Batf3 Transcription Factor‐Dependent DC Subsets in Murine CMV Infection: Differential Impact on T‐Cell Priming and Memory Inflation,” European Journal of Immunology 41, no. 9 (2011): 2612–2618. [DOI] [PubMed] [Google Scholar]
- 49. Dudziak D., Kamphorst A. O., Heidkamp G. F., et al., “Differential Antigen Processing by Dendritic Cell Subsets In Vivo,” Science (1979) 315 (2007): 107–111, 10.1126/SCIENCE.1136080. [DOI] [PubMed] [Google Scholar]
- 50. Edelson B. T., Wumesh K. C., Juang R., et al., “Peripheral CD103+ Dendritic Cells Form a Unified Subset Developmentally Related to CD8α+ Conventional Dendritic Cells,” Journal of Experimental Medicine 207 (2010): 823–836, 10.1084/JEM.20091627. [DOI] [PMC free article] [PubMed] [Google Scholar]
- 51. Fahlén‐Yrlid L., Gustafsson T., Westlund J., et al., “CD11chigh Dendritic Cells Are Essential for Activation of CD4+ T Cells and Generation of Specific Antibodies Following Mucosal Immunization,” Journal of Immunology 183 (2009): 5032–5041, 10.4049/JIMMUNOL.0803992. [DOI] [PubMed] [Google Scholar]
- 52. Sterner R. C. and Sterner R. M., “CAR‐T Cell Therapy: Current Limitations and Potential Strategies,” Blood Cancer Journal 11 (2021): 1–11, 10.1038/s41408-021-00459-7. [DOI] [PMC free article] [PubMed] [Google Scholar]
- 53. Feins S., Kong W., Williams E. F., Milone M. C., and Fraietta J. A., “An Introduction to Chimeric Antigen Receptor (CAR) T‐Cell Immunotherapy for Human Cancer,” American Journal of Hematology 94 (2019): S3–S9, 10.1002/AJH.25418. [DOI] [PubMed] [Google Scholar]
- 54. Ohmichi H., Koshimizu U., Matsumoto K., and Nakamura T., “Hepatocyte Growth Factor (HGF) Acts as a Mesenchyme‐Derived Morphogenic Factor During Fetal Lung Development,” Development 125 (1998): 1315–1324, 10.1242/DEV.125.7.1315. [DOI] [PubMed] [Google Scholar]
- 55. Panganiban R. A. M. and Day R. M., “Hepatocyte Growth Factor in Lung Repair and Pulmonary Fibrosis,” Acta Pharmacologica Sinica 32 (2010): 12–20, 10.1038/aps.2010.90. [DOI] [PMC free article] [PubMed] [Google Scholar]
- 56. Nita I., Hostettler K., Tamo L., et al., “Hepatocyte Growth Factor Secreted by Bone Marrow Stem Cell Reduce ER Stress and Improves Repair in Alveolar Epithelial II Cells,” Scientific Reports 7 (2017): 1–14, 10.1038/srep41901. [DOI] [PMC free article] [PubMed] [Google Scholar]
- 57. Dohi M., Hasegawa T., Yamamoto K., and Marshall B. C., “Hepatocyte Growth Factor Attenuates Collagen Accumulation in a Murine Model of Pulmonary Fibrosis,” American Journal of Respiratory and Critical Care Medicine 162 (2012): 2302–2307, 10.1164/AJRCCM.162.6.9908097. [DOI] [PubMed] [Google Scholar]
- 58. Lee Y. H., Suzuki Y. J., Griffin A. J., and Day R. M., “Hepatocyte Growth Factor Regulates Cyclooxygenase‐2 Expression via β‐Catenin, Akt, and p42/p44 MAPK in Human Bronchial Epithelial Cells,” American Journal of Physiology. Lung Cellular and Molecular Physiology 294 (2008): 778–786, 10.1152/AJPLUNG.00410.2007. [DOI] [PMC free article] [PubMed] [Google Scholar]
- 59. Watanabe M., Ebina M., Orson F. M., et al., “Hepatocyte Growth Factor Gene Transfer to Alveolar Septa for Effective Suppression of Lung Fibrosis,” Molecular Therapy 12 (2005): 58–67, 10.1016/j.ymthe.2005.02.019. [DOI] [PubMed] [Google Scholar]
- 60. Ido A., Moriuchi A., Kim I., et al., “Pharmacokinetic Study of Recombinant Human Hepatocyte Growth Factor Administered in a Bolus Intravenously or via Portal Vein,” Hepatology Research 30 (2004): 175–181, 10.1016/J.HEPRES.2004.09.002. [DOI] [PubMed] [Google Scholar]
- 61. Crosby L. M. and Waters C. M., “Epithelial Repair Mechanisms in the Lung,” American Journal of Physiology. Lung Cellular and Molecular Physiology 298 (2010): 715–731, 10.1152/AJPLUNG.00361.2009. [DOI] [PMC free article] [PubMed] [Google Scholar]
- 62. Gazdhar A., Susuri N., Hostettler K., et al., “HGF Expressing Stem Cells in Usual Interstitial Pneumonia Originate From the Bone Marrow and Are Antifibrotic,” PLoS ONE 8 (2013): e65453, 10.1371/JOURNAL.PONE.0065453. [DOI] [PMC free article] [PubMed] [Google Scholar]
- 63. Zupan J., Strazar K., Kocijan R., Nau T., Grillari J., and Marolt P. D., “Age‐Related Alterations and Senescence of Mesenchymal Stromal Cells: Implications for Regenerative Treatments of Bones and Joints,” Mechanisms of Ageing and Development 198 (2021): 111539, 10.1016/J.MAD.2021.111539. [DOI] [PubMed] [Google Scholar]
- 64. Glassberg M. K., Minkiewicz J., Toonkel R. L., et al., “Allogeneic Human Mesenchymal Stem Cells in Patients With Idiopathic Pulmonary Fibrosis via Intravenous Delivery (AETHER): A Phase I Safety Clinical Trial,” Chest 151 (2017): 971–981, 10.1016/J.CHEST.2016.10.061. [DOI] [PMC free article] [PubMed] [Google Scholar]
- 65. Gazdhar A., Fachinger P., Van Leer C., et al., “Gene Transfer of Hepatocyte Growth Factor by Electroporation Reduces Bleomycin‐Induced Lung Fibrosis,” American Journal of Physiology. Lung Cellular and Molecular Physiology 292 (2007): L529–L536, 10.1152/AJPLUNG.00082.2006. [DOI] [PubMed] [Google Scholar]
- 66. Bozyk P. D. and Moore B. B., “Prostaglandin E2 and the Pathogenesis of Pulmonary Fibrosis,” American Journal of Respiratory Cell and Molecular Biology 45 (2012): 445–452, 10.1165/RCMB.2011-0025RT. [DOI] [PMC free article] [PubMed] [Google Scholar]
- 67. Zhu Z., Homer R. J., Wang Z., et al., “Pulmonary Expression of Interleukin‐13 Causes Inflammation, Mucus Hypersecretion, Subepithelial Fibrosis, Physiologic Abnormalities, and Eotaxin Production,” Journal of Clinical Investigation 103 (1999): 779–788, 10.1172/JCI5909. [DOI] [PMC free article] [PubMed] [Google Scholar]
- 68. Benkhoucha M., Santiago‐Raber M. L., Schneiter G., et al., “Hepatocyte Growth Factor Inhibits CNS Autoimmunity by Inducing Tolerogenic Dendritic Cells and CD25+Foxp3+ Regulatory T Cells,” Proceedings of the National Academy of Sciences of the United States of America 107 (2010): 6424–6429, 10.1073/PNAS.0912437107. [DOI] [PMC free article] [PubMed] [Google Scholar]
- 69. Gurczynski S. J. and Moore B. B., “IL‐17 in the Lung: The Good, the Bad, and the Ugly,” American Journal of Physiology. Lung Cellular and Molecular Physiology 314 (2018): L6–L16, 10.1152/AJPLUNG.00344.2017. [DOI] [PMC free article] [PubMed] [Google Scholar]
- 70. Takahashi M., Ota S., Hata Y., et al., “Hepatocyte Growth Factor as a Key to Modulate Anti‐Ulcer Action of Prostaglandins in Stomach,” Journal of Clinical Investigation 98 (1996): 2604–2611, 10.1172/JCI119080. [DOI] [PMC free article] [PubMed] [Google Scholar]
- 71. Subklewe M., Von Bergwelt‐Baildon M., and Humpe A., “Chimeric Antigen Receptor T Cells: A Race to Revolutionize Cancer Therapy,” Transfusion Medicine and Hemotherapy 46 (2019): 15–24, 10.1159/000496870. [DOI] [PMC free article] [PubMed] [Google Scholar]
- 72. Prasad S., Hogaboam C. M., and Jarai G., “Deficient Repair Response of IPF Fibroblasts in a Co‐Culture Model of Epithelial Injury and Repair,” Fibrogenesis & Tissue Repair 7 (2014): 1–14, 10.1186/1755-1536-7-7/FIGURES/9. [DOI] [PMC free article] [PubMed] [Google Scholar]
- 73. Gazdhar A., Temuri A., Knudsen L., et al., “Targeted Gene Transfer of Hepatocyte Growth Factor to Alveolar Type II Epithelial Cells Reduces Lung Fibrosis in Rats,” Human Gene Therapy 24 (2012): 105–116, 10.1089/HUM.2012.098. [DOI] [PubMed] [Google Scholar]
- 74. Correll K. A., Edeen K. E., Redente E. F., et al., “TGF Beta Inhibits HGF, FGF7, and FGF10 Expression in Normal and IPF Lung Fibroblasts,” Physiological Reports 6 (2018): e13794, 10.14814/PHY2.13794. [DOI] [PMC free article] [PubMed] [Google Scholar]
- 75. Bonner J. C., Lindroos P. M., Rice A. B., Moomaw C. R., and Morgan D. L., “Induction of PDGF Receptor‐α in Rat Myofibroblasts During Pulmonary Fibrogenesis In Vivo,” American Journal of Physiology. Lung Cellular and Molecular Physiology 274 (1998): L72–L80, 10.1152/AJPLUNG.1998.274.1.L72. [DOI] [PubMed] [Google Scholar]
- 76. Kishi M., Nishioka Y., Aono Y., et al., “Anifibrotic Effects of Blocking Antibody Specific for PDGF Receptor α or β on Bleomycin‐Induced Pulmonary Fibrosis in Mice,” in B59. PULMONARY FIBROSIS: ANIMAL MODELS (American Thoracic Society, 2009), A3443. [Google Scholar]
- 77. Khalil N. and O'Connor R., “The Role of TGF‐β in Bleomycin Induced Pulmonary Fibrosis”.
Associated Data
This section collects any data citations, data availability statements, or supplementary materials included in this article.
Supplementary Materials
Figure S1. Gating strategy for analysis of single cell suspensions from LP, LDLN and BAL by flow cytometry. Following gating of single cells, debris and dead cells were excluded (SSC/FSC, Zombie Aqua/SSC). Leukocytes were identified employing a SSC/CD45 plot for both gating strategies (i.e. T cells and other immune cells). A. Gating strategy for T cells: following gating of leukocytes (CD45+; CD45/SSC plot) CD3+ cells were gated (CD3/CD45 dot plot), followed by gating for CD4+ and CD8+ T cells (CD4/CD8 plot). Finally, in order to gate the Treg cell population, CD4+ cells were analysed for CD25 and FoxP3 expression and CD25+FoxP3+ cells were gated (CD25/FoxP3 Plot). B. Gating strategy for other immune cells: Following gating of leukocytes (CD45+; CD45/SSC plot), the Ly6G+ population was selected to gate for neutrophils (Ly6G/SSC plot). The negative population was selected for further analysis of macrophage (CD11chiMHCIIlo; AM) and dendritic cell (CD11chiMHCIIhi; DC) populations (MHCII/CD11c plot). The DC population was further analysed based on expression of CD11b (CD11b/SSC plot). Plots show representative gating strategy done in LP.
Figure S2. Frequencies of T cell and DC subsets in LDLN of mice instilled with BLM after receiving different T cell treatments. A. Frequency of lung CD4+ T cells, Treg (CD4+CD25+FoxP3+), CD8+ T cells relative to total CD45+ cells. Mice were either instilled intratracheal with BLM (1.52 U/kg) or with 50 μL of saline (control) and sacrificed on day 7 (D7), day 10 (D10) and day 14 (D14) following instillation. B. Frequency of LDLN DC (CD11C+MHCIIhigh) and CD11bhigh and CD11blow subsets relative to total CD45+ cells. C. Frequency relative to CD45+ cells in LDLN CD4+ T cells, Treg (CD4+CD25+FoxP3+), CD8+ T cells. Mice were either instilled intratracheal with BLM (1.52 U/kg) or with 50 μL of saline (control) on Day 0. Mice were treated with either HGF transfected CD3+ T cells or non‐transfected CD3+ T cells on day 7 after BLM instillation. Seven days after T cell administration (BLM) mice were sacrificed. D. Frequency of lung DC (C D11C+MHCIIhigh) and CD11bhigh and CD11blow subsets relative to total CD45+ cells. Groups received treatment as outlined under C. All treated mice were sacrificed 7 days after treatment (BLM). Data show mean and SEM, n = 4–8 mice per group, **** p < 0.00005, *** p < 0.0005, ** p < 0.005, * p < 0.05
Figure S3. Sirius Red staining of BLM‐treated mice lungs 7, 10 and 14 days post injury and treated with HGF‐ and only CD3+ T cells imaged by widefield microscopy. A. Sirius Red staining of control mouse lung. Mice were treated with BLM. Seven days after BLM treatment, HGF‐ or only‐CD3+ T cells were instilled intratracheal, and mice were sacrificed 7 days later. The lungs were fixed in PFA 4% before paraffin embedding. The red staining shows the collagen fibers. B, C, D. BLM treated mouse lung at 7, 10 and 14 post instillation. E. HGF‐CD3+ T cells treated BLM mouse lung and F. CD3+ T cells treated BLM mouse lung.
Figure S4. Immunofluorescence staining of BLM‐treated mice lungs treated with HGF‐ and only CD3 + T cells. Mice were either instilled intratracheal with 50 μL of saline (control), or with BLM (1.52 U/kg) and sacrificed on day 7, day 10 and day 14 following instillation. Treatments; Mice were treated with BLM. Seven days after BLM treatment, HGF‐ or only‐CD3+ T cells were instilled intratracheal and mice were sacrificed 7 days later. The lungs were fixed in PFA 4% before paraffin embedding. Green: actin+ filaments, red: α smooth muscle actin (αSMA; myofibroblasts) (arrowheads), blue: DAPI (nucleus). Sections were scanned using a fluorescence microscope (Nikon Ti‐E Eclipse).
Figure S5. Frequencies of T cell subsets in Lung, BALF and LDLN after HGF‐T cells plus electroporation treatments in mice instilled with BLM. A. Frequency of lung CD4+ T cells, Treg (CD4+CD25+FoxP3+), CD8+ T cells relative to total CD45+ cells. Mice were either instilled intratracheal with BLM (1.52 U/kg) or with 50 μL of saline (control), on Day 0. Mice were treated with HGF instillation plus extracorporeal electroporation on day 7 after BLM instillation. Seven days after T cell administration (BLM) mice were sacrificed. B. Frequency of BALF CD4+, Treg (CD4+CD25+FoxP3+), CD8+ T cells relative to CD45+ cells. Groups received treatment as outlined under A. C. Frequency of LDLN CD4+ T cells, Treg (CD4+CD25+FoxP3+), CD8+ T cells relative to total CD45+ cells. Groups received treatment as outlined under A. All treated mice were sacrificed 7 days after treatment (BLM). Data show mean and SEM, n = 4–8 mice per group, **** p < 0.00005, *** p < 0.0005, ** p < 0.005, * p < 0.05
Figure S6. Frequencies of DC subsets in LP, BALF and LDLN after treatment with HGF‐T cells plus electroporation treatments in mice instilled with BLM. A. Frequency of Lung DC (CD11C+MHCIIhigh) and CD11bhigh and CD11blow subsets relative to total CD45+ cells. Mice were either instilled intratracheal with BLM (1.52 U/kg) or with 50 μL of saline (control), on Day 0. Mice were treated with HGF instillation plus extracorporeal electroporation on day 7 after BLM instillation. Seven days after T cell administration (BLM) mice were sacrificed. B. Frequency of BALF DC (CD11C+MHCIIhigh) and CD11bhigh and CD11blow subsets relative to total CD45+ cells. Groups received treatment as outlined under A. C. Frequency of LDLN DC (CD11C+MHCIIhigh) and CD11bhigh and CD11blow subsets relative to total CD45+ cells. Groups received treatment as outlined under A. All treated mice were sacrificed 7 days after treatment (BLM). Data show mean and SEM, n = 4–8 mice per group, **** p < 0.00005, *** p < 0.0005, ** p < 0.005, * p < 0.05
Figure S7. Gating strategy for analysis of co‐cultures of myofibroblasts or fibroblasts with HGF‐, or empty‐vector, or non‐transfected CD3 + T cells. Non‐lymphocytic cells were identified by size exclusion. Following gating of single cells, debris and dead cells were excluded (SSC‐A/SSC‐H, Zombie Aqua/SSC). Successively, alpha smooth muscle actin (αSMA)+ cells were gated followed by gating of Desmin+ cells to identify fibroblasts. Then, cells double positive for collagen and Caspase 3 were gated.
Figure S8. Percentage of GFP + T cells after transfection with electroporation, analysed by flow cytometry. CD3+ T cells isolated from murine splenocytes plus specific plasmids underwent electroporation (EP) with the Nucleofector Transfector machine. Two millions CD3+ T cells were added and the first machine program was run for 10s. Groups were prepared as follows: Control = no EP, CD3+ T cell = EP, GFP kit only = CD3+ T cells + GFP from the manufacturer kit, HGF‐CD3+ T cells = CD3+ T cells + plasmid HGF.
Figure S9. E xpression (Mean Fluorescence Intensity; MFI) of the T cell activation markers CD25 and CD69 in different subsets of transfected T cells. CD3+ T cells isolated from murine splenocytes plus specific plasmids underwent electroporation (EP) with the Nucleofector Transfector machine. Two millions CD3+ T cells were added, and the first machine program was run for 10s. Flow cytometry analysis and gating strategy were performed as stated in Supplemental Figure 1A. Green = non transfected CD3+ T cells (control), black = electroporated CD3+ T cells without plasmid and red = HGF transfected CD3+ T cells. Data show mean and SEM, n = 3 sample per group, ****p < 0.00005*** p < 0.0005, ** p < 0.005, * p < 0.05
Table S1. List of employed anti‐mouse antibodies for flow cytometry
Table S2. List of employed real‐time quantitative PCR primers.
Data Availability Statement
Data will be made available upon reasonable request.