

Abstract
For over a century, fasting regimens have improved health, lifespan, and tissue regeneration in diverse organisms, including humans1–6. However, how fasting and post-fast refeeding impact adult stem cells and tumour formation has yet to be explored in depth. Here, we demonstrate that post-fast refeeding increases intestinal stem cell (ISC) proliferation and tumour formation: Post-fast refeeding augments the regenerative capacity of Lgr5+ intestinal stem cells (ISCs), and loss of the tumour suppressor gene Apc in post-fast refed ISCs leads to a higher tumour incidence in the small intestine and colon than in the fasted or ad libitum (AL) fed states, demonstrating that post-fast refeeding is a distinct state. Mechanistically, we discovered that robust mTORC1 induction in post-fast-refed ISCs increases protein synthesis via polyamine metabolism to drive these changes, as inhibition of mTORC1, polyamine metabolite production, or protein synthesis abrogates the regenerative or tumourigenic effects of post-fast refeeding. Given our findings, fast-refeeding cycles must be carefully considered and tested when planning diet-based strategies for regeneration without increasing cancer risk, as post-fast refeeding leads to a burst in stem cell-driven regeneration and tumourigenicity.
Introduction
A critical question in regenerative medicine is whether dietary strategies can promote tissue regeneration without increasing cancer risk. For over a century, fasting interventions, including short-term fasting, intermittent fasting, and caloric restriction (CR), have been reported to extend life-span and enhance tissue regeneration in many species 1–6. However, how adult stem cells contribute to these organismal benefits, given their importance in tissue regeneration and tumour initiation7, has not been fully characterized. Recent studies indicate fasting interventions enhance tissue regeneration or repair after injury through changes in adult stem cells3,8–10. Fasting interventions have also been noted to have inhibitory effects on tumour growth2,11,12. Still, how fasting itself, post-fast refeeding, or both contribute to tissue regeneration or cancer initiation/progression remains unclear. Here, we aim to dissect the effects of post-fast refeeding on stem cell-mediated regeneration and tumour initiation in the mammalian mouse intestine.
The rapidly renewing mammalian intestinal epithelium responds to diet-induced physiological cues to dynamically alter intestinal composition13,14. Critical in this process are actively cycling Lgr5+ intestinal stem cells (ISCs) at the crypt base that are supported by epithelial, stromal, and immune cell niches14–17. These ISCs are maintained by niche-derived growth factors and developmental signalling pathways, such as WNT, NOTCH, BMP inhibitors, and EGF18, but are also regulated by environmental factors, such as the microbiome and diet1,9,19,20. Host diet and nutrients affect intestinal composition through direct and indirect control of ISCs7,9,10,19,21. We previously showed that acute 24-hour fasting directly improves ISC function by activating fatty acid oxidation metabolism9. In contrast, long-term calorie restriction (CR, 40% reduced caloric intake) indirectly augments ISCs by suppressing Paneth cell niche mTORC1 signalling 10,21. Thus, ISCs and their niches integrate diverse cues to enable intestinal adaptation, but how nutritional or metabolic cues orchestrate ISC function and tumourigenesis needs further study. Emerging evidence for the regulation of stemness and tumourigenicity in other tissues by protein translation22–25prompted us to investigate this process in orchestrating the post-fast refeeding response in the intestine. Here, we demonstrate that the post-fast refeeding augments ISC-mediated regeneration after injury and tumourigenicity by regulating a novel mTORC1-polyamine metabolite-protein translation axis.
Post-fast refeeding enhances ISC function
To decipher the effects of post-fast refeeding in the intestine, we examined the following dietary conditions: ad libitum (AL), mice had free access to food; fasted, mice were deprived of food for 24 hours (h); refed, mice had free access to food following a 24 h fast for either 1 day (Refed 1d) or 3 days (Refed 3d). While fasting decreased body mass by 10-15%, post-fast refeeding for 1d restored the body mass to baseline (Extended Data Fig. 1a). To assess proliferation, we quantified the number of S-phase (BrdU positive cells after a 4h pulse) and M-phase cells (phospho-histone 3 positive cells) within the intestinal crypt where stem and progenitor cells reside: a 24 h fast significantly decreased crypt cell proliferation9 and post-fast refeeding increased crypt cell proliferation (Fig. 1a, Extended Data Fig. 1b). Neither fasting nor post-fast refeeding changed crypt depth or villus height (Extended Data Fig. 1c), ISC numbers (Extended Data Fig. 1d, e), apoptotic cell numbers (Extended Data Fig. 1f, g), or Paneth/goblet cell numbers per crypt (Extended Data Fig. 1h, i). Thus, crypt cell proliferation was the most noticeable parameter to change, requiring at least an 18 h fast to induce refeeding proliferation (Extended Data Fig 2. a, b), independent of circadian cycle (i.e., offsetting the fasting-refeeding cycle by 12 h to match the mice light/dark cycle, Extended Data Fig 2c)26.
Fig. 1. Post-fast refeeding enhances ISC function.

(a) Quantification (left) and representative images of BrdU+ cells (4 hours after BrdU administration) by IHC per jejunal crypt (right). n = 25-30 crypts per measurement, n = 5 mice per group, pooled from 4 independent experiments. Scale bar, 25 µm. (b) Organoid-forming assay for FACS-sorted ISCs from AL, Fasted, Refed 1d, and Refed 3d mice. Quantification (left) and representative images of day 3 organoids (right). n = 5 mice per group. Experiments were repeated 5 times. Scale bar, 50 µm. (c) Schematic of Lgr5 lineage tracing with Lgr5-IRES-CreERT2; Rosa26LSL-tdTomato reporter mice, including the timeline of tamoxifen injection and tissue collection. (d) Quantification (left) and representative images of IHC for tdTomato+ Lgr5+ ISC-derived progenies (orange arrows, right) in the small intestine. n = 20 crypts per measurement, n = 4-5 mice per group, pooled from 3 independent experiments. Scale bar, 25 µm. (e) Schematic of irradiation model with Lgr5 lineage tracing mice, including the timeline of irradiation (XRT 7.5Gy x 2) and tissue collection. (f) Quantification (left) and representative images of IHC for tdTomato+ Lgr5+ ISC-derived progenies (orange arrows, right). n = 20 crypts per measurement, and n = 5 mice per group, pooled from 3 independent experiments. Scale bar, 50 µm. One-way analysis of variance (ANOVA) (a,b,d,f). Data are mean ± s.d. *p < 0.05, **p < 0.01, ***p < 0.001, ****p <0.0001.
We then functionally assayed the ability of intestinal crypts and ISCs (using Lgr5-EGFP-IRES-CreERT2 reporter mice20) from each dietary condition to form ex vivo intestinal organoids (i.e., clonogenicity). Fasting and 1 d post-fast refeeding enhanced the organoid-forming capacity of intestinal crypts and ISCs, which returned to the AL baseline after 3 d post-fast refeeding (Fig. 1b, Extended Data Fig. 1j) and was independent of the circadian cycle (Extended Data Fig. 2d). The similarity in organoid formation between fasted and post-fast-refed ISCs/crypts reflects that fasted ISCs/crypts are cultured in nutrient-rich media, thus mimicking in vivo post-fast feeding.
Next, we sought to understand the effect of fasting and refeeding on in vivo ISC activity using the Lgr5 ISC lineage tracer model (Lgr5-IRES-CreERT2; Rosa26 loxp-stop-loxp (LSL)-tdTomato)27. In this model, tamoxifen administration activates tdTomato labelling in ISCs and their progeny. We then quantified the tdTomato positive length along the crypt-villus axis after 2 d of tamoxifen administration under fasting and refeeding regimens (Fig. 1c). We found that 1 d refeeding increased tdTomato-positive length by 60% in the small intestine and 35% in the colon compared to AL controls, indicating that post-fast refed ISC have enhanced output (Fig. 1d, Extended Data Fig. 1k). We also assessed whether post-fast refeeding augments ISC-driven repair after radiation-induced injury. Using the aforementioned Lgr5 ISC lineage tracer model, we labeled ISCs 24 h before radiation exposure with tdTomato, subjected mice to fasting/refeeding regimens, and then tracked tdTomato-positive cells for 3 d (Fig. 1e). As seen in uninjured intestines, the 1 d post-fast refed group showed the greatest effect on ISC-mediated repair after radiation-induced injury (Fig. 1f). Overall, our data support the notion that many benefits of fasting in the intestine occur during refeeding by stimulating ISCs to generate greater numbers of progeny in homeostasis and injury.
Refeeding activates mTORC1 signalling
We next sought to assess how fasting and refeeding influenced the insulin/PI3K and mTORC1 nutrient-sensing pathways 28. We confirmed that fasting/refeeding impacted these pathways: A 24 h fast reduced blood glucose by 50% relative to AL controls, which returned to AL baseline 30 min after post-fast refeeding (Extended Data Fig. 3a). Elevations in blood glucose levels stimulate insulin secretion, which in turn engages intracellular PI3K-AKT activity and downstream mTORC1 signalling 29,28. In intestinal crypts, we observed higher levels of phosphorylated AKT (S473) protein, phosphorylated 40S ribosomal protein S6 (pS6) and eukaryotic translation initiation factor 4E-binding protein (p4EBP1), indicating that refeeding induces insulin-PI3K-AKT-mTORC1 signalling (Fig. 2a, Supplementary Fig. 1). We then administered a dual inhibitor of the insulin receptor (IR) and IGF-1 receptor (IGF-1R), OSI-906, and a selective PI3K inhibitor, BKM120, prior to refeeding30,31. These inhibitors abrogated the induction of pAKT, pS6, and p4EBP1 (Extended Data Fig. 3b, Supplementary Fig. 1), demonstrating a role for PI3K-AKT signalling in inducing mTORC1 activation in the early refed state.
Fig. 2. Refeeding activates mTORC1 signalling.

(a) Immunoblots for phospho-AKT and mTORC1 downstream targets in crypts from AL, Refed 1h, Refed 24h mice. (b) Representative images of IHC for phospho-S6 in jejunal crypts from AL, Fasted, Refed 1d, and Refed 3d mice. n = 5 mice per group, pooled from 3 independent experiments. Scale bar, 20 µm. (c) Immunoblots for of pS6, and S6 in flow-sorted ISCs (Lgr5-GFPhi), progenitors (Lgr5-GFPlow) from each dietary conditioned Lgr5-IRES-creERT2 mice. (d) Schematic of lineage tracing mouse model with or without rapamycin treatment. (e) Quantification (left) and representative images of tdTomato+ Lgr5+ ISC-derived progenies labeled by IHC for tdTomato (blue arrows, right). n = 5 mice per group, pooled from 3 independent experiments. Scale bar, 50 µm. (f) Schematic of the irradiation model with Lgr5 lineage tracing mice, including the timeline of rapamycin administration. (g) Quantification (left) and representative images of IHC for tdTomato (orange arrows, right). n=20 crypts per measurement. n = 5-6 mice per group, pooled from 3 independent experiments. Scale bar, 50 µm (h) Organoid-forming assay for crypts from Tsc1 WT or KO mice at AL or refed 1d state. Quantification (left) and representative images of day 3 organoids (right). n = 6 mice per group, pooled from 4 independent experiments. Scale bar, 500 µm. (i) Organoid-forming assay for crypts from Raptor WT or KO mice at AL or refed 1d state. Quantification (left) and representative images of day 3 organoids (right). n = 4 mice per group, pooled from 4 independent experiments. Scale bar, 500 µm. Unpaired two-tailed t-tests (e, g). One-way ANOVA (h, i). Data are mean ± s.d.. *p < 0.05, **p < 0.01, ***p < 0.001, ****p <0.0001.
We next measured mTORC1 activity in intestinal crypts at 1 hr or 1 d post refeeding, and in sorted ISCs and early progenitors at 1 or 3 d post refeeding. We found that mTORC1 activity both at the early (refed 1 h) and the later refeeding (refed 1 d) time points were greater than that of the AL state (Fig. 2a, Supplementary Fig. 1). Furthermore, circadian cycle did not impact these changes (Extended Data Fig. 3c, Supplementary Fig. 1). These changes were also noted at the crypt bottoms, including in Lgr5+ ISCs and their early daughter progenitors, as we saw increased pS6 levels by immunohistochemistry (IHC) and immunoblots in flow-sorted Lgr5-GFPhigh ISCs and Lgr5-GFPlow progenitors (Fig. 2b, c, Supplementary Fig. 1).
To determine mTORC1 necessity in the refed state, we administered the mTORC1 inhibitor rapamycin shortly before and during refeeding. As expected, rapamycin treatment abrogated pS6 level in crypts (Extended Data Fig. 3d, Supplementary Fig. 1). While rapamycin treatment did not prevent the refeeding-mediated hyperproliferation of crypt cells (Extended Data Fig. 3e), it did dampen the progeny output of refed Lgr5+ ISCs in homeostasis (Fig. 2d, e) and after injury (Fig. 2f, g). To further ascertain mTORC1’s role in refeeding, we generated Tsc1loxp/loxp: Villin-CreERT2 and Raptorloxp/loxp: Villin-CreERT2 mouse models, where mTORC1 is constitutively activated (Tsc1 model) or inactivated (Raptor model) in the intestine by tamoxifen administration (Extended Data Fig. 3f, g, Supplementary Fig. 1). Activation of mTORC1 upon Tsc1 deletion increased crypt organoid-forming capacity in AL mice compared to AL controls, and inhibition of mTORC1 upon Raptor deletion dampened refeeding-enhanced crypt organoid-forming capacity in refed Raptor KO mice (Fig. 2h, i). Thus, elevated insulin-PI3K-mTORC1 signalling in refed Lgr5+ ISCs boosts their activity in homeostasis and injury.
Refeeding boosts OAT expression in ISCs
To gain further insight into how refed mTORC1 activation augments stemness, we performed 10X single-cell RNA sequencing (scRNAseq) analysis on FACS-sorted ISCs and their progenitor cells (GFP+) from Lgr5-EGFP-IRES-CreERT2 reporter mice fed AL (al), fasted for 24 h (f), refed for 24 h (rf), and refed with rapamycin treatment (rf +rapa) (Fig. 3a, Supplementary Fig. 2). We performed UMAP analysis to partition GFP+ cells into 17 clusters based on the expression of established marker genes (Fig. 3b, Extended Data Fig. 4a)32. We identified three ISC clusters (clusters 5, 2, and 10) based on Lgr5 expression levels (Fig. 3c) that matched previously identified ISC clusters by Biton and colleagues (termed Biton ISC-I, II, and III)33. Cluster 5 had the most stem-like and low-cycling features, similar to Biton-I. In contrast, cluster 10 had less primitive and proliferative characteristics mirroring Biton-III, and cluster 2 had intermediate features (Fig. 3d, Extended Data Fig. 4b, c).
Fig. 3. Refeeding boosts OAT expression in ISCs.

(a) Schematic of single-cell RNAseq (scRNA-seq). GFP+ cells including ISCs (GFPhi) and progenitor cells (GFPlow) were flow-sorted from AL, Fasted, Refed 1d, and Refed 1d with rapamycin-treated Lgr5-EGFP-IRES creERT2 mice. (b) Cell type clusters. UMAP for clustering (color coding) of 18,061 single cells (Ad libitum, n=1 and 4,760 cells; Fasted, n=1 and 4,282 cells; Refed 1d n=1 and 4,552 cells; Refed 1d with rapamycin treatment n=1 and 4,467 cells). TA, transit-amplifying (progenitor) cells; EC, enterocyte; EEC, enteroendocrine cells. (c) Lgr5 relative expression level among all clusters within all dietary groups. (d) Gene signatures comparison of ISC subsets between our stem cell clusters (5, 2,10) and Biton’s ISC classification. Representative genes of Biton’s ISC subsets are shown on the right side. (e) Representative images of in situ hybridization (ISH, red) of OAT mRNA in the small intestinal crypts. Experiments were repeated 3 times. Scale bar, 10 µm. (f) Immunoblots for OAT in crypts from AL, Fasted, and different refeeding time points. (g) Schematic of ornithine metabolism including the metabolites and the genes encoding the catalytic enzymes. (h) Metabolite level in the intestinal tissues from AL, Fasted, Refed 4h, and Refed 24h mice. n = 4-5 mice per group, pooled from 3 independent experiments. Duplicate measurements were taken from each mouse. (i) Quantification (left) and representative images of tdTomato+ Lgr5+ ISC-derived progenies in AL or refed 1d mice treated with or without OAT inhibitor following irradiation (right). n = 4-7 mice per group, pooled from 3 independent experiments. Scale bar, 50 µm. One-way ANOVA (h, i). Data are mean ± s.d. *p < 0.05, **p < 0.01, ***p < 0.001, ****p <0.0001.
Focusing on these three clusters, we observed that their relative proportions did not change with fasting-refeeding (Table 1). Consistent with our observations in intestinal crypts (Extended Data Fig. 3e), refeeding stimulated the proliferation of both clusters 5 and 2, which did not depend on mTORC1 activity (Extended Data Fig. 4d). We then performed gene set enrichment analysis (GSEA) of the three stem cell clusters (5, 2, 10) to evaluate the changes in stem cell signature gene expression, beginning with cluster 5 - the most primitive ISC subset (Fig. 3c, d). The distribution of the mean expression of Biton ISC-I gene signatures in cluster 5 ISCs revealed that refeeding strengthened the expression of these signatures in an mTORC1 dependent manner (Extended Data Fig. 4e). Like cluster 5, refeeding upregulated the Biton ISC-II gene signatures in cluster 2 through mTORC1 activation (Extended Data Fig. 4e). By contrast, neither fasting nor refeeding had positive effects on Biton ISC-III signatures in cluster 10 (Extended Data Fig. 4e). These data indicate that refeeding enhances the stemness program in the more primitive ISC subsets (5 and 2) in an mTORC1-dependent manner. We validated this enhancement using in situ hybridization (ISH) of the Biton ISC-I marker genes gastrokine 3 (Gkn3), and platelet-derived growth factor subunit A (Pdgfa), two refeeding-induced genes in ISC cluster 5 (Extended Data Fig. 4f, g). We also performed differential gene expression (DGE) analysis in ISC subsets, focusing on refeeding gene signatures that are regulated in an mTORC1-dependent manner. Ornithine aminotransferase (OAT) expression was one of the most upregulated genes in refed ISCs compared to AL state (rf > AL), and this induction was blocked by rapamycin treatment (rf > rf+rapa), especially in ISC clusters 5 and 2 (Supplementary Table 1). Consistent with DGE analysis, Oat mRNA transcript in crypt base cells was strongly enhanced upon refeeding and dampened with rapamycin treatment (Fig. 3e). Protein and RNA analysis suggested a progressive increase in OAT levels over 24 h of refeeding (Fig. 3f, Supplementary Fig. 1 and Extended Data Fig. 4h).
Table 1.
- Proportion of each cluster
| Cluster | al.percent | f.percent | rf.percent | rf+rapa.percent | Cell Type |
|---|---|---|---|---|---|
| 0 | 16.90% | 19.10% | 13.50% | 17.80% | Early Progenitor |
| 1 | 9.60% | 10.10% | 13.50% | 11.90% | Secretory Progenitor |
| 2 | 8.20% | 11.60% | 10.40% | 10.20% | Stem |
| 3 | 9.90% | 9.10% | 9.80% | 10.10% | Enterocyte Progenitor |
| 4 | 12.50% | 7.80% | 8.20% | 6.10% | Secretory Progenitor |
| 5 | 7.60% | 8.00% | 8.40% | 7.20% | Stem |
| 6 | 7.60% | 7.40% | 6.50% | 7.70% | Enterocyte Progenitor |
| 7 | 5.60% | 4.00% | 9.60% | 5.50% | Early Progenitor |
| 8 | 7.80% | 5.30% | 3.40% | 3.70% | Paneth |
| 9 | 2.80% | 4.60% | 4.30% | 6.00% | Goblet |
| 10 | 3.40% | 3.20% | 4.40% | 5.50% | Stem |
| 11 | 2.60% | 5.60% | 3.30% | 2.90% | Enterocyte |
| 12 | 3.90% | 2.80% | 2.40% | 3.20% | Unknown |
| 13 | 0.50% | 0.60% | 0.90% | 0.90% | Enteroendocrine |
| 14 | 0.50% | 0.50% | 0.60% | 0.70% | Enteroendocrine |
| 15 | 0.20% | 0.20% | 0.50% | 0.50% | Secretory Progenitor |
| 16 | 0.40% | 0.20% | 0.40% | 0.10% | Tuft |
OAT is a mitochondrial enzyme mainly expressed in the liver, intestine, brain, and kidneys. In the intestine, OAT produces ornithine from pyrroline-5-carboxylate (P5C), which is generated from proline and glutamate. Ornithine is a non-proteogenic amino acid used for either citrulline or polyamine synthesis (Fig. 3g) 34. To understand better how refeeding alters ornithine metabolism, we measured the levels of proline, glutamate, and ornithine in the intestinal tissue of mice that were subjected to AL, fasted, refed for 4 h, and refed for 24 h. Notably, fasting decreased the levels of proline, glutamate, and ornithine in the intestine, while post-fast refeeding significantly increased their levels, starting from 4 h of feeding (Fig. 3h). We next tested whether changes in ornithine levels are mTORC1-dependent, using the Tsc1loxp/loxp: Villin-CreERT2 and Raptorloxp/loxp: Villin-CreERT2 mouse models. Although Tsc1 loss did not impact OAT or ornithine levels (Extended Data Fig. 4i, j, Supplementary Fig. 1), Raptor loss diminished ornithine levels in both AL and refed conditions (Extended data 4k). To investigate the roles of OAT and ornithine in refeeding-induced regeneration, we used an OAT inhibitor, 5-Fluoromethylornithine (5-FMO)35 to inhibit OAT in our ISC lineage tracing mouse model: 5-FMO treatment of refed mice reduced ornithine crypt levels (Extended Data Fig. 4l), abrogated the effects of refeeding on ISCs, and had no effect on AL ISCs (Fig 3i). These findings support that refeeding stimulates an mTORC1-dependent OAT-ornithine axis that boosts ISC-mediated repair after injury.
Refeeding augments protein synthesis
Incorporation into the urea cycle and polyamine synthesis are two possible downstream metabolic fates for ornithine (Fig. 3g). In the urea cycle, carbamoyl phosphate synthetase 1 (CPS1) and ornithine transcarbamoylase (OTC) are enzymes that catalyze citrulline formation from carbamoyl phosphate and ornithine (Fig. 3g). Given that Cps1 mRNA levels were decreased in the early refed state (2 h) and that Otc mRNA levels were unchanged during refeeding (Extended Data Fig. 5a), we focused on ornithine, which contributes to polyamine (putrescine, spermidine, and spermine) biosynthesis in ISCs and progenitors. Ornithine decarboxylase 1 (ODC1), the rate-limiting enzyme for polyamine production, catalyzes the conversion of ornithine into putrescine. Adenosylmethionine decarboxylase 1 (AMD1) is the second rate-limiting enzyme, which donates an amino-propyl group from S-adenosylmethionine for polyamine synthesis (Fig. 4a).
Fig. 4. Refeeding augments protein synthesis.

(a) Schematic of the polyamine pathway. (b) qPCR on FACS-sorted ISCs from AL, Fasted, Refed 2h and 24h mice. n = 6-12 mice per group, pooled from 5 independent experiments. (c) qPCR on FACS-sorted ISCs from Refed 2h mice with or without rapamycin. n = 6 mice per group, pooled from 5 independent experiments. (d) Polyamine level in crypts from AL, Fasted, Refed 4h and 24h mice. n = 5-7 mice per group, pooled from 3 independent experiments. (e) Immunoblots for hypusinated and total eIF5A in crypts from AL, Refed 4h and 24h mice. (f) Schematic of puromycin-incorporation assay. Created with BioRender.com. (g) Immunoblots for puromycin in crypts and FACS-sorted ISCs and progenitors from AL, Fasted, and Refed 1d. (h) Immunoblots for puromycin in crypts from AL and Refed with or without rapamycin. (i) Immunoblots for puromycin in crypts from AL and Refed with or without DFMO 40 or 200mg/kg. (j) Schematic of organoid assay using Odc1loxp/loxp;Villin-CreERT2 mice. (k) Organoid-forming assay of crypts from Odc1 WT or KO mice at AL or refed 1d. Quantification (left) and representative images of day 3 (right). n = 5 mice per group, pooled from 4 independent experiments. DFMO (1.5 mM) or/and Spermidine (50 µM). Scale bar, 500 µm. (l) Quantification and (m) representative images of tdTomato+ Lgr5+ ISC-derived progenies post-XRT (orange arrows) with or without DFMO. n = 4-5 mice per group, pooled from 3 independent experiments. Scale bar, 50 µm. (n) Quantification (left), representative images of tdTomato+ Lgr5+ ISC-derived progenies post-XRT with or without polyamine (right). n = 6 mice per group, pooled from 3 independent experiments. Scale bar, 50 µm. One-way ANOVA (b, k, l). Unpaired one-tailed t-tests (d). Unpaired two-tailed t-tests (c, n). Data are mean ±s.d. *p < 0.05, **p < 0.01, ***p < 0.001, ****p <0.0001.
First, we sought to address the expression levels of polyamine synthesis-related genes in sorted ISCs from AL, fasted, refed 2 h, and refed 24 h mice. We observed that both Odc1 and Amd1, as well as spermidine synthase (Srm) mRNA levels were significantly upregulated in ISCs from refed 2 h mice compared to AL in an mTORC1 dependent manner (Fig. 4b, c).
Second, we measured polyamine levels in AL, fasted, and refed crypts and found that spermidine and spermine levels decreased after fasting and increased to AL levels in refed crypts (Fig. 4d). Refed crypt putrescine levels were significantly inhibited with 5-FMO or difluoromethylornithine (DFMO, irreversible ODC inhibitor36) administration and spermidine levels trended lower to near significance (p<0.06 and p<0.07, respectively; Extended Data Fig. 5b, c). Constitutive mTORC1 activity with Tsc1 loss eliminated crypt polyamine level differences with refeeding, and disrupted mTORC1 activity with Raptor loss dampened spermidine levels in refed crypts (Extended Data Fig. 5d, e).
Third, we addressed whether the de novo polyamine synthesis is activated during refeeding using stable isotope tracing approaches in crypt organoid assays (Extended Data Fig. 5f)37. We found that 13C-ornithine but not 13C-arginine labeled 40-60% of putrescine in refed 4 h and 24 h crypts compared to 10-20 % in AL and fasted crypts, indicating that de novo synthesis of polyamine through ornithine is enhanced during refeeding (Extended Data 5f, g). Interestingly, fasted crypts in organoid cultures showed a time-dependent increase in labeled putrescine mainly through arginine and to less extent ornithine, consistent with a refeeding response in culture, as was also observed for fasted ISC organoid forming capacity (Fig.1b).
Fourth, we assessed eukaryotic translation initiation factor 5A (eIF5A) levels, which is post-translationally modified by spermidine to generate hypusinated eIF5A and serves as a proxy for spermidine levels38,39. Hypusinated eIF5A amounts in both refed 4 h and 24 h crypts were greater than that of AL crypts (Fig. 4e, Supplementary Fig. 1). Increased hypusination of eIF5A in the refed state was suppressed by mTORC1 inhibition (Raptor KO mice) or by DFMO treatment36 and increased with mTORC1 activation (Tsc1 KO mice); whereas, insulin receptor inhibitor treatment (BKM120) had no effect (Extended Data Fig. 5h, i, j, k, Supplementary Fig. 1), demonstrating that mTORC1, independent of insulin signalling, regulates eIF5A hypusination. Although BKM120 treatment blocked mTORC1 activity after 1 h but not after 4 h of refeeding, it raises the possibility that mTORC1 sensing of nutrients in the later phases of refeeding contributes to hypusinated elF5A. Finally, we observed that there is feedback regulation and crosstalk between mTORC1 signalling and polyamine synthesis where ODC inhibition partially suppressed refeeding-activated mTORC1 signalling as previously noted in other mammalian tissues (Extended Data Fig. 5l, Supplementary Fig. 1)40.
Because polyamines and mTORC1 signalling regulate global translation rate28,41, we measured protein synthesis rates in the different fasting/refeeding states using puromycin, a tyrosyl tRNA mimic that can be incorporated into nascent polypeptide chains to enable bulk protein measurement of protein synthesis 21,24,25 (Fig. 4f). Refed crypt cells, ISCs, and progenitor cells showed heightened protein synthesis rates with puromycin immunoblots compared to the other groups in an mTORC1 or ODC1 dependent manner and independent of circadian cycle (Fig. 4g, h, i, Extended Data Fig. 5m and Supplementary Fig. 1).
We next investigated whether increased polyamine levels contribute to refeeding-enhanced organoid formation and intestinal repair after irradiation (Fig. 1b, e, f) by generating Odc1loxp/loxp: Villin-CreERT2 mice. In this model, Odc, the rate-limiting enzyme for polyamine synthesis, is ablated in intestinal epithelium with tamoxifen. Odc1 loss significantly decreased putrescine and spermidine levels in refed crypts (Extended Data Fig. 5n), and abrogated refed crypt organoid formation in a spermidine-dependent manner (Fig. 4j, k, Extended Data Fig. 5o). Similarly, DFMO treatment blocked the enhanced ISC-mediated repair after irradiation-induced injury in refeeding (Fig. 4l, m, Extended Data Fig. 5p).
We then sought to decipher the role of hypusination as a downstream polyamine effector in the refed state by inhibiting deoxyhypusine synthase (DHPS), the primary enzyme responsible for the hypusination of eIF5A42 (Extended Data Fig. 5q, Supplementary Fig. 1). DHPS inhibitor treatment (GC7, N1-guanyl-1,7-diaminoheptane) 43 dampened the organoid forming ability and protein synthesis of refed crypts while having mild effects on these parameters in AL crypts (Extended Data Fig. 5r, s, t, Supplementary Fig. 1). Lastly, the in vivo addition of spermidine/spermine reversed the refed-blocking effects of rapamycin in the tdTomato lineage tracing model and was accompanied by higher protein synthesis (Fig. 4n, Extended Fig. 5u, v and Supplementary Fig. 1). Thus, refeeding through an mTORC1-polyamine-dependent manner stimulates global protein translation via eIF5A hypusination to boost ISC function in organoid assays and in vivo after injury.
Refeeding boosts tumourigenicity of ISCs
Recent studies have demonstrated that fasting interventions reduce intestinal tumourigenesis, yet it is unclear how the timing of mutagenesis with respect to fasting and refeeding cycles influences tumour initiation4,44–46. Given the emerging role of protein synthesis in controlling stem cell regeneration and tumourigenesis23–25 and that refeeding drives mTORC1-polyamine dependent protein translation in ISCs, we postulated that post-fast refeeding may elevate intestinal tumour formation.
We utilized an Apc model of tumourigenesis in which the Apc gene, a tumour suppressor and a negative regulator of the Wnt pathway, can be ablated with tamoxifen administration: Apc was deleted in AL, fasted for 24h (Fasted), and post-fast refed 1d or 3d (Refed 1d or 3d) states specifically in Lgr5+ ISCs using the Apcloxp/loxp: Lgr5-EGFP-IRES-CreERT2 mouse model (Fig. 5a). In control experiments, tamoxifen-induced CreERT2 activity in a Rosa;tdTomato reporter strain was independent of the fasting-refeeding cycle (Extended Data Fig. 6a, b, c). Tumour burden was measured by the number and the length of nuclear β-catenin+ Apc-null tumours in the small intestine at 7 or 21 d and in the colon at 21 d after tamoxifen administration (Extended Data Fig. 6d). Interestingly, refed 1d cohort had greater numbers of tumours in the small intestine and colon at both time points; however, this phenotype was no longer observed in the refed 3d cohort (Fig. 5b, c, Extended Data Fig. 6e).
Fig. 5. Refeeding boosts tumourigenicity of ISCs.

(a) Schematic of Apc tumour model with Apcloxp/loxp; Lgr5-EGFP-IRES-creERT2 mice. (b) Quantification of β-catenin+ nucleus Apc-null lesions 1 week after tamoxifen administration (left), and the ratio of tumour length to intestinal length in small intestine 3 weeks after tamoxifen administration (right). n = 7-13 mice per group, pooled from 3 independent experiments. (c) Representative images of Apc-null tumour lesions by IHC for β-catenin. Tumours are pointed by yellow arrows (left) or surrounded by a yellow dotted line (right). Scale bar, 100 µm (left) and 50 µm (right). (d) Schematic of ex vivo adenomatous organoid model with FACS-sorted Apc-null ISCs (Lgr5- GFPhi) from Apcloxp/loxp; Lgr5-EGFP-IRES-CreERT2 mice. (e) Quantification (top) and representative images of day 6 of Apc-null adenomatous organoids (bottom) from AL, Fasted, and Refed 1d mice. Scale bar, 1 mm. n = 5-7 mice with duplicate measurements taken from each mouse, pooled from 5 independent experiments. (f) Schematic of Apc tumour model with Apcloxp/loxp;Villin-CreERT2 mice. (g) Ratio of β-catenin+ Apc-null tumour length to intestinal length in small intestine (left), and representative images of Apc- null tumour lesions by IHC for β-catenin (right). Tumours are surrounded by a yellow dotted line. n = 5-13 mice per group, pooled from 3 independent experiments. Scale bar, 50 µm. (h) Schematic of intermittent fasting (IF) model with Apcloxp/loxp; Lgr5-EGFP-IRES-creERT2 mice. (i) Ratio of β-catenin+ Apc-null tumour length to intestinal length in small intestine. n = 5-8 mice per group, pooled from 3 independent experiments. (j) Schematic showing how post-fast refeeding alters Lgr5+ ISC activity, Created with BioRender.com. One-way ANOVA (b, e, g, i). Data are mean ±s.d. *p < 0.05, **p < 0.01, ***p < 0.001.
We also investigated whether refeeding enhanced tumourigenic potential of Lgr5+ ISCs cell-autonomously in organoid assays. We isolated an equal number of Apc-null Lgr5+ ISCs from AL, fasted, and refed mice 5 d after tamoxifen administration and assessed their capacity to give rise to Apc-null adenomatous organoids (Fig. 1b and 5d). Refeeding boosted the number of ISC-derived Apc-null organoids by 2-fold compared to the other cohorts, supporting the notion that refed Apc-null ISCs, like their normal counterparts, have augmented activity (Fig. 5e).
Since the Lgr5 knock-in allele shows mosaic expression in the Lgr5-EGFP-IRES-CreERT2 mouse model47, we also induced tumours using the Apcloxp/loxp: Villin-CreERT2 mouse model, which results in Apc loss in all intestinal epithelial cells, including ISCs, with tamoxifen administration (Fig. 5f). Like the Apcloxp/loxp: Lgr5-EGFP-IRES-CreERT2 mouse model, refeeding augmented small intestinal and colonic tumour formation (Fig. 5g, Extended Data Fig. 6f).
Finally, we sought to assess how iterative fasting and refeeding cycles (also known as intermittent fasting, IF) influenced ISC tumourigenicity in the Apcloxp/loxp; Lgr5-EGFP-IRES-CreERT2 tamoxifen-inducible mouse model over ten cycles (20 days, Fig. 5h). Apc was ablated in ISCs in either AL, the last iteration of the 24-hour fasted (Fasted) or post-fast refed cohorts (Refed). As observed with a single fast-refed cycle, Apc loss in refed ISCs with IF engendered greater intestinal tumour numbers (Fig 5i, Extended Data Fig. 6g). These results demonstrate that Apc loss in post-fast refeeding promotes ISC tumour initiation after short or repeated fasting/refeeding cycles.
Refed mTORC1 and ODC1 drive tumourigenicity
Although mTORC1 and ODC1 activity promote Apc-null intestinal tumour progression 48,49, how they impact early intestinal tumour formation in response to refeeding is unclear. To investigate the relationship between mTORC1, refeeding, and tumour initiation in ISC, we administered rapamycin to AL and refed Apcloxp/loxp: Villin-CreERT2 and Apcloxp/loxp; Lgr5-EGFP-IRES-CreERT2 mice (Extended Data Fig. 7a, b). While rapamycin blocked the tumour-initiating effects of refeeding in the small intestine and colon in both models, it did not do so in AL controls (Extended Data Fig. 7c, d, e). We then tested whether constitutive mTORC1 activity in ISCs akin to what occurs with refeeding, also boosts the tumourigenic capacity of Lgr5+ ISCs. We generated Apcloxp/loxp: Tsc1loxp/loxp; Lgr5-EGFP-IRES-CreERT2 mice model, where Tsc1 and Apc were disrupted in Lgr5+ ISCs with tamoxifen (Extended Data Fig. 7f). Tsc1 co-deletion with Apc in ISCs resulted in a greater tumour burden (Extended Data Fig. 7g), supporting the notion that refeeding via mTORC1 stimulation promotes the tumourigenicity of Lgr5+ ISCs.
We also addressed the necessity of polyamines and protein synthesis in actuating the increased tumour-initiating capacity of the refed state. To block polyamine metabolism, we administered the ODC inhibitor DFMO to AL or refed Apcloxp/loxp: Villin-CreERT2 mice (Extended Data Fig. 7h) and found that ODC inhibition attenuated tumour formation in the refed intestine and colon with no effect on the AL cohort (Extended Data Fig. 7i, j). Given that mTORC1 and ODC inhibition blunted refeeding stimulated protein translation in intestinal progenitors (Fig.4h, i), we treated refed Apcloxp/loxp: Villin-CreERT2 mice with cycloheximide, an inhibitor of eukaryotic translation or protein synthesis, to ascertain whether dampening elevated protein translation in the refed state impacted intestinal tumour formation (Extended Data Fig. 7k). Like rapamycin (Extended Data Fig. 7a-e) and DMFO (Extended Data Fig. 7h, i, j) treatments, inhibition of protein translation in the refed intestine (Extended Data Fig. 7l, m, Supplementary Fig. 1) suppressed the effects of post-fast refeeding on intestinal tumour formation (Extended Data Fig. 7n).
Lastly, we engineered Apcloxp/loxp: Rpl24Bst/+; Lgr5-EGFP-IRES-CreERT2 mice where the Belly spot and tail (Bst) mutant impairs Rpl24 splicing and globally suppresses protein translation50,51. As noted with cycloheximide treatment, the Rpl24Bst/+ cohorts had reduced protein translation and tumourigenesis compared to refed Rpl24WT controls (Extended Data Fig. 7o, p, Supplementary Fig. 1). Thus, we conclude that post-fast refeeding augments ISC-initiated tumour formation by engaging an mTORC1-polyamine-protein synthesis axis (Fig. 5j).
Discussion
This work, along with other recent studies, has indicated that post-fast refeeding drives a unique cellular program distinct from both fasting and AL feeding52,53. Previously, we and others have reported that a 24h fast enhances ISC function by activating a fatty acid oxidation (FAO) program and that the fasted intestine and ISCs are protected from chemo- and radiation-induced damage9,54. Here, we propose that post-fast refeeding enhances the stemness attributes of ISCs. Firstly, after injury, the regenerative capacity of refed ISCs exceeds that of the AL and fasted states (Fig. 1). Secondly, refeeding stimulates PI3K-AKT-mTORC1 signalling in ISCs (Fig. 2). Thirdly, post-fast refeeding stimulates global protein translation, which is coordinated partly by increased mTORC1 activity and polyamine synthesis (Fig. 4). Together, these findings provide evidence to support the hypothesis that post-fasting refeeding primes ISCs for a robust regenerative response upon nutritional stimulation (Fig. 5j).
An important question is whether other fasting regimens, such as calorie restriction (CR, a chronic 40% reduction of calories), co-opt similar or diverse strategies to mediate their regenerative effects on ISCs. We and others21 had previously proposed that long-term CR and rapamycin treatment boost ISC numbers and function by dampening mTORC1 signalling in the Paneth cell niche10. This induced bone marrow stromal cell antigen (Bst1) and its paracrine product cyclic ADP-ribose (cADPR) in the Paneth niche, enhanced ISC numbers and function in a cell non-autonomous manner. Multiple lines of evidence indicate that a short-term fast/refeeding cycle engages a distinct mechanism for boosting ISC function than CR: 1) Post-fast refeeding does not activate Bst1 expression in Paneth cells (Extended Data Fig. 8a ) or boost ISC numbers (Extended Data Fig. 1d, e); 2) Post-fast refeeding mediates its ISC-enhancing effects independent of the Paneth niche in a mouse model (i.e., Atoh-1IEC-KO )55 that lacks Paneth cells (Extended Data Fig. 8b, c); and lastly, 3) Prolonged CR or rapamycin treatment did not acutely induce polyamine metabolites in ISCs/progenitors (Extended Data Fig. 8d). Although long-term CR10 and a short-term fast/refeeding cycle both augment ISC function (Fig. 1b, Extended Data Fig. 8e), there are noteworthy differences between them, including limited caloric refeeding in CR versus AL refeeding for 24 hours after the short-term fast. This difference in chronicity and access to calories after the fasting phase of CR and short-term fasting may partly account for the mechanism engaged by these distinct fasting regimens.
Polyamine availability is regulated by several factors: de novo cellular biosynthesis, the microbiome, and diet56. Polyamines are crucial for cell growth, differentiation, and programmed cell death mediated by different mechanisms like protein and DNA synthesis 57. A recent study demonstrated that polyamine levels regulate the translation rate in hair follicle stem cells (HFSCs) to impact fate decisions58. However, the role of polyamines in regulating stem cell adaptation to diet and tumour initiation remains unclear. Our findings indicate that polyamine-induced protein translation in response to refeeding enhances the stemness program for ISC-derived regeneration. Refeeding increased glutamate, proline, and ornithine levels, contributing to de novo polyamine production in ISCs and progenitors (Extended Data Fig. 5f, g). Recent work illustrates that non-cell-autonomously generated polyamines from macrophages near the epithelium support epithelial homeostasis59. However, our work highlights a critical role for cell-autonomous, de novo polyamine synthesis in ISCs and progenitors in driving the response to refeeding, which boosts regeneration and tumourigenicity. While diet is an important polyamine source, de novo polyamine synthesis undergirds enhanced refed ISC function. Future research will be needed to ascertain whether polyamine-rich/supplemented diets emulate aspects of the post-fast refeeding response in the intestine and other tissues.
An important implication of this study is the distinct effects of fasting and post-fast refeeding on tumourigenesis. Previous studies have demonstrated that fasting interventions and fasting-mimicking diets mostly inhibit tumour growth2,11,12,60. However, these studies mainly focused on the fasted state; they did not delineate the contributions of the refed states on tumour initiation. Our results suggest that post-fast refeeding can increase the risk of intestinal tumour incidence if mutagenesis occurs in the refed state relative to the AL or fasted states. Additional studies in human cohorts are needed to understand better how the proportion of fast-eat time, total calorie intake, and meal content during refeeding and whether repetitive cycles of fasting and refeeding, like asynchronous intermittent fasting regimens (e.g., 2 days of fasting per week), augment ISC function without increasing tumour incidence even when mutagenesis occurs during the refed part of the cycle. Collectively, our data indicate that post-fast refeeding leads to a burst in stem cell-driven regeneration and that these refed stem cells when exposed to genetic alterations have an elevated risk of developing cancers in mouse models; thus, careful consideration should be given to fast-refeeding cycles when planning diet-based strategies for regeneration without increasing cancer risk.
Contact for reagent and resource sharing
Further information and requests for resources and reagents should be directed to and will be fulfilled by the Lead Contact, Ömer H. Yilmaz (ohyilmaz@mit.edu, (Ö.H.Y.)) or Alpaslan Tasdogan (alpaslan.tasdogan@uk-essen.de (AT)).
Experimental model and subject details
Key resource
All key resource information is available in Supplementary Table 2.
Mice strains
Mice were under the husbandry care of the Department of Comparative Medicine in Koch Institute for Integrative Cancer Research. The following strains were obtained from the Jackson Laboratory: Lgr5-EGFP-IRES-CreERT2 (strain name: B6.129P2-Lgr5tm1(cre/ERT2)Cle/J, stock number 008875), Rosa26-lacZ (strain name: B6.129S4- Gt(ROSA)26Sortm1Sor/J, stock number 003474), Rosa26LSL-tdTomato (strain name: B6.Cg-Gt(ROSA)26Sortm9(CAG-tdTomato)Hze/J, stock number 007909), Raptorloxp (strain name: B6.Cg-Rptortm1.1Dmsa/J, stock number 013188), Rpl24Bst/+ (strain name: C57BLKS-Rpl24Bst/J, stock number 000516). Villin-CreERT2 was a gift from Sylvie Robine and previously described61. Atoh1loxp/loxp;Villin-CreERT2 was a gift from Ramesh Shivdasani and previously described55. For lineage tracing experiments, Lgr5 -IRES-CreERT227(a gift from Dr. Hans Clevers) were crossed to Rosa26LSL-tdTomato strain. Apcloxp exon 14 (Apcflox/flox) has been previously described62, and Apcloxp/loxp; Lgr5-eGFP-IRES-CreERT2 were generated by crossing Lgr5-eGFP-IRES-CreERT247 to Apcloxp/loxp mice. Apcloxp/loxp; Villin-CreERT2, Odc1loxp/loxp; Villin-CreERT2, Tsc1loxp/loxp; Villin-CreERT2, Raptorloxp/loxp; Villin-CreERT2 mice were generated by crossing Apcloxp/loxp, Odc1loxp/loxp, Tsc1loxp/loxp, Raptorloxp/loxp mice to Villin-CreERT2 mice respectively 61. In this study, both male and female mice were used at the ages of 2-4 months unless otherwise specified in the figure legends. Tsc1loxp/loxp mice were a generous gift from D. Kwiatkowski (Harvard Medical School) and backcrossed to C57BL/6 mice for at least 6 generations as previously reported 10, and Apcloxp/loxp; Tsc1loxp/loxp; Lgr5-eGFP-IRES-CreERT2 were generated by crossing Apcloxp/loxp; Lgr5-eGFP-IRES-CreERT2 to Tsc1loxp/loxp mice. For the comparative experiment of Ad libitum, Fasted 24h, Refed 1d, and Refed 3d, fasting was achieved through food removal from mice at 9 AM (2 Zeitgeber Time in our mouse facility) and mice were sacrificed approximately 24 hr later. Post-fast refeeding for 1d was achieved through the return to Ad libitum at 9 AM after 24 hr fasting and mice were sacrificed approximately 24 hr later. Post-fast refeeding for 3d was achieved through the return to Ad libitum at 9 AM after 24 hours fasting and mice were sacrificed 72 hr later. Water was unlimited during fasting. To address the impact of circadian rhythm on stem cell function, the time of experiments was shifted by 12 hours, whereby fasting started at 9 PM (14 Zeitgeber Time) and refeeding at 9 PM and mice were sacrificed approximately 24 hr later.
Method details
In vivo treatments
Tamoxifen treatment: Tamoxifen injections were achieved by intraperitoneal (i.p.) injection suspended in sunflower seed oil (Spectrum S1929) at a concentration of 4 or 10 mg/ml, and intraperitoneally administered according to the time points indicated in figures and figure legends. The dose of administered tamoxifen was 2.5mg/25g for Lgr5 -IRES-CreERT2; Rosa26LSL-tdTomato lineage tracing experiments, Odc1loxp/loxp; Villin-CreERT2, Tsc1loxp/loxp; Villin-CreERT2, Raptorloxp/loxp; Villin-CreERT2, Atoh1loxp/loxp; Villin-CreERT2 mice experiments, and ex vivo Apcloxp/loxp; Lgr5-eGFP-IRES-CreERT2 experiments (Fig. 5d, e), and in vivo Apcloxp/loxp; Tsc1loxp/loxp;Lgr5-eGFP-IRES-CreERT2 mouse mode. 0.625mg/25g of tamoxifen was administered for in vivo Apcloxp/loxp; Lgr5-eGFP-IRES-CreERT2 mice experiments, Apcloxp/loxp; Lgr5-eGFP-IRES-CreERT2; Rpl24Bst/+ mice experiments, and kinetic experiment with Lgr5-eGFP-IRES-CreERT2; Rosa26LSL-tdTomato mouse model (Extended Data Fig. 6c, d, e). 0.0625mg/25g of tamoxifen was injected for in vivo Apcloxp/loxp; Villin-CreERT2 mice experiments. Rapamycin treatment: Rapamycin (LC Laboratories) treatment was administered by intraperitoneal injection at 10 mg/kg at the time points indicated in figures and figure legends. As described previously 10, rapamycin was reconstituted in absolute ethanol at 10mg/ml and diluted in 5% Tween-80 (Sigma) and 5% PEG-400 (Hampton Research) before injection. The final volume of all injection was 150 µl. Cycloheximide treatment: Cycloheximide (Millipore sigma) was administered by intraperitoneal injection at 75 µl per 25g of body weight (15mg/kg) at the time points indicated in figures and figure legends. Cycloheximide was suspended in PBS at a concentration of 5 mg/ml. OSI-906 and BKM 120: Linsitinib (OSI-906, Med Chem Express) was suspended in 5% DMSO, 40% PEG-300, 5% Tween-80, and 50% ddH2O at a concentration of 6.25 mg/ml, then administered by oral gavage at 160 µl per 20g (50 mg/kg). Buparlisib (BKM120, Med Chem Express) was reconstituted in DMSO and diluted in sunflower seed oil (Spectrum S1929) at a concentration of 2.5 mg/ml, then administered by oral gavage at 200 µl per 20g (25 mg/kg). Both drugs were administered at the time points indicated in figures and figure legends. DFMO treatment: DFMO was reconstituted in PBS (10mg/ml) and administered by intraperitoneal injection at 200mg/kg unless mentioned otherwise. Irradiation experiments: Mice were challenged by a lethal dose of irradiation (7.5Gy x 2, 6 hours apart). Intestinal and colonic tissues were collected for histology 3 days after ionizing irradiation induced (XRT). 5-FMO treatment: 5-FMO was reconstituted in PBS (1 mg/ml) for in vivo experiments. For the ornithine and polyamine measurement from refed C57BL/6J mice treated with 5-FMO, the mice were fasted at 9 am, 5-FMO was intraperitoneally administered to fasted mice at 10mg/kg at 4 and 8 am the next day, and then the mice were refed at 9 am and sacrificed to collect the intestinal crypt at 1 pm (refed 4h) at the same day. For irradiation experiments, the mice for refed with 5-FMO treatment group started fasting at 9 am and 5-FMO was administered at 3 am and 8 am during the fasting, refeeding started at 9 am following 24 h fasting and 5-FMO was administered at 2 pm and 9 pm during refeeding, and then these group mice were exposed to irradiation at 9 am following 24 h refeeding. Polyamine treatment: Spermidine and spermine were reconstituted in PBS (2.5mg/ml). For irradiation experiments, fasting started at 9 am, rapamycin (10 mg/kg) was intraperitoneally injected at 8 am and polyamine (spermidine and spermine, both 1.2 mg/kg) was orally administered at 8:30 am next day, then refeeding started at 9 am following 24 h fasting. Second dose of rapamycin and polyamines were administered during refeeding (8am and 8:30am), then mice were exposed to irradiation following 24 h refeeding. For puromycin assay, 1.2mg/kg of polyamine (spermidine and spermine) was orally administered 1 hour before refeeding and 23 hours post-refeeding, then crypts from refed mice with rapamycin treatment were collected for the assay. GC7 experiments: GC7 drinking water at a concentration of 75 uM was given to the mice for 5 days, then the mice for the refed group were fasted and refed for 24 hours. GC7 was given to the mice during fasting and refeeding.
Crypt Isolation and culturing
As previously reported and briefly summarized here 9, small intestines were removed, washed with cold PBS, opened longitudinally and then incubated on the shaker machine at 4℃ with PBS plus EDTA (10 mM) for 45 min. Tissues were then moved to PBS. Crypts were then mechanically separated from the connective tissue by shaking, and then filtered through a 70-μm mesh into a 50 mL conical tube to remove villus material and tissue fragments. Isolated crypts for cultures were counted and embedded in Matrigel (Corning 356231 growth factor reduced) at 8-10 crypts per µl and cultured in a modified form of medium as described previously 10,63. Unless otherwise noted, crypt culture media consists of Advanced DMEM (GIBCO) that was supplemented with EGF 40 ng ml−1 (PeproTech, 315-09), Noggin 200 ng ml−1 (PeproTech, 250-38), R-spondin 500 ng ml−1 (R&D, Sino Bioscience or 64), B27 1X (Life Technologies, 17504044), CHIR99021 3 µM (LC laboratories, C-6556), and Y-27632 dihydrochloride monohydrate 10 µM (Sigma-Aldrich, Y0503). For organoid assay of Tsc1loxp/loxp; Villin-CreERT2, Raptor loxp/loxp; Villin-CreERT2, and Odc1loxp/loxp; Villin-CreERT2 mice model, B27 was removed from the crypt culture medium. DFMO (1.5 mM) and Spermidine (50 uM) were added to the culture medium for organoid experiment utilizing Odc1 mouse model. 200-250 isolated intestinal crypts were re-suspended in 5 µl of above-mentioned media and 20 µl of Matrigel, and seeded in a flat bottom 48-well plate (Corning 3548). Matrigel is allowed to solidify for 20-30 minutes in a 37℃ incubator. 300 µl of crypt culture medium was then overlaid onto the Matrigel, changed every three days, and maintained at 37℃ in fully humidified chambers containing 5% CO2. Clonogenicity (colony-forming efficiency) was calculated by assessing organoid formation 3-6 days or as specified after initiation of cultures. If not directly used for cultures, crypts were then dissociated into single cells and sorted by flowcytometry 10. Flow isolated ISCs or progenitor cells were centrifuged at 200 g for 3 minutes, re-suspended in the appropriate volume of crypt medium and seeded onto 15 µl of Matrigel containing 1 µM JAG-1 protein (AnaSpec, AS-61298) in a flat bottom 48-well plate (Corning 3548). The Matrigel and cells were allowed to solidify before adding 300 µl of crypt culture medium.
Flow Cytometry
Following small intestinal crypt isolation, crypt suspensions were pelleted (300g, 5min, 4℃) and dissociated with TrypleLE. Dissociated single cells were treated with the following antibody for flow cytometry analysis: CD45-PE, CD31-PE, Ter-119PE, CD24-Pacific Blue, CD117-APC/Cy7, and EpCAM-APC. 7-AAD was used a viability to exclude the dead cells from the analysis. To visualize all populations: FSC-A/SSC-A. For doublet exclusion: FSC-W/FSC-A and SSC-W/SSC-A. To obtain live cells: 7-AAD negative population was chosen. To obtain epithelial cells: EpCAM+, CD31-, Ter119-, CD45-. Stem cells and their progenitors: Since we use used Lgr5-eGFP reporter strain, we use high GFP as a proxy for intestinal stem cells (ISCs) and low GFP expression as a proxy for ISC progenitors. To increase stringency of sorting, we additionally chose CD24- population. To summarize, ISCs: Lgr5-eGFP (high)/EpCAM+/CD24-/CD31-/Ter119-/CD45-/7AAD- population. ISC progenitors: eGFP (low)/EpCAM+/CD24-/CD31-/Ter119-/CD45-/7AAD-. The instrument was BD FACS ARIA and BD FACSDIVA and Flowjov10 were used as the software.
qRT-PCR
25,000 single cells were flow-sorted into Tri Reagent (Life Technologies), and total RNA was purified according to the manufacture’s instructions with following modifications: the aqueous phase containing total RNA was purified using RNeasy plus kit (QIAGEN). RNA was converted to cDNA with cDNA synthesis kit (Bio-Rad). qRT-PCR was performed with diluted cDNA (1:3) in 2 wells for each primer and SYBR green master mix on Roche Light Cycler® 480 detection system. The following primers are used for qRT-PCR: Odc1 forward, 5’-GACGAGTTTGACTGCCACATC-3’; Odc1 reverse, 5’-CGCAACATAGAACGCATCCTT-3’; Srm forward, 5’-CTTCCCCGTGGTGGACTAC-3’; Srm reverse, 5’-TGCTCGGGTTTTTGCTACACA-3’; Sms forward, 5’-CACAGCACGCTCGACTTCAA-3’; Sms reverse, 5’-TGCCATTCTTGTTCGTGTAAGTT-3’; Amd1 forward, 5’- AGGGATCTGGGGATCTTCGTA-3’; Amd1 reverse, 5’-TGCTTGTCAGTCTTTGTCACAC-3’; Paox forward, 5’-TGGGCTGGATTGCATCTTGG-3’; Paox reverse, 5’- AAAAGCGACCGTATCCTTGGG-3’; Sat1 forward, 5’-GAGAACACCCCTTCTACCACT-3’; Sat1 reverse, 5’-GCCTCTGTAATCACTCATCACGA-3’; Smox forward, 5’- TCCCACGGGAATCCTATCTATC-3’; Smox reverse, 5’-GCCACGGTTGGTAAGGTAGC-3’; Cps1 forward, 5’-ACATGGTGACCAAGATTCCTCG-3’; Cps1 reverse, 5’- TTCCTCAAAGGTGCGACCAAT-3’; Otc forward, 5’-AGGGTCACACTTCTGTGGTTC-3’; Otc reverse, 5’-CAGAGAGCCATAGCATGTACTG-3’; Oat forward, 5’-GGAGTCCACACCTCAGTCG-3’; Oat reverse, 5’-CCACATCCCACATATAAATGCCT-3’; Bst1 forward, 5’-AGG GAC AAG TCA CTG TTC TGG-3’; Bst1 reverse, 5’-AAC TTT GCC ATA CAG CAC GTC-3’; β-Actin forward, 5’- GGCTGTATTCCCCTCCATCG-3’; β-Actin reverse, 5’ CCAGTTGGTAACAATGCCATGT -3’.
In Situ Hybridization (ISH)
Single-molecule in situ hybridization was performed using Advanced Cell Diagnostics RNAscope 2.0 HD Detection Kit (Fast Red dye) for the following probes: Mm-Lgr5 (Ref 312171), Mm-Pdgfa (Ref 411361), Mm-Gkn3 (Ref 512061), Mm-Oat (Ref 545901)
Immunohistochemistry
As previously described 20, tissues were fixed in 10% formalin, paraffin embedded and sectioned in 5 micron sections. Antigen retrieval was performed with Borg Decloaker RTU solution (Biocare Medical) in a pressurized Decloaking Chamber (Biocare Medical) for 30 minutes at 95℃. Antibodies and respective dilutions used for immunohistochemistry are as follows: rat anti-BrdU (1:2000, Abcam 6326), rabbit monoclonal OLFM4 (1:10,000, CST #66479), rabbit polyclonal lysozyme (1:2000, Thermo RB-372-A1), rabbit monoclonal Cleaved Caspase-3 (1:500, CST #9664), rabbit polyclonal anti-RFP (1:500, Rockland 600-401-379), rabbit monoclonal phospho-H3 (1:500, CST #3377), rabbit monoclonal phospho-S6 ribosomal protein (1:500, CST #4858), mouse monoclonal β-catenin (clone14, 1:100, BD Transduction Laboratories). Biotin- conjugated secondary donkey anti-rabbit, anti-rat antibodies, or anti-mouse antibodies were used (1:500, Jackson ImmunoResearch). Vectastain ABC immunoperoxidase detection kit (Vector Laboratories PK-6101) was followed by Signalstain® DAB subsrate kit for visualization (CST, 8049S). All antibody dilutions were performed in Signalstain® Antibody Diluent (CST, 8112L).
Immunoblotting
The following antibodies were used for western blotting: Mouse monoclonal Actin (clone C4, 1:1000, Millipore sigma MAB1501), rabbit monoclonal S6 ribosomal protein (1:500, CST #2217), rabbit monoclonal phospho-S6 ribosomal protein (1:500, CST #4858), rabbit monoclonal 4E-BP1 (1:1000, CST #9644), rabbit monoclonal phospho-4E-BP1 (1:500, CST #2855), rabbit monoclonal phosphor-Akt (Ser473) (1:500, CST #4060), rabbit monoclonal Akt (pan) (1:1000, CST #4691), rabbit monoclonal Hypusine (1:1000, Millipore sigma #ABS1064), mouse monoclonal eIF5A (1:1000, BD Biosciences #611977), mouse monoclonal Puromycin (clone 12D10, 1:10,000, Millipore sigma MABE343), rabbit polyclonal OAT (1:1000, Abcam #ab137679, rabbit polyclonal DHPS (1:1000, Abcam #ab190266). Isolated crypts were washed with cold PBS twice and eluted with RIPA buffer (CST #9806S). After centrifuging at 10,000 rpm for 15 minutes at 4℃, the resulting supernatant was calculated for protein concentration using Pierce™ BCA protein assay kit (Thermo Fisher Scientific 23225), then suspended in Laemmli SDS sample buffer (VWR J61337-AC) at a concentration of 1.5-2 ug/uµl, boiled for 5 min at 95℃. Samples were resolved by SDS–PAGE and analyzed by immunoblotting with horseradish peroxidase (HRP)-conjugated IgG secondary antibody (1:5,000, anti-rabbit CST #7074, anti-mouse CST #7076) and Western Bright Chemiluminescent detection kit (Advansta, ECL K-12045-D20, Sirius K-12043-D20). For the immunoblotting on flow-sorted cells, 2.5x10⁴ of each Lgr5-GFPhi ISCs, Lgr5-GFPlow progenitors were sorted directly into 10 µl of Laemmli SDS sample buffer and boiled for 5 min. The samples were subjected to immunoblot analysis.
Protein synthesis assay
Protein synthesis was assessed using puromycin which incorporates at the C-terminus of nascent polypeptide chains. As previously reported21, isolated crypts were incubated at 37℃ with minimum nutrition medium (Advanced DMEM supplemented with B27 1X and Y-27632 dihydrochloride monohydrate 10 µM) and 10 ug ml-1 puromycin for 15 min, centrifuged for 5 min, and then resulting pellet was eluted with RIPA buffer. The up-taken puromycin to the nascent polypeptide was analyzed with immunoblotting using mouse monoclonal anti-puromycin antibody (1:10,000, Millipore MABE343). For the protein synthesis assay on flow-sorted cells, isolated crypts from Lgr5-EGFP-IRES-CreERT2 mice were incubated with 10 ug ml-1 puromycin, crypts were then dissociated into single cells and sorted by flowcytometry into 10 µl of Laemmli SDS sample buffer.
Blood Glucose test
1 drop of blood sample for each time point was obtained by cutting off the tip of tail (-1mm), and blood glucose was quickly measured using the Free Style Precision Neo System Kit and Blood Glucose Test Strip (Abbott).
Polyamine isotope tracing assay
To measure de novo synthesis of polyamine we collected small intestinal crypts from AL, fasted, refed 4 h and refed 24 h. crypts were counted and plated at 20,000 crypts for each time point. For 13C-ornithine, crypts were plated with SILAC media supplemented with 0.2 mM L-lysine and 1.1mM 13C-ornithine. For 13C-arginine, crypts were plated with SILAC containing 1.1mM 13C-arginine. Both media conditions did not contain B27 supplement. Crypts were allowed to stay in each of the conditions for 0, 1 h, 2 h and 4 h at 37ºC. Crypts were then collected and washed 3 times with cold PBS and then pelleted and frozen in liquid nitrogen. Samples were then stored in −80 ºC.
The measurement of ornithine metabolism
Sample collection
3cm of intestinal tissue from the middle jejunum was minced for 1min using razor blades, and resuspended in cold PBS. Resuspended tissue was homogenized by a douncer, centrifuged for 2000g for 2 min to spin down tissues, then resulting supernatant was transferred to 1.5 ml tube. 200 µl of supernatant and 800 µl of 87.5% Ethanol preheated at 70 ℃ were incubated for 3 min, then 400 µl of supernatant was transferred following the centrifuge at 14000g for 3 min.
Flow-Injection TOF analysis for ornithine metabolomic
Non-targeted metabolomic experiment was conducted with General Metabolics (Boston, MA, USA). The analysis was performed on a platform on an Agilent 1260 Infinity II LC pump coupled to a Gerstel MPS autosampler (CTC Analytics, Zwingen, Switzerland) and an Agilent 6550 Series Quadrupole TOF mass spectrometer (Agilent, Santa Clara, CA, USA) with Dual AJS ESL source operating in negative mode as described previously65. The flow rate was 150 µl/min of mobile phase consisting of isopropanol : water (60:40, v/v) with 1 mM ammonium fluoride. For online mass axis correction, two ions in Agilent’s ESI-L Low Concentration Tuning Mix (G1969-85000) were used. Mass spectra were recorded in profile mode from m/z 50 to 1,050 with a frequency of 1.4s for 2 x 0.48 min (double injection) using the highest resolving power (4 GHz Hires).
Data Analysis for ornithine metabolomics
All steps of mass spectrometry data processing and analysis were performed with MATLAB (The Mathworks, Natick, MA, USA) using functions embedded in the Bioinformatics, Statistics, Database, and Parallel Computing toolboxes as described previously65. The resulting data included the intensity of each mass peak in each analyzed sample. Peak picking was done for each sample once on the total profile spectrum obtained by summing all single scans recorded over time, and using wavelet decomposition as provided by the Bioinformatic toolbox. In this procedure, a cutoff was applied to filter peaks of less than 5,000 ion counts (in the summed spectrum) to avoid the detection of features that are too low to deliver meaningful insights. Centroid lists from samples were then merged to a single matrix by binning the accurate centroid masses within the tolerance given by the instrument resolution. Starting from the HMDB v4.0 database (REF HMDB), we generated a list of expected ions including deprotonated, fluorinated, and all major adducts found under these conditions. All formulas matching the measured mass within a mass tolerance of 0.001 Da were enumerated. As this method does not employ chromatographic separation or in-depth MS2 characterization, it is not possible to distinguish between compounds with identical molecular formula. The confidence of annotation reflects Level 4 but-in practice-in the case of intermediates of primary metabolism it is higher because they are the most abundant metabolites in cells biological extracts. The resulting matrix lists the intensity of each mass of the values obtained from independent centroiding.
Sample collection and extraction for polyamine measurement
Chemicals
LC-MS grade acetonitrile, acetone and methanol were obtained from Avantor International (Darmstadt, Germany). LC-MS grade acetic acid, formic acid, and ammonium formate were purchased from Fisher Scientific (Schwerte, Germany). PBS (1x) was purchased from CLS (Eppelheim, Germany). Dansylchloride, argininosuccinic acid, cadaverin, L-anserine, L-arginine, L-aspartic acid, L-citrulline, L-ornithine, N1,N12-diacetylspermine, N1-Ac-putrescine, N1-Ac-spermidine, N1-Ac-spermine, proline, putrescine, spermidine, spermine, spermine-2H8 were from Sigma Aldrich (Steinheim, Germany). L-Arginine13C6 and L-Ornithine13C5 were from Cambridge Isotope Laboratories (Tewksbury, MA, USA) and spermidine-2H6 was from Cayman Chemicals obtained via Biomol (Hamburg, Germany). Ultrapure and desalted water with a resistivity of 18.2 M Ω/cm was generated by a Sartorius Stedim water purification system (Sartorius, Goettingen, Germany). All other chemicals were purchased by local distributors in the highest possible grade.
Extraction of Polyamines
Polyamines were extracted by a two-step liquid extraction adapted from Sellik et al.66. Briefly, 30k crypt stem cells were snap-frozen in liquid nitrogen for quenching. The frozen cells were extracted by adding 500 µL prechilled methanol (-80 °C), 20 µL of internal standard (L-arginine-13C6, spermidine-2H6, spermine -2H8 at a concentration of 100 µM which will result in a concentration of 10 µM in the final extract) and vortexed for 2 minutes until no cell clumps were visible. Afterwards, the samples were sonicated in a chilled (0 °C) ultrasonic bath for two minutes. The cells were kept at −80 °C for 5 minutes and subsequently thawed. The thawed cells were vortexed and sonicated for 2 minutes and centrifuged at 3000 g for 5 minutes. The supernatant was collected and 250 µL of water acidified with 0.1 % acetic acid (LC-MS grade) was added. The samples were vortexed and sonicated for 2 minutes and subject to the same freezing-thawing cycle described before. The thaw samples were again vortex and sonicated for 2 minutes, respectively. Next, the samples were centrifuged at 3000g for 5 minutes and the supernatant was collected. The combined supernatant was dried in a vacuum-centrifuge for 45 min until complete dryness. The dried extract is resuspended in 200 µL acetonitrile/water (50/50; v/v) by sonicating and vortexing for 2 minutes, respectively. The final extract was obtained as the supernatant following a final centrifugation at 12,000 rpm for 2 minutes.
Dansylation of Polyamines
Dansylation was carried out by using 80 µL of the obtained extract or of a standard solution with a known concentration. The solution is dried and then reconstituted in 80 µL water, 40 µL PBS (1x), and 20 µL of 1M NaOH. The reaction was started by adding 80 µL of a dansylchloride solution (10 mg/mL in acetone). The mixture was incubated at 55 °C for 30 minutes. Afterward, the solution was dried in a vacuum centrifuge to complete dryness for 45 minutes. The residue was dissolved in 80 µL of acetonitrile/water (50/50; v/v) and subsequently analyzed by LC-MS.
LC-MS analysis and quantification
For polyamine analysis, an Agilent 1290 Infinity LC system coupled to an Agilent 6470 QqQ-MS was used (Agilent Technologies Inc., Waldbronn, Germany). Liquid chromatographic (LC) separation was carried out using a Zorbax Eclipse Plus C18 RRHD (50 x 2.1 mm, 1.8 µm; Agilent Technologies Inc., Waldbronn, Germany). The elution was carried out by utilizing a gradient at a flow rate of 400 μL/min with water (10 mM ammonium formate pH 3.5) as solvent A and acetonitrile/water (90/10; v/v; 10 mM ammonium formate pH 3.5) as solvent B. The linear gradient was: 0 min, 15% B; 2 min, 15% B; 7 min, 100% B; 10 min, 100% B followed by 2 min at initial condition for re-equilibration. Column temperature was 45 °C, injection volume 10 µL. Ionization was carried out in ESI positive mode by using the Agilent jet stream source. The following MS parameters were used: capillary 4500 V, nozzle voltage 1000 V, gas temp. 275 °C, gas flow 10 L/min, nebulizer gas pressure 25 psi, sheath gas temp. 350 °C, sheath gas flow 10 L/min. Detection was carried out in selected reaction monitoring (SRM) using the following optimized transitions for the transitions and parameters shown in (Table 2).
Table 2.
– Transition setting and internal standard for the analysis of polyamines
| Compound | Internal standard | m/z Q1 | m/z Q2 | Dwell time (ms) | Fragmentor (V) | Collision Energy (V) | Cell Accelerator (V) |
|---|---|---|---|---|---|---|---|
| Dansylchloride | - | 234.7 | 234.7 | 50 | 200 | 0 | 4 |
| L-Arginine-13C6 | - | 408.1 | 70.1 | 50 | 200 | 35 | 4 |
| N1-Ac-Putrescine | Spermidine-2H6 | 364.1 | 170.1 | 50 | 160 | 30 | 4 |
| N1-Ac-Spermidine | Spermidine-2H6 | 654.1 | 101.1 | 50 | 200 | 40 | 2 |
| N1-Ac-Spermine | Spermidine-2H6 | 944.1 | 360.1 | 50 | 200 | 53 | 2 |
| Putrescine | Spermidine-2H6 | 555.2 | 170.1 | 50 | 220 | 40 | 3 |
| Spermidine | Spermidine-2H6 | 845.4 | 360.1 | 50 | 220 | 46 | 2 |
| Spermidine-2H6 | - | 851.4 | 366.1 | 50 | 220 | 43 | 2 |
| Spermine | Spermine-2H8 | 1135.4 | 360.1 | 50 | 220 | 50 | 3 |
| Spermine-2H8 | - | 1143.4 | 367.1 | 50 | 180 | 55 | 3 |
For amino acid analysis, the same system was used. LC separation was carried out using a AdvanceBio MS Spent Media HILIC column (2.1x150 mm 2.7 µm; Agilent Technologies Inc., Waldbronn, Germany). For elution a binary gradient with water 10 mM ammonium formate + 0.1% formic acid as A and 90/10 ACN/Water 10 mM ammonium formate + 0.1% formic acid as B was used. The flow rate was 400 µL and the linear gradient program was: 0 min 90% B, 2 min 90% B, 12 min 40% B, and 12.1 min 5% B, which was held for 6 min. followed by 4 min at initial conditions for re-equilibration. Column temperature was 45 °C, injection volume 10 µL. For ESI and MS detection the following parameters were used: capillary 3000 V, nozzle voltage 0 V, gas temp. 225 °C, gas flow 6 L/min, nebulizer gas pressure 40 psi, sheath gas temp. 225 °C, sheath gas flow 10 L/min. Detection was carried out in selected reaction monitoring (SRM) using the following optimized transitions for the transitions and parameters shown in (Table 3). Non-derivatized polyamines were only monitored with this method but spermidine and spermine showed rather high limit-of-detections. Therefore, quantification of these compounds was done in a separate method.
Table 3.
– Transition setting and internal standard for the analysis of amino acids
| Compound | Internal standard | m/z Q1 | m/z Q2 | Dwell time (ms) | Fragmentor (V) | Collision Energy (V) | Cell Accelerator (V) |
|---|---|---|---|---|---|---|---|
| Argininosuccinic acid | L-Arginine-13C6 | 291.1 | 70.2 | 50 | 195 | 25 | 6 |
| Cadaverin | Spermidine-2H6 | 103.1 | 86.1 | 50 | 135 | 13 | 4 |
| L-Anserine | L-Arginine-13C6 | 241.1 | 109 | 50 | 135 | 25 | 4 |
| L-Arginine | L-Arginine-13C6 | 175.1 | 70.2 | 50 | 150 | 25 | 6 |
| L-Arginine-13C6 | - | 181.1 | 74.2 | 50 | 135 | 25 | 4 |
| L-Aspartic acid | L-Arginine-13C6 | 134 | 88 | 50 | 120 | 17 | 3 |
| L-Citrulline | L-Arginine-13C6 | 176.1 | 70.2 | 50 | 145 | 25 | 6 |
| L-Ornithine | L-Arginine-13C6 | 133.1 | 70.2 | 50 | 130 | 29 | 4 |
| N1,N12-Diacetylspermine | Spermidine-2H6 | 287.2 | 100.1 | 50 | 135 | 20 | 4 |
| N1-Ac-Putrescine | Spermidine-2H6 | 131.1 | 72.1 | 50 | 135 | 15 | 4 |
| N1-Ac-Spermidine | Spermidine-2H6 | 188.2 | 72.1 | 50 | 160 | 20 | 4 |
| N1-Ac-Spermine | Spermidine-2H6 | 245.2 | 112.2 | 50 | 145 | 25 | 4 |
| Proline | L-Arginine-13C6 | 116.1 | 70.1 | 50 | 135 | 15 | 4 |
| Putrescine | Spermidine-2H6 | 89.1 | 72.2 | 50 | 110 | 11 | 4 |
| Spermidine | Spermidine-2H6 | 146.2 | 72.1 | 50 | 135 | 16 | 5 |
| Spermidine-2H6 | |||||||
| Spermine | Spermine-2H8 | 203.2 | 112.1 | 50 | 145 | 18 | 6 |
| Spermine-2H8 | - | 211.3 | 120.1 | 50 | 145 | 18 | 6 |
Quantification in crypt cells was performed by an external calibration in a range from 0.1 µM to 90 µM using 3 deuterated internal standards (L-arginine-13C6, spermidine-2H6, and spermine-2H8) at a concentration of 10 µM. For calibration, the analyte to internal standard area ratios were linearly fitted to the corresponding concentration ratios and compared to the area ratios detected in the samples.
Isotope Tracing Mass Spectrometry
The same extraction procedure was used for isotope tracing experiments. The samples were analyzed by LC-Orbitrap Q Exactive Plus MS (Thermo Fisher Scientific, Bremen, Germany). For LC separation an Agilent 1290 Infinity II Bio LC system (Agilent Technologies Inc., Waldbronn, Germany) was used utilizing the same column and conditions as described for the amino acid analysis. HESI II was used for ionization with the following settings: sheath gas 40 au, aux gas 15 au, and sweep gas 1 au. The spray voltage was 3.5 kV S-lens RF level 40. The MS inlet capillary was kept at 300°C and the aux gas at 350°C. The MS acquisition was done in positive mode with an MS1 scan range from 50 to 400 m/z at a resolution of 70.000 at m/z 200. For MS parameters 1 microscan was used, the default charge was 1, AGC target was set to 1e6, max. IT to 50 ms and the chromatographic peak width was estimated to be 12 s. Data-dependent MS2 has been used with a resolution of 17.500 at m/z 200. Here minimal AGC and the AGC target were 8e3 and 2e5 respectively, while the max. It was set to 100 ms. A stepped NCE (30, 50, 70) was carried out for fragmentation in an isolation window of 1 m/z and with a loop count of 5. Dynamic exclusion of 30 s was applied additionally to the isotope exclusion. An internal lock mass at 391.2842 m/z was used to provide high mass accuracy.
All isotope tracing data of putrescine was normalized to non-labeled putrescine. Therefore, the extracted ion chromatograms of putrescine (m/z 89.1073 [M+H]+) and the M+4 isotope (m/z 93.1207 [M+H]+) were integrated. The isotope ratio was calculated as the peak area of the non-labeled putrescine divided by the peak area of the fully labeled M+4 isotope.
10x droplet scRNAseq
Preparation of the samples and libraries
Cells were sorted with the same parameters as described above for flow-cytometry into an Eppendorf tube containing 20 µl of minimum nutrition medium (Advanced DMEM supplemented with B27 1X and Y-27632 dihydrochloride monohydrate 10 µM) and stored on ice until proceeding to the Chromium Single Cell Platform. Single cells were processed through the Chromium Single Cell Platform using the Chromium Single Cell 3’ Library, Gel Bead and Chip Kits (10X Genomics, Pleasanton, CA), following the manufacturer’s protocol. Briefly, an input of 10,000 cells was added to each channel of a chip with a recovery rate of 4,000-4,500 cells. The cells were then partitioned into Gel Beads in Emulsion (GEMs) in the Chromium instrument, where cell lysis and barcoded reverse transcription of RNA occurred, followed by amplification, tagmentation and 5’ adaptor attachment. Libraries were sequenced on an Illumina NextSeq 500.
Droplet scRNAseq processing
The cellranger (version 3.1.0, 10x Genomics) application mkfastq was used to deconvolute raw fastq sequences and the application count was used to collapse UMIs, map to the mm10 mouse genome assembly and prepare count matrices. The cellranger filtered_feature_bc_matrix output data were imported into Seurat (version 3.2.0.)20 and genes detected in less than 3 cells per sample were excluded as were cells with fewer than 200 detected genes. No additional filtering was done based on mitochondrial gene expression. These criteria resulted in 4760, 4282, 4552 and 4467 cells for al, f, rf and rf.rapa respectively. The samples were merged into a single Seurat object and log normalized with a scaling factor of 10000. The vst method was used to identify the top 2000 most variable gene and dimensionality reduction was done using UMAP using 30 principal components. Initial examination of UMAP plots identified a subtle systemic difference between samples that were accounted for by dataset integration. Cell clusters were identified using a resolution value of 0.8 and clusters were assigned to cell type by examining the expression of individual genes or ssGSEA projections. Differential expression testing between clusters was done with the wilcox test implemented in the FindMarkers function. Pre-ranked GSEA was run using GSEA version 4.167 using custom gene sets derived from Biton’s paper33 with log2 fold change from the differential expression testing as a ranking metric. To assess the cell cycle status in each cluster, the human g2m and s cell cycle gene lists provided by the Seurat package were mapped to mouse orthologs using Mouse Genome Informatics orthology data. The Percent Feature Set function was used to annotate each cell for the expression level of these sets. A Yes/No expression flag was then applied if percentage values were greater than 0.3 for the “g2m” set or 0.2 for the “s” set. The proportion of cells in each sample/cluster group was then tabulated for these flags. Single sample gene set enrichment analysis with Biton I/II/III gene set was performed using the escape version 1.0.0 running under R version 4.0.3. The R code used to process the single cell RNA-Seq data and prepare plots is available upon request.
Statistics and Reproducibility
Unless otherwise specified in the main text or figure legends, all experiments reported in this study were repeated at least three independent times. Unless otherwise specified in the main text or figure legend, all sample numbers (n) represent biological replicates. For organoid assays, 3-5 wells per group at least 3 different mice were analyzed. No sample or animals were excluded from analysis and sample size estimates were not used. Studies were not conducted blind with the exception of all histological analyses. .Age- and sex- matched mice were randomly assigned to groups. The images for H&E staining and immunohistochemistry represent one of ≥ 5 biological replicates unless otherwise noted. The immunoblotting experiments (Figure 2a, 2c, 3f, 4e, 4g, 4h, 4i, Extended Data Figure 3b, 3c, 3d, 3f, 3g, 4i, 5h, 5i, 5j, 5k, 5l, 5m, 5q, 5t, 5v, 7m, 7o) were repeated three times independently and representative data are shown in each panel. All values are presented as mean ± s.d. Unless otherwise specified in the figure legend, intergroup comparison was performed using unpaired two-tailed t-tests or one-way analysis of variance (ANOVA) with post- hoc Tukey’s multiple comparison. For statistical assessment of differences in proportionality, Fisher’s exact 2x2 test was performed. Statistics in Supplementary Table 1 were performed using Wilcoxon rank sum test (two-tailed). P value of <0.05 were considered to be significant. Statistical analysis was performed using GraphPad Prism 9. Please note that statistical details are found in the figure legends.
Extended Data
Extended Data Fig. 1. Refeeding does not alter the intestinal morphology, the number of ISCs, or differentiated cells.

(a) Normalized mice weight ratio of AL (left) and fasted 24h- refed 24h (right). n = 10–12 mice group, pooled from 3 independent experiments. (b) Quantification (left) and representative images of phospho-H3+ cells by IHC per jejunal crypt (right). n = 5 mice per group. Scale bar, 25 µm (c) Length of crypt (left) and villi (right) in the jejunum. n = 4 mice per group. (d) Quantification (left) and representative images of IHC for OLFM4 per jejunal crypt (right). n = 3 mice per group. Scale bar, 25 µm. (e) Quantification (left) and representative images of in situ hybridization (ISH, red) for Lgr5 mRNA (right). n = 4 mice per group. Scale bar, 50 µm. (f) (g) Quantification (left) and representative images (right) of Cleaved caspase3+ cells in the villi (f) and crypt (g). n = 5 mice per group. Scale bar, 25 µm. (h) Quantification (left) and representative images (right) of Paneth cells by IHC for Lysozyme. n = 4 mice per group. Scale bar, 25 µm. (i) Quantification (left) and representative images (right) of jejunal Alician Blue staining. n = 5 mice per group. Scale bar, 50 µm. (j) Organoid-forming assay for intestinal crypts isolated from AL, Fasted, Refed 1d, and Refed 3d mice. Quantification (left) and representative images of day 3 organoids (right). n = 3 mice per group, pooled from 3 independent experiments. Scale bar, 200 µm. (k) Quantification (left) and representative images of IHC for tdTomato (orange arrows, right) in the colon. n = 20 crypts per measurement, n = 5 mice per group, pooled from 3 independent experiments. Scale bar, 25 µm. One-way ANOVA (a, b, c, d, e, f, g, h, i, j, k). Data are mean ±s.d, *p < 0.05, **p < 0.01, ****p < 0.0001, ns = not significant.
Extended Data Fig. 2. Circadian cycle does not have an impact on refeeding-mediated crypt proliferation and organoid-forming capacity.

(a) Schematic of BrdU assay with different fasting time. (b) Quantification (left) and representative images of BrdU+ cells (4 hours after BrdU administration) by IHC per jejunal crypt (right). n = 25-30 crypts per measurement, n = 5 mice per group. (c) Quantification (left) and representative images of BrdU+ cells (4 hours after BrdU administration) by IHC per jejunal crypt (right). n = 25-30 crypts per measurement, n = 5 mice per group. Scale bar, 50 µm. (d) Organoid-forming assay for intestinal crypts isolated from AL, Fasted, Refed 1d mice. Quantification (left) and representative images of day 3 organoids (right). n = 3 mice per group, Scale bar, 500 µm. One-way ANOVA (b, c, d). Data are mean ± s.d. *p < 0.05, ***p < 0.001, ****p <0.0001.
Extended Data Fig. 3. Insulin-PI3K signal is a trigger to activate mTORC1 signal after refeeding.

(a) Time course of blood glucose levels measured from tail-tip samples in AL (red) and refed (pre and post refeeding, blue) mice. n = 4 mice per group. (b) Immunoblots for phospho-AKT and mTORC1 downstream targets in crypts from AL, Refed 1h and Refed 1h treated with OSI-906 (left) or BKM120 mice (right). (c) Immunoblots for pS6 and total S6 in crypts from AL, Fasted, and Refed mice (started fasting and refeeding at 9PM). (d) Immunoblots for pS6 and total S6 in crypts from AL, Refed 1d with or without rapamycin treatment. (e) Quantification of BrdU+ cells per jejunal crypt from AL and Refed 1d with or without rapamycin treatment (left), and representative images of IHC for BrdU (right). n = 4-5 mice per group, pooled from 3 independent experiments. Scale bar, 25 µm. (f) Immunoblots for pS6 and total S6 in crypts from AL and Refed 1d Tsc1 WT or KO mice. (g) Immunoblots for pS6 and total S6 in crypts from AL and Refed 1d Raptor WT or KO mice. Two-way ANOVA (a). One-way ANOVA (e). Data are mean ±s.d. **p < 0.01, ***p < 0.001.
Extended Data Fig. 4. Refeeding stimulates proliferation and stemness in primitive ISC subsets.

(a) Feature heatmaps for genes encoding enterocyte, secretory lineage, and stem cell markers. (b) GSEA for Biton-I, II, III gene signatures among ISC subsets (clusters 5, 2 and 10) from AL (al) mouse. NES, normalized enrichment score; FDR, false discovery rate. (c) Cell-cycle marker gene analysis for each ISC subset (5, 2,10) from all dietary condition. (d) Frequency of cells expressing S phase or G2/M phase cell-cycle marker genes in clusters 5, 2, 10, and non-ISC subsets in the different dietary conditions with or without rapamycin treatment (rf). (e) Violin plots for the mean expression of Biton-I, -II, and III gene signatures within each cluster across the different dietary conditions with or without rapamycin treatment (rf). (f) (g) Gkn3 (f) or Pdgfa (g) gene expression level in cluster 5 (left) and representative images of in situ hybridization (ISH, red) (right). n = 4-5 mice per group. Scale bar, 10 µm. (h) qPCR for Oat on FACS-sorted ISCs. n = 4-9 mice per group, pooled from 4 independent experiments. Duplicate measurements were taken from each mouse. (i) Immunoblots for OAT, pS6 and total S6 in crypts from AL Tsc1 WT or KO mice. (j) (k) Ornithine level in the crypts from AL or refed Tsc1 loxp/loxp;Villin-CreERT2 (j) or Raptor loxp/loxp;Villin-CreERT2 (k) mice. n = 5-6 mice per group, pooled from 4 independent experiments. (l) Ornithine level in the crypts from refed 4 h mice with or without OAT inhibitor (5-FMO) treatment. n = 6-7 mice per group. pooled from 3 independent experiments. One-way ANOVA (c, e, f, g, h, j). Fisher’s exact two-sided test (d). Unpaired two-tailed t-tests (k, l). Data are mean ±s.d. *p < 0.05, **p < 0.01, ***p < 0.001, ****p < 0.0001.
Extended Data Fig. 5. mTORC1 activity regulates the polyamine level and hypusinatin of eIF5A in crypts.
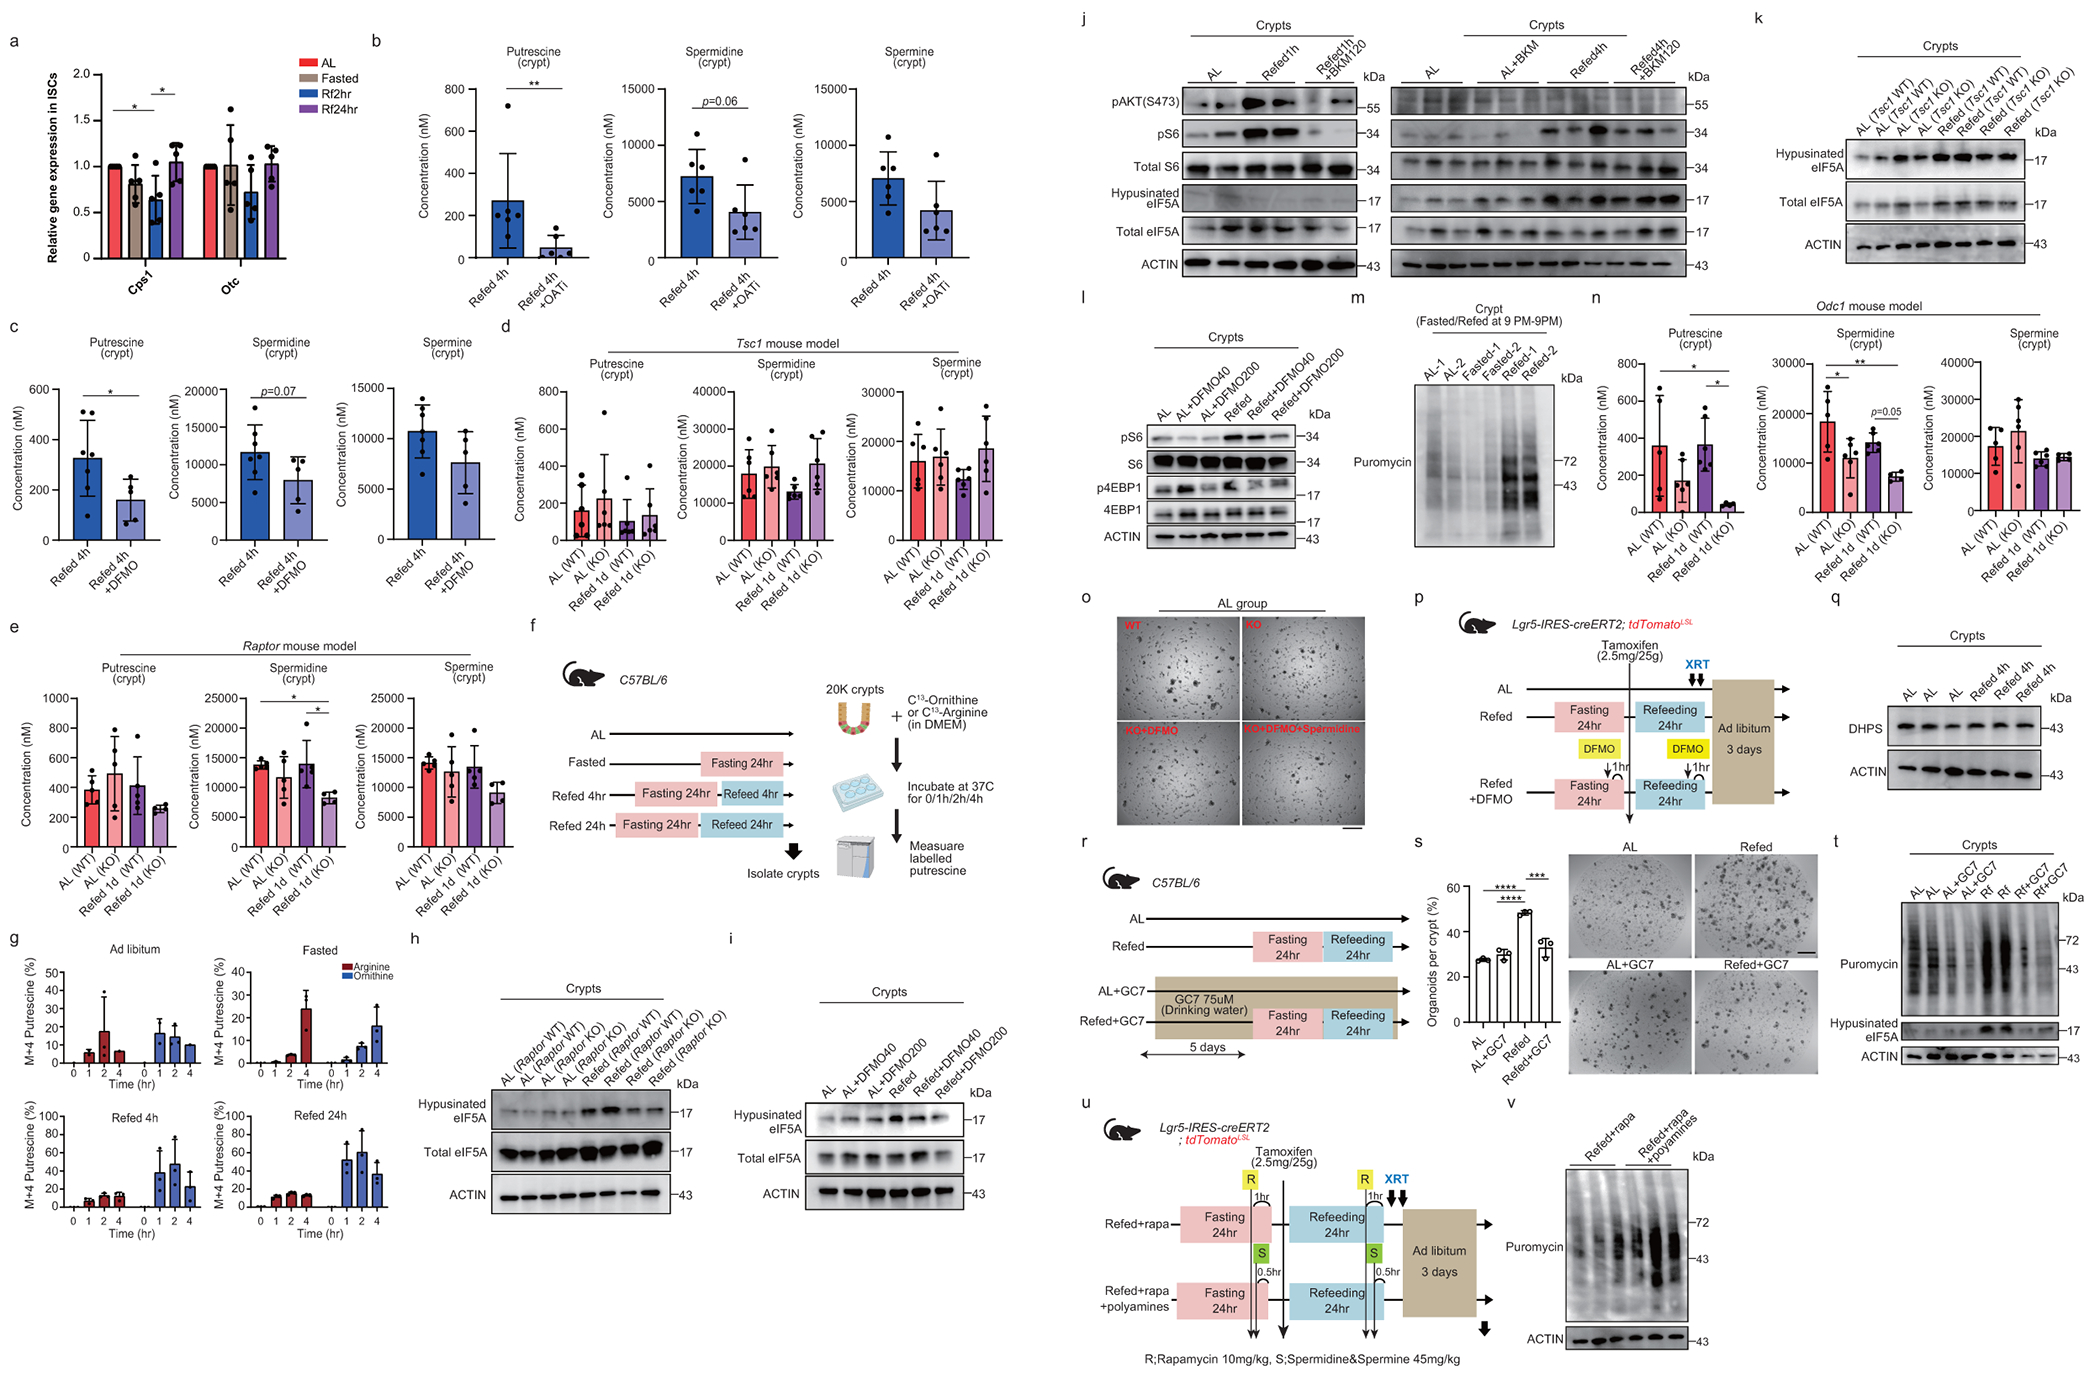
(a) qPCR on FACS sorted ISCs from Lgr5-EGFP-IRES-creERT2 mice. n = 5 per group, pooled from 3 independent experiments. (b) (c) Polyamine level in the crypts from refed 4h mice treated with or without OAT inhibitor (5-FMO) (b) or ODC1 inhibitor (DFMO) (c). n = 5–7 mice per group, pooled from 3 independent experiments. (d) (e) Polyamine level in the crypts from AL or refed 24h Tsc1 loxp/loxp;Villin-CreERT2 (d) or Raptor loxp/loxp;Villin-CreERT2 (e) mice. n = 4–6 mice per group, pooled from 4 independent experiments. (f) Schematic of isotope tracing experiments. (g) The proportion of isotope-labeled putrescine in the crypt samples from mice under different dietary conditions at various incubation times (0/1h/2h/4h). n = 1-4 mice per group. (h) Immunoblots for hypusinated elF5A and total elF5A in crypts from AL or refed 24h Raptor WT or KO mice. (i) Immunoblots for hypusinated elF5A and total elF5A in crypts from AL or refed 24h mice with or without DFMO treatment. DFMO 40, 200: DFMO 40mg/kg, 200mg/kg. (j) Immunoblots for of phospho-AKT and mTORC1 downstream targets in crypts from 1h or 4h refed mice with or without BKM120 treatment. (k) Immunoblots for hypusinated elF5A and total elF5A in crypts from AL or refed 24h Tsc1 WT or KO mice. (l) Immunoblots for mTORC1 downstream targets in crypts from AL or refed 24h mice with or without DFMO treatment. DFMO 40, 200: DFMO 40mg/kg, 200mg/kg. (m) Immunoblots for puromycin in crypts from AL, fasted 24h or refed 24h mice (started fasting and refeeding at 9 PM). (n) Polyamine level in crypts from AL or refed 24h Odc1 WT or KO mice. n = 4-6 mice per group, pooled from 4 independent experiments. (o) Representative images of day 3 organoids of crypts from AL Odc1 WT or KO mice. DFMO (1.5 mM) or/and Spermidine (50 uM) were added to the culture medium for the treatment group Scale bar, 500 µm. (p) Schematic of the irradiation mouse model, including the timeline of ODC1 inhibitor (DFMO) administration. (q) Immunoblots for DHPS in crypts from AL or refed 4h mice. (r) Schematic of in vivo GC7 treatment in AL or Refed 24h mice. (s) Organoid assay for crypts from AL or refed 24h mice treated with or without GC7 treatment (75 µM). Quantification (left) and representative images of day 3 organoids (right). n = 3 mice per group, pooled from 3 independent experiments. Scale bar, 500 µm. (t) Immunoblots for puromycin and hypusinated elF5A in crypts from AL or refed 24h mice with or without GC7 treatment. (u) Schematic of the irradiation mouse model including the timeline of rapamycin and polyamine administration. (v) Immunoblots for puromycin in crypts from refed 24h+rapa C57BL/6 mice with or without polyamines administration. Unpaired, two-tailed, Mann-Whitney test (b, c), One-way ANOVA (a, d, e, n, s). Data are mean ±s.d. *p < 0.05, **p < 0.01, ***p < 0.001, ****p<0.0001.
Extended Data Fig. 6. Post-fast refeeding augments tumourigenicity.

(a) Schematic of Cre recombinase activity in Lgr5-IRES-CreERT2; Rosa26LSL-tdTomato reporter mice. (b) Quantification of tdTomato+ crypts in jejunum (left) and ileum (right) samples. n = 2 mice per group, pooled from 2 independent experiments. (c) Representative images of tdTomato+ crypts in jejunum (left) and ileum (right) . Scale bar, 50 µm. (d) Schematic of tumour burden calculation, Scale bar, 50 µm. (e) Quantification of β-catenin+ Apc-null tumours in colon from Apcloxp/loxp; Lgr5-EGFP-IRES- creERT2 mice (left), and representative images of Apc-null tumour lesion by IHC for β-catenin (black dot circle, right). Scale bar, 50 µm. n = 9 mice per group, pooled from 3 independent experiments. (f) Ratio of β-catenin+ Apc-null tumour length to colon length in colon of Apcloxp/loxp; Villin-creERT2 mice (left), and representative images of Apc-null tumours by IHC for β-catenin (right). Tumours are surrounded by a yellow dotted line (right). n = 11-21 mice per group, pooled from 3 independent experiments. Scale bar, 50 µm. (g) Representative images of Apc- null tumour lesions by IHC for β-catenin from IF experiments. Tumours are surrounded by a black dotted line. Scale bar, 50 µm. One-way ANOVA (e, f). Data are mean ±s.d. *p < 0.05, ***p < 0.001, ns; not significant.
Extended Data Fig. 7. mTORC1-Polyamine-protein synthesis axis boosts tumourigenicity.

(a) Schematic of Apc tumour model with Apcloxp/loxp;Villin-CreERT2 mice with or without rapamycin. (b) Schematic of Apcloxp/loxp; Lgr5-EGFP-IRES creERT2 tumor model with or without rapamycin. (c) Quantification of tumour burden in the small intestine (left) and representative tumour images by IHC for β-catenin (right) in Apcloxp/loxp;Villin-CreERT2. n = 5-8 mice per group, pooled from 3 independent experiments. Scale bar, 100 µm. (d) Quantification of tumour burden in small intestine (left) and colon (right) in Apcloxp/loxp; Lgr5-EGFP-IRES creERT2 mice. n = 8-22 mice per group, pooled from 3 independent experiments. (e) Representative tumour images by H&E (small intestine) or IHC for β-catenin (colon) from Apcloxp/loxp; Lgr5-EGFP-IRES creERT2 mice. Tumours are surrounded by white or black dotted lines. Scale bar, 100 µm. (f) Schematic of Apcloxp/loxp; Lgr5-EGFP-IRES-creERT2 tumour model with or without the Tsc1loxp/loxp allele (WT/KO). (g) Ratio of tumour length to intestinal length (left) and representative images of tumour lesions by H&E and IHC for pS6 (right). n = 5-6 mice per group, pooled from 3 independent experiments. Scale bar, 100 µm. (h) Schematic of Apc tumour model with Apcloxp/loxp;Villin-CreERT2 mice with or without DFMO. (i) Quantification of tumour burden in the small intestine (left) and representative tumour images by IHC for β-catenin (right) with or without DFMO. n = 4-7 mice per group, pooled from 3 independent experiments. Scale bar, 100 µm. (j) Quantification of tumour burden in colon treated with ODC inhibitor (DFMO) (left), and representative tumour images by IHC for β-catenin (right). Tumours are surrounded by yellow dotted lines. n = 5-7 mice per group, pooled from 3 independent experiments. Scale bar, 100 µm. (k) Schematic of Apc tumour model with Apcloxp/loxp;Villin-CreERT2 mice with or without protein synthesis inhibitor (cycloheximide). (l) Schematic of assessing the effect of cycloheximide on protein synthesis. (m) Immunoblots for puromycin in crypts labelled with puromycin. CHX 5, 15: CHX 5mg/kg, 15 mg/kg. (n) Quantification of tumour burden in the small intestine (left) and representative tumour images by IHC for β-catenin (right) with or without protein synthesis inhibitor (cycloheximide). n = 5-6 mice per group, pooled from 3 independent experiments. Scale bar, 100 µm. (o) Immunoblots for puromycin in isolated crypts from Refed 1d Apcloxp/loxp; Lgr5-EGFP-IRES-creERT2 or Apcloxp/loxp; Rpl24Bst/+; Lgr5-EGFP-IRES-creERT2 mice without tamoxifen administration. (p) Quantification of tumour burden in the small intestine of Apcloxp/loxp; Rpl24Bst/+; Lgr5-EGFP-IRES-creERT2 mouse model (left) and representative images of tumours by IHC for β-catenin. Tumours are surrounded by yellow dotted lines (right). n = 9-16 mice per group, pooled from 3 independent experiments. Scale bar, 100 µm. One-way ANOVA (c, d, i, j, n). Unpaired two-tailed t-tests (g, p). Data are mean ±s.d. *p < 0.05, **p < 0.01, ****p < 0.0001.
Extended Data Fig. 8. Chronic calorie restriction and acute 24h fast-refeeding regimen enhance ISC function through a distinct mechanism.

(a) qPCR for Bst1 on FACS-sorted ISCs from AL, Fasted 24h, Refed 24h, and CR (fasted state) mice. n = 6-7 mice per group, pooled from 5 independent experiments. Duplicate measurements were taken from each mouse. (b) IHC for Lysozyme in the small intestine of Atoh1 WT and KO mice. Scale bar, 100 um (left) and 50 um (right). (c) Organoid assay for crypts from AL or refed 24h Atoh1 KO mice. Quantification (left) and representative images of day 3 organoids (right). n = 6 mice per group, pooled from 2 independent experiments. Scale bar, 500 µm. (d) Levels of polyamines in crypts from AL, CR (fasted or refed state), or rapamycin-treated mice. n = 7-8 mice per group, pooled from 4 independent experiments. (e) Organoid assay for crypts from AL, CR (fasted or refed state), or rapamycin-treated mice. Quantification (left) and representative images of day 3 organoids (right). n = 5-13 mice per group, pooled from 4 independent experiments. Scale bar, 500 µm. One-way ANOVA (a, d, e). Unpaired two-tailed t-tests (c). Data are mean ±s.d. *p < 0.05, **p < 0.01, ***p < 0.001,****p <0.0001.
Supplementary Material
Acknowledgements
We thank the Swanson Biotechnology Center at the Koch Institute including the Flow Cytometry, Histology, and Genomics & Bioinformatics Core facilities (NCI P30-CA14051). We thank the Department of Comparative Medicine for mouse husbandry support. We thank Sven Holder and members of the Hope Babette Tang (1983) Histology Facility for substantial histological support. We thank Prof. Hideki Ohdan (Hiroshima University, Japan), Prof. Takashi Matozaki (Kobe University, Japan), and the members of the Yilmaz laboratory for discussions, Kerry Kelley for laboratory management, and Liz Galoyan for administrative assistance. S.I is supported by Japan Society for Promotion of Science (JSPS) overseas fellowship and Kanzawa Medical Research Foundation. Ö.H.Y is supported by R01CA211184, R01CA034992, R01CA257523, R01 DK126545 and U54CA224068; a Pew-Stewart Trust scholar award; the Kathy and Curt Marble cancer research award; a Koch Institute-Dana-Farber/Harvard Cancer Center Bridge Project grant; and AFAR. Ö.H.Y. receives support from the MIT Stem Cell Initiative. A.T. was funded by an Emmy Noether Award from the German Research Foundation (DFG, 467788900) and the Ministry of Culture and Science of the State of North Rhine-Westphalia (NRW-Nachwuchsgruppenprogramm). A.T holds the Peter Hans Hofschneider of Molecular Medicine endowed professorship by the Stiftung Experimentelle Biomedizin. C.-W.C. is supported by K99/R00DK123407. R.O.C. was funded by Fundação de Amparo à Pesquisa do Estado de São Paulo (FAPESP, 2016/23142-3 and 2019/02640-3). M.A.R.V is funded by FAPESP (2018/15313-8) and R01 DK126969-01. G.C.-K is supported by a TUBITAK2219 international postdoctoral research fellowship. CA was supported by Italian Association for Cancer Research (AIRC) IG Investigator.
Footnotes
Declaration of interests
The authors declare no competing interests.
Data availability
Datasets generated in this study are available at the Gene Expression Omnibus (GEO) repository (GSE192482). Any additional information required to reanalyse the data reported in this paper is available upon request. GitHub repository (https://github.com/KochInstitute-Bioinformatics/Imada_FastingCancer/tree/master) is available for this study.
References
- 1.Cheng CW & Yilmaz Ö H 100 Years of Exploiting Diet and Nutrition for Tissue Regeneration. Cell Stem Cell 28, 370–373 (2021). 10.1016/j.stem.2021.02.014 [DOI] [PMC free article] [PubMed] [Google Scholar]
- 2.Nencioni A, Caffa I, Cortellino S & Longo VD Fasting and cancer: molecular mechanisms and clinical application. Nat Rev Cancer 18, 707–719 (2018). 10.1038/s41568-018-0061-0 [DOI] [PMC free article] [PubMed] [Google Scholar]
- 3.Cheng CW et al. Prolonged fasting reduces IGF-1/PKA to promote hematopoietic-stem-cell-based regeneration and reverse immunosuppression. Cell Stem Cell 14, 810–823 (2014). 10.1016/j.stem.2014.04.014 [DOI] [PMC free article] [PubMed] [Google Scholar]
- 4.Longo VD & Mattson MP Fasting: molecular mechanisms and clinical applications. Cell Metab 19, 181–192 (2014). 10.1016/j.cmet.2013.12.008 [DOI] [PMC free article] [PubMed] [Google Scholar]
- 5.Weindruch R, Walford RL, Fligiel S & Guthrie D The retardation of aging in mice by dietary restriction: longevity, cancer, immunity and lifetime energy intake. J Nutr 116, 641–654 (1986). 10.1093/jn/116.4.641 [DOI] [PubMed] [Google Scholar]
- 6.Mattison JA et al. Caloric restriction improves health and survival of rhesus monkeys. Nat Commun 8, 14063 (2017). 10.1038/ncomms14063 [DOI] [PMC free article] [PubMed] [Google Scholar]
- 7.Calibasi-Kocal G et al. Nutritional Control of Intestinal Stem Cells in Homeostasis and Tumorigenesis. Trends Endocrinol Metab 32, 20–35 (2021). 10.1016/j.tem.2020.11.003 [DOI] [PubMed] [Google Scholar]
- 8.Cerletti M, Jang YC, Finley LW, Haigis MC & Wagers AJ Short-term calorie restriction enhances skeletal muscle stem cell function. Cell Stem Cell 10, 515–519 (2012). 10.1016/j.stem.2012.04.002 [DOI] [PMC free article] [PubMed] [Google Scholar]
- 9.Mihaylova MM et al. Fasting Activates Fatty Acid Oxidation to Enhance Intestinal Stem Cell Function during Homeostasis and Aging. Cell Stem Cell 22, 769–778.e764 (2018). 10.1016/j.stem.2018.04.001 [DOI] [PMC free article] [PubMed] [Google Scholar]
- 10.Yilmaz Ö H et al. mTORC1 in the Paneth cell niche couples intestinal stem-cell function to calorie intake. Nature 486, 490–495 (2012). 10.1038/nature11163 [DOI] [PMC free article] [PubMed] [Google Scholar]
- 11.Vernieri C et al. Fasting-mimicking diet is safe and reshapes metabolism and antitumor immunity in cancer patients. Cancer Discov (2021). 10.1158/2159-8290.Cd-21-0030 [DOI] [PMC free article] [PubMed] [Google Scholar]
- 12.Salvadori G et al. Fasting-mimicking diet blocks triple-negative breast cancer and cancer stem cell escape. Cell Metab 33, 2247–2259.e2246 (2021). 10.1016/j.cmet.2021.10.008 [DOI] [PMC free article] [PubMed] [Google Scholar]
- 13.Alonso S & Yilmaz Ö H Nutritional Regulation of Intestinal Stem Cells. Annu Rev Nutr 38, 273–301 (2018). 10.1146/annurev-nutr-082117-051644 [DOI] [PubMed] [Google Scholar]
- 14.Beumer J & Clevers H Cell fate specification and differentiation in the adult mammalian intestine. Nat Rev Mol Cell Biol 22, 39–53 (2021). 10.1038/s41580-020-0278-0 [DOI] [PubMed] [Google Scholar]
- 15.Goto N et al. Lymphatics and fibroblasts support intestinal stem cells in homeostasis and injury. Cell Stem Cell 29, 1246–1261.e1246 (2022). 10.1016/j.stem.2022.06.013 [DOI] [PMC free article] [PubMed] [Google Scholar]
- 16.Niec RE et al. Lymphatics act as a signaling hub to regulate intestinal stem cell activity. Cell Stem Cell 29, 1067–1082.e1018 (2022). 10.1016/j.stem.2022.05.007 [DOI] [PMC free article] [PubMed] [Google Scholar]
- 17.Palikuqi B et al. Lymphangiocrine signals are required for proper intestinal repair after cytotoxic injury. Cell Stem Cell 29, 1262–1272.e1265 (2022). 10.1016/j.stem.2022.07.007 [DOI] [PMC free article] [PubMed] [Google Scholar]
- 18.Gehart H & Clevers H Tales from the crypt: new insights into intestinal stem cells. Nat Rev Gastroenterol Hepatol 16, 19–34 (2019). 10.1038/s41575-018-0081-y [DOI] [PubMed] [Google Scholar]
- 19.Cheng CW et al. Ketone Body Signaling Mediates Intestinal Stem Cell Homeostasis and Adaptation to Diet. Cell 178, 1115–1131.e1115 (2019). 10.1016/j.cell.2019.07.048 [DOI] [PMC free article] [PubMed] [Google Scholar]
- 20.Beyaz S et al. High-fat diet enhances stemness and tumorigenicity of intestinal progenitors. Nature 531, 53–58 (2016). 10.1038/nature17173 [DOI] [PMC free article] [PubMed] [Google Scholar]
- 21.Igarashi M & Guarente L mTORC1 and SIRT1 Cooperate to Foster Expansion of Gut Adult Stem Cells during Calorie Restriction. Cell 166, 436–450 (2016). 10.1016/j.cell.2016.05.044 [DOI] [PubMed] [Google Scholar]
- 22.Zismanov V et al. Phosphorylation of eIF2α Is a Translational Control Mechanism Regulating Muscle Stem Cell Quiescence and Self-Renewal. Cell Stem Cell 18, 79–90 (2016). 10.1016/j.stem.2015.09.020 [DOI] [PubMed] [Google Scholar]
- 23.Llorens-Bobadilla E et al. Single-Cell Transcriptomics Reveals a Population of Dormant Neural Stem Cells that Become Activated upon Brain Injury. Cell Stem Cell 17, 329–340 (2015). 10.1016/j.stem.2015.07.002 [DOI] [PubMed] [Google Scholar]
- 24.Signer RA, Magee JA, Salic A & Morrison SJ Haematopoietic stem cells require a highly regulated protein synthesis rate. Nature 509, 49–54 (2014). 10.1038/nature13035 [DOI] [PMC free article] [PubMed] [Google Scholar]
- 25.Morral C et al. Zonation of Ribosomal DNA Transcription Defines a Stem Cell Hierarchy in Colorectal Cancer. Cell Stem Cell 26, 845–861.e812 (2020). 10.1016/j.stem.2020.04.012 [DOI] [PMC free article] [PubMed] [Google Scholar]
- 26.Benitah SA & Welz PS Circadian Regulation of Adult Stem Cell Homeostasis and Aging. Cell Stem Cell 26, 817–831 (2020). 10.1016/j.stem.2020.05.002 [DOI] [PubMed] [Google Scholar]
- 27.Huch M et al. In vitro expansion of single Lgr5+ liver stem cells induced by Wnt-driven regeneration. Nature 494, 247–250 (2013). 10.1038/nature11826 [DOI] [PMC free article] [PubMed] [Google Scholar]
- 28.Liu GY & Sabatini DM mTOR at the nexus of nutrition, growth, ageing and disease. Nat Rev Mol Cell Biol 21, 183–203 (2020). 10.1038/s41580-019-0199-y [DOI] [PMC free article] [PubMed] [Google Scholar]
- 29.Manning BD & Toker A AKT/PKB Signaling: Navigating the Network. Cell 169, 381–405 (2017). 10.1016/j.cell.2017.04.001 [DOI] [PMC free article] [PubMed] [Google Scholar]
- 30.Mulvihill MJ et al. Discovery of OSI-906: a selective and orally efficacious dual inhibitor of the IGF-1 receptor and insulin receptor. Future Med Chem 1, 1153–1171 (2009). 10.4155/fmc.09.89 [DOI] [PubMed] [Google Scholar]
- 31.Burger MT et al. Identification of NVP-BKM120 as a Potent, Selective, Orally Bioavailable Class I PI3 Kinase Inhibitor for Treating Cancer. ACS Med Chem Lett 2, 774–779 (2011). 10.1021/ml200156t [DOI] [PMC free article] [PubMed] [Google Scholar]
- 32.Haber AL et al. A single-cell survey of the small intestinal epithelium. Nature 551, 333–339 (2017). 10.1038/nature24489 [DOI] [PMC free article] [PubMed] [Google Scholar]
- 33.Biton M et al. T Helper Cell Cytokines Modulate Intestinal Stem Cell Renewal and Differentiation. Cell 175, 1307–1320.e1322 (2018). 10.1016/j.cell.2018.10.008 [DOI] [PMC free article] [PubMed] [Google Scholar]
- 34.Ginguay A, Cynober L, Curis E & Nicolis I Ornithine Aminotransferase, an Important Glutamate-Metabolizing Enzyme at the Crossroads of Multiple Metabolic Pathways. Biology (Basel) 6 (2017). 10.3390/biology6010018 [DOI] [PMC free article] [PubMed] [Google Scholar]
- 35.Daune G, Gerhart F & Seiler N 5-Fluoromethylornithine, an irreversible and specific inhibitor of L-ornithine:2-oxo-acid aminotransferase. Biochem J 253, 481–488 (1988). 10.1042/bj2530481 [DOI] [PMC free article] [PubMed] [Google Scholar]
- 36.Poulin R, Lu L, Ackermann B, Bey P & Pegg AE Mechanism of the irreversible inactivation of mouse ornithine decarboxylase by alpha-difluoromethylornithine. Characterization of sequences at the inhibitor and coenzyme binding sites. J Biol Chem 267, 150–158 (1992). [PubMed] [Google Scholar]
- 37.Puleston DJ et al. Polyamine metabolism is a central determinant of helper T cell lineage fidelity. Cell 184, 4186–4202.e4120 (2021). 10.1016/j.cell.2021.06.007 [DOI] [PMC free article] [PubMed] [Google Scholar]
- 38.Park MH & Wolff EC Hypusine, a polyamine-derived amino acid critical for eukaryotic translation. J Biol Chem 293, 18710–18718 (2018). 10.1074/jbc.TM118.003341 [DOI] [PMC free article] [PubMed] [Google Scholar]
- 39.Puleston DJ et al. Polyamines and eIF5A Hypusination Modulate Mitochondrial Respiration and Macrophage Activation. Cell Metab 30, 352–363 e358 (2019). 10.1016/j.cmet.2019.05.003 [DOI] [PMC free article] [PubMed] [Google Scholar]
- 40.Zabala-Letona A et al. mTORC1-dependent AMD1 regulation sustains polyamine metabolism in prostate cancer. Nature 547, 109–113 (2017). 10.1038/nature22964 [DOI] [PMC free article] [PubMed] [Google Scholar]
- 41.Mandal S, Mandal A, Johansson HE, Orjalo AV & Park MH Depletion of cellular polyamines, spermidine and spermine, causes a total arrest in translation and growth in mammalian cells. Proc Natl Acad Sci U S A 110, 2169–2174 (2013). 10.1073/pnas.1219002110 [DOI] [PMC free article] [PubMed] [Google Scholar]
- 42.Abbruzzese A, Park MH & Folk JE Deoxyhypusine hydroxylase from rat testis. Partial purification and characterization. J Biol Chem 261, 3085–3089 (1986). [PubMed] [Google Scholar]
- 43.Gobert AP et al. Hypusination Orchestrates the Antimicrobial Response of Macrophages. Cell Rep 33, 108510 (2020). 10.1016/j.celrep.2020.108510 [DOI] [PMC free article] [PubMed] [Google Scholar]
- 44.Bruens L et al. Calorie Restriction Increases the Number of Competing Stem Cells and Decreases Mutation Retention in the Intestine. Cell Rep 32, 107937 (2020). 10.1016/j.celrep.2020.107937 [DOI] [PMC free article] [PubMed] [Google Scholar]
- 45.Fontana L, Partridge L & Longo VD Extending healthy life span--from yeast to humans. Science 328, 321–326 (2010). 10.1126/science.1172539 [DOI] [PMC free article] [PubMed] [Google Scholar]
- 46.Mai V et al. Calorie restriction and diet composition modulate spontaneous intestinal tumorigenesis in Apc(Min) mice through different mechanisms. Cancer Res 63, 1752–1755 (2003). [PubMed] [Google Scholar]
- 47.Barker N et al. Identification of stem cells in small intestine and colon by marker gene Lgr5. Nature 449, 1003–1007 (2007). 10.1038/nature06196 [DOI] [PubMed] [Google Scholar]
- 48.Faller WJ et al. mTORC1-mediated translational elongation limits intestinal tumour initiation and growth. Nature 517, 497–500 (2015). 10.1038/nature13896 [DOI] [PMC free article] [PubMed] [Google Scholar]
- 49.Erdman SH et al. APC-dependent changes in expression of genes influencing polyamine metabolism, and consequences for gastrointestinal carcinogenesis, in the Min mouse. Carcinogenesis 20, 1709–1713 (1999). 10.1093/carcin/20.9.1709 [DOI] [PubMed] [Google Scholar]
- 50.Oliver ER, Saunders TL, Tarlé SA & Glaser T Ribosomal protein L24 defect in belly spot and tail (Bst), a mouse Minute. Development 131, 3907–3920 (2004). 10.1242/dev.01268 [DOI] [PMC free article] [PubMed] [Google Scholar]
- 51.Knight JR et al. Rpl24(Bst) mutation suppresses colorectal cancer by promoting eEF2 phosphorylation via eEF2K. Elife 10 (2021). 10.7554/eLife.69729 [DOI] [PMC free article] [PubMed] [Google Scholar]
- 52.Nagai M et al. Fasting-Refeeding Impacts Immune Cell Dynamics and Mucosal Immune Responses. Cell 178, 1072–1087.e1014 (2019). 10.1016/j.cell.2019.07.047 [DOI] [PubMed] [Google Scholar]
- 53.Napolitano G et al. mTOR-dependent phosphorylation controls TFEB nuclear export. Nat Commun 9, 3312 (2018). 10.1038/s41467-018-05862-6 [DOI] [PMC free article] [PubMed] [Google Scholar]
- 54.Tinkum KL et al. Fasting protects mice from lethal DNA damage by promoting small intestinal epithelial stem cell survival. Proc Natl Acad Sci U S A 112, E7148–7154 (2015). 10.1073/pnas.1509249112 [DOI] [PMC free article] [PubMed] [Google Scholar]
- 55.Kim TH, Escudero S & Shivdasani RA Intact function of Lgr5 receptor-expressing intestinal stem cells in the absence of Paneth cells. Proc Natl Acad Sci U S A 109, 3932–3937 (2012). 10.1073/pnas.1113890109 [DOI] [PMC free article] [PubMed] [Google Scholar]
- 56.Zoumas-Morse C et al. Development of a polyamine database for assessing dietary intake. J Am Diet Assoc 107, 1024–1027 (2007). 10.1016/j.jada.2007.03.012 [DOI] [PMC free article] [PubMed] [Google Scholar]
- 57.Pegg AE Functions of Polyamines in Mammals. J Biol Chem 291, 14904–14912 (2016). 10.1074/jbc.R116.731661 [DOI] [PMC free article] [PubMed] [Google Scholar]
- 58.Allmeroth K et al. N1-acetylspermidine is a determinant of hair follicle stem cell fate. J Cell Sci 134 (2021). 10.1242/jcs.252767 [DOI] [PMC free article] [PubMed] [Google Scholar]
- 59.Fritsch SD et al. Metabolic support by macrophages sustains colonic epithelial homeostasis. Cell Metab 35, 1931–1943.e1938 (2023). 10.1016/j.cmet.2023.09.010 [DOI] [PubMed] [Google Scholar]
- 60.Brandhorst S et al. A Periodic Diet that Mimics Fasting Promotes Multi-System Regeneration, Enhanced Cognitive Performance, and Healthspan. Cell Metab 22, 86–99 (2015). 10.1016/j.cmet.2015.05.012 [DOI] [PMC free article] [PubMed] [Google Scholar]
Methods references
- 61.el Marjou F et al. Tissue-specific and inducible Cre-mediated recombination in the gut epithelium. Genesis 39, 186–193 (2004). 10.1002/gene.20042 [DOI] [PubMed] [Google Scholar]
- 62.Colnot S et al. Colorectal cancers in a new mouse model of familial adenomatous polyposis: influence of genetic and environmental modifiers. Lab Invest 84, 1619–1630 (2004). 10.1038/labinvest.3700180 [DOI] [PubMed] [Google Scholar]
- 63.Sato T et al. Single Lgr5 stem cells build crypt-villus structures in vitro without a mesenchymal niche. Nature 459, 262–265 (2009). 10.1038/nature07935 [DOI] [PubMed] [Google Scholar]
- 64.Ootani A et al. Sustained in vitro intestinal epithelial culture within a Wnt-dependent stem cell niche. Nat Med 15, 701–706 (2009). 10.1038/nm.1951 [DOI] [PMC free article] [PubMed] [Google Scholar]
- 65.Fuhrer T, Heer D, Begemann B & Zamboni N High-throughput, accurate mass metabolome profiling of cellular extracts by flow injection-time-of-flight mass spectrometry. Anal Chem 83, 7074–7080 (2011). 10.1021/ac201267k [DOI] [PubMed] [Google Scholar]
- 66.Sellick CA, Hansen R, Stephens GM, Goodacre R & Dickson AJ Metabolite extraction from suspension-cultured mammalian cells for global metabolite profiling. Nat Protoc 6, 1241–1249 (2011). 10.1038/nprot.2011.366 [DOI] [PubMed] [Google Scholar]
- 67.Subramanian A et al. Gene set enrichment analysis: a knowledge-based approach for interpreting genome-wide expression profiles. Proc Natl Acad Sci U S A 102, 15545–15550 (2005). 10.1073/pnas.0506580102 [DOI] [PMC free article] [PubMed] [Google Scholar]
Associated Data
This section collects any data citations, data availability statements, or supplementary materials included in this article.
Supplementary Materials
Data Availability Statement
Datasets generated in this study are available at the Gene Expression Omnibus (GEO) repository (GSE192482). Any additional information required to reanalyse the data reported in this paper is available upon request. GitHub repository (https://github.com/KochInstitute-Bioinformatics/Imada_FastingCancer/tree/master) is available for this study.