

Abstract
Purpose
Age and elevated intraocular pressure are major risk factors for primary open-angle glaucoma (POAG) which is caused by a restriction in aqueous humor outflow from the anterior chamber. In this study, we investigated whether age-related changes in integrin subunit expression and activity signifies an early event in initiating fibrotic-like changes in the TM that could restrict outflow.
Methods
Human trabecular meshwork (TM) cells from young (<40 years) and old (>50 years) donor eyes were used. Flow cytometry, RT-qPCR, and immunofluorescence microscopy were used to evaluate levels of integrin and αSMA expression. On-cell westerns were used to determine fibronectin levels. Collagen gel contraction assays were used to determine contractile properties of cells and shRNA was used to knockdown α5β1 integrin levels.
Results
Studies revealed a significant decrease in α5 integrin expression in TM cells from older individuals. This loss was accompanied by an increase in activated but not total αvβ3 integrin levels. TM cells from older donors expressed higher levels of αSMA mRNA, assembled αSMA-containing stress fibers, and contracted collagen gels significantly more than young TM cells. TM cells from old donors also assembled higher levels of insoluble fibronectin fibrils and contained higher levels of EDB+ fibronectin in their extracellular matrix. shRNA knockdown of α5 integrin subunits showed that the increase in αvβ3 integrin activity was due to lower levels of α5 integrin expression.
Conclusions
These studies suggest that age-related dysregulation of α5β1 and αvβ3 integrin signaling may represent an important early molecular event in inducing fibrogenic pathways associated with POAG.
Keywords: trabecular meshwork, integrins, contractility, aging
Age is a major risk factor for the pathogenesis of primary open-angle glaucoma (POAG), which is the most common form of glaucoma.1,2 POAG is caused by a restriction in the movement of aqueous humor (AH) fluid through the layers of the trabecular meshwork (TM) into Schlemm's canal (SC).3 The restricted outflow of AH causes an elevation in intraocular pressure (IOP), which over time irreversibly damages the optic nerve and causes blindness. TGFβ2 and age-related changes in the composition of the extracellular matrix (ECM) and the biomechanical compliance of the TM are thought to contribute to the reduction of AH flow and elevated IOP.4,5 Yet, the mechanisms that trigger these changes remain unclear.
Changes in the ECM are sensed by various mechanosensory receptors on the TM cell surface, including a family of receptors called integrins. Integrins are transmembrane heterodimeric proteins consisting of an α and β subunit. At least 12 different integrins have been identified by either RNA or protein analysis in the TM/SC outflow pathway. In the TM/SC, integrins are found along the trabecular beams, in the juxtacanalicular region (JCT), and in cells along the inner wall of SC.6,7 Most of the integrins appear to be ubiquitously expressed throughout all the cells in the TM/SC. However, some integrins show restricted expression patterns. Most notably, α6β1 and α9β1 integrins are found predominantly on cells lining the inner wall of SC.8,9 Whether the expression patterns of integrins in the TM/SC change as we age is unclear. One early study using tissues obtained from donors two to 65 years old suggested that the pattern of integrin expression did not change.6 However, another study indicated that the expression of the α5 integrin subunit may be downregulated in the TM/SC of older human eyes,10 which is consistent with that observed in other adult tissues.11,12 Neither of these studies determined the activity of integrins.
A unique feature of integrins is that their activity is tightly regulated and rapidly fluctuates between an active and inactive state on the cell surface.13 This enables integrins to rapidly change their activity in response to changes in their microenvironment. The activity of an integrin is dependent on its conformation. Numerous studies have shown that an unoccupied integrin on the cell surface is in a low affinity, bent conformation with the cytoplasmic tails of the α and β subunits bound together by a salt bridge.14,15 In contrast, the active integrin assumes an upright conformation and the α and β cytoplasmic tails become separated, allowing binding of cytoplasmic proteins and high affinity interactions with ECM proteins.14,15 The activity of integrins is controlled by specific cytoplasmic and membrane proteins and mechanical forces (stretch and shear stress)16–19 making them likely to be activated when shear stress is elevated by high IOP.3 Once activated, integrins trigger actin structures that control the contractile properties of cells and regulate the activity of signaling pathways associated with endothelial-mesenchymal transition (EndoMT), fibrosis, TGFβ signaling, and senescence.20
Several studies have shown that activation of the αvβ3 integrin contributes to the fibrogenic phenotype of the TM/SC.21 Activation of αvβ3 integrin drives the formation of cross-linked actin networks,22 the deposition of the EDA+ isoform of fibronectin into the ECM,23 and the expression of TGFβ2,24 all of which are associated with POAG and glucocorticoid-induced glaucoma.25–27 αvβ3 integrin also regulates the distribution of a cytoplasmic protein, Hic-5, which induces fibrogenic activity in TM cells.28 Finally, activation of αvβ3 integrin has been shown to decrease outflow facility in organ cultured anterior segments of porcine eyes and elevate IOP in C57BL/6J mice.7 In contrast, a decrease in αvβ3 integrin expression has been shown to lower IOP in CreER+/− β3 integrinflox/flox C57BL/6J mice7 and a conditional knockout of αvβ3 integrin expression in SC in Cdh5-CreER β3 integrinflox/flox C57BL/6J mice impaired SC development which lead to an elevated IOP and a loss of retinal ganglion cells.29 Interestingly, αvβ3 integrin is upregulated in retinal ganglion cells after optic nerve crush in C57BL/6J mice and axons after injury while a loss of αvβ3 integrin led to protection of the peripheral retina and axon regeneration.30 Together, these studies provide strong evidence that activating αvβ3 integrin leads to profibrotic-like changes in the TM and is associated with changes that can lead to POAG.
However, the molecular events that trigger activation of αvβ3 integrin and induction of these fibrogenic pathways are yet to be elucidated. In this study, we investigated the age-dependent expression of integrins and correlated these changes with integrin activity, cellular contractile properties, and assembly of fibronectin fibrils in human TM cells isolated from young and old normal donor eyes. This study shows that TM cells isolated from old donor eyes have lower levels of α5β1 integrin expression compared to TM cells isolated from younger donor eyes. This decrease in the expression of α5β1 integrin is accompanied by an increase in the activity of αvβ3 integrin. Older TM cells are also significantly more contractile, express higher levels of αSMA mRNA, assemble αSMA+ stress fibers, and form more focal adhesions containing activated αvβ3 integrin. Cultures of older TM cells also assemble more EDA+ and EDB+ isoforms of fibronectin into the ECM. These phenotypes are consistent with old TM cells initiating EndoMT and inducing fibrogenic pathways that may ultimately lead to development of a fibrotic-like glaucomatous TM.
Material and Methods
Cell Culture
Human TM cells were isolated from either corneal rims or whole globes of cadaver eyes as previously described31 and in accordance with the tenets of the Declaration of Helsinki. Donor eyes and corneal rims were obtained from both the Lions Eye Bank of Wisconsin (Madison, WI, USA) and Lions VisionGift (Portland, OR, USA). Tissues from both males and females were used, and all donors were Caucasian with no known history of glaucoma or other ocular diseases. The sex, age, and cause of death of specific donors is indicated in the Table and Supplementary Table S1. All of the TM cell strains upregulated myocilin in response to dexamethasone (Supplementary Figs. S1 and S2) and were judged to be TM cells based on criteria previously described.32 The specific cell strains used for the experiments are indicated in the figures. All cells were between passages 5–8. For most experiments, cells were grown in low glucose Dulbecco's modified Eagle's medium (DMEM; Sigma-Aldrich Corp., St. Louis, MO, USA) supplemented with 15% fetal bovine serum (Avantor-VWR, Radnor, PA, USA), 2% L-glutamine (Sigma-Aldrich Corp.), 1% amphotericin B (Corning Inc., Corning, NY, USA), 0.05% gentamycin (Sigma-Aldrich Corp.), and 1 ng/mL FGF-2 (Peprotech, Cranbury, NJ, USA) as previously described.22 Where noted some cells were grown in medium glucose DMEM rather than low glucose DMEM.
Table.
Cell Strains Used
| Cell Strain Name | Donor Age | Nomenclature Used | Sex | α5 Integrin |
|---|---|---|---|---|
| N25TM-8 | 25 | N25 | M | Positive |
| N27TM-6 | 27 | N27 | F | Positive |
| N27TM-8 | 27 | N27-2 | F | Positive |
| 2021-1493 | 74 | N74 | F | Negative |
| 2021-1328 | 75 | N75 | M | Positive |
| 2022-0140 | 77 | N77 | F | Negative |
RNA Isolation and RT-qPCR
Total RNA was isolated from TM cultures one-week post-confluence using RNeasy Plus Mini Kit (Qiagen Inc, Germantown, MD, USA), or TRIzol (Invitrogen, Carlsbad, CA, USA), and reversed transcribed into cDNA using the High-capacity cDNA reverse transcription kit (Applied Biosystems, Waltham, MA, USA) according to the manufacturer's instructions. RT-qPCR was performed using an Applied Biosystems QuantStudio 6 Pro Real-Time PCR system and PowerUp SYBR green master mix (Thermo Fisher Scientific, Waltham, MA, USA) as we described.33 Primer-BLAST (https://www.ncbi.nlm.nih.gov/tools/primer-blast/) was used to design the primers that spanned an intron-exon junction whenever possible and were made by IDT (Coralville, IA). The primers used are shown in Supplementary Table S2.
Flow Cytometry
Flow cytometry was performed as previously described.33 Briefly, TM cells were lifted with Cell Dissociation Solution Non-enzymatic (Sigma-Aldrich Corp.) and labeled for one hour at room temperature with 10 µg/mL α2 (16B4), α4 (HP2/1), α5 (P1D6), α9 (Y9A2), β1 (12G10), and β3 (LM609) integrin antibodies (Supplementary Table S3) in 1% BSA + PBS. Cells were washed and labeled with an Alexa 647-conjugated rabbit anti-mouse IgG (Thermo Fisher Scientific) diluted 1/400 in 1% BSA + PBS for 45 minutes on ice. Labeled cells were washed, resuspended in 1% BSA + PBS, and strained with a 40–70 µm strainer to remove clumps. Cells were analyzed with the Cytek NL-3000 flow cytometer (Cytec Biosciences, Fremont, CA, USA) and the SpectroFlo program. Flow-Jo version 10.1 was used to analyze and graph the results. Unlabeled cells in 1% BSA + PBS were used as a control for autofluorescence.
Cell Spreading Assay
TM cells were plated onto coverslips pre-coated with 5 µg/mL of human type I collagen (Millipore Sigma, Burlington, MA, USA) at a density of 3 × 10⁴ cells/well and incubated for three hours. Cells were fixed with 4% paraformaldehyde + PBS for 20 minutes, followed by a permeabilization step with 0.5% Triton X-100 + PBS for 2 min. The cells were blocked in 1% BSA + PBS for 30 minutes at room temperature and then labeled with monoclonal antibodies [BV3] or LIBS2 (Supplementary Table S3) for one hour at room temperature. The primary antibodies were diluted to 10 µg/mL in 1.0% BSA + PBS. Cells were washed with PBS and primary antibodies were detected with Alexa 546-conguated goat anti-mouse IgG. Cells were also labeled with Alexa 488-conjugated phalloidin and Hoechst 33342 to detect actin filaments and nuclei, respectively. The coverslips were mounted onto slides using Shandon Immumount (ThermoFisher Scientific). Labeled cells were imaged using a Zeiss Imager.M2 fluorescence microscope (Zeiss, Oberkochen, Germany) together with Zen image acquisition software version 3.079.
To detect αSMA+ stress fibers, TM cells were plated at a density of 3 × 10⁴ cells/well on coverslips coated with 100 µg/mL bovine type I collagen solution (5010; Advanced Biomatrix, Carlsbad, CA, USA) for three hours. Cells were fixed and permeabilized with ice-cold methanol for 15 minutes at −20°C. Cells were blocked in 1% BSA + PBS for 30 minutes at room temperature and then labeled with 2 µg/mL αSMA primary antibody (Supplementary Table S3) for one hour at room temperature. Cells were washed with PBS and labeled with Alexa 546-conguated goat anti-rabbit IgG antibody. Cells were also labeled with Hoechst 33342 to detect nuclei. Coverslips were mounted and imaged as described above.
Immunohistochemistry of Anterior Segments
Anterior segments were isolated, cut into wedges, fixed with 4% paraformaldehyde, and embedded in paraffin as previously described.34 None of the donor tissues used for immunohistochemistry had a history of glaucoma. Sagittal tissue sections 5 µm thick were deparaffinized in xylenes and rehydrated through a series of 100%–50% ethanol solutions followed by 95°C antigen retrieval using R-Universal epitope recovery buffer (Electron Microscopy Sciences, Hatfield, PA, USA). Sections were blocked with CAS-block histochemical reagent (Invitrogen) and labeled overnight at 4°C with primary antibodies to integrins α5 (clone 10F6, 1/500 dilution) or αvβ3 (clone [BV3], 1/25 dilution; 4 µg/mL). Serial sections were also labeled with a negative control antibody against β-galactosidase at a 1:500 (4 µg/mL) dilution (Supplementary Table S3). Primary antibodies were detected using Alexa 546-conjugated goat anti-mouse IgG. Nuclei were labeled with Hoechst 33342. Sections were washed with PBS and mounted with a glass coverslip using Shandon Immu-mount (ThermoFisher Scientific). Labeled sections were imaged using a Zeiss Imager.M2 fluorescence microscope together with Zen image acquisition and processing software version 3.079. Z-stacks were obtained from each section, and each stack was then processed using deconvolution. An orthogonal projection of a subset of the images within each stack was generated to create a single image.
Collagen Contraction Assay
Collagen gels were prepared by mixing rat tail type I collagen (Corning Inc.) with an equal volume of 100 mM HEPES/2 × PBS on ice. DMEM was then added until the final concentration of collagen was 1.25 mg/mL. Collagen gels were poured into individual 35 mm plates and allowed to solidify at 37°C for 40 minutes. 1.5 × 10⁶ cells in DMEM were seeded onto the gels and were allowed to attach for 24 hours. After 24 hours, the gels were detached from the side of the dish with a pipette tip, and changes in the diameter of the gel were measured at 0, 0.5, one, two, four, and 24 hours. A control gel with no cells seeded was also measured to account for any diameter changes not caused by cell contraction.
shRNA Knockdown of α5 Integrin
N25 and N35 cells were plated at 5 × 10⁴ cells/well into a 12-well plate. When the cells reached 70–80% confluency, cells were transduced with lentivirus containing shRNA against α5 integrin (MISSION lentiviral particles clone ID TRCN0000029653; Sigma-Aldrich) at an MOI of 50. A lentiviral vector containing shRNA against β3 integrin (Mission lentiviral particles clone ID TRCN0000003235; Sigma-Aldrich) was used as a control. Twenty-four hours later, transduced cells were selected using 1.5 mg/mL G418 sulfate (Corning Inc.; 61-234-RG). Transduced cells were maintained under selection for the duration of the experiments. Seventy-two hours after transduction, some surviving cells were harvested for RNA isolation and RT-qPCR analysis as described above. RT-qPCR was performed using primers against α5 integrin and hypoxanthine phosphoribosyl transferase (HPRT1) for the housekeeping gene (Supplementary Table S2). Other surviving cells were lysed after six days for Western blot analysis as described below. N25 cells that were not transduced were used as a control for RNA and protein analysis. Cells used in the cell spreading assays were fixed with 2% paraformaldehyde + PBS for 20 minutes, followed by a permeabilization step with 0.1% Triton X-100 + PBS for two minutes and then processed as described above.
Western Blot Analysis
TM cells were lysed with 25 mM HEPES, pH 7.4 buffer containing 150 mM NaCl, 1 mM EDTA, 1 mM NaF, 1% NP-40, 0.25% deoxycholate, HALT phosphatase inhibitor cocktail, and HALT protease inhibitor cocktail (Thermo Fisher Scientific, Inc.) as previously described.33 Cell lysates were spun in a centrifuge at 10,000g for 10 minutes at 4°C. Ten micrograms of protein were loaded and run on 10%-SDS-PAGE gels. Proteins were transferred to a nitrocellulose membrane (Bio-Rad Laboratories, Ann Arbor, MI, USA). The membranes were blocked in 3% BSA/Tris buffered saline (TBS) overnight at 4°C and then incubated with the primary antibody in 1% BSA/TBS/0.1% Tween-20 for 1 h. Membranes were washed with TBS/0.1% Tween-20 and incubated for one hour with a secondary antibody. Labeled bands were visualized using a Li-COR Odyssey CLx infrared scanner and quantified using LI-COR Image Studio v. 5.0.21 software (Li-Cor Biosciences, Lincoln, NE, USA).
On-Cell Western (OCW)
OCWs were performed as previously described.35 TM cells were plated into 96-well plates at a density of 3 × 10⁴ cells/well in medium glucose DMEM + 10% fetal bovine serum and maintained for seven days. Cell layers were either left intact or extracted with hypotonic lysis buffer (20 mM HEPES, pH 7.4 + 1mM EDTA + 1X HALT protease inhibitors + 1.5% deoxycholate) for five minutes. Intact and extracted cell layers were then fixed with 4% paraformaldehyde + PBS for 20 minutes. Intact and extracted cell layers were then labeled with either mAb BC-1 (EDB+ fibronectin), mAb Ist-9 (EDA+ fibronectin), or mAb Ist-4 (total fibronectin). Total protein levels in both intact and extracted cell layers were determined by labeling the wells with IRDye 680RD NHS ester (LI-COR). Fibronectin-labeled wells were blanked against negative control wells labeled with a monoclonal antibody against β-galactosidase and then normalized against the total protein content within each respective well. Bound primary antibody was detected with IRDye 800CW-conjugated goat-anti-mouse IgG (LI-COR). Quantification of the signals at 700 and 800 nm, respectively, was performed using a LI-COR Odyssey CLx infrared scanner running Image Studio version 5.0.21 software.
Data Analysis
Data are presented as the mean ± SEM. Statistical comparisons used either a t-test, a one-way ANOVA plus the post-hoc Tukey HSD test, or a Whitney-Mann or Kruskal-Wallis non-parametric with post-hoc Dunn's test using the Bonferroni correction with a P value < 0.05 being considered statistically significant. The specific tests used are described within each figure legend. Fold changes in gene expression were performed according to the ∆∆Ct method. The RT-qPCR data was normalized using either gene succinate dehydrogenase complex subunit A (SDHA), or hypoxanthine phosphoribosyl transferase 1 (HPRT1).
Results
Although many studies have documented the fibrotic-like changes in TM tissue derived from glaucoma patients,5,36 few studies have investigated differences in the expression profile of integrins between young and old human TM cells and how their expression would affect the ECM and contractile properties of TM cells. In this study, we examined the expression profile of α4, α5, α9, β1 and β3 integrin subunits in TM cells isolated from young and old donor eyes. These studies showed a striking difference in the expression profile of α5β1 integrins in young versus old TM cells. By flow cytometry, there is a decrease in α5 integrin expression on the cell surface in two of the older TM cell strains from donor eyes 74 and 77 years old (N74 and N77; Fig. 1). In contrast, a third cell strain, from a 75-yr old donor eye (N75), had similar levels of α5 integrin as two young TM cell strains derived from donor eyes ages 17 and 27 (N17 and N27). Neither the β1 nor β3 integrin subunits showed an age-related difference in expression. We also didn't see a difference in expression in either the α2, α4, or α9 integrin subunits in these young and old cell strains (Supplementary Fig. S3). Because the α5 integrin subunit only pairs with the β1 integrin subunit, this suggests that the major fibronectin binding integrin α5β1 is downregulated in some, but not all, old TM cells.
Figure 1.

An age-related loss of α5 integrin subunit is seen in two out of three old TM cell strains. Flow cytometry for α5, β3, and β1 integrin subunits was done on two young cell strains (N17, N27) and three old cell strains (N74, N75 and N77). Blue peaks are cells labeled with control IgG, whereas pink peaks are cells labeled with either P1D6 mAb (α5 integrin; top panels), LM609 mAb (β3 integrin subunit; middle panels), or 12G10 (β1 integrin; bottom panels). In contrast to young TM cells, α5 integrin labeling is not above background in two of the old TM cells (N74 and N77), indicating that α5 integrin levels on the cell surface are lower. The third old cell strain (N75) had similar levels of α5 integrin as the two young cell strains (N17 and N27). Both young and old TM cells express similar levels of the β3 and β1 integrin subunits (middle and bottom panels, respectively). N = >2000 cells per cell group after gating.
To see if a decrease in α5 integrin expression was limited to cells isolated from a few donor eyes, we examined the mRNA levels of the α5 and β3 integrin subunits in TM cells isolated from thirteen young and eight old biological replicates (Supplementary Table S1). As shown in Figure 2, TM cells isolated from older tissues showed statistically (P < 0.05) lower levels of the mRNA for the α5 integrin subunit compared to young donor TM cell strains (Fig. 2A). Surprisingly, the levels of the β3 and β1 integrin mRNAs were statistically (P < 0.05) elevated in older TM cells (Figs. 2B, 2C), even though the protein levels appeared similar among the young and old cells by flow cytometry (Fig. 1). The αv integrin subunit, which pairs with either the β1 or β3 integrin subunits, did not show any statistically significant differences in mRNA levels between young and old cell strains (Fig. 2D). Correlation coefficient analysis confirmed a moderate decrease in α5 integrin mRNA and showed that the decrease started to occur in individuals over the age of 40 (Fig. 2E). A moderate increase in β3 integrin mRNA levels were also seen to occur with increased age (Fig. 2F). The β1 integrin subunit also showed a moderate increase, but this increase appeared to be restricted to a few older individuals whereas most of the individuals showed no change in mRNA expression. As expected, mRNA levels for the αv integrin subunit did not show any correlation with age (Fig. 2H). These studies also saw a statistically significant increase in α4 integrin mRNA levels in TM cells from older donor eyes (Supplementary Fig. S3C). In contrast, the mRNA levels for the α2 and α9 integrin subunits did not appear to change (Supplementary Fig. S3B and D). Thus the mRNA expression levels of some integrins appear to vary greatly as we age, which can have large effects on the ability of TM cells to engage the ECM and/or transmit biomechanical signals.
Figure 2.

RT-qPCR analysis of α5, β3, β1 and αv integrin mRNA levels. (A) The mRNA levels for the α5 integrin subunit are statistically higher in TM cells from young donor eyes (gray) compared to levels found in TM cells from old donor eyes (pink). (B, C) In contrast, levels of β3 and β1 integrin subunits mRNAs are decreased in TM cells from young donor eyes compared to cells from old donor eyes. (D) There is no significant difference in αv integrin mRNA levels present between young and old TM cells. Statistically significant differences were confirmed using both an unpaired t-test and Mann-Whitney test for A, B, and C. (*P < 0.05). N = 13 biological replicates for young TM cells, N = 8 for old cells. (E–H) Scatter plots of α5, β3, β1, and αv integrin mRNA levels, respectively, relative to age. Levels of α5 integrin mRNA appear to decline as the age of the individual increases. In contrast, the levels of β3 integrin mRNA exhibits a modest increase as the age of the individual increases. Levels of β1 integrin mRNA appear relatively unchanged except for a few individuals over 50 years of age while no change in αv mRNA levels with age was observed. r = Pearson's correlation coefficient.
We saw a similar trend when we compared α5 integrin labeling in the TM/SC of young versus old human eyes. As shown in Figure 3A, the TM/SC is located in the anterior segment of the eye. It consists of several fenestrated beams covered with TM cells, a region with TM cells embedded in a dense ECM (JCT), and a monolayer of cells that form the inner and outer wall of SC (Fig. 3B). A typical section of the TM/SC is shown in Figure 3C. Immunolabeling studies on tissue from younger individuals showed α5 integrin expression throughout the TM, in the JCT, and in cells along SC (Figs. 3D and 3E). In contrast, TM from an old anterior segment, which was the same tissue used to make the N74 cell strain, showed decreased expression of α5 integrin in the TM, particularly in the JCT region (Figs. 3G and 3H). The downregulation of α5 integrin expression appeared to be specific for the TM since α5 integrin expression was still observed in the inner wall of SC in both young and old eye tissues. This decrease was not due to a loss in cell numbers as the number of nuclei were similar. As expected, we did not see any differences in β3 integrin labeling of young and old tissues (Supplementary Fig. S4). Panels 3F and I were labeled with an anti-β-galactosidase antibody which was used as an IgG control for primary antibody labeling. The small blue dots that are distinct from Hoechst-labeled nuclei in panels 3G-I are autofluorescent granules that are present in sections regardless of the presence or absence of Hoechst (Supplementary Fig S5).
Figure 3.

Immunolabeling for α5 integrin in anterior segments from young and old eyes. (A) Location of the TM in the angle of the anterior segment. (B) Schematic of the TM showing that it consists of several layers of fenestrated beams covered by a monolayer of TM cells. This is followed by a region called the juxtacanalicular tissue (JCT) region which is composed of individual cells embedded in an ECM. This is the region where most of the outflow resistance lies due to fibrotic changes that occur during POAG. AH (arrows) flows into the TM from the anterior chamber (AC) and exits through the inner wall (IW) of Schlemm's canal (SC) to the distal vessels (DV). (C) An H&E-stained section showing the typical morphology of the TM in a section of the anterior segment from a 36-yr-old donor eye. Scale bar: 50 µm. (D–I) Sections of anterior segments from 21-year-old (D–F) and 74-year-old (G–I) donor eyes. Sections were labeled with mAb 10F6 against α5 integrin (D, E, G, H), or an IgG control antibody against β-galactosidase (F, I). Asterisks in D and G show regions that are at higher magnification in E and H, respectively. The α5 integrin labeling is ubiquitous within the TM beam cells and JCT in the 21-year-old tissue but is greatly reduced or scattered within the beam cells and JCT from the 74-year-old tissue. Both young and old tissue samples show α5 integrin labeling along the SC indicating that the loss of α5 integrin is specific to TM cells. A similar decrease in α5 integrin labeling was also observed in the TM from which the N77 cell strain was isolated (data not shown). In both young and old tissues, the α5 integrin labeling is clearly above the background labeling and shows a cell specific labeling pattern. The IgG control labeling in F and I, which differs from the α5 integrin labeling pattern, shows a similar nonspecific labeling pattern of IgG. This labeling pattern is presumably due to aggregation of the primary and/or secondary antibodies or autofluorescent structures. N = 2 biological replicates/age group. Arrows indicate TM beam cell labeling; arrowheads indicate SC endothelium labeling. (D) Scale bar: 20 µm for panels D, F, G, and I. (E) Scale bar: 20 µm for E and H. The 21-year-old, 74-year-old and 77-year-old tissues correspond to donors 2021-0755, 2021-1493, and 2021-1110, respectively, in Supplementary Table S1.
We next examined whether the age-related decrease in α5 integrin expression affected the contractile properties of TM cells. For this, we used two α5-positive young TM cell (N17 and N27) and two old TM cell strains (N74 and N77) that lack α5 integrin (Fig. 1) in a collagen gel contraction assay. These studies show that the α5-negative N74 and N77 TM cells were statistically more contractile than the α5-positive N17 and N27 TM cells. Within minutes of releasing the collagen gel from the plate, the old α5-negative cells contracted the gel by ∼13% compared to the control gel, while the α5-positive young TM cells only contracted the gel by 3% (Figs. 4A, 4B). By 24 hours, we saw a 60% decrease in the diameter of the gel with the old cells compared to the control gels. In contrast, we saw a 35% decrease observed with young cells. Thus α5-negative older cells were more contractile then α5-positive young cells. On the other hand, the older α5-positive TM cells (N75) which had similar levels of α5β1 and αvβ3 integrins as the young TM cells by flow cytometry (Fig. 1) behaved like younger cells. These α5-positive older TM cells only contracted the gel by 45% (compare B-D) after 24 hours, which is only slightly higher than the levels seen in the younger cells. This suggests that the levels of α5β1 and αvβ3 integrins on the cells surface are playing a role in regulating contraction.
Figure 4.

Old TM cells are more contractile than young TM cells and express higher levels of αSMA. (A, B) Young and old TM cells were plated onto collagen gels (1.25 mg/ml) for 24 hrs. The gels were then rimmed to release them from each plate. Old cells were statistically more contractile than younger donor cells within minutes of releasing the gels. N = 2 biological replicates/age group. All experiments were done in triplicate and repeated three times. (C, D) By four hours, old α5-negative TM cells are statistically more contractile than old α5-positive TM cells. Statistical analysis was done using a one-way ANOVA. Collagen contractility assays were done as described above. All experiments were done in duplicate or triplicate. *P < 0.05, **P < 0.01, ***P < 0.001. Bars: S.E.M. (E, F) Immunofluorescent microscopy images showing that αSMA+ stress fibers were not formed in N27-2 cells from a young donor (E) in contrast to the N77 cells from an old donor eye (F). Cells were plated onto collagen-coated coverslips for 24 hours and labeled with anti-αSMA antibody, as described in materials and methods. White arrows indicate the αSMA+ stress fibers. Scale bar: 50 µm. (G) RT-qPCR of αSMA mRNA levels in young (gray) and old (pink) TM cells show that mRNA levels for αSMA are significantly upregulated in old cells compared to younger cells suggesting that old cells are more contractile. Statistically significant differences were confirmed using both an unpaired t-test and Mann-Whitney test. *P < 0.05. The N27-2 and N77 TM cells were isolated from donors N27TM-2 and 2021-1110, respectively, in Supplementary Table S1.
Next, we wanted to determine whether the decreased expression of α5 integrin in older cells was accompanied by higher levels of αSMA. αSMA plays a pivotal role in cell contraction and is considered one of the markers of EndoMT associated with fibrosis and the pathogenesis of POAG.2,3 Using immunofluorescence microscopy, we saw an increase in the localization of αSMA within stress fibers in α5-negative N77 TM cells compared to the α5-positive N27-2 TM cells (Figs. 4E, 4F) in which αSMA was diffusely localized throughout the cells. This further suggests that older cells are more contractile than younger TM cells, which is consistent with the collagen gel contraction assay (Fig. 4A). When we examined the larger population of TM cells (Supplementary Table S1), we also saw a statistically significant increase in the levels of αSMA mRNA in older cells (Fig. 4G), further suggesting that an increase in αSMA expression may occur during aging as expression of the α5 integrin subunit decreases.
Because both α5β1 and αvβ3 integrins are found in focal adhesions (Fig. 5A) and drive cell contraction and formation of stress fibers,13,21,37 we then looked to see whether the expression of these integrins in focal adhesions varied in the young and old TM cells plated on collagen. For this, the young α5-positive N27-2 TM cells and the old α5-negative N77 TM cells were plated onto collagen-coated coverslips for three hours and the localization of integrins in focal adhesions was determined by immunofluorescence microscopy. As shown in Figure 5B, both young and old TM cells plated on collagen for three hours had very robust focal adhesions that contained αvβ3 integrins. We did not detect any differences in the number of cells containing αvβ3 integrins in focal adhesions (Figs. 5B, 5C). As expected, we did not see any labeling for α5β1 integrins in focal adhesions because α5β1 integrin does not bind collagen (data not shown). Nor did we see any labeling for α2β1 integrin in focal adhesions (data not shown). Together, these data support the idea that the contractile properties of the cells and stress fiber formation on collagen were being mediated by αvβ3 integrins, as previously shown.38
Figure 5.

Higher levels of active αvβ3 integrin are localized within focal adhesions and on the cell surface in older TM cells. (A) Schematic showing that integrins are heterodimeric transmembrane proteins consisting of an α and β subunit that interact with the ECM. They can exist in both an active and inactive state within the sites of contact with the ECM called focal adhesions. The active integrin has an upright conformation, can bind to ECM proteins and interact with cytoplasmic signaling molecules that trigger the assembly of actin stress filaments. (B) Young N27-2 and old N77 TM cells were labeled for total αvβ3 integrin levels (mAb [BV3]) and active αvβ3 integrin (mAb LIBS2). Both TM cell strains showed numerous focal adhesions (white arrows) containing αvβ3 integrin and some focal adhesions that were positive for active αvβ3 integrin. (C) Quantitation of number of young (gray) or old (pink) cells containing three or more focal adhesions did not show a statistical difference in the number of cells that contained αvβ3 integrin in focal adhesions. Number of N27-2 and N77 cells counted were 101 and 87, respectively. (D) In contrast, quantitation of the number of cells containing three or more focal adhesions that contained active αvβ3 integrin were statistically higher in old cells (pink) compared to young cells (gray). Number of N27-2 and N77 cells counted were 91 and 103, respectively. ***P < 0.001. Statistical analysis was done using an unpaired t-test and Mann-Whitney test. (E) Flow cytometry analysis of total levels of αvβ3 integrin on young and old TM cell strains. Total integrin levels were determined using mAb LM609 against αvβ3 integrin. No difference was observed between the different cell strains. (F) Flow cytometry analysis of activated αvβ3 integrin levels on young and old TM cell strains. Levels of activated αvβ3 integrin were determined using mAb LIBS2. Higher percentage of the old α5-negative cells contained activated αvβ3 integrin compared to both the young cell strains and the old, α5+positive cell strain, *P < 0.05. For E and F, cells were processed for flow cytometry as described in materials and methods. Studies used two α5-negative old TM cells strains (N74 and N77), the one α5-positive old TM cell strain (N75) and six young TM (N17, N25, N27, N27-2 and N35) strains. N = 5 biological and 3 technical replicate for young TM cells. N = 2 biological replicates for the α5-negative old TM cells and N = 2 technical replicates for α5-positive old TM cells. Statistical analyses were done using a one-way ANOVA. *P < 0.05.
We then looked to see if there was a difference in αvβ3 integrin activity that could account for the observed differences in cell contractility. Using the LIBS2 monoclonal antibody that detects the active upright form (Fig. 5A) of αvβ3 integrin,39 we found that the active form of αvβ3 integrin was more prevalent in focal adhesions in old N77 TM cells compared to young N27-2 cells (Figs. 5B, 5D). Many of the focal adhesions in old cells appeared larger and reminiscent of supermature focal adhesions reported to occur in myofibroblasts.40
This increase in active αvβ3 integrin levels in old TM cells was not due to an increase in total αvβ3 integrin protein levels since both young N27 and old N74 and N77 cells showed similar levels of the β3 integrin subunit by flow cytometry (Figs. 1, 5E). Also, similar levels of αvβ3 integrin-labeled focal adhesions were detected using mAb [BV3], which detects total αvβ3 integrin. Thus, there appears to be an increase in the activity of αvβ3 integrin in old TM cells compared to younger cells concomitant with the loss of α5β1 integrin expression. Flow cytometry supports this idea (Fig. 5F, Supplementary Fig. S6) and showed that there were statistically higher (P < 0.05) levels of old α5-negative cells with activated αvβ3 integrins on their cell surface compared to young cells or the α5-postive old cells. As shown in Supplementary Fig. S6, ∼40% of the old α5-negative N77 TM cells contain activated αvβ3 integrins on their cell surface compared to ∼20% of the α5-positive N27-2 young TM cells used in the spreading assay (Fig. 5).
Next, we wanted to see whether a decrease in α5 integrin mRNA levels would affect either β3 integrin expression or activity as suggested by the contractility and cell spreading assays. For this, we used a lenti-shRNA viral vector to knockdown the α5 integrin subunit in young N25 TM cells. As shown in Figure 6, an MOI of 50 resulted in a 60% knockdown of the α5 integrin mRNA (Fig. 6A) and a statistically significant 50% decrease in expression of the α5 integrin subunit by Western blot analysis (Figs. 6C, 6D). The viral knockdown was specific for the α5 integrin subunit because we did not see an effect on α5 integrin mRNA levels when we used a viral vector that did not target the α5 integrin subunit (Fig. 6B).
Figure 6.
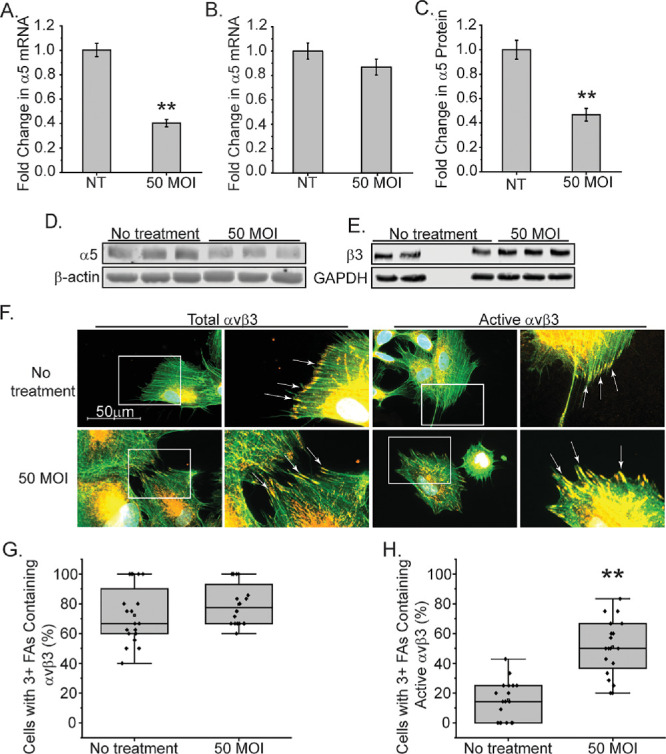
Knockdown of α5 integrin subunit in young TM cells triggers an increase in β3 integrin activity. (A) N25 TM cells were transduced with a lenti-α5 shRNA viral vector (MOI 50). By RT-qPCR, there was a significant 60% reduction in α5 integrin mRNA compared to untransduced cells when analyzed. (B) N25 TM cells transduced with a non-targeting control vector showed no effect on α5 integrin mRNA levels. The control vector used was a lenti-β3 integrin shRNA viral vector (MOI 50). (C, D) Western blot analysis showed a significant 50% decrease in the α5 integrin subunit in transduced cells compared to untransduced cells by an unpaired t-test. GAPDH was used as a loading control. (E) Western blot analysis showed that levels of the β3 integrin subunit were unchanged when α5 integrin was knocked down. (F) Immunofluorescence microscopy of transduced and untransduced N25 cells labeled for total levels of αvβ3 integrin (mAb [BV3]) or activated αvβ3 integrin (mAb LIBS2) in focal adhesions (arrows). Cells were stained with Alexa 488 phalloidin to detect actin filaments. Scale bar: 50 µm. (G) Untransduced and transduced N25 cells with three or more focal adhesions show similar levels of focal adhesions containing αvβ3 integrin, with no statistical difference. The number of cells counted per treatment group ranged between 99–114 cells. (H) The number of transduced N25 TM cells with three or more focal adhesions containing activated αvβ3 integrin was statistically higher compared to control cells. The number of cells counted per treatment group ranged between 99–111. **P < 0.01. Statistically significant differences were confirmed using both an unpaired t-test and Mann-Whitney test.
As expected, there was no effect on the protein level of the β3 integrin subunit (Fig. 6E) in response to the α5 lenti-shRNA viral vector, which also confirmed the specificity of the viral vector. Not surprisingly, we also did not see any differences in the level of total αvβ3 integrin expressed in focal adhesions in cells plated on collagen (Figs. 6F, 6G). Thus a reduction in α5 integrin levels in young N25 TM cells did not appear to affect total β3 integrin levels, or assembly of αvβ3 integrin into focal adhesions (Fig. 6G). Knockdown of the α5 integrin subunit did, however, affect the activity of the β3 integrin subunit. Cell spreading assays clearly showed that there was a statistically significant increase in the levels of activated αvβ3 integrin in focal adhesions of cells when α5 integrin was knocked down compared to control cells (Figs. 6F, 6H). A similar result was seen in knockdown experiments using N35 TM cells as a biological replicate (data not shown). Thus knocking down α5 integrin in young TM cells leads to age-related changes such as increased activation of αvβ3 integrin which contributes to the fibrogenic phenotype of the TM/SC.21
Finally, we examined the effect of an age-related decrease in α5β1 integrin expression on the formation of fibronectin fibrils. The α5β1 integrin is the major integrin involved in the assembly of fibronectin fibrils41 and a loss of α5β1 integrin would be expected to impair fibronectin fibril formation. To investigate the effects of integrin switching on fibronectin assembly, we used an OCW technique to quantitate the levels of fibronectin fibrils in the matrix. Figure 7A shows that TM cells from the three old donors (N74, N75, and N77 years old) assembled a greater level of fibronectin fibrils compared to cultures of TM cells isolated from young α5-positive donor eyes (25–27 years old). The fibronectin matrices from old TM cells not only contained statistically higher levels of the EDA+ isoform of fibronectin in the insoluble matrix (Fig. 7A), but the levels the EDB+ fibronectin isoform were also statistically (P < 0.05) increased. The observed increase in the assembly of EDA+ and EDB+ fibronectin into fibrils was not specifically due to lower levels of α5 integrin expression since the old α5-positive N75 TM cell strain also showed higher levels of EDA+ and EDB+ fibronectin in the insoluble fibrils (Fig. 7B). Interestingly, this age-dependent increase in fibronectin matrices was not due to an age-dependent increase in total fibronectin mRNA levels or the mRNA levels of the EDA+ isoform of fibronectin (Fig. 7C). This suggests that the increase in fibronectin was probably at the translational level, not transcriptional level. In contrast, the increased expression of the EDB+ isoform of fibronectin in TM cells isolated from older donor eyes was due, at least in part, to higher levels of EDB+ fibronectin mRNA (Fig. 7C), suggesting that it is upregulated at the transcriptional level during aging. Increases at the translational level of EDB+ fibronectin cannot be excluded, however.
Figure 7.

Assembly of fibronectin fibrils and expression of the EDB + isoform of fibronectin (FN) is higher in old TM cells. Expression of fibronectin and its EDA+ and EDB + isoforms was measured in three young cell lines (N17, N27-2, N25) and three old cell lines (N74, N75, and N77) using an OCW as described in material and methods. (A) EDA+, EDB+, and total FN was significantly higher in both soluble and insoluble fractions of cell layers from old cells compared to young cells. (B) Levels of EDA+ and total FN in both soluble and insoluble fractions were similar in all three old cell lines. EDB + FN, however, was found to be significantly higher in the insoluble matrix in one α5-negative cell line (N77) compared to the α5 + positive N75 old cell line. *P < 0.05. N = 3 biological replicates/age group. All experiments were done in triplicate and repeated in 4 independent experiments. (C) Quantitative PCR of EDA+, EDB+, and FN mRNA levels in old (pink) and young (gray) cells show that mRNA levels for EDB+FN were significantly increased in old cell lines. *P < 0.05. Statistically significant differences were confirmed using both an unpaired t-test and Mann-Whitney test in panels A and C. A one-way ANOVA with a post-hoc Tukey HSD test and a Kruskal-Wallis nonparametric with post-hoc Dunn's test using the Bonferroni correction was used for the statistical analysis in panel B.
Discussion
In this study, we showed that the expression profile of α5β1 and αvβ3 integrins in human TM cells and tissues changes with aging and this affects the contractile properties of TM cells. We also found that a decrease in the expression of α5 integrin subunit in old individuals appears to trigger an increase in the activity of αvβ3 integrin. This gain-of-function in αvβ3 integrin activity is associated with a statistically significant increase in the assembly of αSMA+ stress fibers, an increase in αSMA mRNA levels, the appearance of activated αvβ3 integrins in focal adhesions, and increased levels of the EDB+ isoform of fibronectin. This suggests that an age-related switch in integrin signaling alters the contractile properties of old TM cells and may be an early step in triggering the fibrogenic pathways associated with EndoMT in the aged TM/SC (Fig. 8).
Figure 8.

Model of integrin switching in aging TM. Young TM cells initially express both α5β1 and αvβ3 integrins on their cell surface and lack actin filaments containing αSMA. αvβ3 integrins on these young cells appear to be a mixture of both active (upright conformation) and inactive (bent conformation) integrins. As the TM cells age, there is a loss of α5β1 integrins, increased activation of αvβ3 integrin on the cell surface, and an enhancement in the contractile activities of the cells. This increased contractile activity appears to be driven by the activated αvβ3 integrin that causes initiation of mechanotransduction and an increase in αSMA+ stress fibers.
Interestingly, activation of αvβ3 integrin is believed to be a prerequisite for the formation of αSMA-containing stress fibers during the differentiation of myofibroblasts,40 which leads to the development of epithelial mesenchymal transition and EndoMT.42 Given that EndoMT is believed to contribute to the increased rigidity of the TM/SC tissue and alter the pressure-dependent contractile properties of the TM/SC outflow pathway that controls IOP,3 this suggests that a switch in activity from α5β1 to αvβ3 integrin likely contributes to the pathogenesis of the contractile-fibrotic phenotype that is characteristic of POAG.
In addition to causing an increase in αvβ3 integrin activity and contractility, an age-related decrease in α5-integrin could interfere with a TM cell's ability to detect IOP-induced biomechanical changes to the ECM. Our previous study showed that α5β1 integrins are localized at the tips of filopodia in TM cells,43 whereas αvβ3 integrins are located at discrete areas along the filopodial shaft as well as the tip. Filopodia are highly dynamic, mechanosensing cellular structures that extend from the cell surface and form transient adhesions with the ECM as a way to probe a cells' microenvironment. The localization of α5β1 integrin at these tips suggests that α5β1 integrin is needed to form these transient adhesions and promote filopodia elongation in TM cells. Hence, a loss of α5β1 integrin in the aged TM would reduce the capacity for cells to detect IOP-induced changes to the microenvironment.
What causes the decrease in α5 integrin expression in the TM is still unknown. In human retinal pigment epithelial (RPE) cells, as well as human and rabbit corneal epithelial cells, expression of the α5 integrin subunit, and its promoter activity is downregulated as the cells become quiescent44 due to an apparent alteration in the ratio of transcription factors that activate or repress α5 integrin expression.45,46 This relationship between age-related diseases and expression of transcriptions factors is well established47,48 and could represent an early step in the development of POAG.
Our studies further suggest that there is a certain level of inactive αvβ3 integrin existing on the TM cell surface and that a decrease in expression of α5β1 integrin may be contributing to the activation of those αvβ3 integrins. By flow cytometry and immunofluorescence microscopy, we could not detect any differences in the levels of total αvβ3 integrin expression on the cell surface or in focal adhesions between young and old TM cell strains. Yet, in older TM cells expressing lower levels of α5β1 integrin, there was a noticeable increase in the level of active αvβ3 integrins in focal adhesions and on the cell surface of older cells (Figs. 5 and S4). The cause for this increase is unknown. A unique function of integrins is that their expression and activity is tunable within subseconds in a spatiotemporal manner.49,50 This occurs in response to biomechanical changes in their microenvironment and the expression of other integrins.13,51,52 Hence, a change in α5 integrin expression could be triggering the increase in αvβ3 integrin activity.
A switch in integrin signaling caused by a change in the expression of another integrin is not unexpected and could trigger the increase in αvβ3 integrin activity in old TM cells.53 Studies in K562 erythroleukemia cells showed that expression of αvβ3 integrin inhibited α5β1 integrin activity.54 Studies in a β1-null GD25 mouse embryonic fibroblast line showed that the αvβ3 integrin took over the role of β1 integrins in mediating focal adhesion formation and re-expression of the β1 subunit reversed the effect.55 More recently, this phenomenon has been observed to occur in cancer tissues56 and to be associated with an epithelial mesenchymal transition in cancer cells, a transition similar to EndoMT.57 Together, these studies show that crosstalk between integrin subunits regulates their expression and/or activity.
In the TM, a gain in αvβ3 integrin activity could contribute to the pathogenesis of the fibrotic phenotype characteristic of EndoMT associated with aging TM/SC tissues and TGFβ2-induced POAG.2,5,36 An increase in αvβ3 integrin activity has been shown to drive expression of TGFβ2 in TM cells,24 promote the formation of cross-linked actin networks,22 and enhance fibronectin fibrillogenesis,23 which are all upregulated in TGFβ2-induced POAG. αvβ3 integrin is also a receptor for connective tissue growth factor (CTGF) in TM cells,58 which is involved in upregulating expression of ECM proteins in fibrosis.59 αvβ3 integrin is also associated with senescence in human diploid fibroblasts60 which is reported to occur in glaucomatous TM.61 Thus, an increase in αvβ3 integrin activity may enhance the susceptibility of people to develop glaucoma.
Interestingly, in the developing mouse eye a conditional knockout of the β3 integrin in the SC impaired its development, which led to an elevation in IOP at postnatal day 28.29 This study also showed a decrease in β3 integrin expression in the SC in 1 year old mice compared to 8 week old mice suggesting that there may be an age-related loss of αvβ3 integrin in SC. However, because we see expression of αvβ3 integrin in the human SC from individuals over 70 years of age (Supplementary Fig. S4), this decrease in expression may be specific to the mouse eye.
Although previous studies have noticed age-related changes in α5β1 integrin expression in quiescent cultures of RPE cells,44 and HT1080 human fibrosarcoma fibroblasts,62 to date only one other study has reported an age-related change in integrin expression in the TM.10 Interestingly, α5β1 integrins also appeared to be absent in the RPE in vivo in tissue from older individuals (>50 yrs old), suggesting an age-related downregulation in the retina.63 Further studies are needed to investigate whether additional ocular tissues show a similar age-related decrease in α5β1 integrin expression.
These studies also observed an increase in the formation of an insoluble fibronectin matrix in old TM cell strains. However, this did not appear to be due to a complete loss of the α5 integrin subunit because the old α5-positive N75 cell strain also showed these changes. Why activated αvβ3 integrin enhanced fibronectin matrix formation is unknown. We also saw this in an earlier study, when we overexpressed activated αvβ3 integrin in TM-1 cells that expressed the α5β1 integrin.23 In that study, we suggested that activated αvβ3 integrins were using an alternative RhoA/Rock-independent pathway to assemble fibronectin fibrils. This pathway appears to also exist in older TM cells.
This study suggests that the impact of activated αvβ3 integrin is not a binary on/off process but rather reflects a ratio of the αvβ3 integrin to the α5β1 integrin on the cell surface. As the level of α5β1 integrin decreases, the level of active αvβ3 integrin increases. This provides a partial effect or a spectrum of intermediate states. Our shRNA knockdown data in Figure 6 supports this idea and showed even though we only achieved a 50% decrease in α5 integrin protein levels, we still saw a statistically significant increase in the level of activated αvβ3 integrin in focal adhesions.
We also saw increased expression of the EDB+ isoform of fibronectin in the matrix as well as EDA + fibronectin. The expression of EDB + fibronectin is intriguing because it has been observed to occur in stiffer ECMs as a result of enhanced alternative splicing of fibronectin.64 This suggests that the ECM made by old TM cells may be stiffer. In addition, because EDB + fibronectin appears to be upregulated in TM cell cultures overexpressing a constitutively active αvβ3 integrin,23 and EDB + fibronectin binds and activates the αvβ3 integrin,65 this suggests that activation of αvβ3 integrin and expression of EDB+ fibronectin may be connected. Whether activation of αvβ3 integrin is responsible for EDB + fibronectin expression, or vice versa, remains to be determined. However, it is interesting that both the αvβ3 integrin and fibronectin have been identified as potentially new therapeutic targets for glaucoma in a recent network pharmacology study.66 In summary, these studies suggest that an age-related dysregulation of α5β1 and αvβ3 integrin signaling may represent a key early event in inducing the transition into an αSMA-producing, myofibroblast-like, contractile TM cell. Whether this switch in integrin signaling is more prevalent in a particular ethnic group remains to be determined and is one limitation of this study given that racial differences have been observed in the prevalence of glaucoma.67,68 In addition, hormones such as estrogen have been shown to influence αvβ3 integrin expression69,70 thus sex may also contribute to integrin switching. Future studies examining integrin profiles from these groups, as well as in different types of glaucomatous tissues (i.e., normal tension and hypertensive POAG), should enhance our understanding of why some older individuals are more susceptible to developing glaucoma.
Supplementary Material
Acknowledgments
The authors thank the University of Wisconsin Translational Research Initiatives in Pathology laboratory (TRIP) for their assistance with histology studies, and the Lions Eye Bank of Wisconsin and VisionGift, Portland, OR, which aided procurement of cadaver eyes.
Supported by NIH/NEI grants R01EY017006 (DMP), R01EY032905 (DMP), P30 EY016665 (DMP), R01EY019643 (KEK), R01EY032590 (KEK), P30 010572 (KEK), and an unrestricted grant to the Casey Eye Institute from Research to Prevent Blindness, NY (KEK).
Disclosure: K.L. Johns, None; J.A. Faralli, None; M.S. Filla, None; N.S. Shah, None; Y.Y. Sun, None; K.E. Keller, None; D.M. Peters, None
References
- 1. Gabelt BT, Kaufman PL. Changes in aqueous humor dynamics with age and glaucoma. Prog Retin Eye Res. 2005; 24: 612–637. [DOI] [PubMed] [Google Scholar]
- 2. Liu B, McNally S, Kilpatrick JI, Jarvis SP, O'Brien CJ. Aging and ocular tissue stiffness in glaucoma. Surv Opthalamol. 2018; 63: 56–74. [DOI] [PubMed] [Google Scholar]
- 3. Johnstone M, Xin C, Tan J, Martin E, Wen J, Wang RK. Aqueous outflow regulation—21st century concepts. Prog Retin Eye Res. 2021; 83. [DOI] [PMC free article] [PubMed] [Google Scholar]
- 4. Acott TS, Kelley MJ. Extracellular matrix in the trabecular meshwork. Exp Eye Res. 2008; 86: 543–561. [DOI] [PMC free article] [PubMed] [Google Scholar]
- 5. Keller KE, Peters DM. Pathogenesis of glaucoma: Extracellular matrix dysfunction in the trabecular meshwork—a review. Clin Exp Ophthalmol. 2022; 50: 163–182. [DOI] [PMC free article] [PubMed] [Google Scholar]
- 6. Zhou L, Maruyama I, Yuhong L, Cheng EL, Yue B. Expression of integrin receptors in the human trabecular meshwork. Curr Eye Res. 1999; 19: 395–402. [DOI] [PubMed] [Google Scholar]
- 7. Faralli JA, Filla MS, Peters DM. Effect of αvβ3 integrin expression and activity on intraocular pressure (IOP). Invest Ophthalmol Vis Sci. 2019; 60: 1776–1788. [DOI] [PMC free article] [PubMed] [Google Scholar]
- 8. VanderWyst SS, Perkumas KM, Read AT, Overby DR, Stamer WD. Structural basement membrane components and corresponding integrins in Schlemm's canal endothelia. Mol Vis. 2011; 17: 199–209. [PMC free article] [PubMed] [Google Scholar]
- 9. Park D-Y, Lee J, Park I, et al.. Lymphatic regulator PROX1 determines Schlemm's canal integrity and identity. J Clin Invest. 2014; 124: 3960–3974. [DOI] [PMC free article] [PubMed] [Google Scholar]
- 10. Tervo K, Paallysaho T, Virtanen I, Tervo T. Integrins in human anterior chamber angle. Graefes Arch Clin Exp Ophthalmol. 1995; 233: 291–295. [DOI] [PubMed] [Google Scholar]
- 11. Virtanen I, M. K, Kariniemi A-L, Gould VE, Laitinen L, Ylanne J. Integrins in human cells and tumors. Cell Diff Dev. 1990; 32: 215–228. [DOI] [PubMed] [Google Scholar]
- 12. Vigneault F, Zaniolo K, Gaudreault M, Gingras M-E, Guerin SL. Control of integrin genes expression in the eye. Prog Retin Eye Res. 2007; 26: 99–161. [DOI] [PubMed] [Google Scholar]
- 13. Kechagia JZ, Ivaska J, Roca-Cusachs P. Integrins as biomechanical sensors of the microenvironment. Nat Rev Mol Cell Biol. 2019; 20: 457–473. [DOI] [PubMed] [Google Scholar]
- 14. Takagi J, Springer TA. Integrin activation and structural rearrangement. Immunol Rev. 2002; 186: 141–163. [DOI] [PubMed] [Google Scholar]
- 15. Zhu J, Boylan B, Luo B-H, Newman PJ, Springer TA. Tests of the extension and deadbolt models of integrin activation. J Biol Chem. 2007; 282: 11914–11920. [DOI] [PMC free article] [PubMed] [Google Scholar]
- 16. Bouvard D, Pouwels J, De Franceschi N, Ivaska J. Integrin inactivators: balancing cellular functions in vitro and in vivo. Nat Rev Mol Cell Biol. 2013; 14: 430–442. [DOI] [PubMed] [Google Scholar]
- 17. del Pozo MA, Balasubramanian N, Alderson NB, et al.. Phospho-caveolin-1 mediates integrin-regulated membrane domain internalization. Nat Cell Biol. 2005; 7: 901–908. [DOI] [PMC free article] [PubMed] [Google Scholar]
- 18. Tzima E, Angel del Pozo M, Shattil SJ, Chien S, Schwartz MA. Activation of integrins in endothelial cells by fluid shear stress mediates Rho-dependent cytoskeletal alignment. EMBO J. 2001; 20: 4639–4647. [DOI] [PMC free article] [PubMed] [Google Scholar]
- 19. Sun X, Fu Y, Gu M, Zhu Y. Activation of integrin α5 mediated by flow requires its translocation to membrane lipid rafts in vascular endothelial cells. Proc Natl Acad Sci USA. 2016; 113: 769–774. [DOI] [PMC free article] [PubMed] [Google Scholar]
- 20. Moore SW, Roca-Cusachs P, Sheetz MP. Stretchy proteins on stretchy substrates: the important elements of integrin-mediated rigidity sensing. Dev Cell. 2010; 19: 194–206. [DOI] [PMC free article] [PubMed] [Google Scholar]
- 21. Faralli JA, Filla MS, Peters DM. Role of integrins in the development of fibrosis in the trabecular meshwork. Front Ophthalmol. 2023; 3: 1274797. [DOI] [PMC free article] [PubMed] [Google Scholar]
- 22. Filla M, Woods A, Kaufman PL, Peters DM. β1 and β3 integrins cooperate to induce syndecan-4-containing cross-linked actin networks in human trabecular meshwork cells. Invest Ophthalmol Vis Sci. 2006; 47: 1956–1967. [DOI] [PMC free article] [PubMed] [Google Scholar]
- 23. Filla M, Faralli JA, Desikan H, Peotter JL, Wannow AC, Peters DM. Activation of αvβ3 integrin alters fibronectin fibril formation in human trabecular meshwork cells in a ROCK-independent manner Invest Ophthalmol Vis Sci. 2019; 60: 3897–3913. [DOI] [PMC free article] [PubMed] [Google Scholar]
- 24. Filla MS, Meyers KA, Faralli JA, Peters DM. Overexpression and activation of αvβ3 integrin differentially affects TGFβ2 signaling in human trabecular meshwork cells. Cells. 2021; 10: 1923. [DOI] [PMC free article] [PubMed] [Google Scholar]
- 25. Clark AF, Miggans ST, Wilson K, Browder S, McCartney MD. Cytoskeletal changes in cultured human glaucoma trabecular meshwork cells. J Glauc. 1995; 4: 183–188. [PubMed] [Google Scholar]
- 26. Fuchshofer R, Tamm ER. The role of TGF−β in the pathogenesis of primary open-angle glaucoma. Cell Tissue Res. 2012; 347: 279–290. [DOI] [PubMed] [Google Scholar]
- 27. Mavlyutov TA, Myrah JJ, Chauhan AK, Liu Y, McDowell CM. Fibronectin extra domain A (FN-EDA) causes glaucomatous trabecular meshwork, retina, and optic nerve damage in mice. Cell Biosci. 2022; 12: 72. [DOI] [PMC free article] [PubMed] [Google Scholar]
- 28. Pattabiraman P, Rao P. Hic-5 regulates actin cytoskeletal reorganization and expression of fibrogenic markers and myocilin in trabecular meshwork cells. Invest Ophthamol Vis Sci. 2015; 56: 5656–5669. [DOI] [PMC free article] [PubMed] [Google Scholar]
- 29. Gu X, Chen X, Zhang X, et al.. Macrophage-induced integrin signaling promotes Schlemm's canal formation to prevent intraocular hypertension and glaucomatous optic neuropathy. Cell Rep. 2024; 43: 113799. [DOI] [PubMed] [Google Scholar]
- 30. Kingston R, Amin D, Misra S, Gross JM, Kuwajima T. Serotonin transporter-mediated molecular axis regulates regional retinal ganglion cell vulnerability and axon regeneration after nerve injury. PLoS Genet. 2021; 17: 1009885. [DOI] [PMC free article] [PubMed] [Google Scholar]
- 31. Polansky JR, Weinreb RN, Baxter JD, Alvarado J. Human trabecular cells. I. Establishment in tissue culture and growth characteristics. Invest Ophthalmol Vis Sci. 1979; 18: 1043–1049. [PubMed] [Google Scholar]
- 32. Keller KE, Bhattacharya SK, Borrás T, et al.. Consensus recommendations for trabecular meshwork cell isolation, characterization and culture. Exp Eye Res. 2018; 171: 164–173. [DOI] [PMC free article] [PubMed] [Google Scholar]
- 33. Faralli JA, Gagen D, Filla MS, Crotti TN, Peters DM. Dexamethasone increases αvβ3 integrin expression and affinity through a calcineurin/NFAT pathway. BBA- Mol Cell Res. 2013; 1833: 3306–3313. [DOI] [PMC free article] [PubMed] [Google Scholar]
- 34. Filla M, David G, Weinreb RN, Kaufman PL, Peters DM. Distribution of syndecans 1-4 within the anterior segment of the human eye: expression of a variant syndecan-3 and matrix-associated syndecan-2. Exp Eye Res. 2004; 79: 61–74. [DOI] [PubMed] [Google Scholar]
- 35. Filla MS, Dimeo KD, Tong T, Peters DM. Disruption of fibronectin matrix affects type IV collagen, fibrillin and laminin deposition into extracellular matrix of human trabecular meshwork (HTM) cells. Exp Eye Res. 2017; 165: 7–19. [DOI] [PMC free article] [PubMed] [Google Scholar]
- 36. Tektas OY, Lutjen-Drecoll E. Structural changes of the trabecular meshwork in different kinds of glaucoma. Exp Eye Res. 2009; 88: 769–775. [DOI] [PubMed] [Google Scholar]
- 37. Lawson C, Schlaepfer DD. Integrin adhesions. Who's on first? What's on second? Cell Adh Migr. 2012; 6: 302–306. [DOI] [PMC free article] [PubMed] [Google Scholar]
- 38. Cooke ME, Sakai T, Mosher DF. Contraction of collagen matrices mediated by α2β1A and αvβ3. J Cell Sci. 2000; 113: 2375–2383. [DOI] [PubMed] [Google Scholar]
- 39. Du X, Gu M, Weisel JW, et al.. Long range propagation of conformational changes in integrin alpha IIb beta 3. J Biol Chem. 1993; 268: 23087–23092. [PubMed] [Google Scholar]
- 40. Hinz B. The myofibroblast: paradigm for a mechanically active cell. J Biomech. 2010; 43: 146–155. [DOI] [PubMed] [Google Scholar]
- 41. Singh P, Carraher C, Schwarzbauer JE. Assembly of fibronectin extracellular matrix. Annu Rev Cell Dev Biol. 2010; 26: 397–419. [DOI] [PMC free article] [PubMed] [Google Scholar]
- 42. Hinz B, McCulloch CA, Coelho NM. Mechanical regulation of myofibroblast phenoconversion and collagen contraction. Exp Cell Res. 2019; 379: 119–128. [DOI] [PubMed] [Google Scholar]
- 43. Yang Y-F, Sun YY, Peters DM, Keller KE. The effects of mechanical stretch on integrins and filopodial-associated proteins in normal and glaucomatous trabecular meshwork cells. Front Cell Dev Biol. 2022; 10: 886706. [DOI] [PMC free article] [PubMed] [Google Scholar]
- 44. Proulx S, Guérin SL, Salesse C. Effect of quiescence on integrin α5β1 expression in human retinal pigment epithelium. Mol Vis. 2003; 9: 473–481. [PubMed] [Google Scholar]
- 45. Gingras M-E, Larouche K, Larouche N, Leclerc S, Salesse C, Guerin SL. Regulation of the integrin subunit alpha5 gene promoter by the transcription factors Sp1/Sp3 is influenced by the cell density in rabbit corneal epithelial cells. Invest Ophthalmol Vis Sci. 2003; 44: 3742–3755. [DOI] [PubMed] [Google Scholar]
- 46. Gingras M-E, Masson-Gadais B, Zaniolo K, et al.. Differential binding of the transcription factors Sp1, AP-1, and NFI to the promoter of the human alpha5 integrin gene dictates its transcriptional activity. Invest Ophthalmol Vis Sci. 2009; 50: 57–67. [DOI] [PubMed] [Google Scholar]
- 47. Roy AK, Oh T, Rivera O, Mubiru J, Song CS, Chatterjee B. Impacts of transcriptional regulation on aging and senescence. Aging Res Rev. 2002; 1: 367–380. [DOI] [PubMed] [Google Scholar]
- 48. Fischer F, Grigolon G, Benner C, Ristow M. Evolutionarily conserved transcription factors as regulators of longevity and targets for geroprotection. Physiol Rev. 2022; 102: 1449–1494. [DOI] [PubMed] [Google Scholar]
- 49. Campbell ID, Humphries MJ. Integrin structure, activation and interactions. Cold Spring Harb Perpsect Biol. 2011; 3. [DOI] [PMC free article] [PubMed] [Google Scholar]
- 50. Ross TD, Coon BG, Yun S, et al.. Integrins in mechanotransduction. Curr Opin Cell Biol. 2013; 25: 613–618. [DOI] [PMC free article] [PubMed] [Google Scholar]
- 51. Li J, Su Y, Xia W, et al.. Conformational equilibria and intrinsic affinities define integrin activation. EMBO J. 2017; 36: 629–645. [DOI] [PMC free article] [PubMed] [Google Scholar]
- 52. Sun Z, Guo SS, Fassler R. Integrin-mediated mechanotransduction. J Cell Biol. 2016; 215: 445–456. [DOI] [PMC free article] [PubMed] [Google Scholar]
- 53. Gonzalez AM, Bhattacharya R, deHart GW, Jones JC. Transdominant regulation of integrin function: mechanisms of crosstalk. Cell Signal. 2010; 22: 578–583. [DOI] [PMC free article] [PubMed] [Google Scholar]
- 54. Blystone SD, Graham IL, Lindberg FP, Brown EJ. Integrin alpha v beta 3 differentially regulates adhesive and phagocytic functions of the fibronectin receptor alpha 5 beta 1. J Cell Biol. 1994; 127: 1129–1137. [DOI] [PMC free article] [PubMed] [Google Scholar]
- 55. Retta SF, Cassara G, D'Amato M, et al.. Cross talk betweem β1 and αv integrins: β1 affects β3 mRNA stability. Mol Biol Cell. 2001; 12: 3126–3138. [DOI] [PMC free article] [PubMed] [Google Scholar]
- 56. Samarzija I, Dekanic A, Humphries JD, et al.. Integrin Crosstalk Contributes to the Complexity of Signalling and Unpredictable Cancer Cell Fates. Cancers. 2020; 12: 1910. [DOI] [PMC free article] [PubMed] [Google Scholar]
- 57. Truong HH, Xiong J, Ghotra VPS, et al.. β1 integrin inhibition elicits a prometastatic switch through the TGFβ-miR-200-ZEB network in E-cadherin-positive triple-negative breast cancer. Sci Signal. 2014; 7: ra15. [DOI] [PubMed] [Google Scholar]
- 58. Hennig R, Kuespert S, Haunberger A, Goepferich A, Fuchshofer R. Cyclic RGD peptides target human trabecular meshwork cells while ameliorating connective tissue growth factor-induced fibrosis. J Drug Target. 2016; 24: 952–959. [DOI] [PubMed] [Google Scholar]
- 59. Junglas B, Kuespert S, Seleem AA, et al.. Connective tissue growth factor causes glaucoma by modifying the actin cytoskeleton of the trabecular meshwork. Am J Pathol. 2012; 180: 2386–2403. [DOI] [PubMed] [Google Scholar]
- 60. Rapisarda V, Borghesan M, Miguela V, et al.. Integrin beta-3 regulates cellular senescence by activating the TGF-β pathway. Cell Reports. 2017; 18: 2480–2493. [DOI] [PMC free article] [PubMed] [Google Scholar]
- 61. Liton PB, Challa P, Stinnett S, Luna C, Epstein DL, Gonzalez P. Cellular senescence in the glaucomatous pathway. Exp Gerontol. 2005; 40: 745–748. [DOI] [PMC free article] [PubMed] [Google Scholar]
- 62. Wang D, Birkenmeier TM, Yang J, et al.. Release from quiescence stimulates the expression of integrin α5β1, which regulates DNA synthesis in human fibrosarcoma HT1080 cells. J Cell Physiol. 1995; 164: 499–508. [DOI] [PubMed] [Google Scholar]
- 63. Brem RB, Robbins SG, Wilson DJ, et al.. Immunolocalization of integrins in the human retina. Invest Ophthalmol Vis Sci. 1994; 35: 3466–3474. [PubMed] [Google Scholar]
- 64. Bordeleau F, Califano JP, Negron Abril YL, et al.. Tissue stiffness regulates serine/arginine-rich protein-mediated splicing of the extra domain B-fibronectin isoform in tumors. Proc Natl Acad Sci USA. 2015; 112: 8314–8319. [DOI] [PMC free article] [PubMed] [Google Scholar]
- 65. Adair BD, Xiong JP, Maddock C, Goodman SL, Arnaout MA, Yeager M. Three-dimensional EM structure of the ectodomain of integrin αVβ3 in a complex with fibronectin. J Cell Biol. 2005; 168: 1109–1118. [DOI] [PMC free article] [PubMed] [Google Scholar]
- 66. Guiffrida E, Platania CBM, Lazzara F, et al.. The identification of new pharmacological targets for the treatment of glaucoma: a network pharmacology approach. Pharmaceuticals (Basel). 2024; 12: 1333. [DOI] [PMC free article] [PubMed] [Google Scholar]
- 67. Stein JD, Kim DS, Niziol LM, et al.. Differences in rates of glaucoma among asian Americans and other racial groups, and among various asian ethnic groups. Opthalmology. 2011; 118: 1031–1037. [DOI] [PMC free article] [PubMed] [Google Scholar]
- 68. Verma SS, Gudiseva HV, Chavali VRM, et al.. A multi-cohort genome-wide association study in African ancestry individuals reveals risk loci for primary open-angle glaucoma. Cell. 2024; 187: 464–480. [DOI] [PMC free article] [PubMed] [Google Scholar]
- 69. Li CF, Ross FP, Cao X, Teitelbaum SL. Estrogen enhances alpha v beta 3 integrin expression by avian osteoclast precursors via stabilization of beta 3 integrin mRNA. Mol Endocrinol. 1995; 9: 805–813. [DOI] [PubMed] [Google Scholar]
- 70. Geoghegan IP, Hoey DA, McNamar LM. Estrogen deficiency impairs integrin αvβ3-mediated mechanosensation by osteocytes and alters osteoclastogenic paracrine signalling. Sci Rep. 2019; 9: 4654. [DOI] [PMC free article] [PubMed] [Google Scholar]
Associated Data
This section collects any data citations, data availability statements, or supplementary materials included in this article.