

Abstract
Bipolar disorder (BD) is a leading contributor to the global burden of disease1. Despite high heritability (60–80%), the majority of the underlying genetic determinants remain unknown2. We analysed data from participants of European, East Asian, African American and Latino ancestries (n=158,036 BD cases, 2.8 million controls), combining Clinical, Community, and Self-reported samples. We identified 298 genome-wide significant loci in the multi-ancestry meta-analysis, a 4-fold increase over previous findings3, and identified an ancestry-specific association in the East Asian cohort. Integrating results from fine-mapping and other variant-to-gene mapping approaches identified 36 credible genes in the aetiology of BD. Genes prioritised through fine-mapping were enriched for ultra-rare damaging missense and protein-truncating variations in BD cases4, highlighting convergence of common and rare variant signals. We report differences in genetic architecture of BD depending on the source of patient ascertainment and on BD-subtype (BDI and BDII). Several analyses implicate specific cell types in BD pathophysiology, including GABAergic interneurons and medium spiny neurons. Together, these analyses provide additional insights into the genetic architecture and biological underpinnings of BD.
Main
Bipolar disorder (BD) is an often lifelong mood disorder that impairs quality of life, functional ability, and is associated with suicidality.5 Symptoms typically occur in early adulthood,5 with a similar prevalence and incidence rate across the world.6 Current treatment options include pharmacotherapies such as mood stabilisers, antipsychotics and antidepressants, preferably administered in conjunction with psychosocial interventions.1,5 However, approximately one third of patients relapse within the first year of treatment.7
The heterogeneous nature of the disorder is noted in the Diagnostic and Statistical Manual of Mental Disorders, fifth edition (DSM-5), which includes the category “bipolar and related disorders,” encompassing bipolar disorder type I (BDI), bipolar disorder type II (BDII) and cyclothymic disorders.8 The International Classification of Diseases, 11th Revision (ICD-11) also recognises BDI and BDII as distinct subtypes.9 BDI is characterised by episodes of both mania and depression, while BDII includes episodes of hypomania and depression. Advances in genetics and neuroimaging have begun to make inroads into the underlying pathophysiology of BD. The Psychiatric Genomics Consortium (PGC) Bipolar Disorder Working Group has spearheaded genetic discoveries in BD.10,11 A genome-wide association study (GWAS) of 41,917 BD cases and 371,549 controls identified 64 loci and highlighted calcium channel antagonists as potential targets for drug repurposing.3 Brain imaging studies have shown decreased cortical thickness, lower subcortical volume and disrupted white matter integrity associated with BD, as well as brain alterations associated with medication use.12 To date, this research has been conducted almost exclusively on individuals of European (EUR) ancestry.
Here, we present the largest to date multi-ancestry GWAS meta-analysis of 158,036 BD cases and 2,796,499 controls, combining Clinical, Community, and Self-reported samples. We identified 337 linkage disequilibrium (LD) independent genome-wide significant variants that map to 298 loci. We hypothesised that differences in source of patient ascertainment, BD subtype, and genetic ancestry might lead to differences in genetic architecture, thus we also analysed these groups separately. We provide new insights into the genetic architecture and neurobiological mechanisms involved in BD, with the potential to inform the development of new treatments and precision medicine approaches.
Study population
The current GWAS meta-analysis includes 79 cohorts. Case definitions were based on a range of assessment methods: (semi-)structured clinical interviews (Clinical), medical records, registries and questionnaire data (Community), and self-reported surveys (Self-reported). Details of the cohorts, including sample size, ancestry, and inclusion/exclusion criteria for cases and controls, are provided in Supplementary Tables 1 and 2 and the Supplementary Note. BD subtype data were available for a subset of individuals within the Clinical and Community groups. 82.5% of cases in the Clinical ascertainment group had BDI as did 68.7% of cases in the Community ascertainment group (X2=730, p < 2.2 × 10⁻¹⁶; Supplementary Table 2). The total number of samples available for analyses included 158,036 BD cases and 2,796,499 controls (effective n (Neff) = 535,720; see Methods).
Genetic architecture of BD
Given our hypothesis that samples ascertained and assessed by different methods could lead to differences in the genetic architecture, we performed meta-analyses separately for Clinical, Community and Self-reported samples. Using LDSC13 and assuming a population prevalence of 2%,14 BD ascertained from Clinical samples was more heritable (h2SNP = 0.22; s.e. = 0.01) than BD ascertained from Community samples (h2SNP = 0.05; s.e. = 0.003) or Self-report (h2SNP = 0.08; s.e. = 0.003) (Supplementary Table 3). We used genetic correlation13 and MiXeR15,16 analyses to further investigate the genetic architecture of BD based on assessment. While there was a strong genetic correlation between Clinical and Community samples (rg = 0.95; s.e. = 0.03), the genetic correlation for Self-reported BD was significantly greater (p = 7.4 × 10⁻²⁸) with Community samples (rg = 0.79; s.e. = 0.02) than with Clinical samples (rg = 0.47; s.e. = 0.02) (Extended Figure 1).
MiXeR estimated the greatest polygenicity for BD ascertained from Self-reported samples, followed by Clinical and then Community samples (Figure 1, Supplementary Table 4). BD in Clinical samples is estimated to be the most discoverable, while Self-reported BD had the lowest discoverability (Extended Figure 2, Supplementary Table 4). Almost all variants estimated to influence BD in Community samples were shared with BD ascertained from Clinical samples. The majority of Clinical and Community BD-influencing variants were also shared with Self-reported BD (Figure 1, Extended Figure 3). The mean correlation of variant effects in the shared components was high across all groups (Community and Self-reported rg_shared = 0.95 (s.e. = 0.03), Community and Clinical rg_shared = 0.99 (s.e. = 0.01) and Clinical and Self-reported rg_shared = 0.74 (s.e. = 0.06) (Supplementary Table 4).
Figure 1.

Genetic correlation and bivariate MiXeR estimates for the genetic overlap of BD ascertainment and subtypes. Trait-influencing genetic variants shared between each pair (grey) and unique to each trait (colours) are shown. The numbers within the Venn diagrams indicate the estimated number of trait-influencing variants (and standard errors) (in thousands) that explain 90% of SNP heritability in each phenotype. The size of the circles reflects the polygenicity of each trait, with larger circles corresponding to greater polygenicity. The estimated genetic correlation (rg) and standard error between BD and each trait of interest from LDSC is shown below the corresponding Venn diagram. Clinical and Community samples were stratified into bipolar I disorder (BDI) and bipolar II disorder (BDII) subtypes if subtype data were available. Model fit statistics indicated that MiXeR-modelled overlap for bivariate comparisons including the bipolar subtypes (BDI and BDII) were not distinguishable from minimal or maximal possible overlap, and therefore to be interpreted with caution (see Supplementary Table 4).
To analyse BD subtypes, we used available GWAS summary statistics for BDI (25,060 cases) and BDII (6,781 cases)3, which come from a subset of the Clinical and Community samples. Assuming a population prevalence of 1%,17 BDI was more heritable (h2SNP = 0.21; s.e. = 0.01) than BDII (h2SNP = 0.11; s.e. = 0.01). BDI and BDII were highly, but imperfectly, correlated (rg = 0.88; s.e. = 0.05). The genetic correlations between both subtypes and the Community samples were high (BDI rg = 0.85; s.e. = 0.03, BDII rg = 0.95; s.e. = 0.06). In contrast, the genetic correlation between BDI and Self-reported BD (rg = 0.42; s.e. = 0.02) was significantly lower (p = 7.1 × 10⁻¹³) than between BDII and Self-reported BD (rg = 0.76; s.e. = 0.05) (Extended Figure 1).
Given the difference in proportion of BDI and BDII cases within the Clinical and Community cohorts, we evaluated the genetic correlation between BD within Clinical and Community cohorts, and Self-reported BD, after conditioning on the genetic risk for BDI and BDII. After conditioning, the genetic correlation between Self-reported BD and BD within Community cohorts (rg = 0.92; s.e. = 0.09) = was not significantly different (p = 0.10) than with BD in Clinical cohorts (rg = 0.71; s.e. = 0.13).
We show that genetic architecture is different across ascertainment and subtypes, and that these differences appear to be driven by the proportion of BD subtype within the sample. Despite these observed differences, the high correlations of variant effects in the shared components across ascertainment groups supports our decision to meta-analyse all BD cases.
Ancestry-specific GWAS meta-analyses
We conducted separate meta-analyses in four ancestral groups. Because the self-reported data differed in genetic architecture from the clinical and community data, we performed separate meta-analyses with and without the inclusion of the self-reported data. Supplementary Table 2 provides a summary of the GWAS meta-analyses and details of associated loci are described in Supplementary Tables 5–7. Ancestry-specific estimates of SNP-heritability and cross-ancestry genetic correlations are provided in Supplementary Table 3.
We identified 261 independent genome-wide significant variants mapping to 221 loci associated with BD in EUR ancestry meta-analyses that included self-reported data, and 94 independent genome-wide significant variants mapping to 88 loci without self-reported data (Supplementary Tables 5 and 6). There were 92 of the 94 independent genome-wide significant variants available for meta-analysis in the Self-reported cohorts, of which 78 (85%) were concordant for direction of effect (Supplementary Table 6).
In the East Asian (EAS) ancestry meta-analysis we identified two BD-associated loci, one of which is novel with an ancestry-specific index variant (rs117130410, 4:105734758, build GRCh37; Extended Figure 4, Supplementary Table 7). While this variant had a frequency of 16% and 9% in EAS BD cases and controls, respectively, it is monomorphic in non-Asian populations. The second locus (rs174576, 11:61603510, build GRCh37; Supplementary Table 7) was only identified when the self-reported data were excluded from the meta-analysis since the index variant was not available in the self-reported data. This locus has been identified previously and implicates the FADS1 and FADS2 genes.3,18 No genome-wide significant loci were observed in the African American (AFR) or Latino (LAT) ancestry meta-analyses.
Multi-ancestry meta-analysis
A multi-ancestry meta-analysis of all the datasets identified 337 LD independent genome-wide significant variants mapping to 298 loci (Extended Figure 4, Supplementary Table 8). There was minimal test statistic inflation due to uncontrolled population stratification after correction for principal components in each dataset (LDSC intercept = 1.052 (s.e. = 0.016), attenuation ratio=0.071 (s.e. = 0.013)).
Of the 298 loci identified in this multi-ancestry meta-analysis, 267 are novel for BD. Of the 64 previously reported BD-associated loci,3 31 met genome-wide significant in the present analysis containing all samples, and of the 33 that did not, 25 met genome-wide significant in either the Clinical samples or in the meta-analysis that excluded Self-reported data (Supplementary Table 9). Moreover, the direction of association for all top SNPs (12,151 SNPs with p < 1 × 10⁻⁵) from the previous GWAS was consistent with the direction of association in this multi-ancestry meta-analysis of all samples (Supplementary Table 9).
When considering the impact of ancestry on the discovery of these 298 loci, one locus (index SNP rs7248481, chr19:13079957–13122567) was most strongly associated in the EAS ancestry meta-analysis. For all other loci, the association was strongest in the EUR ancestry meta-analysis. The majority of the 298 loci were nominally significant (p < 0.05) within the AFR (290/298 loci), EAS (257/298 loci) and LAT (293/298 loci) ancestry-specific meta-analyses, highlighting consistency of signal across the ancestry groups (Supplementary Table 8).
We estimated the proportion of SNP-heritability (SNP-h2) accounted for by SNPs within genome-wide significant loci.19 Compared to only 8.3% accounted for by SNPs within the 64 previously identified loci,3 SNPs within the 298 loci account for 18.5% of the SNP-h2 of BD (Supplementary Table 10). Moreover, SNPs within the 298 loci also accounted for higher proportions of SNP-h2 in the Clinical (64 loci: 8.5%; 298 loci: 17.8%), BDI (64 loci: 8.3%; 298 loci: 17.5%), Community (64 loci: 4.8%; 298 loci: 22.6%), and Self-reported (64 loci: 2.0%; 298 loci: 21.1%) samples.
We carried out sensitivity meta-analyses excluding the Self-reported samples (leaving 67,948 cases and 867,710 controls; Neff = 191,722) and identified 116 independent genome-wide significant variants mapping to 105 loci (Supplementary Table 11). There was minimal test statistic inflation due to uncontrolled population stratification after correction for principal components in each dataset (LDSC intercept = 1.050; s.e. = 0.012, attenuation ratio=0.086; s.e. = 0.018). Analysis of Self-report cohorts only (90,088 cases and 1,928,789 controls; Neff = 344,088) identified 126 loci (Supplementary Table 12). Of the 116 independent genome-wide significant variants identified in the meta-analysis excluding the Self-report samples, 110 were available for meta-analysis in the Self-report samples, of which 96 (87%) were concordant (Supplementary Table 11).
Our multi-ancestry meta-analysis identified 298 loci implicating 337 LD independent genome-wide significant variants.
Genetic correlations with other traits
Genome-wide genetic correlations (rg) were estimated between EUR ancestry BD GWASs (with and without self-reported data, and when stratified by ascertainment and subtypes) and human diseases and traits via the Complex Traits Genetics Virtual Lab (CTG-VL; https://vl.genoma.io) web platform20 (Figure 2, Supplementary Tables 13–15). Most psychiatric disorders, including major depressive disorder (MDD), post-traumatic stress disorder (PTSD), attention deficit/hyperactivity disorder (ADHD), borderline personality disorder, and autism spectrum disorder (ASD), were more strongly correlated with the full meta-analysis, BDII, and BD in Community and Self-reported samples, than with BDI and BD in clinical cohorts (Figure 2). In contrast, schizophrenia was more strongly genetically correlated with the full BD meta-analysis excluding self-reported data and with BDI and BD in clinical samples (Figure 2). This pattern of correlations, together with the observed patterns of genetic architecture, suggest that the Self-reported samples include a high proportion of people with BDII.
Figure 2.

Genetic correlations (with standard errors) between bipolar disorder and other psychiatric disorders. The y-axis (Trait2) is ordered based on the significance and magnitude of genetic correlation of each trait with bipolar disorder type I. P-values were calculated from the two-sided z statistics computed by dividing the estimated genetic correlation by the estimated standard error, without adjustment. The standard error for a genetic correlation was estimated using a ratio block jackknife over 200 blocks. Triangles indicate significant results passing the Bonferroni corrected significance threshold of two-sided P < 3.6 × 10⁻⁵. Each error bar represents the standard error of the estimate. ADHD, attention deficit/hyperactivity disorder. PTSD, post-traumatic stress disorder. The year indicated in parentheses after each trait refers to the year in which the GWAS was published. Details are provided in Supplementary Table 13.
Polygenic association with BD
Polygenic risk score (PRS) analyses were performed using PRS-CS-auto21 in 55 EUR ancestry cohorts for which individual-level genotype and phenotype data were available (40,992 cases and 80,215 controls), as well as one cohort of AFR ancestry (347 cases and 669 controls) and three cohorts of EAS ancestry (4,473 cases and 65,923 controls) (Supplementary Tables 16–20). In the EUR ancestry cohorts, the variance explained by the multi-ancestry GWAS without the self-reported data (R2 = 0.090, s.e. = 0.019) was significantly greater than that explained by both the multi-ancestry GWAS including self-report data (R2 = 0.058, s.e. = 0.017, P = 2.72 × 10⁻⁴), and by the the EUR ancestry GWAS excluding the self-reported data (R2 = 0.084, s.e. = 0.018, P = 5.62 × 10⁻³) (Figure 3A, Supplementary Tables 16 and 21). Individuals in the top quintile (top 20%) for this multi-ancestry GWAS without the self-reported data PRS had an odds ratio of 7.06 (95% confidence interval (CI) 3.9–10.4) of being affected with BD compared to individuals in the middle quintile. The corresponding median Area Under the Receiver Operating Characteristic Curve (AUC) was 0.70 (95% CI= 0.67–0.73). Therefore, the BD liability explained remains insufficient for diagnostic prediction in the general population.
Figure 3.

Phenotypic variance in bipolar disorder in European cohorts explained by polygenic risk scores derived from the multi-ancestry and European meta-analyses (with and without self-reported data).
Variance explained is presented on the liability scale, assuming a 2% population prevalence of bipolar disorder. The results in the first panel (A) are the median weighted liability R2 values across all 55 European cohorts (40,992 cases, 80,215 controls, Neff = 46,725). Similarly, the remaining panels show the results across (B) 36 bipolar disorder I (BDI) cohorts (12,419 cases and 33,148 controls, Neff = 14,607), (C) 21 bipolar disorder II (BDII cohorts, 2,549 cases, 23,385 controls, Neff = 4,021), (D) 48 Clinical cohorts (27,833 cases, 46,623 controls, Neff = 29,543), and (E) 7 Community cohorts (13,159 cases, 36,592 controls, Neff = 17,178). All analyses were weighted by the effective n per cohort. The median liability R2 is represented as a horizontal black line.
Similarly, PRS derived from GWAS excluding self-reported data explained significantly more variance in cases of BDI (Figure 3B, Supplementary Tables 17) and in Clinical cohorts (Figure 3D, Supplementary Tables 19) than when self-reported data were included. Conversely, inclusion of the self-reported data yielded greater median R2 estimates for the PRS in cases of BDII (Figure 3C, Supplementary Tables 18) and in Community cohorts (Figure 3E, Supplementary Tables 20), although these differences were not significant. These results are likely due to increased phenotypic heterogeneity when the self-reported data are included in the PRS discovery sample (see Figure 2).
PRS analysis of three clinically ascertained EAS cohorts revealed that the PRSs derived from GWAS excluding the self-reported data (Taiwan; EUR-PRS R2 = 0.069, Multi-PRS R2 = 0.075. Japan; EUR-PRS R2 = 0.027, Multi-PRS R2 = 0.025. Korea; EUR-PRS R2 = 0.016, Multi-PRS R2 = 0.022) performed better than those that included self-reported data (Taiwan; EUR-PRS R2 = 0.026, Multi-PRS R2 = 0.036. Japan; EUR-PRS R2 = 0.015, Multi-PRS R2 = 0.015. Korea; EUR-PRS R2 = 0.014, Multi-PRS R2 = 0.017) (Supplementary Table 22).
In a clinically ascertained AFR target cohort, the inclusion of self-reported data increased the explained variance (R2) by both the multi-ancestry PRS and the EUR ancestry PRS from 0.010 to 0.23 or 0.22, respectively (Supplementary Table 22).
Pathway, tissue and cell type enrichment
Gene-set enrichment analyses were performed on the summary statistics derived from the multi-ancestry meta-analysis including self-reported data, using MAGMA.22 We identified significant enrichment of 6 gene-sets (Supplementary Table 23) related to the synapse and transcription factor activity. The association signal was enriched among genes expressed in the brain (Supplementary Table 24), and specifically in the early- to mid-prenatal stages of development (Supplementary Table 25). Single-cell enrichment analyses of brain cell types indicate involvement of neuronal populations from different brain regions, including hippocampal pyramidal neurons and interneurons of the prefrontal cortex and hippocampus (Supplementary Figure 1), and were largely consistent with findings from the previous PGC BD GWAS3. Similar patterns of enrichment were observed based on ascertainment and subtype (Supplementary Figure 2). In addition, GSA-MiXeR19 highlighted enrichment of specific dopamine- and calcium-related biological processes and molecular functions, as well as GABAergic interneuron development, respectively (Supplementary Table 26).
A recent study23 analysed single-nucleus RNA sequencing (snRNAseq) data of 3.369 million nuclei from 106 anatomical dissections within 10 brain regions and divided cells into 31 superclusters and 461 clusters, respectively, based on principal component analysis of sequenced genes. These superclusters were then annotated based on their regional composition within the brain (Figure 4). We used stratified LD score regression (S-LDSC)24 to estimate SNP-heritability enrichment for the top decile of expression proportion (TDEP) genes in each of the 31 superclusters and 461 clusters, as described previously.25 Heritability was significantly enriched in 9 of the 31 superclusters (Figure 4), and 49 of the 461 clusters (Extended Figure 5). No enrichment was seen in non-neuronal clusters. Interestingly, two clusters within the medium spiny neurons, not observed at the supercluster level, are significantly enriched further supporting the involvement of striatal processes in BD.
Figure 4.

Supercluster-level SNP-heritability enrichment for bipolar disorder. The t-distributed stochastic neighbour embedding (tSNE) plot (from Siletti et al.23) (left) is coloured by the enrichment z-score. Grey indicates non-significantly enriched superclusters (FDR > 0.05). The barplot (right) shows the nine significantly enriched superclusters.
Together these results implicate the synapse, interneurons of the prefrontal cortex and hippocampus, and hippocampal pyramidal neurons as particularly relevant in molecular biology of BD.
Single-cell enrichment analysis in 914 cell types across 29 non-brain murine tissues identified significant enrichment in the enteroendocrine cells of the large intestine and delta cells of the pancreas, which remained significant after cross-dataset conditional analyses with a murine brain tissue dataset (Supplementary Table 27).
Fine-mapping
We performed functional fine-mapping using Polyfun+SuSiE (Supplementary Tables 28 and 29).26 At a threshold of PIP > 0.50, we identified 80 putatively causal fine-mapped SNPs for the multi-ancestry meta-analyses including self-reported data. At the more stringent threshold of PIP > 0.95 we identified 20 putatively causal SNPs. When comparing the number of SNPs within 95% credible sets, the inclusion of multi-ancestry and self-reported data led to smaller credible sets (i.e. credible sets with fewer numbers of SNPs). For example, we identified 175 95% credible sets of < 20 SNPs in the multi-ancestry dataset with self-reported data, compared to 122 in the European dataset with self-reported data (Extended Figure 6). Putatively causal SNPs with a PIP > 0.5 were mapped to genes by performing variant annotation with Variant Effect Predictor (VEP) (GRCh37) Ensembl release 109,27 based on their position relative to annotated Ensembl transcripts and known regulatory features. This analysis identified 71 unique genes annotated to fine-mapped SNPs from the multi-ancestry meta-analysis including self-reported data (Supplementary Table 29).
Common and rare variation convergence
Within loci associated with BD in the multi-ancestry meta-analysis, the 71 genes annotated to putatively causal fine-mapped SNPs (Supplementary Table 29) were enriched for ultra rare (<=5 minor allele count) damaging missense and protein-truncating variants in BD cases in the Bipolar Exome (BipEx) consortium dataset4 (Odds ratio (OR) = 1.16, 95% confidence interval (CI) = 1.05 – 1.28, P = 0.002), and in schizophrenia cases in the Schizophrenia Exome Meta-analysis (SCHEMA) dataset28 (OR = 1.21, 95% CI = 1.02 – 1.43, P = 0.024). This enrichment is similar to that observed for schizophrenia28 and ADHD.29
Credible BD-associated genes
In addition to the 71 genes annotated to the fine-mapped putatively causal SNPs as described above, we annotated a further 45 genes to the 80 fine-mapped SNPs by SMR using eQTL and sQTL data, as well as by proximity, i.e. the nearest gene to each SNP (Extended Figure 7, Supplementary Tables 30 and 31). No genes were annotated to the CpGs identified by the mQTL analysis (Supplementary Table 30). We then determined if any of these 116 genes were also identified through the genome-wide gene-based analysis using MAGMA,22 eQTL analyses using TWAS as implemented in FUSION30 and isoTWAS,31 or through enhancer-promoter (E-P) interactions.32,33 This resulted in seven possible approaches by which loci could be mapped to genes including, eQTL evidence (eQTL or TWAS or FOCUS or isoTWAS), mQTL, sQTL, VEP, proximity, MAGMA and E-P interactions.
We integrated the results from the post-GWAS analyses described above and identified a credible set of 36 genes identified by at least three of the described approaches (Supplementary Table 31). The SP4 gene was identified by six of these approaches, and astrocyte and GABAergic neuron specific regulation of SP4, by the genome-wide significant variant rs2107448, were identified from cell-type specific enhancer-promoter interaction results (Supplementary Table 31). Moreover, the TTC12 and MED24 genes were identified by five of the approaches. Eight of the 36 credible genes have synaptic annotations in the SynGO database.34 Three genes (HTT, ERBB4 and LR5NF) were mapped to both postsynaptic and presynaptic compartments. One gene (CACNA1B) was mapped to only the presynapse and four genes (SHANK2, OLFM1, SHISA9 and SORCS3) were mapped to only the postsynapse (Supplementary Table 32).
Based on the lifespan gene expression data from the Human Brain Transcriptome project (www.hbatlas.org),35 suggestive evidence for two clusters of credible genes was observed based on temporal expression (Extended Figure 8, Supplementary Table 31). The first cluster shows reduced prenatal gene expression, with gene expression peaking at birth and remaining stable over the life-course. Conversely, the second cluster shows a peak in gene expression during fetal development with a drop-off in expression before birth. However, both clusters show high variability in gene expression across the lifespan.
Together, these results implicate 36 credible genes in BD.
Drug target analyses
Gene-set analyses were performed restricted to genes targeted by drugs, assessing individual drugs and grouping drugs with similar actions as described previously.3,36 Gene-level and gene-set analyses of the multi-ancestry GWAS summary statistics including self-report data were performed in MAGMA,22 and identified significant enrichment in the targets of anticonvulsant pregabalin (Supplementary Table 33). There was also significant enrichment in the targets of antipsychotics and anxiolytics (Supplementary Table 34).
Examination of the Drug Gene Interaction Database (DGIdb)37 to identify drug-gene interactions using the credible genes as input genes, showed that 15 out of 36 genes were interacting with a total number of 528 drugs. Gene-set enrichment analysis of these drug-gene interactions showed a significant enrichment (p<0.0001) for targets of the atypical antipsychotic drugs nemonapride and risperidone (Supplementary Table 35). However, after correction for the total number of drugs (N=69,018), the enrichment was non-significant (FDR>0.05). In addition, 16 of the 36 credible genes had evidence of tractability with a small molecule in the OpenTargets dataset, including FURIN, MED24, THRA, ALDH2, ANKK1, ARHGAP15, CACNA1B, ERBB4, ESR1, FES, GPR139, HTT, MLEC, MSH6, PSMD14, and TOMM2.
Among the 36 credible genes, two (ALDH2 and ESR1) were within the list of 139 lithium target and interaction partner genes. The results of the network-based separation (SAB) analysis do not indicate a general overlap between the credible genes and lithium target genes in the human protein interactome (SAB=0.124, z-score=1.710, p-value=0.044). The positive SAB value indicates that the lithium target genes and the 36 credible genes are separated from each other in the network of protein-protein interactions.
Since the credible gene list is primarily derived from our fine-mapping analysis, it is possible that lithium target genes (and interaction partners) are within loci for which significant fine-mapped putatively causal SNPs were not identified. The identification of evidence of tractability with small molecules for some of the credible genes indicates opportunities for novel drug development.
Discussion
We performed the largest GWAS of BD, including diverse samples of EUR, EAS, AFR and LAT ancestry, resulting in an over four-fold increase in the number of BD-associated loci: 337 LD independent genome-wide significant variants mapping to 298 loci. In the meta-analysis of EUR, the largest ancestry group, we identified over 200 genome-wide significant loci. We also found a novel ancestral-specific association in the EAS cohort. We confirmed our hypothesis that differences in ascertainment and BD subtype might lead to differences in genetic architecture. Post-GWAS analyses provide novel insights into the biological underpinnings and genetic architecture of BD and highlight differences depending on ascertainment of participants and BD-subtype. We also showed that multi-ancestry data improved fine-mapping and polygenic prediction.
Enrichment of the common variant associations from this multi-ancestry meta-analysis highlights the synapse, interneurons of the prefrontal cortex and hippocampus, and hippocampal pyramidal neurons as particularly relevant. Exploratory analyses19 suggest enrichment of dopamine- and calcium-related biological processes and development of GABAergic interneurons. These findings were further corroborated by enrichment analyses in single-nucleus RNA-seq data from adult postmortem brain tissue, which highlighted specific clusters of interneurons derived from the caudal and medial ganglionic eminences and medium spiny neurons predominantly localised in the striatum. Medium spiny neurons are not enriched in depression using the same dataset.25 Although interneurons derived from ganglionic eminences were also enriched in schizophrenia, stronger signals were observed for amygdala excitatory and hippocampal neurons.25
A novel finding is that single-cell enrichment analysis of non-brain murine tissues identified significant enrichment in the enteroendocrine cells of the large intestine and delta cells of the pancreas. Conditional analyses suggest that this enrichment is independent of overlapping genes between these cell-types and those expressed in neurons. Stimulation of enteroendocrine cells by short-chain fatty acids (SCFAs) promotes serotonin production in the colon which leads to enhanced levels of serotonin in systemic circulation and in the brain, and is a proposed mechanism by which microbiota influence the gut-brain axis.38,39 Notably, lithium treatment is shown to upregulate SCFA-producing bacteria highlighting a potential mechanism of action.40
We mapped genes to the 80 putatively causal SNPs identified from fine-mapping based on seven complementary approaches and identified a subset of 36 credible genes implicated by at least three of these approaches. The top credible gene, identified by six gene-mapping approaches, was SP4, which has also been implicated in schizophrenia through both rare28 and common variation.41 Moreover, we clustered the credible genes based on similar patterns of temporal variation in expression over the lifespan and found suggestive evidence for two clusters. Although within cluster gene expression was highly variable across the lifespan, the second cluster had a peak in expression during fetal development aligning with the neurodevelopmental hypothesis of mental disorders.42 Genes prioritised through fine-mapping were shown to be enriched for ultra rare damaging missense and protein-truncating variation in the BipEx4 and SCHEMA28 datasets, respectively, highlighting convergence of common and rare variant signals as recently shown in schizophrenia.41
We identified differences in the genetic architecture of BD subtypes related to ascertainment. BD within Clinical and Community samples was highly but imperfectly correlated, with varying correlations with Self-reported BD. The low genetic correlation and minimal genetic overlap between cases ascertained through clinical studies and cases with self-reported BD is driven by a greater proportion of BDI within the Clinical and Community samples. In line with these results, PRS derived from meta-analyses excluding the self-reported data performed better in Clinical and BDI target samples, while the inclusion of self-reported data improved the PRS in Community and BDII target samples. Moreover, the pattern of correlations between BD and other psychiatric disorders differed with the inclusion of self-reported data. Schizophrenia had the highest genetic correlation with BD without the inclusion of the self-reported data, while major depressive disorder was most strongly correlated with BD after the inclusion of the self-reported data. These results suggest that the Self-reported samples may include a high proportion of people with BDII. Moreover, this is in line with recent findings in individuals diagnosed with BDII, which showed increasing polygenic scores for depression and ADHD and decreasing polygenic scores for BD over time.43 However, a diagnosis of BD in the outpatient setting may be overdiagnosed in people with conditions such as chronic depression or borderline personality disorder, highlighting a higher rate of comorbid disorders and potential for ‘overdiagnosis’ of BD within cohorts of this nature.44,45 We showed that the differences in genetic architecture and phenotypic proportions of the Clinical, Community and Self-reported BD cohorts impacted the replication of prior BD-associated loci. Previously associated loci that fell short of meeting genome-wide significance in the current study were genome-wide significant in the Clinical samples and in the meta-analyses that excluded Self-reported data, and all top SNPs (12,151 SNPs with p < 1 × 10⁻⁵) from the previous GWAS were consistent in direction of association in this multi-ancestry meta-analysis of all samples (Supplementary Table 9).
Investigation of the novel ancestral-specific association in the EAS ancestry meta-analysis in the GWAS catalog46 highlights overlaps with genome-wide significant loci for reduced sleep duration,47 and lower educational attainment,48 as well as a suggestive locus (p < 2 × 10⁻⁶ ) for the interaction between cognitive function and MDD.49 These findings suggest a role for this genomic region in complex brain-related phenotypes.
The multi-ancestry PRS provided the greatest improvement over the EUR-PRS in two of the three EAS ancestry target cohorts (Korean and Taiwanese). More subtle improvements were seen when the EUR target cohorts were analysed. Multi-ancestry training data provided little improvement in the AFR target cohort, which may be due to the genetic heterogeneity of this target cohort.50 These results highlight the benefits of multi-ancestry representation in the PRS training data, in line with findings from other diseases.51 The predictive power of this BD PRS shows a substantial improvement compared to previous findings3 however, this BD PRS alone still falls short of clinical utility.52
One limitation is the lack of in-sample LD estimates for all cohorts, due to a lack of in-house raw genotype data for some cohorts. For instance, analysis of the MHC/C4 locus was not considered since the number of samples for which individual-level genotype data were accessible did not increase much since the previous analysis3. We used a EUR LD reference panel to analyse the multi-ancestry meta-analyses53 where LD patterns and interindividual heterogeneity within the ancestry groups are not fully captured. Another limitation is the inclusion of samples with minimal phenotyping. Although this allowed us to achieve large sample sizes, especially in under-represented non-European ancestry cohorts, and greatly increase the number of loci identified, minimally-phenotyped samples have some shortcomings. For example, minimal phenotyping may result in low specificity association signals, as shown in major depression,54,55 and individuals in community-based biobanks may represent those less severely affected, as shown in schizophrenia.56
In conclusion, in this first large-scale multi-ancestry GWAS of BD, we identified 298 significant BD-associated loci, from which we demonstrate convergence of common variant associations with rare variant signals and highlight 36 genes credibly implicated in the pathobiology of the disorder. We identified differences in the genetic architecture of BD based on ascertainment and subtype, suggesting that stratification by subtype will be important in BD genetics moving forward. Several analyses implicate specific cell types in BD pathophysiology, including GABAergic interneurons and medium spiny neurons, as well as the enteroendocrine cells of the large intestine and delta cells of the pancreas. Enrichment of dopamine- and calcium-related biological processes were also identified, further contributing to our understanding of the biological aetiology of BD.
Methods
Sample description
Details of each of the cohorts, including sample size, ancestry, inclusion/exclusion criteria for cases and controls as well as citations, are provided in Supplementary Table 1 and the Supplementary Note. We included three types of samples: 1) samples where participants were assessed using semi-structured or structured interviews (Clinical), 2) samples where participants were assessed using medical records, registries and questionnaire data (Community) and 3) samples where participants self-report a diagnosis of bipolar disorder (Self-report). The Clinical samples included 55 cohorts, 46 of which were included in previous PGC-BD GWAS publications3,10,11. The Community samples included 20 cohorts, 11 of which were included in the previous PGC-BD GWAS3. Finally, we included four Self-report cohorts from 23andMe, Inc, in which individuals were classified as cases if they self-reported having received a clinical diagnosis or treatment for bipolar disorder in responses to web-based surveys (“Have you ever been diagnosed with, or treated for, bipolar disorder?”).
Individual-level genotype and phenotype data were shared with the PGC for 53 ‘internal’ cohorts, while the remaining 26 ‘external’ cohorts contributed summary statistics data.
The final multi-ancestry meta-analysis included up to 158,036 cases and 2,796,499 controls. The total effective n (Neff), equivalent to an equal number of cases and controls in each cohort (4 × ncases × ncontrols/(ncases + ncontrols) is 535,720 with 82.3% of participants (proportion of Neff) of EUR ancestry, 4.4% of AFR ancestry, 4.2% of EAS ancestry and 9.1% of LAT ancestry.
The majority of new cohorts included in this study were external community cohorts where subtype definitions were more difficult to determine, and as such the total number of BDI and BDII subtype cases does not differ remarkably from the previous PGC BD GWAS3 (Supplementary Table 1). Thus, the previous BDI (25,060 cases and 449,978 controls) and BDII (6,781 cases and 364,075 controls) GWAS summary statistics data were used for BDI and BDII analyses in this study.
Genotyping and imputation
Technical quality control was performed separately on each cohort for which individual-level data were provided separately according to standards developed by the PGC57 including; SNP missingness < 0.05 (before sample removal), subject missingness < 0.02, autosomal heterozygosity deviation (Fhet < 0.2), SNP missingness < 0.02 (after sample removal), difference in SNP missingness between cases and controls < 0.02, SNP Hardy–Weinberg equilibrium (P > 1 × 10⁻¹⁰ in BD cases and P > 1 × 10⁻⁶ in controls), and mismatches between pedigree and genetically-determined sex based on the F statistic of X chromosome homozygosity (female F < 0.2 and male F >0.8). In addition, relatedness was calculated across cohorts using identity by descent and one of each pair of related individuals (pi_hat > 0.2) was excluded, prioritising exclusion of individuals related to the most others, controls over cases, and individuals from larger cohorts. Principal components (PCs) were generated using genotyped SNPs in each cohort separately using EIGENSTRAT v6.1.4 (https://www.hsph.harvard.edu/alkes-price/software/).58 Genotype imputation was performed using the prephasing/imputation stepwise approach implemented in Eagle v2.3.5 (https://alkesgroup.broadinstitute.org/Eagle/)59 and Minimac3 (https://genome.sph.umich.edu/wiki/Minimac3)60 to the Haplotype Reference Consortium (HRC) reference panel v1.061. Data on the X chromosome were also available for all 53 internal cohorts and these were imputed to the HRC reference panel in males and females separately. The remaining 22 external cohorts were processed by the contributing collaborative teams using comparable procedures. Identical individuals between PGC processed cohorts and external cohorts with suspected sample overlap were detected using genotype-based checksums (https://personal.broadinstitute.org/sripke/share_links/zpXkV8INxUg9bayDpLToG4g58TMtjN_PGC_SCZ_w3.0718d.76) and removed from the PGC cohorts.
Genome-wide association study (GWAS)
For internal cohorts, GWASs were conducted within each cohort using an additive logistic regression model in PLINK v1.90 (https://www.cog-genomics.org/plink2/),62 covarying for the first five PCs and any others as required, as previously described3. Analyses of the X chromosome were performed in males and females separately, with males scored 0 or 2 and females scored 0, 1 or 2. X chromosome analyses were performed only in individuals of EUR ancestry for which individual level data were available. For external cohorts, GWASs were conducted by the collaborating research teams using comparable procedures. To control test statistic inflation at SNPs with low minor allele frequency (MAF) in small cohorts, SNPs were retained only if cohort MAF was >1% and minor allele count was >10 in either cases or controls (whichever had smaller n).
Initially, meta-analysis of GWAS summary statistics was conducted using inverse-variance-weighted fixed-effects models in METAL (version 2011–03-25) (https://genome.sph.umich.edu/wiki/METAL_Documentation)63 across cohorts within ancestral groups. A genome-wide significant locus was defined as the region around a SNP with P < 5.0 × 10⁻⁸ with linkage disequilibrium (LD) r2 > 0.1, within a 3000 kb window, based on the LD structure of the ancestry matched HRC reference panel v1.061, except LAT (EUR panel used). Multi-ancestry meta-analysis was similarly performed by combining cohorts with diverse ancestry using inverse-variance-weighted fixed-effects models in METAL63. Given that >80% of the included participants were of EUR ancestry, the LD structure of the EUR HRC reference panel was used to define genome-wide significant loci.
For all meta-analyses, SNPs present in <75% of total effective sample size (Neff) were removed from the meta-analysis results. In addition, we employed the DENTIST tool (https://github.com/Yves-CHEN/DENTIST) for summary data-based analyses, which leverages LD from a reference sample (ancestry matched HRC reference panel v1.061, except LAT and multi-ancestry for which the EUR panel was used) to detect and filter out problematic variants by testing the difference between the observed z-score of a variant and a predicted z-score from the neighbouring variants64.
To identify independent association signals (P < 5 × 10⁻⁸), the GCTA forward selection and backward elimination process (command ‘cojo-slct’) was applied using the summary statistics from the EAS, EUR and multi-ancestry meta-analysis (both including and excluding the self-report data), with the EAS and EUR HRC reference panels, respectively65,66.
The genetic correlation between meta-analyses based on all new cohorts (118,284 cases and 2,448,096 controls) and EUR cohorts from our previous PGC BD GWAS3 was rg = 0.64 (se = 0.02), and rg = 0.91 (se = 0.04) when excluding self-reported cohorts. Concordance of the direction of associations in the present GWAS with associations in the previously published BD data were evaluated as described previously.67
Heritability and Genetic Correlation
LDSC (https://github.com/bulik/ldsc)13 was used to estimate the SNP-heritability (h2SNP) of BD from EUR GWAS summary statistics, including all cohorts as well as sub-groups by ascertainment and BD subtype. Popcorn was used to estimate h2SNP of BD from non-EUR GWAS summary statistics.68 h2SNP was converted to the liability scale using a lifetime BD prevalence of 2%. LDSC bivariate genetic correlations (rg) were also estimated between EUR BD GWASs (with and without self-report data) and eleven other psychiatric disorders as well, as 1390 human diseases and traits via the Complex Traits Genetics Virtual Lab (CTG-VL; https://vl.genoma.io) web platform.20 Adjusting for the number of traits tested, the Bonferroni corrected p-value was P < 3.569 × 10⁻⁵. Cross-ancestry bivariate genetic correlations were estimated using Popcorn (https://github.com/brielin/Popcorn).68 Differences in rg between phenotype pairs were tested as a deviation from 0 using the block jackknife approach implemented in LDSC.69
The results of the Clinical and Community cohort meta-analyses were conditioned on genetic risks for BDI and BDII, to account for differences in proportion of the BD subtypes within these cohorts. Conditioning was conducted using multitrait-based conditional and joint analysis using GWAS summary data (mtCOJO) (https://yanglab.westlake.edu.cn/software/gcta/#mtCOJO),70 implemented in GCTA.65 mtCOJO is robust to sample overlap between the GWASs of the exposure and outcome. The conditioned summary statistics were evaluated for genetic correlation with Self-reported BD using LDSC.
MiXeR
We applied causal mixture models (MiXeR) (https://github.com/precimed/mixer)15,16,71 to investigate the genetic architecture of BD, specifically the overlap between Clinical, Community and Self-report samples, as well as BD subtypes. We first computed univariate analyses to estimate the polygenicity, discoverability and heritability of each trait. These were followed by bivariate analyses to compute the number of shared trait-influencing variants between pairs of traits, and finally trivariate analyses to compute the proportion of shared variants between all three traits analysed. We also determined the correlation of effect sizes of SNPs within the bivariate shared components. For trivariate MiXeR analyses, model optimization procedures are repeated 20 times (20 runs) to obtain the means and standard errors of model parameters. Estimated parameters from the ‘run’ with the smallest deviation from the median overlap pattern are then selected and reported.
Polygenic association with bipolar disorder
We used PRS-CS-auto21 to compute polygenic risk scores in target cohorts, using a discovery GWAS where the target cohort was left out. Given that the majority of the individuals included in the meta-analysis were of EUR descent, we used the EUR LD reference panel based on UK BioBank data as provided by PRS-CS developers (https://github.com/getian107/PRScs). Raw scores were standardised to Z scores, and covariates including sex, the first five PCs and any others as required (as above for each cohort GWAS) were included in the logistic regression model, via the glm() function in R73, with family=binomial and link=logit. The variance explained by PRS (R2) was first converted to Nagelkerke’s pseudo-R2 via the fmsb package in R (https://cran.r-project.org/web/packages/fmsb/index.html), then converted to the liability scale to account for proportion of cases in each cohort and the population prevalence of BD.72 We provide R2 values for BD assuming a population prevalence of 2%, based upon a recent multinational survey.14 The weighted average R2 values were then calculated using the Neff for each cohort. PRS-specific-medians and their confidence intervals were computed using nonparametric bootstrap replicates (10,000 resamples with replacement). The odds ratios for BD for individuals in the top quintile of PRS compared with those in the middle quintile were calculated for all cohorts. Similarly, the area under the curve (AUC) statistic was calculated via the pROC package in R (https://cran.r-project.org/web/packages/pROC/index.html), for which we performed a training and testing procedure by taking 80% of the individuals in a given cohort on which to train the model, and tested the predictability in the remaining 20% of individuals. Ten random samplings of training and testing sets were performed in all cohorts, and the median AUC after all permutations is provided Supplementary Tables 16–22. The median confidence intervals for the AUC were similarly averaged across the ten random permutations. These AUC statistics were calculated based on the logistic regression model that includes the standardised PRS as a predictor and PC covariates. In order to assess the gain in AUC due to the PRS itself, we subtracted the median AUC of the model containing only the covariates from the full model, reported in Supplementary Tables 16–22 as AUC.
Gene and gene-set association analysis
Gene-level, gene-set and tissue-set associations were performed using a SNP-wise mean model (±10kb window) implemented in MAGMA (https://ctg.cncr.nl/software/magma)22. Bonferroni correction was used to control for multiple testing. In addition, we performed gene-set analysis with GSA-MiXeR (https://github.com/precimed/gsa-mixer)19, which quantifies partitioned heritability attributed to N=10,475 gene-sets from the GO74 and SynGO34 databases, alongside their fold enrichment with respect to a baseline model. The GSA-MiXeR full model incorporates 18,201 protein-coding genes, using a joint model to estimate heritability attributed to each gene based on GWAS summary statistics and HRC59 reference panel to account for LD between variants. GSA-MiXeR’s baseline model accounts for a set of 75 functional annotations75, as well as accounting for MAF- and LD-dependent genetic architecture. GSA-MiXeR’s heritability model is estimated using Adam (method for stochastic gradient-based optimization of the likelihood function)76. Standard errors of fitted parameters were estimated from the observed Fisher’s information matrix (the negative Hessian matrix of the log-likelihood function).
Identified credible genes were further assessed for enrichment in synaptic processes using the SynGO tool v1.2 (https://www.syngoportal.org/) with default settings 34.
Cell type specific enrichment analyses
Single-cell enrichment analyses of brain cell types were performed according to Mullins et al. (2021). Briefly, from five publicly available single-cell RNA sequencing datasets derived from human 77,78 and murine 79–81 brain tissues, the 10% of genes with highest gene expression specificity per cell type were extracted. After MAGMA22 gene analysis of the multi-ancestry GWAS summary statistics including self-report data using an annotation window of 35 kb upstream and 10 kb downstream of the gene boundaries and the 1000 Genomes phase 3 EUR reference panel, MAGMA gene-set analyses were conducted for all cell types in each dataset, respectively. Within each dataset, FDR-adjusted p-values below 0.05 were considered statistically significant.
In addition, we performed an exploratory single-cell enrichment analysis in 914 cell types across 29 non-brain murine tissues as implemented in FUMA82. Cell types with FDR-adjusted p-values below 0.05 were considered statistically significant. Moreover, to determine that identified enrichment was not due to overlapping genes with neuronal cell-types we performed cross-dataset conditional analyses of significantly enriched cell-types with murine brain tissue.
Single-nucleus RNA-seq enrichment
We used the Human Brain Atlas single-nucleus RNA-seq (snRNAseq) dataset23 consisting of 3.369 million nuclei sequenced using snRNAseq. The nuclei were from adult postmortem donors, and the dissections focused on 106 anatomical locations within 10 brain regions. Following quality control, the nuclear gene expression patterns allowed the identification of a hierarchy of cell types that were organized into 31 superclusters and 461 clusters. In the current paper we use the same naming system for the cell types and the brain regions as in Siletti et al23. We estimated SNP-heritability enrichment for the top decile of expression proportion (TDEP) genes (~1,300 genes) in each of the 31 superclusters and 461 clusters, respectively, using stratified LD score regression (S-LDSC)24 as described previously.25 We used FDR correction (FDR < 0.05) to account for multiple comparisons.
Fine-mapping
We performed functional fine-mapping of genome-wide significant loci via Polyfun-SuSiE26, using functional annotations of the baseline-LF2.2 UKB model and LD estimates from the Haplotype Reference Consortium (HRC) EUR (N = 21,265) reference panel. The maximum number of causal variants per fine-mapped region was adjusted accordingly based on the results from the conditional analysis. We excluded loci that fall within the MHC locus (6:28000000–34000000, build GRCh37) due to the known complexity of the LD architecture in that region. Genome-wide significant loci ranges with a LD r2 above 0.1 were used as fine-mapping ranges. Putatively causal SNPs (PIP > 0.50 and part of 95% credible set) were mapped to genes by performing variant annotation with Variant Effect Predictor (VEP) (GRCh37) Ensembl release 75 (https://www.ensembl.org/info/docs/tools/vep/index.html)27.
Convergence of common and rare variation
Data from the Bipolar Exome (BipEx) consortium4 (13,933 BD cases and 14,422 controls) were used to assess the convergence of common and rare variant signals, using a similar approach as previously used for schizophrenia41. This dataset includes approximately 8,2 k individuals with BDI and 3,4 k individuals with BDII, while the remainder of the sample lack BD sub-type information. Ultra rare variants (<=5 minor allele count) for damaging missense (missense badness, PolyPhen-2 and regional constraint (MPC) score >3) and protein-truncating variants (including: transcript ablation, splice acceptor variants, splice donor variants, stop gained and frameshift variants) were considered. An enrichment of rare variants in genes prioritised through fine-mapping in cases relative to controls were assessed using a Fisher’s Exact Test. Given the genetic overlap between bipolar disorder and schizophrenia, we repeated the analysis in data from the Schizophrenia Exome Meta-analysis (SCHEMA) cohort (24,248 schizophrenia cases and 97,322 controls)28. Using the same approach as taken in the SCHEMA28 and BipEx4 papers, background genes included all genes surveyed in each sequencing study, respectively. As a sensitivity analysis we further evaluated the enrichment of synonymous variants in the credible genes in BD cases of the BipEx cohort and found no enrichment (odds ratio = 0.96, 95% confidence interval 0.935–0.985).
QTL integrative analysis
We conducted different QTL integration analyses to elucidate molecular mechanisms by which variants associated with BD might be linked to the phenotype. Summary data-based Mendelian randomization (SMR) (v1.3) (https://yanglab.westlake.edu.cn/software/smr/)83 with subsequent heterogeneity in dependent instruments (HEIDI)70 tests were performed for expression quantitative trait loci (eQTLs), splicing quantitative trait loci (sQTLs), and methylation quantitative trait loci (mQTLs). Data on eQTLs and sQTLs were obtained from the BrainMeta study v2 (n = 2865),84 while data on methylation quantitative trait loci (mQTLs) were obtained from the Brain-mMeta study v1 (n = 1160).85 Putatively causal SNPs identified from fine-mapping, as outlined above, were used as the QTL instruments for the SMR analyses. Using the BD GWAS and QTL summary statistics, each putative causal SNP was analysed as the target SNP for probes within a 2 Mb window on either side using the --extract-target-snp-probe option in SMR. The EUR HRC LD reference panel was used for the analyses of the multi-ancestry meta-analysis. A Bonferroni correction was applied for 2021 tests, i.e. SNP-QTL probe combinations, in the eQTL analysis (PSMR < 2.47 × 10⁻⁵), 6755 tests in the sQTL analysis (PSMR < 7.40 × 10⁻⁶) and 2222 tests in the mQTL analysis (PSMR < 2.25 × 10⁻⁵). The significance threshold for the HEIDI test (heterogeneity in dependent instruments) was PHEIDI ≥ 0.01. Additional eQTL integration analyses were conducted using TWAS (http://gusevlab.org/projects/fusion/), FOCUS and isoTWAS (https://github.com/bhattacharya-a-bt/isotwas). Details related to these analyses are provided in the Supplementary Note.
Enhancer-promoter gene interactions
To investigate enhancer-promoter (E-P) interactions influenced by BD GWAS variants, we utilized cell-type-specific E-P maps from a multi-omics dataset, which included joint snATAC-seq & snRNA-seq and cell-specific Hi-C data from developing brains. We employed the activity-by-contact (ABC) model32,33 for this analysis. Following the authors’ guidelines, we excluded E-P interactions that (i) had an ABC score below 0.015, (ii) involved ubiquitously expressed genes or genes on the Y chromosome, or (iii) included genes not expressed in major brain cell types. Focusing on the BD GWAS, we selected only those E-P links that overlapped genome-wide significant SNPs (with peaks extended by 100 bp on both sides to increase overlap) or their LD buddies (R2 ≥ 0.8). This selection process yielded 11,023 E-P links. We then overlapped these putative disease-relevant variants with enhancer-promoter (E-P) links to prioritize causal genes. To avoid multiple associations for a single variant, we applied the ABC-Max approach,33 retaining only the E-P links with the highest ABC score for each peak.
Credible gene identification
We provide a set of credible genes by integrating information from various gene-mapping strategies, using a similar approach previously described (Extended Figure 7, Supplementary Table 31).86 First, genes identified through fine-mapping, and QTL (eQTL, mQTL and sQTL) analyses using SMR and proximity (nearest gene within 10 kb) to fine-mapped putatively causal SNPs were included. The identified set of 116 genes were then further assessed based on gene-level associations (MAGMA),22 additional integrative eQTL analyses30,31 and enhancer-promoter gene interactions.32,33 The criteria for filtering genes from the different eQTL methods were: (i) SMR adjusted p-value less than 0.05 and HEIDI test p-value greater than 0.01, (ii) TWAS adjusted p-values less than 0.05 and colocalization probability (COLOC.PP4) greater than 0.7, (iii) FOCUS posterior inclusion probability greater than 0.7 and within a credible set, (iv) isoTWAS permutation p-value less than 0.05, isoTWAS poster inclusion probability greater than 0.7 and within a credible set (Extended Figure 7). Genes annotated by at least one of these eQTL approaches were confirmed as having eQTL evidence (Supplementary Table 31). Thus, seven approaches were considered by which loci could be mapped to genes including, eQTL evidence (eQTL or TWAS or FOCUS or isoTWAS), mQTL, sQTL, VEP, proximity, MAGMA and E-P interactions.
Temporal clustering of credible genes
Lifespan gene expression from the Human Brain Transcriptome project (www.hbatlas.org)35 was used to cluster the list of credible genes based on their temporal variation. The gene expression and associated metadata were acquired from the gene expression omnibus (GEO; accession: GSE25219). The data consists of 57 donors aged 5.7 weeks post conception to 82 years old with samples extracted across regions of the brain. Prior to filtering gene expression for the list of credible genes, gene symbols of both credible genes and the gene expression dataset were harmonized using the “limma” package in R (https://www.bioconductor.org/packages/release/bioc/html/limma.html) which updates any synonymous gene symbols to the latest Entrez symbol. Gene expression was available for 34 of the 36 credible genes. Within a given brain region, each gene’s expression was then mean-centered and scaled. Outliers in gene expression more than 4 standard deviations from the mean were removed. To generate a single gene expression profile for each gene across the lifespan, at a given age, the mean gene expression for a given gene was taken across brain regions, and in some cases across donors. This resulted in a matrix where each gene had a single expression value for each age across the lifespan. This gene-expression by age matrix was then used to cluster the credible genes by the lifespan expression profiles using the R package “TMixClust” (https://www.bioconductor.org/packages/release/bioc/html/TMixClust.html). This method uses mixed-effects models with nonparametric smoothing splines to capture and cluster non-linear variation in temporal gene expression. We tested K=2 to K=10 clusters performing 50 clustering runs to analyse stability. The clustering solution with the highest likelihood (i.e., the global optimum using an expectation maximization technique) is selected as the most stable solution across the 50 runs for each of the trials testing 2–10 clusters. We compare the average silhouette width across the K=2 to K=10 clusters and select that with the maximum value as the optimal number of clusters. The highest average silhouette width was 0.24 for two clusters, while the lowest was 0.17 for four clusters. Overall, there was suggestive evidence for a two-cluster solution for the temporal expression of credible genes.
Drug enrichment analyses
Gene-set analyses were performed restricted to genes targeted by drugs, assessing individual drugs and grouping drugs with similar actions as described previously 3,36. Gene-level and gene-set analyses of the multi-ancestry GWAS summary statistics including self-report data were performed in MAGMA v1.10 22, as outlined above for cell type specific enrichment.
Gene sets were defined comprising the targets of each drug in the Drug Gene Interaction database DGIdb v.5.0.6 37; the Psychoactive Drug Screening Database Ki DB 87; ChEMBL v27 88; the Target Central Resource Database v6.7.0 89; and DSigDB v1.0 90; all downloaded in October 2020. Multiple testing was controlled using a Bonferroni-corrected significance threshold of P < 5.41 × 10⁻⁵ (924 drug-sets with at least ten valid drug gene sets) for drug-set analysis and P < 5.49 × 10⁻⁴ (91 drug classes) for drug-class analysis, respectively.
We also assessed whether any of the 36 credible genes were classified as druggable in the OpenTargets platform (https://genetics.opentargets.org/).
In addition, gene-set analyses were also performed to test the enrichment of drug-gene interactions on only credible genes as described above. Moreover, we investigated if any lithium target genes, as well as their interaction partners, were among the 36 credible genes using the latest version of the human protein interactome91. We calculated the network-based separation (SAB) between credible genes and lithium target genes, where a significant overlapping network neighbourhood would be indicative of functional similarity92.
Extended Data
Extended Figure 1. Network diagram of the genetic correlations between BD ascertained from Clinical, Community and Self-report samples, as well as BD-subtypes (BDI and BDII).

The line widths are proportional to the strength of the correlations between pairs. BDI: bipolar disorder I, BDII: bipolar disorder II
Extended Figure 2: Univariate MiXeR estimates of the required effective sample size needed to capture 50% of the genetic variance (horizontal dashed line) associated with each BD ascertainment and subtype.

N and Sample size refer to the effective sample size. The estimated effective sample size (and standard errors) are given in the legend alongside each trait name.
Extended Figure 3. Trivariate MiXeR estimates for the genetic overlap of BD from Clinical, Community and Self-report samples.

The percentages show the proportion of trait-influencing variants within each section of the Venn diagram relative to the sum of all trait-influencing variants across all samples. The size of the circles reflects the polygenicity of each trait.
Extended Figure 4. Miami plot for BD genome-wide meta-analyses, including all cohorts.

Upper panel: the multi-ancestry meta-analysis identified 298 genome-wide significant (GWS) loci. Lower panel: porcupine plot showing the results of the Latino (0 GWS loci), African American (0 GWS loci), East Asian (1 GWS locus) and European (229 GWS loci) meta-analyses. The x-axes show genomic position (chromosomes 1–22), and the y axes show statistical significance as –log10[p-value]. P-values are two-sided and based on an inverse-variance-weighted fixed-effects meta-analysis. The dashed black lines show the GWS threshold (P < 5 × 10⁻⁸). The star indicates the position of the East Asian GWS locus (rs117130410, 4:105734758, build GRCh37).
Extended Figure 5. Cluster-level SNP-heritability enrichment for bipolar disorder.

The t-distributed stochastic neighbor embedding (tSNE) plot (left) (from Siletti et al.23) is coloured by the enrichment z-score. Grey indicates non-significantly enriched superclusters (FDR > 0.05). The barplot (right) shows the top 35 significantly enriched clusters. The numbers in parentheses on the y-axis indicate the cell type clusters as defined in Siletti et al.23
Extended Figure 6. Number of SNPs within the smallest 95% credible sets (CS) from meta-analysis of European and multi-ancestry meta-analyses when excluding and including self-report data.
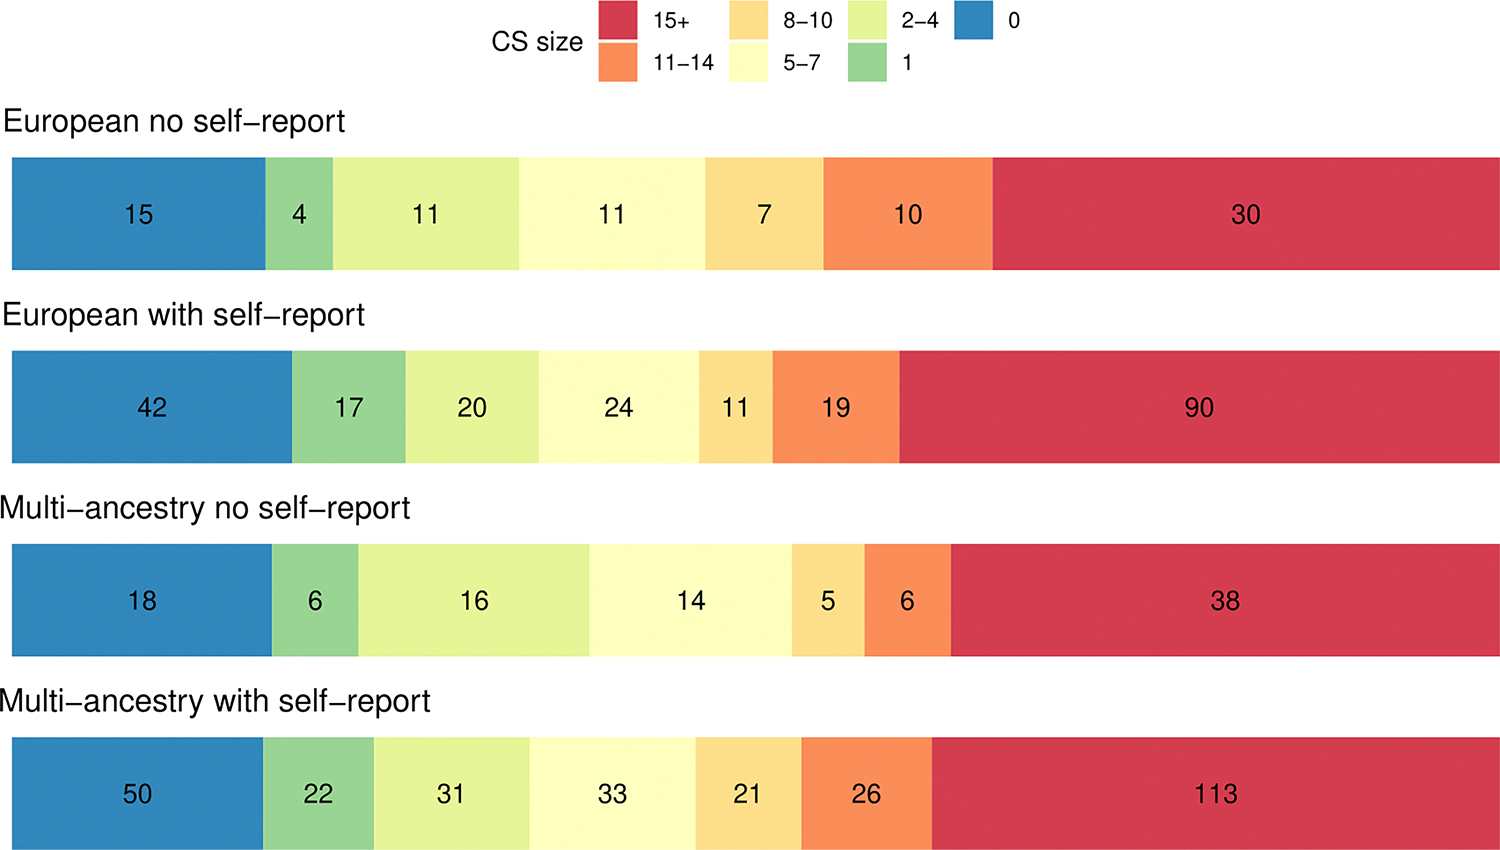
Colours represent CS of varying size, with blue CS containing 0 SNPs and red CS containing 15+ SNPs. All fine-mapped SNPs regardless of their PIP were used to assess the size of the 95% credible sets.
Extended Figure 7. Methods and criteria for credible gene identification.

Extended Figure 8. Clustering of patterns of temporal variation in expression of 34 credible genes.

Cluster 1 (n=21 genes) shows reduced prenatal gene expression, with gene expression peaking at birth and remaining stable over the life-course. Cluster 2 (n=13 genes) includes genes with a peak gene expression during fetal development with a drop-off in expression before birth. Genes within each cluster are described in Supplementary Table 31. To illustrate the variability in gene expression within each cluster we plot each donor expression value in each sampled brain region for the 34 credible genes as individual points. Smoothing splines used to illustrate the age trajectory for each cluster is based on generalized additive models with the predicted 95% confidence interval in grey. We use age in days to plot the variation in gene expression with the x-axis on a log2 scale and labels for birth, 10, 18, and 65 years of age as reference points.
Supplementary Material
Acknowledgements
We thank the participants who donated their time, life experiences and DNA to this research, and the clinical and scientific teams that worked with them. We are deeply indebted to the investigators who comprise the PGC. The PGC has received major funding from the US National Institute of Mental Health (PGC4: R01 39; PGC3: U01 MH109528; PGC2: U01 MH094421; PGC1: U01 MH085520). Statistical analyses were carried out on the NL Genetic Cluster Computer (http://www.geneticcluster.org) hosted by SURFsara. The content is solely the responsibility of the authors and does not necessarily represent the official views of the National Institutes of Health. Individual and cohort specific funding acknowledgements are detailed in the supplementary information.
23andMe Research Team
Keng-Han Lin11,273, Xin Wang11,273
Consortium contact representative: publication-review@23andme.com
Estonian Biobank research team
Kristi Krebs120, Lili Milani120
Consortium contact representative: Lili Milani (lili.milani@ut.ee).
A full list of members and their affiliations appears in the Supplementary Information.
Genoplan Research Team
Byung-Chul Lee275,276, Ji-Woong Kim275,276, Young Kee Lee275,276, Joon Ho Kang275,276, Myeong Jae Cheon275,276, Dong Jun Kim275,276
Consortium contact representative: Byung-Chul Lee (io@genoplan.com).
275 Genoplan RnD Division, Genoplan Korea, Seoul, Republic of Korea. 276 Genoplan RnD Division, Genoplan Japan, Fukuoka, Japan.
HUNT All-In Psychiatry
Bendik S. Winsvold48,181,182, Eystein Stordal257,258, Gunnar Morken221,222, John-Anker Zwart47,48,181, Ole Kristian Drange2,76, Sigrid Børte46,47,48
Consortium contact representative: Bendik S. Winsvold (bendik.s.winsvold@gmail.com).
A full list of members and their affiliations appears in the Supplementary Information.
PGC-FG Single cell working group
Arvid Harder19,273, Howard J. Edenberg270,271, Nadine Parker1,2,273, Eva C. Schulte8,22,131, Jens Hjerling-Leffler205
Consortium contact representative: Jens Hjerling-Leffler (jens.hjerling-leffler@ki.se).
A full list of members and their affiliations appears in the Supplementary Information.
Genomic Psychiatry Cohort (GPC) Investigators
Michele T. Pato237, Carlos N. Pato237, Tim B. Bigdeli41,42,43,44, Ayman H. Fanous77,78,79, James A. Knowles118, Mark H. Rapaport153, Janet L. Sobell162, Helena Medeiros141, William Byerley53, James L. Kennedy110,111,112,113, Jordan W. Smoller128,254,255, Patrick F. Sullivan19,260,261, Tiffany A. Greenwood88, Marquis P. Vawter177, Chris Chatzinakos41,43
Consortium contact representative: Tim B. Bigdeli (Tim.Bigdeli@downstate.edu).
A full list of members and their affiliations appears in the Supplementary Information.
Cooperative Studies Program (CSP) #572
Mihaela Aslan277, Philip D. Harvey278, Grant D. Huang279, Tim B. Bigdeli41,42,43,44, Ayman H. Fanous77,78,79, John R. Kelsoe88
277 Clinical Epidemiology Research Center (CERC), VA Connecticut Healthcare System, West Haven, CT, USA. 278 Bruce W. Carter Miami Veterans Affairs (VA) Medical Center, Miami, FL, USA. 279 Office of Research and Development, Veterans Health Administration, Washington, DC, USA.
Consortium contact representative: Tim B. Bigdeli (Tim.Bigdeli@downstate.edu).
A full list of members and their affiliations appears in the Supplementary Information.
Million Veteran Program (MVP)
Grant D. Huang279
279 Office of Research and Development, Veterans Health Administration, Washington, DC, USA.
Consortium contact representative: Grant D. Huang (CSP@va.gov).
A full list of members and their affiliations appears in the Supplementary Information.
Bipolar Disorder Working Group of the Psychiatric Genomics Consortium
Kevin S. O’Connell1,2,, Maria Koromina3,4,5,273, Tracey van der Veen6,273, Toni Boltz7,273, Friederike S. David8,9,273, Jessica Mei Kay Yang10,273, Keng-Han Lin11,273, Xin Wang11,273, Jonathan R. I. Coleman12,13,273, Brittany L. Mitchell14,15,273, Caroline C. McGrouther16,273, Aaditya V. Rangan16,17,273, Penelope A. Lind14,15,18,273, Elise Koch1,2,273, Arvid Harder19,273, Nadine Parker1,2,273, Jaroslav Bendl3,5,20,21,273, Kristina Adorjan22,23,24, Esben Agerbo25,26,27, Diego Albani28, Silvia Alemany29,30,31, Ney Alliey-Rodriguez32,33, Thomas D. Als25,34,35, Till F. M. Andlauer36, Anastasia Antoniou37, Helga Ask38,39, Nicholas Bass6, Michael Bauer40, Eva C. Beins8, Tim B. Bigdeli41,42,43,44, Carsten Bøcker Pedersen25,26,27, Marco P. Boks45, Sigrid Børte46,47,48, Rosa Bosch29,49, Murielle Brum50, Ben M. Brumpton51, Nathalie Brunkhorst-Kanaan50, Monika Budde22, Jonas Bybjerg-Grauholm25,52, William Byerley53, Judit Cabana-Domínguez29,30,31, Murray J. Cairns54,55, Bernardo Carpiniello56, Miquel Casas49,57,58, Pablo Cervantes59, Chris Chatzinakos41,43, Hsi-Chung Chen60,61, Tereza Clarence3,5,20,21, Toni-Kim Clarke62, Isabelle Claus8, Brandon Coombes63, Elizabeth C. Corfield38,64,65, Cristiana Cruceanu59,66, Alfredo Cuellar-Barboza67,68, Piotr M. Czerski69, Konstantinos Dafnas37, Anders M. Dale70, Nina Dalkner71, Franziska Degenhardt8,72, J. Raymond DePaulo73, Srdjan Djurovic74,75, Ole Kristian Drange2,76, Valentina Escott-Price10, Ayman H. Fanous77,78,79, Frederike T. Fellendorf71, I. Nicol Ferrier80, Liz Forty10, Josef Frank81, Oleksandr Frei1,47, Nelson B. Freimer82,83, John F. Fullard3,5,20,21, Julie Garnham84, Ian R. Gizer85, Scott D. Gordon86, Katherine Gordon-Smith87, Tiffany A. Greenwood88, Jakob Grove25,89,90,91, José Guzman-Parra92, Tae Hyon Ha93,94, Tim Hahn95, Magnus Haraldsson96,97, Martin Hautzinger98, Alexandra Havdahl38,39,64, Urs Heilbronner22, Dennis Hellgren19, Stefan Herms8,99,100, Ian B. Hickie101, Per Hoffmann8,99,100, Peter A. Holmans10, Ming-Chyi Huang102, Masashi Ikeda103,104, Stéphane Jamain105, Jessica S. Johnson3,5,106, Lina Jonsson107, Janos L. Kalman22,23, Yoichiro Kamatani108,109, James L. Kennedy110,111,112,113, Euitae Kim93,94,114, Jaeyoung Kim93,115, Sarah Kittel-Schneider116,117, James A. Knowles118, Manolis Kogevinas119, Thorsten M. Kranz50, Kristi Krebs120, Steven A. Kushner121, Catharina Lavebratt122,123, Jacob Lawrence124, Markus Leber125, Heon-Jeong Lee126, Calwing Liao127,128, Susanne Lucae129, Martin Lundberg122,123, Donald J. MacIntyre130, Wolfgang Maier131, Adam X. Maihofer88,132, Dolores Malaspina3,5, Mirko Manchia56,133, Eirini Maratou134, Lina Martinsson135,136, Manuel Mattheisen25,34,35,117,137, Nathaniel W. McGregor138, Melvin G. McInnis139, James D. McKay140, Helena Medeiros141, Andreas Meyer-Lindenberg142,143, Vincent Millischer122,123,144,145, Derek W. Morris146, Paraskevi Moutsatsou134, Thomas W. Mühleisen99,147, Claire O’Donovan84, Catherine M. Olsen148, Georgia Panagiotaropoulou149, Sergi Papiol22,23,29, Antonio F. Pardiñas10, Hye Youn Park93,94, Amy Perry87, Andrea Pfennig40, Claudia Pisanu150, James B. Potash73, Digby Quested151,152, Mark H. Rapaport153, Eline J. Regeer154, John P. Rice155, Margarita Rivera156,157,158, Eva C. Schulte8,22,131, Fanny Senner22,23, Alexey Shadrin1,2,159, Paul D. Shilling88, Engilbert Sigurdsson96,97, Lisa Sindermann8, Lea Sirignano81, Dan Siskind160, Claire Slaney84, Laura G. Sloofman3,5, Olav B. Smeland1,2, Daniel J. Smith161, Janet L. Sobell162, Maria Soler Artigas29,30,31,163, Dan J. Stein164, Frederike Stein9, Mei-Hsin Su165, Heejong Sung166, Beata Świątkowska167, Chikashi Terao109, Markos Tesfaye1,2,75, Martin Tesli1,2,168, Thorgeir E. Thorgeirsson169, Jackson G. Thorp14, Claudio Toma170,171,172, Leonardo Tondo173, Paul A. Tooney174, Shih-Jen Tsai175,176, Evangelia Eirini Tsermpini84, Marquis P. Vawter177, Helmut Vedder178, Annabel Vreeker45,179,180, James T. R. Walters10, Bendik S. Winsvold48,181,182, Stephanie H. Witt81, Hong-Hee Won115,183, Robert Ye127,128, Allan H. Young184,185, Peter P. Zandi73, Lea Zillich81, Rolf Adolfsson187, Martin Alda84,188, Lars Alfredsson189, Lena Backlund122,123, Bernhard T. Baune190,191,192, Frank Bellivier193,194, Susanne Bengesser71, Wade H. Berrettini195, Joanna M. Biernacka63,68, Michael Boehnke196, Anders D. Børglum25,89,90, Gerome Breen12,13, Vaughan J. Carr171, Stanley Catts197, Sven Cichon8,99,100,147, Aiden Corvin198, Nicholas Craddock10, Udo Dannlowski95, Dimitris Dikeos199, Bruno Etain193,194, Panagiotis Ferentinos12,37, Mark Frye68, Janice M. Fullerton170,200, Micha Gawlik117, Elliot S. Gershon32,201, Fernando S. Goes73, Melissa J. Green170,171, Maria Grigoroiu-Serbanescu202, Joanna Hauser203, Frans A. Henskens204, Jens Hjerling-Leffler205, David M. Hougaard25,52, Kristian Hveem51,206, Nakao Iwata104, Ian Jones10, Lisa A. Jones87, René S. Kahn3,45, John R. Kelsoe88, Tilo Kircher9, George Kirov10, Po-Hsiu Kuo60,207, Mikael Landén19,107, Marion Leboyer105, Qingqin S. Li208,209, Jolanta Lissowska210, Christine Lochner211, Carmel Loughland212, Jurjen J. Luykx213,214, Nicholas G. Martin86,215, Carol A. Mathews216, Fermin Mayoral92, Susan L. McElroy217, Andrew M. McIntosh130, Francis J. McMahon166, Sarah E. Medland14,218,219, Ingrid Melle1,220, Lili Milani120, Philip B. Mitchell171, Gunnar Morken221,222, Ole Mors25,223, Preben Bo Mortensen25,224, Bertram Müller-Myhsok129,225,226, Richard M. Myers227, Woojae Myung93,94, Benjamin M. Neale127,128,228, Caroline M. Nievergelt88,132, Merete Nordentoft25,229, Markus M. Nöthen8, John I. Nurnberger230, Michael C. O’Donovan10, Ketil J. Oedegaard231,232, Tomas Olsson233, Michael J. Owen10, Sara A. Paciga234, Christos Pantelis192,235,236, Carlos N. Pato237, Michele T. Pato237, George P. Patrinos238,239,240,241, Joanna M. Pawlak203, Josep Antoni Ramos-Quiroga29,30,31,57, Andreas Reif50, Eva Z. Reininghaus71, Marta Ribasés29,30,31,163, Marcella Rietschel81, Stephan Ripke127,128,149, Guy A. Rouleau242,243, Panos Roussos3,5,20,21,244, Takeo Saito104, Ulrich Schall245,246, Martin Schalling122,123, Peter R. Schofield170,200, Thomas G. Schulze22,73,81,247,248, Laura J. Scott196, Rodney J. Scott249,250, Alessandro Serretti251,252,253, Jordan W. Smoller128,254,255, Alessio Squassina150, Eli A. Stahl3,5,228, Hreinn Stefansson169, Kari Stefansson169,256, Eystein Stordal257,258, Fabian Streit81,142,259, Patrick F. Sullivan19,260,261, Gustavo Turecki262, Arne E. Vaaler263, Eduard Vieta264, John B. Vincent110, Irwin D. Waldman265, Cynthia S. Weickert170,171,266, Thomas W. Weickert170,171,266, Thomas Werge25,267,268,269, David C. Whiteman148, John-Anker Zwart47,48,181, Howard J. Edenberg270,271, Andrew McQuillin6,274, Andreas J. Forstner8,147,272,274, Niamh Mullins3,4,5,274, Arianna Di Florio10,261,274, Roel A. Ophoff7,82,83,274, Ole A. Andreassen1,2,274
Consortium contact representative: Ole A. Andreassen (ole.andreassen@medisin.uio.no).
Footnotes
Competing Interests
T.E.T., H.S. and K.S. are employed by deCODE Genetics/Amgen. E.A.S. is an employee of Regeneron Genetics Center and owns stocks of Regeneron Pharmaceutical Co. K-H.L. and X.W. are employed by 23andMe Inc.
Multiple additional authors work for pharmaceutical or biotechnology companies in a manner directly analogous to academic coauthors and collaborators.
A.H.Y. has given paid lectures and served on advisory boards relating to drugs used in affective and related disorders for several companies (AstraZeneca, Eli Lilly, Lundbeck, Sunovion, Servier, Livanova, Janssen, Allergan, Bionomics and Sumitomo Dainippon Pharma), was Lead Investigator for Embolden Study (AstraZeneca), BCI Neuroplasticity study and Aripiprazole Mania Study, and is an investigator for Janssen, Lundbeck, Livanova and Compass.
J.I.N. is an investigator for Janssen.
P.F.S. reports the following potentially competing financial interests: Neumora Therapeutics (advisory committee and shareholder).
G. Breen reports consultancy and speaker fees from Eli Lilly and Illumina and grant funding from Eli Lilly.
M. Landén has received speaker fees from Lundbeck.
O.A.A. has served as a speaker for Janssen, Lundbeck, and Sunovion and as a consultant for Cortechs.ai.
A.M.D. is a founder of and holds equity interest in CorTechs Labs and serves on its scientific advisory board; he is a member of the scientific advisory board of Human Longevity and the Mohn Medical Imaging and Visualization Center (Bergen, Norway); and he has received research funding from General Electric Healthcare.
E.V. has received grants and served as a consultant, advisor or CME speaker for the following entities: AB-Biotics, Abbott, Allergan, Angelini, AstraZeneca, Bristol Myers Squibb, Dainippon Sumitomo Pharma, Farmindustria, Ferrer, Forest Research Institute, Gedeon Richter, GlaxoSmithKline, Janssen, Lundbeck, Otsuka, Pfizer, Roche, SAGE, Sanofi-Aventis, Servier, Shire, Sunovion, Takeda, the Brain and Behaviour Foundation, the Catalan Government (AGAUR and PERIS), the Spanish Ministry of Science, Innovation, and Universities (AES and CIBERSAM), the Seventh European Framework Programme and Horizon 2020 and the Stanley Medical Research Institute.
S.K.-S. received author’s, speaker’s and consultant honoraria from Janssen, Medice Arzneimittel Pütter GmbH and Takeda outside of the current work
A.S. is or has been a consultant/speaker for: Abbott, Abbvie, Angelini, AstraZeneca, Clinical Data, Boheringer, Bristol Myers Squibb, Eli Lilly, GlaxoSmithKline, Innovapharma, Italfarmaco, Janssen, Lundbeck, Naurex, Pfizer, Polifarma, Sanofi, Servier.
J.R.D. has served as an unpaid consultant to Myriad – Neuroscience (formerly Assurex Health) in 2017 and 2019 and owns stock in CVS Health.
B.M.N. is a member of the scientific advisory board at Deep Genomics and consultant for Camp4 Therapeutics, Takeda Pharmaceutical and Biogen.
B.-C.L, J.-W.K, Y.K.L, J.H.K, M.J.C, and D.J.K are employed by Genoplan inc.
I.B.H. is the Co-Director of Health and Policy at the Brain and Mind Centre (BMC) University of Sydney. The BMC operates an early-intervention youth services at Camperdown under contract to Headspace. He is the Chief Scientific Advisor to, and a 3.2% equity shareholder in, InnoWell Pty Ltd. InnoWell was formed by the University of Sydney (45% equity) and PwC (Australia; 45% equity) to deliver the $30 M Australian Government-funded Project Synergy (2017–20; a three-year program for the transformation of mental health services) and to lead transformation of mental health services internationally through the use of innovative technologies.
MJO and MCO’D have received funding from Takeda Pharmaceuticals and Akrivia Health outside the scope of the current work. PBM has received remuneration from Janssen (Australia) and Sanofi (Hangzhou) for lectures or advisory board membership.
All other authors declare no financial interests or potential conflicts of interest.
J.A.R.Q was on the speakers’ bureau and/or acted as consultant for Biogen, Idorsia, Casen-Recordati, Janssen-Cilag, Novartis, Takeda, Bial, Sincrolab, Neuraxpharm, Novartis, BMS, Medice, Rubió, Uriach, Technofarma and Raffo in the last 3 years. He also received travel awards (air tickets + hotel) for taking part in psychiatric meetings from Idorsia, Janssen-Cilag, Rubió, Takeda, Bial and Medice. The Department of Psychiatry chaired by him received unrestricted educational and research support from the following companies in the last 3 years: Exeltis, Idorsia, Janssen- Cilag, Neuraxpharm, Oryzon, Roche, Probitas and Rubió.
Code availability
No custom code was developed for this study. All software and tools used for the analyses presented are publicly available and referenced within the respective methods sections of the manuscript.
Data availability
Genome-wide association summary statistics for these analyses are available at https://www.med.unc.edu/pgc/download-results/. The full GWAS summary statistics for the 23andMe datasets will be made available through 23andMe to qualified researchers under an agreement with 23andMe that protects the privacy of the 23andMe participants. Please visit https://research.23andme.com/collaborate/#dataset-access for more information and to apply to access the data. After applying with 23andMe, the full summary statistics including all analysed SNPs and samples in the GWAS meta-analyses will be accessible to the approved researchers. Genotype data are available for a subset of cohorts, including dbGAP accession numbers and/or restrictions, as described in the ‘Cohort descriptions’ section of the supplementary materials.
References
- 1.Carvalho AF, Firth J & Vieta E Bipolar Disorder. N. Engl. J. Med. 383, 58–66 (2020). [DOI] [PubMed] [Google Scholar]
- 2.Lichtenstein P et al. Common genetic determinants of schizophrenia and bipolar disorder in Swedish families: a population-based study. Lancet 373, 234–239 (2009). [DOI] [PMC free article] [PubMed] [Google Scholar]
- 3.Mullins N et al. Genome-wide association study of more than 40,000 bipolar disorder cases provides new insights into the underlying biology. Nat. Genet. 53, 817–829 (2021). [DOI] [PMC free article] [PubMed] [Google Scholar]
- 4.Palmer DS et al. Exome sequencing in bipolar disorder identifies AKAP11 as a risk gene shared with schizophrenia. Nat. Genet. 54, 541–547 (2022). [DOI] [PMC free article] [PubMed] [Google Scholar]
- 5.McIntyre RS et al. Bipolar disorders. Lancet 396, 1841–1856 (2020). [DOI] [PubMed] [Google Scholar]
- 6.Aghababaie-Babaki P et al. Global, regional, and national burden and quality of care index (QCI) of bipolar disorder: A systematic analysis of the Global Burden of Disease Study 1990 to 2019. Int. J. Soc. Psychiatry 69, 1958–1970 (2023). [DOI] [PubMed] [Google Scholar]
- 7.Geddes JR & Miklowitz DJ Treatment of bipolar disorder. Lancet 381, 1672–1682 (2013). [DOI] [PMC free article] [PubMed] [Google Scholar]
- 8.American Psychiatric Association. Diagnostic and Statistical Manual of Mental Disorders (DSM-5®). (American Psychiatric Pub, 2013). [Google Scholar]
- 9.Reed GM et al. Innovations and changes in the ICD-11 classification of mental, behavioural and neurodevelopmental disorders. World Psychiatry 18, 3–19 (2019). [DOI] [PMC free article] [PubMed] [Google Scholar]
- 10.Psychiatric GWAS Consortium Bipolar Disorder Working Group. Large-scale genome-wide association analysis of bipolar disorder identifies a new susceptibility locus near ODZ4. Nat. Genet. 43, 977–983 (2011). [DOI] [PMC free article] [PubMed] [Google Scholar]
- 11.Stahl EA et al. Genome-wide association study identifies 30 loci associated with bipolar disorder. Nat. Genet. 51, 793–803 (2019). [DOI] [PMC free article] [PubMed] [Google Scholar]
- 12.Ching CRK et al. What we learn about bipolar disorder from large-scale neuroimaging: Findings and future directions from the ENIGMA Bipolar Disorder Working Group. Hum. Brain Mapp. 43, 56–82 (2022). [DOI] [PMC free article] [PubMed] [Google Scholar]
- 13.Bulik-Sullivan BK et al. LD Score regression distinguishes confounding from polygenicity in genome-wide association studies. Nat. Genet. 47, 291–295 (2015). [DOI] [PMC free article] [PubMed] [Google Scholar]
- 14.McGrath JJ et al. Age of onset and cumulative risk of mental disorders: a cross-national analysis of population surveys from 29 countries. Lancet Psychiatry 10, 668–681 (2023). [DOI] [PMC free article] [PubMed] [Google Scholar]
- 15.Holland D et al. Beyond SNP heritability: Polygenicity and discoverability of phenotypes estimated with a univariate Gaussian mixture model. PLoS Genet 16, e1008612 (2020). [DOI] [PMC free article] [PubMed] [Google Scholar]
- 16.Frei O et al. Bivariate causal mixture model quantifies polygenic overlap between complex traits beyond genetic correlation. Nat. Commun. 10, 2417 (2019). [DOI] [PMC free article] [PubMed] [Google Scholar]
- 17.Merikangas KR et al. Prevalence and correlates of bipolar spectrum disorder in the world mental health survey initiative. Arch. Gen. Psychiatry 68, 241–251 (2011). [DOI] [PMC free article] [PubMed] [Google Scholar]
- 18.Ikeda M et al. A genome-wide association study identifies two novel susceptibility loci and trans population polygenicity associated with bipolar disorder. Mol. Psychiatry 23, 639–647 (2018). [DOI] [PMC free article] [PubMed] [Google Scholar]
- 19.Frei O et al. Improved functional mapping of complex trait heritability with GSA-MiXeR implicates biologically specific gene sets. Nat. Genet. 1–9 (2024). [DOI] [PMC free article] [PubMed] [Google Scholar]
- 20.Cuéllar-Partida G et al. Complex-Traits Genetics Virtual Lab: A community-driven web platform for post-GWAS analyses. bioRxiv; 518027 (2019) doi: 10.1101/518027. [DOI] [Google Scholar]
- 21.Ge T, Chen C-Y, Ni Y, Feng Y-CA & Smoller JW Polygenic prediction via Bayesian regression and continuous shrinkage priors. Nat. Commun. 10, 1776 (2019). [DOI] [PMC free article] [PubMed] [Google Scholar]
- 22.de Leeuw CA, Mooij JM, Heskes T & Posthuma D MAGMA: generalized gene-set analysis of GWAS data. PLoS Comput. Biol. 11, e1004219 (2015). [DOI] [PMC free article] [PubMed] [Google Scholar]
- 23.Siletti K et al. Transcriptomic diversity of cell types across the adult human brain. Science 382, eadd7046 (2023). [DOI] [PubMed] [Google Scholar]
- 24.Finucane HK et al. Partitioning heritability by functional annotation using genome-wide association summary statistics. Nat. Genet. 47, 1228–1235 (2015). [DOI] [PMC free article] [PubMed] [Google Scholar]
- 25.Yao S et al. Connecting genomic results for psychiatric disorders to human brain cell types and regions reveals convergence with functional connectivity medRxiv; 2024.01.18.24301478 (2024) doi: 10.1101/2024.01.18.24301478. [DOI] [PMC free article] [PubMed] [Google Scholar]
- 26.Weissbrod O et al. Functionally informed fine-mapping and polygenic localization of complex trait heritability. Nat. Genet. 52, 1355–1363 (2020). [DOI] [PMC free article] [PubMed] [Google Scholar]
- 27.McLaren W et al. The Ensembl Variant Effect Predictor. Genome Biol. 17, 122 (2016). [DOI] [PMC free article] [PubMed] [Google Scholar]
- 28.Singh T et al. Rare coding variants in ten genes confer substantial risk for schizophrenia. Nature 604, 509–516 (2022). [DOI] [PMC free article] [PubMed] [Google Scholar]
- 29.Olfson E et al. Ultra-rare de novo damaging coding variants are enriched in attention-deficit/hyperactivity disorder and identify risk genes medRxiv; 2023.05.19.23290241 (2023) doi: 10.1101/2023.05.19.23290241. [DOI] [Google Scholar]
- 30.Gusev A et al. Integrative approaches for large-scale transcriptome-wide association studies. Nat. Genet. 48, 245–252 (2016). [DOI] [PMC free article] [PubMed] [Google Scholar]
- 31.Bhattacharya A et al. Isoform-level transcriptome-wide association uncovers genetic risk mechanisms for neuropsychiatric disorders in the human brain. Nat. Genet. 55, 2117–2128 (2023). [DOI] [PMC free article] [PubMed] [Google Scholar]
- 32.Fulco CP et al. Activity-by-contact model of enhancer-promoter regulation from thousands of CRISPR perturbations. Nat. Genet. 51, 1664–1669 (2019). [DOI] [PMC free article] [PubMed] [Google Scholar]
- 33.Nasser J et al. Genome-wide enhancer maps link risk variants to disease genes. Nature 593, 238–243 (2021). [DOI] [PMC free article] [PubMed] [Google Scholar]
- 34.Koopmans F et al. SynGO: An Evidence-Based, Expert-Curated Knowledge Base for the Synapse. Neuron 103, 217–234.e4 (2019). [DOI] [PMC free article] [PubMed] [Google Scholar]
- 35.Kang HJ et al. Spatio-temporal transcriptome of the human brain. Nature 478, 483–489 (2011). [DOI] [PMC free article] [PubMed] [Google Scholar]
- 36.Gaspar HA & Breen G Drug enrichment and discovery from schizophrenia genome-wide association results: an analysis and visualisation approach. Sci. Rep. 7, 12460 (2017). [DOI] [PMC free article] [PubMed] [Google Scholar]
- 37.Cannon M et al. DGIdb 5.0: rebuilding the drug-gene interaction database for precision medicine and drug discovery platforms. Nucleic Acids Res. 52, D1227–D1235 (2024). [DOI] [PMC free article] [PubMed] [Google Scholar]
- 38.Reigstad CS et al. Gut microbes promote colonic serotonin production through an effect of short-chain fatty acids on enterochromaffin cells. The FASEB Journal 29, 1395–1403 (2015). [DOI] [PMC free article] [PubMed] [Google Scholar]
- 39.Ortega MA et al. Microbiota–gut–brain axis mechanisms in the complex network of bipolar disorders: potential clinical implications and translational opportunities. Mol. Psychiatry 28, 2645–2673 (2023). [DOI] [PMC free article] [PubMed] [Google Scholar]
- 40.Lithium carbonate alleviates colon inflammation through modulating gut microbiota and Treg cells in a GPR43-dependent manner. Pharmacol. Res. 175, 105992 (2022). [DOI] [PubMed] [Google Scholar]
- 41.Trubetskoy V et al. Mapping genomic loci implicates genes and synaptic biology in schizophrenia. Nature 604, 502–508 (2022). [DOI] [PMC free article] [PubMed] [Google Scholar]
- 42.Neurodevelopmental pathways in bipolar disorder. Neurosci. Biobehav. Rev. 112, 213–226 (2020). [DOI] [PubMed] [Google Scholar]
- 43.Jonsson L, Song J, Joas E, Pålsson E & Landén M Polygenic scores for psychiatric disorders associate with year of first bipolar disorder diagnosis: A register-based study between 1972 and 2016. Psychiatry Res. 339, 116081 (2024). [DOI] [PubMed] [Google Scholar]
- 44.Zimmerman M, Ruggero CJ, Chelminski I & Young D Is bipolar disorder overdiagnosed? J. Clin. Psychiatry 69, 935–940 (2008). [DOI] [PubMed] [Google Scholar]
- 45.Zimmerman M, Ruggero CJ, Chelminski I & Young D Psychiatric diagnoses in patients previously overdiagnosed with bipolar disorder. J. Clin. Psychiatry 71, 26–31 (2010). [DOI] [PubMed] [Google Scholar]
- 46.Sollis E et al. The NHGRI-EBI GWAS Catalog: knowledgebase and deposition resource. Nucleic Acids Res. 51, D977–D985 (2023). [DOI] [PMC free article] [PubMed] [Google Scholar]
- 47.Li X & Zhao H Automated feature extraction from population wearable device data identified novel loci associated with sleep and circadian rhythms. PLoS Genet. 16, e1009089 (2020). [DOI] [PMC free article] [PubMed] [Google Scholar]
- 48.Kichaev G et al. Leveraging Polygenic Functional Enrichment to Improve GWAS Power. Am. J. Hum. Genet. 104, 65–75 (2019). [DOI] [PMC free article] [PubMed] [Google Scholar]
- 49.Thalamuthu A et al. Genome-wide interaction study with major depression identifies novel variants associated with cognitive function. Mol. Psychiatry 27, 1111–1119 (2022). [DOI] [PMC free article] [PubMed] [Google Scholar]
- 50.Bryc K, Durand EY, Macpherson JM, Reich D & Mountain JL The genetic ancestry of African Americans, Latinos, and European Americans across the United States. Am. J. Hum. Genet. 96, 37–53 (2015). [DOI] [PMC free article] [PubMed] [Google Scholar]
- 51.Duncan L et al. Analysis of polygenic risk score usage and performance in diverse human populations. Nat. Commun. 10, 3328 (2019). [DOI] [PMC free article] [PubMed] [Google Scholar]
- 52.Lewis CM & Vassos E Polygenic risk scores: from research tools to clinical instruments. Genome Med. 12, 44 (2020). [DOI] [PMC free article] [PubMed] [Google Scholar]
- 53.Yengo L et al. A saturated map of common genetic variants associated with human height. Nature 610, 704–712 (2022). [DOI] [PMC free article] [PubMed] [Google Scholar]
- 54.Wray NR et al. Genome-wide association analyses identify 44 risk variants and refine the genetic architecture of major depression. Nat. Genet. 50, 668–681 (2018). [DOI] [PMC free article] [PubMed] [Google Scholar]
- 55.Cai N et al. Minimal phenotyping yields genome-wide association signals of low specificity for major depression. Nat. Genet. 52, 437–447 (2020). [DOI] [PMC free article] [PubMed] [Google Scholar]
- 56.Legge SE et al. Genetic and Phenotypic Features of Schizophrenia in the UK Biobank. JAMA Psychiatry (2024) doi: 10.1001/jamapsychiatry.2024.0200. [DOI] [PMC free article] [PubMed] [Google Scholar]
Methods References
- 57.Lam M et al. RICOPILI: Rapid Imputation for COnsortias PIpeLIne. Bioinformatics 36, 930–933 (2020). [DOI] [PMC free article] [PubMed] [Google Scholar]
- 58.Price AL et al. Principal components analysis corrects for stratification in genome-wide association studies. Nature Genetics vol. 38 904–909 Preprint at 10.1038/ng1847 (2006). [DOI] [PubMed] [Google Scholar]
- 59.Loh P-R et al. Reference-based phasing using the Haplotype Reference Consortium panel. Nat. Genet. 48, 1443–1448 (2016). [DOI] [PMC free article] [PubMed] [Google Scholar]
- 60.Das S et al. Next-generation genotype imputation service and methods. Nat. Genet. 48, 1284–1287 (2016). [DOI] [PMC free article] [PubMed] [Google Scholar]
- 61.McCarthy S et al. A reference panel of 64,976 haplotypes for genotype imputation. Nat. Genet. 48, 1279–1283 (2016). [DOI] [PMC free article] [PubMed] [Google Scholar]
- 62.Chang CC et al. Second-generation PLINK: rising to the challenge of larger and richer datasets. Gigascience 4, 7 (2015). [DOI] [PMC free article] [PubMed] [Google Scholar]
- 63.Tian B, Deng Y, Cai Y, Han M & Xu G Efficacy and safety of combination therapy with sodium-glucose cotransporter 2 inhibitors and renin-angiotensin system blockers in patients with type 2 diabetes: a systematic review and meta-analysis. Nephrol. Dial. Transplant 37, 720–729 (2022). [DOI] [PubMed] [Google Scholar]
- 64.Chen W et al. Improved analyses of GWAS summary statistics by reducing data heterogeneity and errors. Nat. Commun. 12, 7117 (2021). [DOI] [PMC free article] [PubMed] [Google Scholar]
- 65.Yang J, Lee SH, Goddard ME & Visscher PM GCTA: a tool for genome-wide complex trait analysis. Am. J. Hum. Genet. 88, 76–82 (2011). [DOI] [PMC free article] [PubMed] [Google Scholar]
- 66.Yang J et al. Conditional and joint multiple-SNP analysis of GWAS summary statistics identifies additional variants influencing complex traits. Nat. Genet. 44, 369–75, S1–3 (2012). [DOI] [PMC free article] [PubMed] [Google Scholar]
- 67.Demontis D et al. Genome-wide analyses of ADHD identify 27 risk loci, refine the genetic architecture and implicate several cognitive domains. Nat. Genet. 55, 198–208 (2023). [DOI] [PMC free article] [PubMed] [Google Scholar]
- 68.Brown BC, Asian Genetic Epidemiology Network Type 2 Diabetes Consortium, Ye CJ, Price AL. & Zaitlen N. Transethnic Genetic-Correlation Estimates from Summary Statistics. Am. J. Hum. Genet. 99, 76–88 (2016). [DOI] [PMC free article] [PubMed] [Google Scholar]
- 69.Hübel C et al. Genomics of body fat percentage may contribute to sex bias in anorexia nervosa. Am. J. Med. Genet. B Neuropsychiatr. Genet 180, 428–438 (2019). [DOI] [PMC free article] [PubMed] [Google Scholar]
- 70.Zhu Z et al. Causal associations between risk factors and common diseases inferred from GWAS summary data. Nat. Commun. 9, 224 (2018). [DOI] [PMC free article] [PubMed] [Google Scholar]
- 71.Shadrin AA et al. Dissecting the genetic overlap between three complex phenotypes with trivariate MiXeR. medRxiv; 2024.02.23.24303236 (2024) doi: 10.1101/2024.02.23.24303236. [DOI] [Google Scholar]
- 72.Lee SH, Goddard ME, Wray NR & Visscher PM A better coefficient of determination for genetic profile analysis. Genet. Epidemiol. 36, 214–224 (2012). [DOI] [PubMed] [Google Scholar]
- 73.R Core Team. R: A Language and Environment for Statistical Computing. R Foundation for Statistical Computing, Vienna, Austria. (2021). [Google Scholar]
- 74.Ashburner M et al. Gene ontology: tool for the unification of biology. The Gene Ontology Consortium. Nat. Genet 25, 25–29 (2000). [DOI] [PMC free article] [PubMed] [Google Scholar]
- 75.Gazal S et al. Linkage disequilibrium-dependent architecture of human complex traits shows action of negative selection. Nat. Genet. 49, 1421–1427 (2017). [DOI] [PMC free article] [PubMed] [Google Scholar]
- 76.Kingma DP & Ba J Adam: A method for stochastic optimization. (2014) doi: 10.48550/ARXIV.1412.6980. [DOI] [Google Scholar]
- 77.Habib N et al. Massively parallel single-nucleus RNA-seq with DroNc-seq. Nat. Methods 14, 955–958 (2017). [DOI] [PMC free article] [PubMed] [Google Scholar]
- 78.Lake BB et al. Integrative single-cell analysis of transcriptional and epigenetic states in the human adult brain. Nat. Biotechnol. 36, 70–80 (2017). [DOI] [PMC free article] [PubMed] [Google Scholar]
- 79.Skene NG et al. Genetic identification of brain cell types underlying schizophrenia. Nat. Genet. 50, 825–833 (2018). [DOI] [PMC free article] [PubMed] [Google Scholar]
- 80.Molecular Architecture of the Mouse Nervous System. Cell 174, 999–1014.e22 (2018). [DOI] [PMC free article] [PubMed] [Google Scholar]
- 81.Saunders A et al. Molecular Diversity and Specializations among the Cells of the Adult Mouse Brain. Cell 174, 1015–1030 (2018). [DOI] [PMC free article] [PubMed] [Google Scholar]
- 82.Watanabe K, Umićević Mirkov M, de Leeuw CA, van den Heuvel MP & Posthuma D Genetic mapping of cell type specificity for complex traits. Nat. Commun. 10, 3222 (2019). [DOI] [PMC free article] [PubMed] [Google Scholar]
- 83.Zhu Z et al. Integration of summary data from GWAS and eQTL studies predicts complex trait gene targets. Nat. Genet. 48, 481–487 (2016). [DOI] [PubMed] [Google Scholar]
- 84.Qi T et al. Genetic control of RNA splicing and its distinct role in complex trait variation. Nat. Genet. 54, 1355–1363 (2022). [DOI] [PMC free article] [PubMed] [Google Scholar]
- 85.Qi T et al. Identifying gene targets for brain-related traits using transcriptomic and methylomic data from blood. Nat. Commun. 9, 1–12 (2018). [DOI] [PMC free article] [PubMed] [Google Scholar]
- 86.Shrine N et al. Multi-ancestry genome-wide association analyses improve resolution of genes and pathways influencing lung function and chronic obstructive pulmonary disease risk. Nat. Genet. 55, 410–422 (2023). [DOI] [PMC free article] [PubMed] [Google Scholar]
- 87.Roth BL, Lopez E, Patel S & Kroeze WK The multiplicity of serotonin receptors: Uselessly diverse molecules or an embarrassment of riches? Neuroscientist 6, 252–262 (2000). [Google Scholar]
- 88.Mendez D et al. ChEMBL: towards direct deposition of bioassay data. Nucleic Acids Res. 47, D930–D940 (2019). [DOI] [PMC free article] [PubMed] [Google Scholar]
- 89.Sheils TK et al. TCRD and Pharos 2021: mining the human proteome for disease biology. Nucleic Acids Res. 49, D1334–D1346 (2021). [DOI] [PMC free article] [PubMed] [Google Scholar]
- 90.Yoo M et al. DSigDB: drug signatures database for gene set analysis. Bioinformatics 31, 3069–3071 (2015). [DOI] [PMC free article] [PubMed] [Google Scholar]
- 91.Morselli Gysi D & Barabási A-L Noncoding RNAs improve the predictive power of network medicine. Proc. Natl. Acad. Sci. U. S. A. 120, e2301342120 (2023). [DOI] [PMC free article] [PubMed] [Google Scholar]
- 92.Menche J et al. Disease networks. Uncovering disease-disease relationships through the incomplete interactome. Science 347, 1257601 (2015). [DOI] [PMC free article] [PubMed] [Google Scholar]
Associated Data
This section collects any data citations, data availability statements, or supplementary materials included in this article.
Supplementary Materials
Data Availability Statement
Genome-wide association summary statistics for these analyses are available at https://www.med.unc.edu/pgc/download-results/. The full GWAS summary statistics for the 23andMe datasets will be made available through 23andMe to qualified researchers under an agreement with 23andMe that protects the privacy of the 23andMe participants. Please visit https://research.23andme.com/collaborate/#dataset-access for more information and to apply to access the data. After applying with 23andMe, the full summary statistics including all analysed SNPs and samples in the GWAS meta-analyses will be accessible to the approved researchers. Genotype data are available for a subset of cohorts, including dbGAP accession numbers and/or restrictions, as described in the ‘Cohort descriptions’ section of the supplementary materials.