

Abstract
Inhibiting epigenetic modulators can transcriptionally reactivate transposable elements (TEs). These TE transcripts often generate unique peptides that can serve as immunogenic antigens for immunotherapy. Here, we asked if TEs activated by epigenetic therapy could appreciably increase the antigen repertoire in glioblastoma, an aggressive brain cancer with low mutation and neoantigen burden. We treated patient-derived primary glioblastoma stem cell lines, and an astrocyte and fibroblast primary cell line with epigenetic therapy, and identified treatment-induced, TE-derived transcripts that are preferentially expressed in cancer cells. We verified that these transcripts could produce HLA-I-presented antigens using LC-MS/MS pulldown experiments. Importantly, many TEs were also transcribed, even in proliferating non-tumor cell lines, after epigenetic therapy, which suggests that targeted strategies like CRISPR-mediated activation could minimize potential side-effects of activating unwanted genomic regions. This work presents a cautionary, yet promising, tale for future translational efforts in harnessing treatment-induced TE-derived antigens for targeted immunotherapy.
Introduction
Glioblastoma is a challenging disease with a universally lethal prognosis1. While the brain was once considered an immune-privileged organ, seminal work revealed that immune cells are present in the brain, and that these immune cells might have tumor-controlling functions2,3. Success with immune checkpoint inhibitor immunotherapy in other cancers4 has not yet translated to glioblastomas, where recent trials with glioblastoma patients and anti-PD-1 immunotherapy showed only modest clinical response5,6. One promising avenue to augment anti-tumor immune cell activity is to create cancer vaccines from tumor-specific antigens, which are often derived from noncanonical peptides generated by cancer-specific mutations (called neoantigens)7–10 and presented on human leukocyte antigen (HLA) class I molecules. There are several characterized glioblastoma neoantigens, and several clinical trials suggest that glioblastoma vaccines can be immunogenic11–14. However, glioblastomas have a low mutation burden and low antigen load15, which encouraged the search for other tumor-associated antigens16–18 that are preferentially overexpressed in cancer cells and lowly expressed in normal cells. Still, only a handful of cancer vaccine candidates are available in glioblastoma, and they are often patient-specific. Cancers escape immunosurveillance through immunoediting, which makes single-target vaccines universally ineffective19. Thus, there is a critical clinical need to identify other cancer antigens to augment current anti-tumor immunotherapies.
Epigenetic drugs that inhibit DNA methyltransferases (DNMT) and histone deacetylases (HDAC) have long been used to treat cancer and other diseases20–22. These epigenetic drugs reactivate otherwise “silent” transposable elements and thousands of cryptic promoters to generate double-stranded RNAs that trigger an anti-tumor interferon response23–25. Activated transposable elements can also splice into downstream genes, thus forming chimeric proteins that can be presented as HLA-I antigens26–32 (i.e., TE-chimeric antigens). We therefore reasoned that epigenetic therapy could produce additional antigens in glioblastoma, and that we could adapt CRISPR/Cas9 technology to target specific TEs to activate. Here, we verify that epigenetic drugs can improve immunogenicity of glioblastoma cells and generate bona-fide treatment-induced TE-derived antigens (TI-TEAs) that may provide synergy with immunotherapy approaches. Importantly, we also find that epigenetic drugs can activate TEs in otherwise normal primary cells, but much less so in quiescent cells, a critical discovery that is often overlooked in the TE-derived antigen field with cautionary clinical implications for candidate prioritization. Future efforts to exploit TE-derived antigens for cancer therapy should therefore consider possible off-target consequences arising from activated TEs in non-cancerous cells. In conclusion, we provide a detailed and comprehensive curation of TE-chimeric or TE-derived transcripts, and we further prioritize TE-derived antigens that are preferentially induced in primary cancer cells after epigenetic therapy. This work provides the proof-of-concept for translating TI-TEAs into glioblastoma vaccine targets, and an additional strategy for antigen production that we anticipate can be applied to many other cancer types.
Results
Epigenetic therapy primes GSCs for cancer vaccine approaches
Our first objective was to determine if epigenetic therapy activates transposable elements in primary glioblastoma cells. To test this hypothesis, we treated three patient-derived, primary glioblastoma stem cell lines (GSCs) with the FDA-approved drugs Decitabine (a DNMT inhibitor) and Panobinostat (LBH-589; an HDAC inhibitor) for 6 days (Fig. 1a). We focused on the GSCs because they have tumorigenic potential in vivo and are a model system with relevant oncogenic mutations (Supplementary Fig. 1) present in human glioblastoma tumors33–35. Proliferating, primary adult human fibroblasts and normal astrocytes served as normal tissue controls (additional cell line details available in Supplementary Table 1). We chose non-cytotoxic doses of Decitabine and Panobinostat to prime cancer cells for epigenetic activation (Extended Data Fig. 1a–d), rather than use recommended doses that kill cancer cells. Whole genome bisulfite sequencing showed consistent, genome-wide 5-methylcytosine (5mC) loss between replicates across all samples, with a 21–39% reduction in 5mC in GSCs, and 9% and 12% reduction in proliferating fibroblasts and astrocytes, respectively (Fig. 1b). DNMTi drugs are nucleoside analogs that incorporate into the DNA during cell replication to incapacitate DNA methyltransferases; therefore, DNMTi drug efficacy directly correlates with cell replication rate20–22. Indeed, there were minimal changes in global DNA methylation levels in quiescent fibroblast and astrocyte cells regardless of treatment status, which reflects Decitabine’s specificity for proliferating cells (Supplementary Fig. 2a–c).
Figure 1. Epigenetic therapy reshapes the epigenetic landscape in proliferating GSCs to activate anti-viral response pathways.
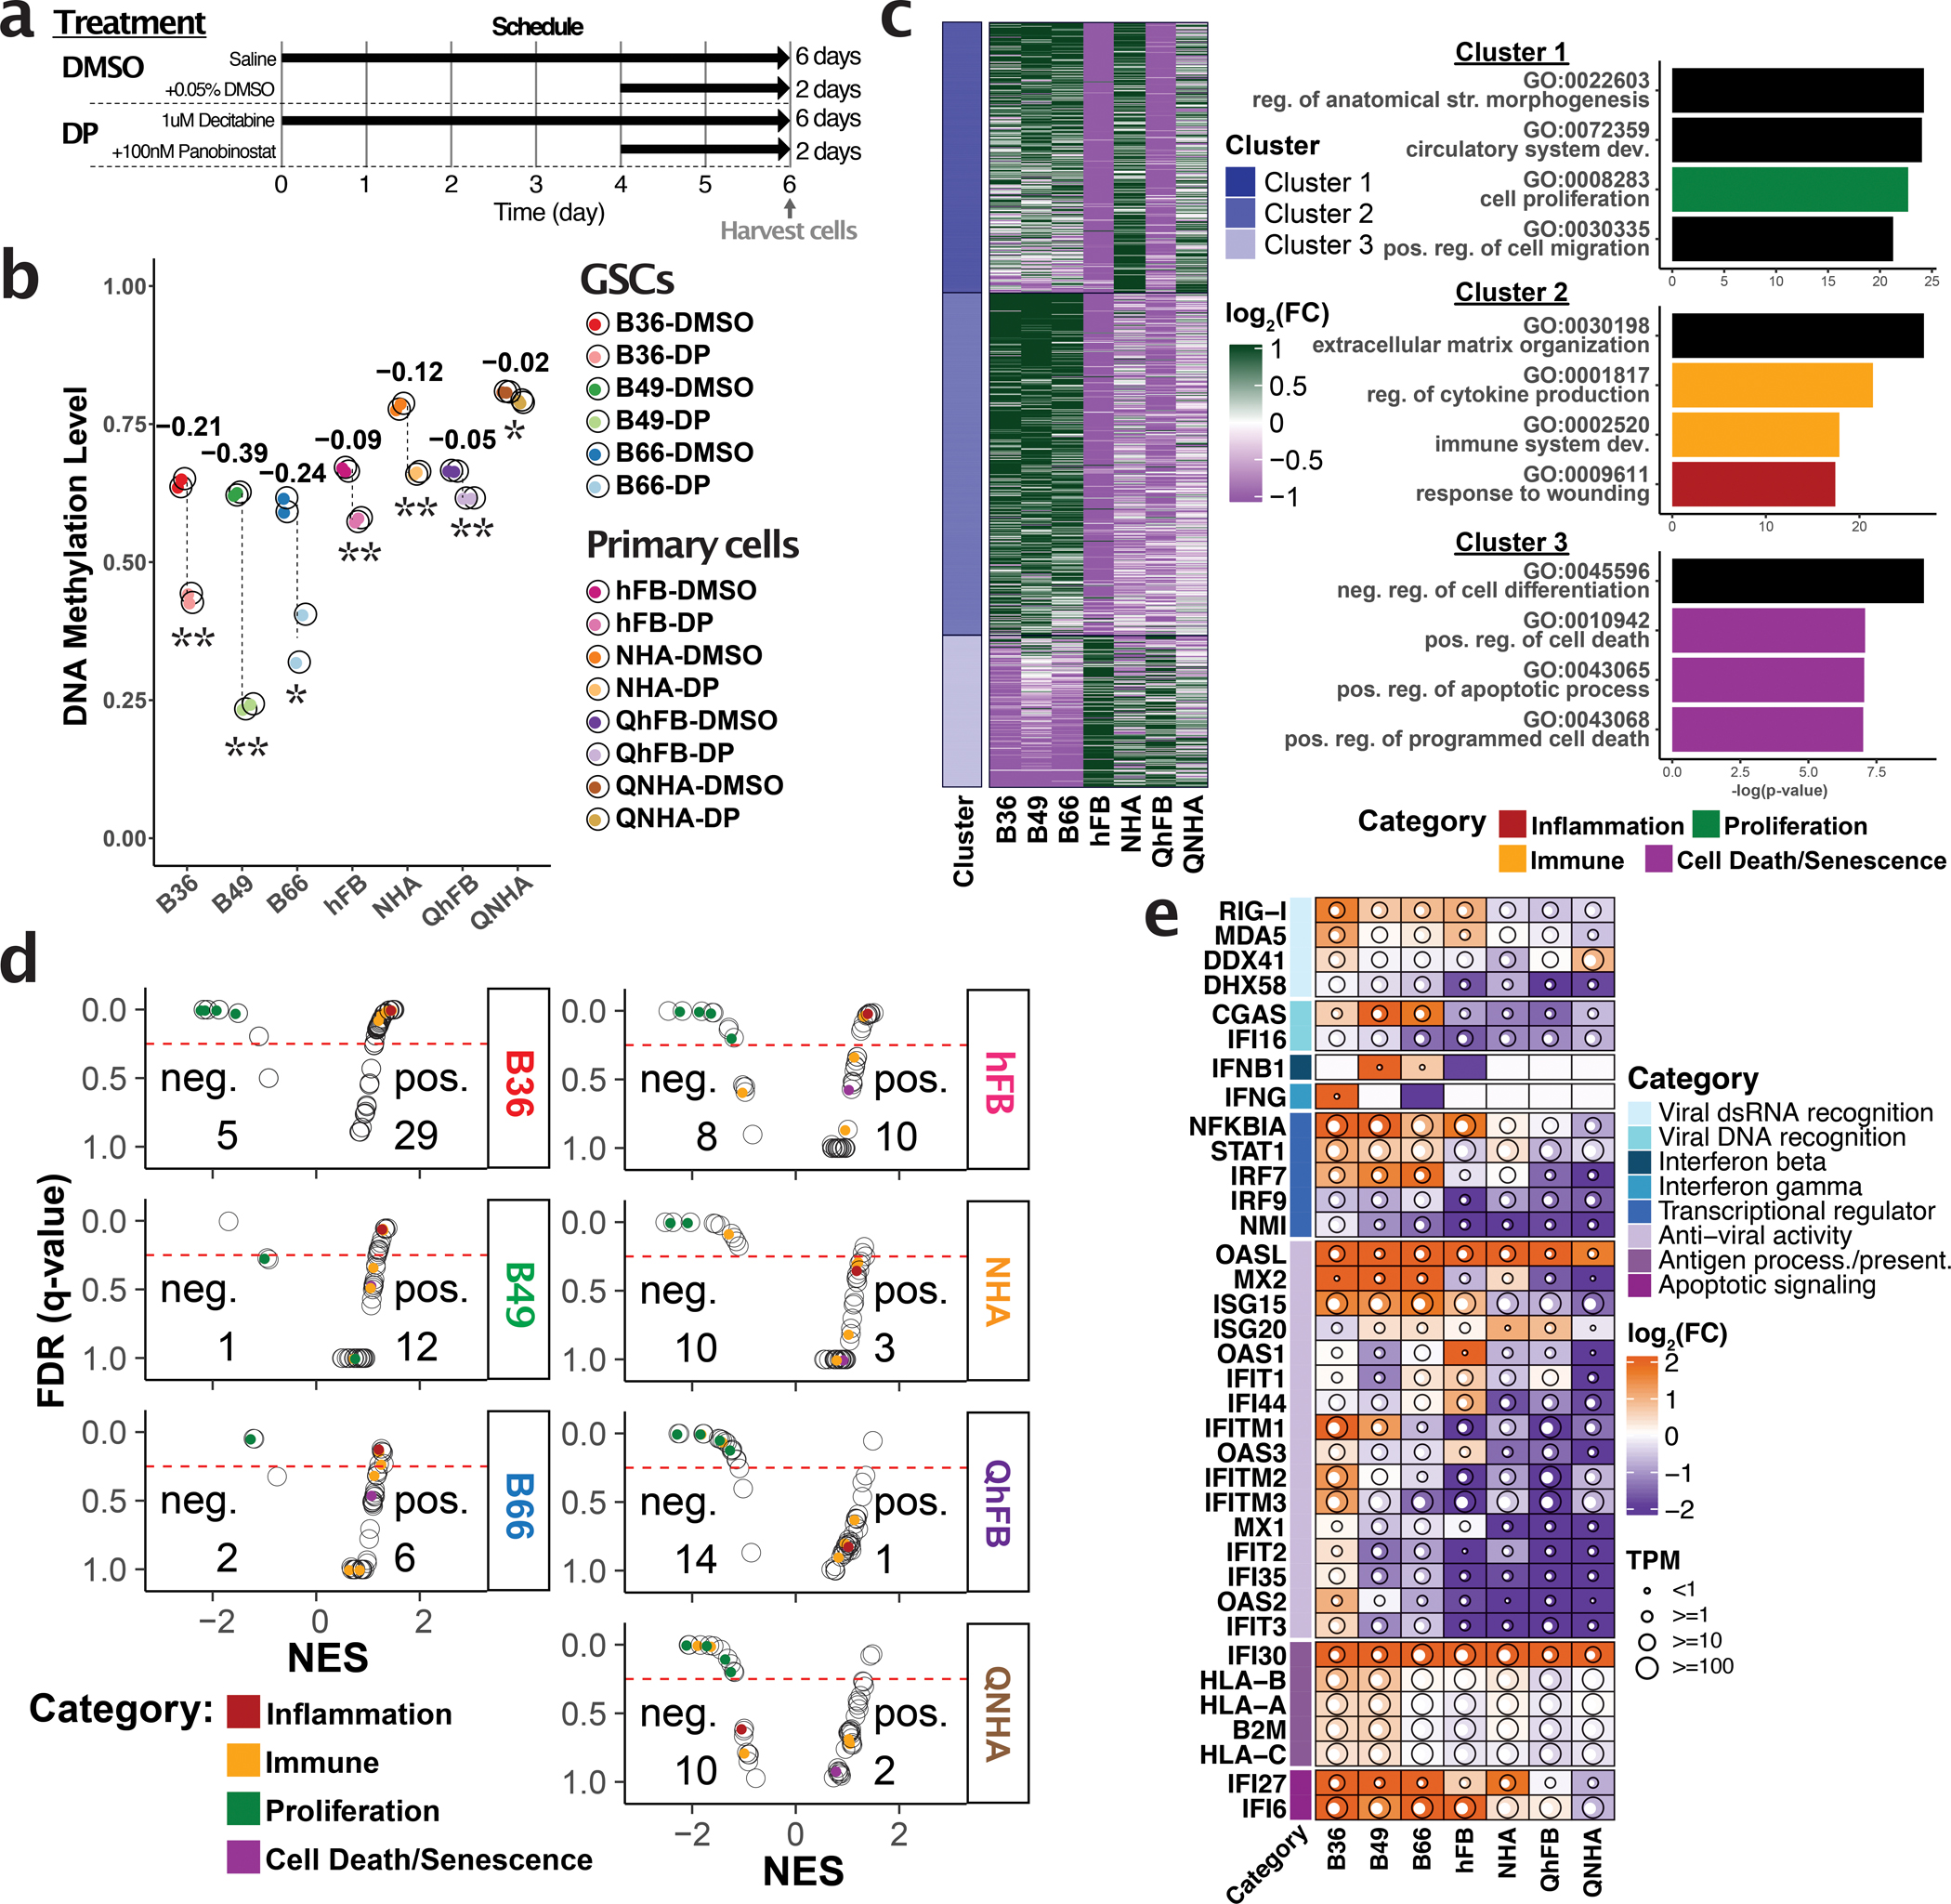
a, In vitro epigenetic drug treatments used in this study. b, Global DNA methylation levels in GSCs or primary cells before and after 6 days of epigenetic therapy (DAC plus Panobinostat) or control (DMSO) treatment. One-sided Student’s t-test is used. P-values are B36: 0.0015, B49: 0.00041, B66: 0.0460, hFB: 0.0014, NHA: 0.0053, QhFB: 0.0036, QNHA: 0.0327. * < 0.05, ** < 0.01 p-value. c, Heatmap and gene ontology enrichment of three clusters of differentially accessible regions (DARs) induced by epigenetic therapy in GSCs and primary cells. Top 10% most variable DARs after epigenetic treatment are grouped into 3 clusters using k-means clustering. Cluster 1 has 2,831 ATAC peaks; Cluster 2 = 3,594 peaks; Cluster 3 = 1,576 peaks. For each cluster, gene ontology biological processes enriched with DARs were defined based on ≥1.5-fold enrichment and <0.05 FDR, using both binomial and hypergeometric tests (one-sided). Four biological processes from the top 20 enriched biological processes (ranked by one-sided binomial p-value) were selected for visualization. d, Gene Set Enrichment Analysis dotplot showing gene pathways that are positively or negatively associated with epigenetic therapy treatment in various cell lines. Gene pathways related to certain biological processes are color-coded. e, Heatmap illustrating log fold-change of antiviral response genes detected by RNA-seq after DAC and Panobinostat treatment.
ATAC-seq experiments showed that combined Decitabine and Panobinostat treatment altered chromatin accessibility in glioblastoma and proliferating fibroblast/astrocyte cell lines (especially in intergenic and intronic regions; Supplementary Fig. 3a–d), but not in quiescent cells. Further analysis of differentially accessible regions revealed neuronal-enriched, glioblastoma-enriched, and primary normal-enriched clusters of open chromatin (Fig. 1c). Interestingly, the glioblastoma-enriched open chromatin regions were proximal to immune-related and cytokine genes (Supplementary Table 2). RNA-seq confirmed that epigenetic therapy specifically up-regulated interferon response genes and antigen-presentation pathways36 in glioblastoma cells, and down-regulated proliferation-related genes in primary fibroblast and astrocyte cells (Fig. 1d,e & Supplementary Fig. 4a,b). These data suggests that epigenetic therapy might enhance the immunogenicity of GSCs while triggering cell cycle arrest in normal cells, thus minimizing drug-induced epigenetic activation in normal cells while maximizing cancer’s sensitivity to immunotherapy.
TEs are reactivated by epigenetic therapy in GSCs
Previous work established that transposable elements are reactivated after epigenetic therapy, and that this reactivation drives anti-viral and interferon responses23–25. To identify transcription start sites in glioblastoma cells after treating them with epigenetic drugs, we used nanoCAGE-seq37,38 to specifically capture the 5’ end of mRNA transcripts. Most of the detected CAGE peaks occurred in promoter regions, and the magnitude of CAGE peaks correlated with gene expression measurements (Supplementary Fig. 5a,b & Supplementary Table 3). After combined Decitabine and Panobinostat treatment, treatment-induced CAGE peaks were enriched in intergenic and intronic regions (Supplementary Fig. 5c), which is consistent with the epigenetic activation of cryptic promoters26. Of the thousands of reactivated promoters and transposable elements in glioblastoma cells, most were from long terminal repeats (LTRs), in particular LTR12 and THE1 subfamilies (Extended Data Fig. 2a,b & Supplementary Fig. 6a,b). These treatment-induced transposable elements are associated with DNA demethylation and increased chromatin accessibility, which suggest that they are bona-fide, treatment-activated promoters (Fig. 2a). Of equal importance is that 48–55% of treatment-induced transposable elements in glioblastoma were also epigenetically activated, with reduced expression in proliferating, normal fibroblasts and astrocytes (but not in quiescent cells; Supplementary Table 3).
Figure 2. Epigenetic therapy generates antigenic chimeric transcripts from TE cryptic promoters.

a, Transcriptomic and epigenetic signatures (heatmap on top and boxplot on bottom) of transposable elements that were up- or down-regulated after epigenetic therapy. 2,616 TEs were up-regulated, and 48 were down-regulated. Box plots show the median (center line), upper and lower quartiles (limits); and 1.5× interquartile range (whiskers). b, Heatmap of TE subfamilies that were enriched in treatment-induced TSS from uniquely-mapped CAGE-seq data. c, TE-chimeric transcript filtering and detection in three glioblastoma cell lines. d, Venn diagram of the TE-chimeric transcripts that are activated across the three glioblastoma cell lines and predicted to generate HLA-bound antigens. e, Comparison of antigenic TE-chimeric transcript expression levels detected in quiescent primary normal human astrocyte (QNHA) and quiescent primary human fibroblast (QhFB) after Decitabine and Panobinostat (DP) treatment. Of 73 antigenic TE-chimeric transcripts, QNHA expresses 1 and 5 transcripts in DMSO and DP conditions, respectively, while QhFB expresses 1 and 13 transcripts in DMSO and DP conditions, respectively.
Endogenous TE peptides as source of therapy-induced antigens
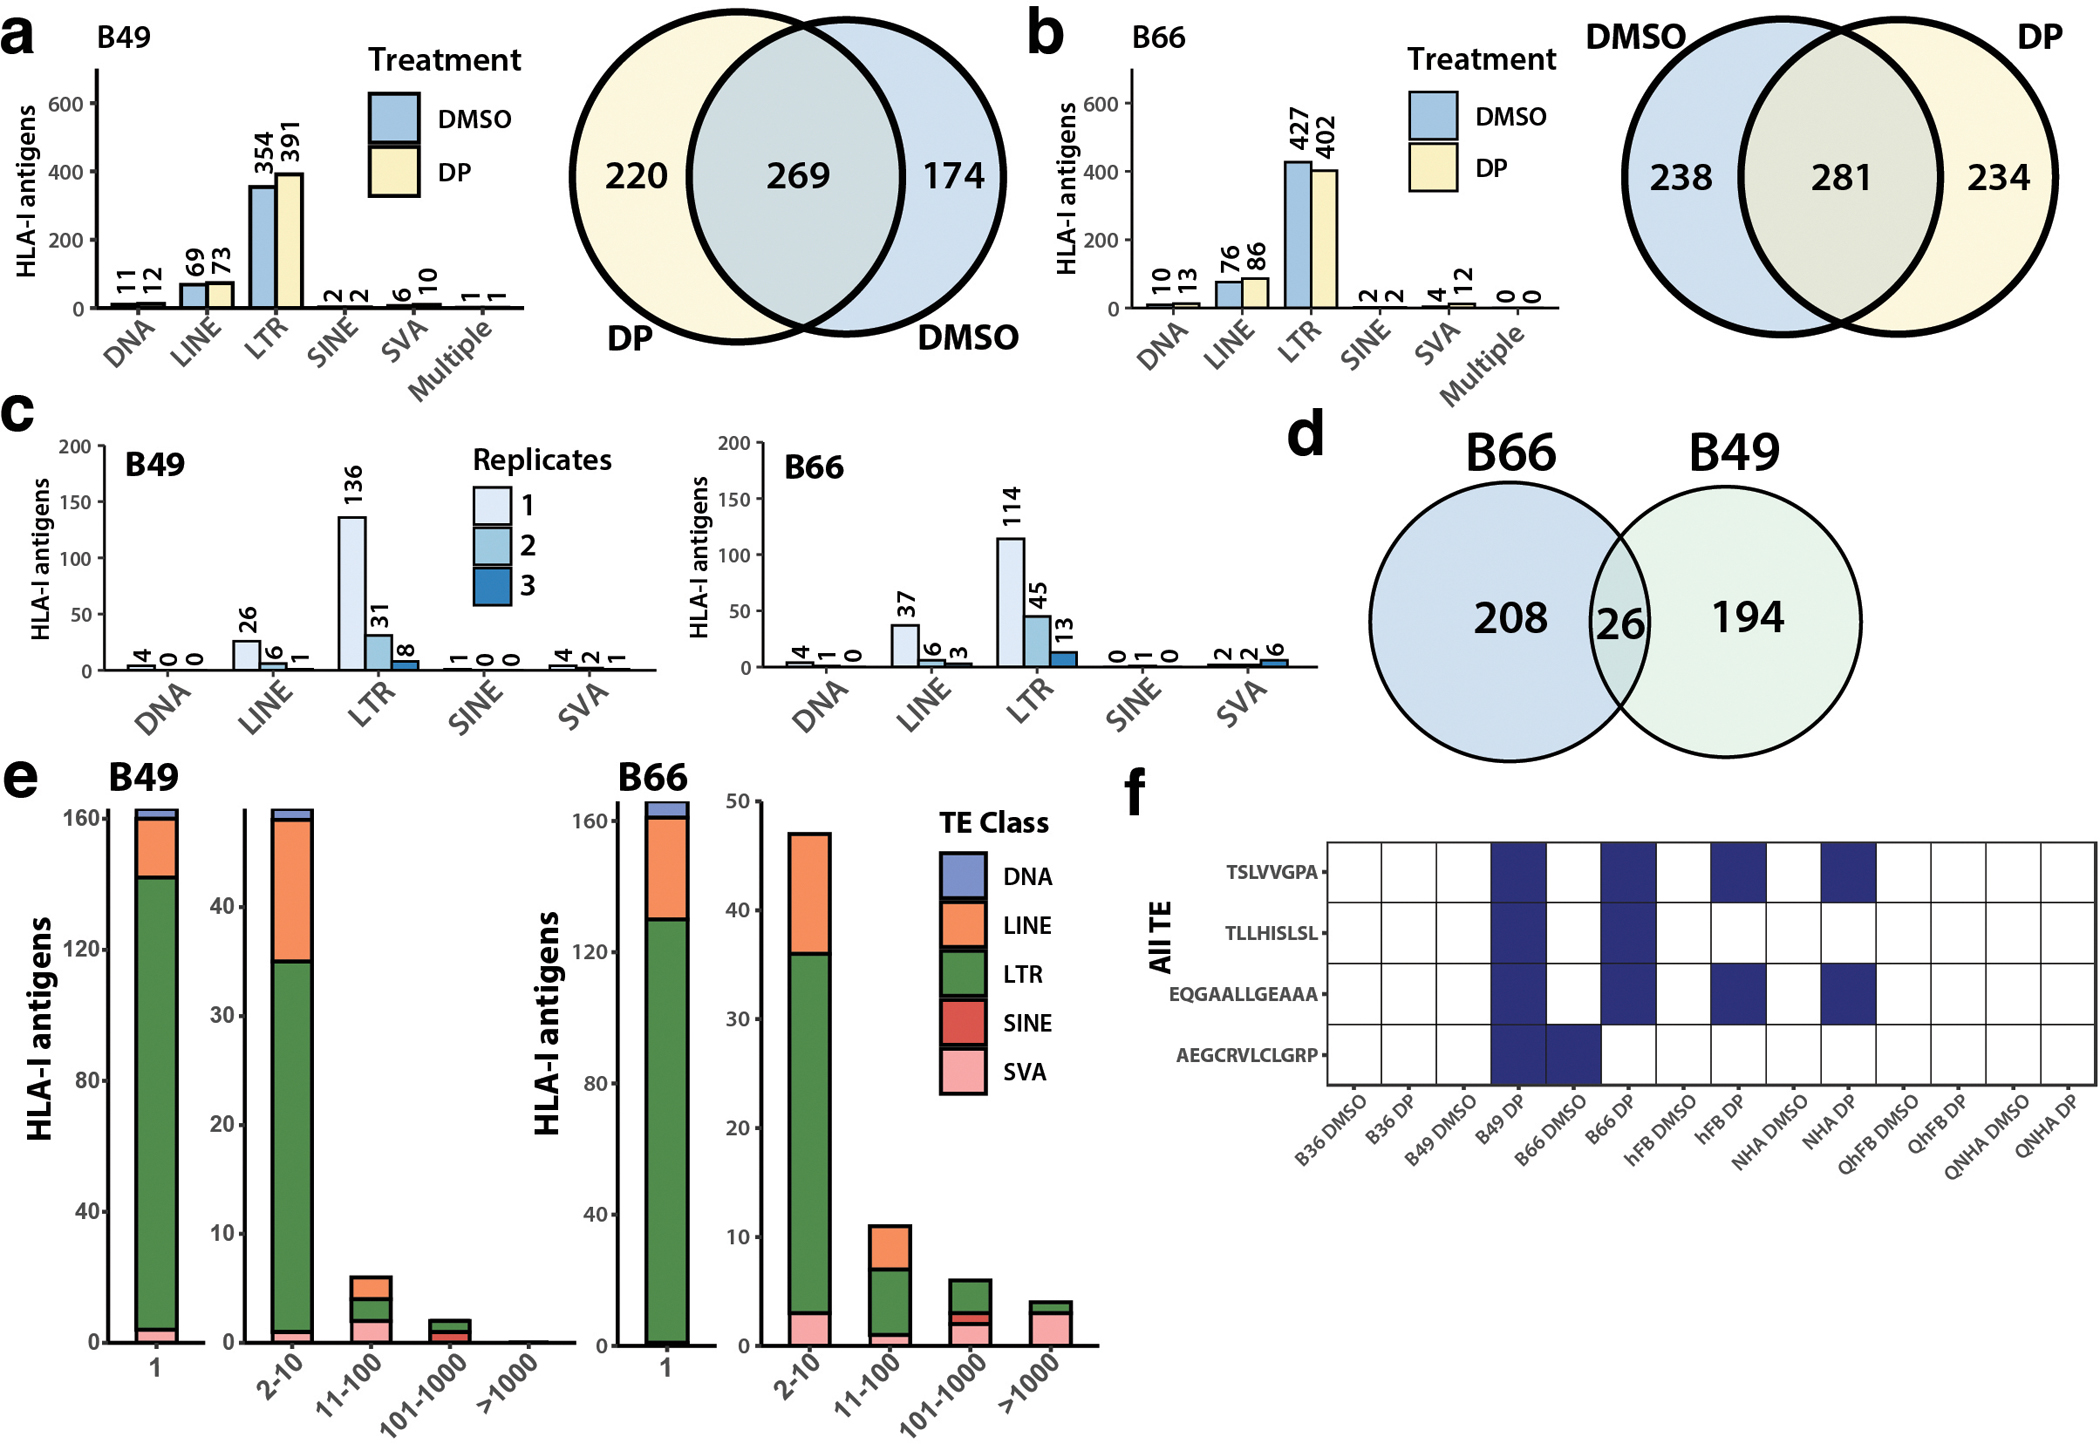
The immense number and repetitive nature of transposable elements can make it difficult to determine antigen specificity32. Endogenous transposable element peptides are often derived from evolutionarily young elements that have an intact open reading frame, and are expressed in glioblastoma cells39,40. With recent interest in using endogenous TE-derived antigens for cancer therapy39–43, it becomes increasingly important to ensure that the target antigens are tumor-specific to minimize off-target toxicity. To explore the specificity of endogenous TE-derived antigens after epigenetic therapy activation, we used SQuIRE44 to rescue and incorporate multi-mapped transcriptomic reads, which were discarded for specificity in the original TE quantification pipeline (Methods). We then quantified transposable element expression in treated glioblastoma, fibroblast, and astrocyte cell lines. This analysis showed that HERVH-int and SVA promoter activity was up-regulated in treated glioblastoma cells (Extended Data Fig. 3 & Supplementary Table 4), consistent with prior reports39. To test for tumor specificity, we first translated all treatment-induced TEs into 6 frames to create a database of potential treatment-induced TE-derived antigens. We then used HLA-pulldown and LC-MS/MS45,46 to verify that treatment-induced TE-derived antigens are processed and presented on HLA-I molecules. We collected three biological replicates of untreated or treated B49 and B66 samples, and used MaxQuant47 and pFind48 to identify a total of ~400–500 putative TE-derived antigens in B49 and B66 glioblastoma cell lines (Extended Data Fig. 4a,b & Supplementary Table 5; treated and untreated cells). After screening each candidate antigen against the nonredundant human proteome to identify unique peptides (BLAST filter), the putative antigen list was reduced to 428 endogenous TE antigens, mostly from SVAs, LTRs or LINEs (Extended Data Fig. 4c, d). We then focused on treatment-induced candidates, and questioned whether these antigens could be generated from other genomic loci to test for specificity. We reverse-translated TI-TEAs into all possible DNA sequences, and screened the human genome for similar sequences (reciprocal BLAT) to identify the genomic loci that could potentially generate the candidate antigen (Extended Data Fig. 4e). This revealed that the majority of SVA-derived antigens can be derived from multiple genomic regions. We subsequently focused on antigens derived from unique loci that had evidence of expression in the sample, which reduced the treatment-induced list from 428 to 4 candidate antigens (Extended Data Fig. 4f). Taken together, these data suggest that endogenous TEs might be a promising source of treatment-induced antigens, but the selection of clinically viable candidates must be carefully screened to minimize potential autoimmune consequences from expression of alternative genomic repetitive regions encoding the same peptide.
TE-chimeric transcripts can produce GSC-enriched antigens
We previously discovered that TE-chimeric transcripts (a subtype of TE-derived transcripts) often initiate from cryptic transposable element promoters in a tumor-specific manner32. These RNA transcripts from TE promoters frequently splice into downstream genes, and therefore add noncanonical amino acids to the expressed protein or create out-of-frame peptides that can act as tumor-specific antigens (Supplementary Fig. 7a). We therefore searched for treatment-induced TE-chimeric transcripts (Methods, Supplementary Fig. 7b) that were preferentially induced in glioblastoma cells after epigenetic treatment, under the pretense that candidate transcripts might be tumor-biased and generate antigens13,14,49. We identified 463 transposable element promoter events involving the expression of 393 genes across the 7 cell lines (Supplementary Table 6). We detected 120, 167, and 171 high-confidence, treatment-induced TE-chimeric transcripts in B36, B49 and B66 glioblastoma cell lines, respectively, mostly initiated from LTR12 and THE1 subfamilies (Fig. 2b,c). While cell line-specific TE-chimeric transcripts were activated by treatment, most of the TE-chimeric transcripts were shared across the three glioblastoma cell lines (Fig. 2d), which suggests that the TE-chimeras could be potential pan-GSC vaccine candidates. We then used CPC250 and Kozak-similarity51 to predict the coding reading frame for all TE-chimeric transcripts (Supplementary Table 7). Only TE-chimeric transcripts that generate chimeric normal, chimeric truncated, or out-of-frame peptides can serve as possible antigen candidates. Applying these selection criteria to the CPC2 and Kozak outputs generated a list of 73 total treatment-induced TE-chimeric transcripts that are preferentially expressed in glioblastoma cells. Based on a NetMHCpan 4.052 analysis, these TE-chimeric transcripts are also predicted to produce an antigenic peptide that can be presented on HLA molecules (Supplementary Fig. 8a–d). Importantly, many of these same treatment-induced TE-chimeric transcripts (and predicted HLA-presented antigens) are also detected in proliferating fibroblasts and astrocytes at much lower expression (Fig. 2a, Supplementary Fig. 8e–g). However, when we looked at the expression of the antigenic transcripts in treated quiescent cells, we saw that only a few were expressed (Fig. 2e). Thus, epigenetic therapy generates hundreds of treatment-induced TE-chimeric transcripts. And while it is difficult to prove tumor-specificity, these treatment-induced transcripts can produce potential tumor-enriched or tumor-associated antigens that could be considered in a pan-glioblastoma vaccine.
Next, we verified that the TE-chimeric transcripts can be translated into peptides using western blots and mass spectrometry. We first looked at the LTR12C-TP63 treatment-induced TE-chimeric transcript that is predicted to generate an in-frame chimeric peptide (Supplementary Fig. 9a). There is no canonical TP63 expression or translation in the B49 and B66 glioblastoma cell lines, with or without epigenetic therapy. Western blots clearly show a LTR12C-TP63 chimera after dual Decitabine and Panobinostat treatment, which corroborate TE-chimeric peptide translation and presence after treatment. (Supplementary Fig. 9b). Next, we reprocessed the HLA-pulldown and LC-MS/MS45,46 results from B49 and B66 cells to screen for treatment-induced TE-chimeric antigen presentation on HLA molecules (Supplementary Fig. 10a & Supplementary Table 8). We performed the BLAST filter for unique peptide identification, and verified that each TE-chimeric antigen (and transcript) was represented in the RNA-seq data (Fig. 3a, b). Finally, we removed those TE-chimeric transcripts and antigens that were already present in the DMSO (negative control) test condition or expressed by quiescent primary cells after epigenetic therapy treatment (tumor-biased). These stringent filtering steps uncovered six glioblastoma TI-TEAs. Furthermore, we generated synthetic peptides for these identified antigens, and verified that the mass spectra matched for 5 out of 6 candidates detected in the HLA-pulldown experiments (Extended Data Fig. 5). Two of these antigens were derived from a single TE-chimeric transcript (LTR9_SCG2) that was detected in B49 and B66 glioblastoma cells (Supplementary Fig. 10b), and most of the putative antigens were detected across multiple experiments (Fig. 3c). One of these peptides (SETKNPPIP) could be derived from multiple TE-chimeric transcripts, indicating that multiple genomic loci can potentially generate the same antigen (Fig. 3d). Interestingly, a majority of the TI-TEAs were derived from noncanonical peptides with out-of-frame ORFs that have completely different amino acid sequences that the canonical protein the TE spliced into (Fig. 3e).
Figure 3. Treatment-induced TE-chimeric antigens are presented on HLA class I molecules on GSCs.
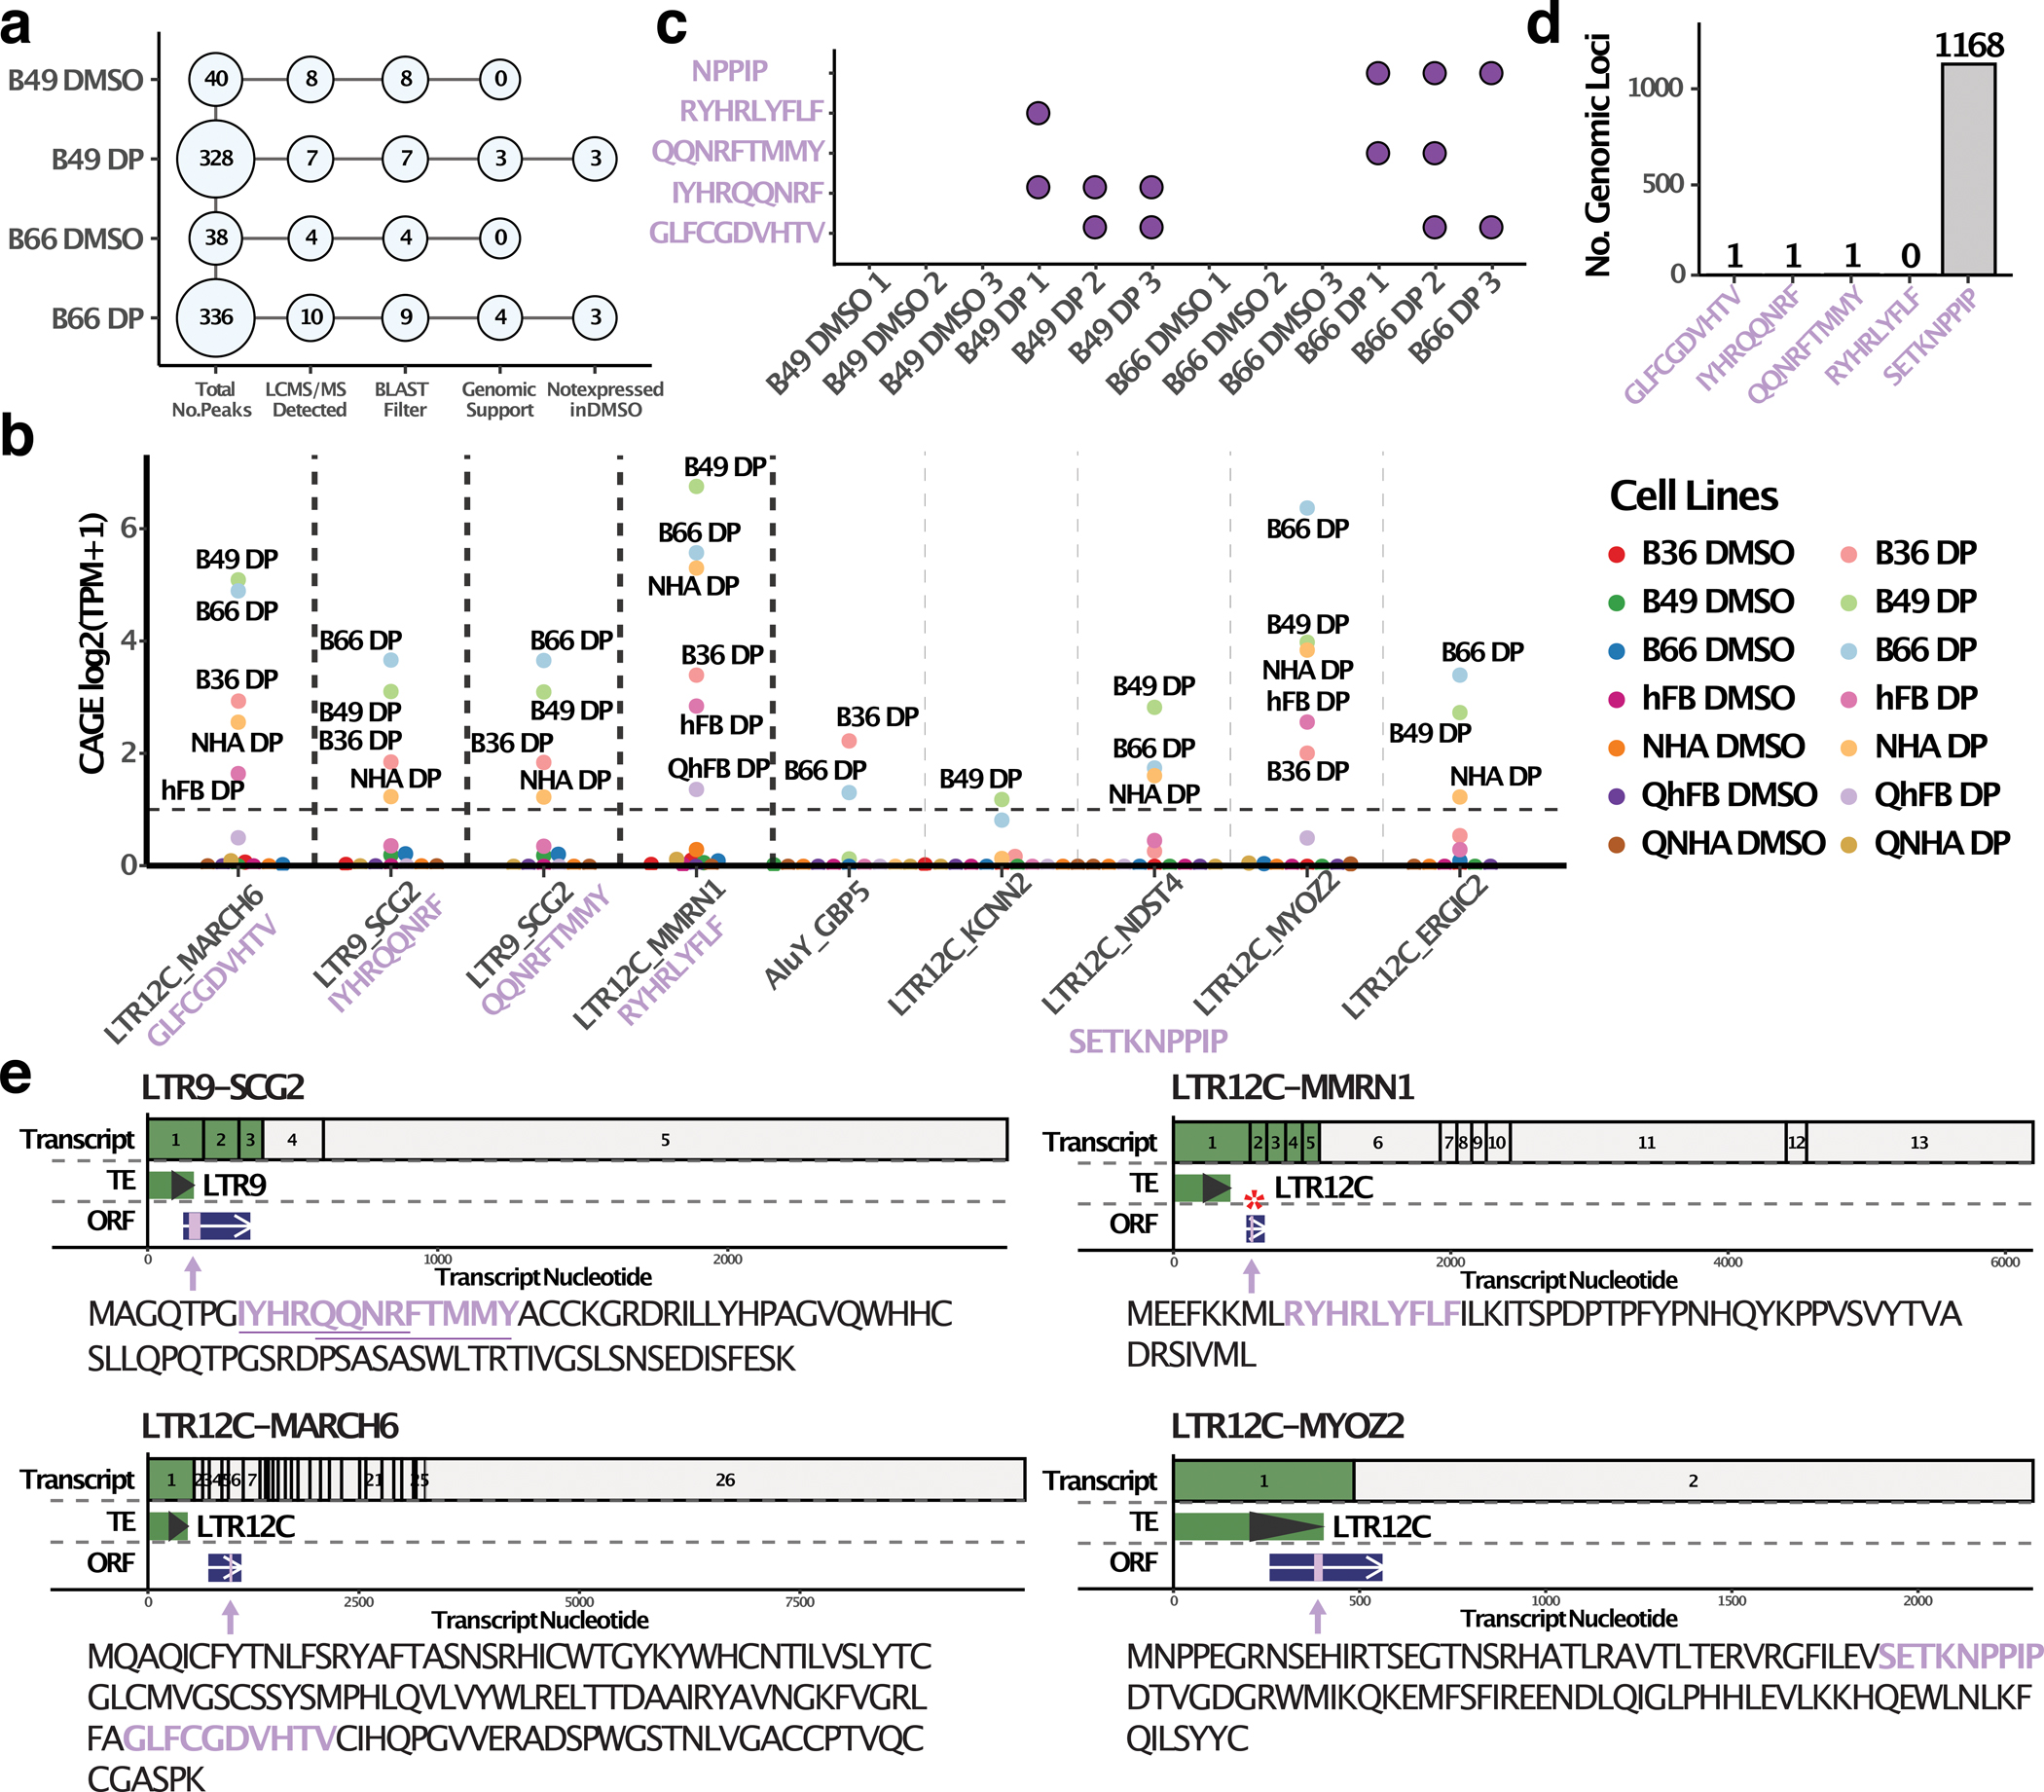
a, Dot plot showing the number of TI-TEAs identified by HLA-pulldown mass spectrometry at each level of filtering. b, CAGE expression dot plot for TI-TEA transcripts originally detected by HLA-pulldown mass spectrometry in the B49 and B66 cell lines. CAGE expression was measured across seven cell lines, with (DP) or without (DMSO) epigenetic drug treatment. On the x-axis, TE-chimeric transcripts are in black font and antigen peptide sequences are in purple. c, GSC samples in which each of the TI-TEA peptides was detected. d, Number of genomic loci that could produce each of the TI-TEAs. e, Transcripts and open reading frame for the five identified TI-TEAs. The top bar is the TE-chimeric transcript; the middle section shows the location of the TE relative to the transcript; and the bottom section (in blue) is the open reading frame with the antigen. The locations of antigens within ORFs are highlighted in lilac color, and red asterisks marks cases where TI-TEAs overlap with splice-junctions. Below each diagram is the ORF sequence, with the antigens detected from HLA-pulldown experiments highlighted in purple font.
To check for potential tumor-specificity of these TI-TEAs, we processed GTEx data, which consists of 11,686 short-read RNA-seq data across 30 normal human adult tissues. We excluded the testis sample (immune-privileged tissue) and focused on 29 normal tissues for detecting our TE-chimeric candidates. We defined “expressed” TE-chimeric transcripts in normal tissue as those transcripts that were detected in >10% of the tissue samples with an expression cutoff of >1 TPM and read support for a unique intron junction of the transcript. Out of the 73 transcripts, 74% (54) of the TE-chimeric transcripts showed no expression in 29 normal tissues. Out of the seven transcripts encoding TI-TEAs, 86% (six) were absent in normal tissues (Supplementary Fig. 11a). One transcript (TCONS_00071043 encoding SETKNPPIP) was detected in one (nerve) normal tissue. Although we did not detect TI-TEAs derived from the remaining 66 TE-chimeric transcripts in the HLA-pulldown results, 73% (48) of these transcripts were absent in the 29 normal tissues (Supplementary Fig. 11b). These data indicate that most treatment-induced TE-chimeric transcripts are not expressed in normal tissues, and are likely to be enriched in either the epigenetic treatment and/or cancer cells. In conclusion, by leveraging proper controls (cells, treatment conditions) and stringent data analysis filters to identify bona fide antigens, we identified 5 TI-TEAs produced by TE-chimeric transcripts that likely will minimize potential off-target effects in cancer vaccine therapeutic approaches.
Long read improves detection sensitivity of TE transcripts
Considering the inherent limitations of TE transcript reconstruction from short-reads53,54, we were motivated to verify the presence of TE-chimeric or endogenous TE transcripts in glioblastoma cells via long-read sequencing. We modified the PacBio ISO-Seq method55 (Methods) to generate full-length transcript libraries from treated and untreated B49 glioblastoma cells. We detected 1,606 TE-derived transcripts in treated cells, and 455 TE-derived transcripts in DMSO-treated cells (Fig. 4a). 1,161 TE-derived transcripts, most of which are derived from LTRs, were treatment-induced (Fig. 4b–d). Interestingly, we noticed that numerous de novo transcript isoforms could be derived from a single TE reactivation event, in that 1,161 treatment-induced TE transcripts are initiated from 557 TEs (average of 2.08 transcripts/TE). When we reprocessed the B49 glioblastoma HLA-pulldown LC/MS-MS data with the long-read TE-derived transcript database, we found 18 high-confidence, treatment-induced TE antigens that were mostly absent in normal tissue (Fig. 4e, Extended Data Fig. 6a, Supplementary Figure 12). Reverse BLAT analysis revealed that 13 of these putative antigens are derived from unique genomic loci, and translating all transcripts detected by long-read sequencing revealed that 9 of the 13 candidates could be translated solely by the treatment-induced TE-derived transcripts (Fig. 4f & Extended Data Fig. 6b–e). Furthermore, long-read sequencing also identified 10 treatment-induced TE antigens from non-exapted, multi-exonic TE-initiated transcripts (Fig. 4g & Supplementary Fig. 13). We verified all 3 antigens from B49 that were originally detected with the TE-chimera analysis from the short-read technology (Fig. 4h). Of note, for two of the candidates, LTR9_SCG2 and LTR12C_MMRN1, long-read sequencing revealed that the majority isoform was from a non-exapted, multi-exonic transcript from the same TE. This highlights the strength of long-read sequencing in differentiating between alternative isoforms from the same promoter. In contrast, we did not detect the three endogenous, treatment-induced TE-derived transcripts that were predicted to produce a TI-TEA (AEGCRVLCLGRP, EQGAALLGEAAA, TSLVVGPA; Fig. 4g), suggesting that short-read sequencing might generate false positives for endogenous TE antigen detection. Long-read RNA sequencing technology is therefore invaluable for isoform resolution and specificity testing of TE-derived transcripts.
Figure 4. Long-read technology detects TE-chimeric transcripts that generate TI-TEAs in B49 GSCs.

a-b, Number of total (a) and unique (b) treatment-induced transcripts initiated from TEs captured by long-read transcriptomics in B49 GSCs. c, Jitter plot illustrating the number of full-length reads detected for each TE-derived transcript. d, Heatmap showing enrichment score of TE subfamilies, which provide treatment-induced cryptic promoters, as determined from long-read technology. e, Dot plot showing the number of treatment-induced TE-derived antigens by HLA-pulldown mass spectrometry at each level of filtering. f, Transcript expression level for TE-derived or canonical gene transcripts that generated TI-TEAs in B49 GSCs. g, Number of treatment-induced TE-chimeric or endogenous TE antigens that have either long-read or short-read RNA-seq expression support. Black and white numbers indicate the number of TE-derived antigens uniquely detected by long-reads or short-reads only, respectively. Grey colored number represents the number of TE-derived antigens that have both long-read and short-read support. h, WashU Epigenome browser view illustrating long-read support for TI-TEA transcript LTR12_MARCH6 (Region: chr5:10353731–10383179), which was originally identified by short-read RNA-seq. Whole genome bisulfite data (WGBS) is represented with grey bars; the height of the blue bar represents DNA methylation levels. Black lines in the WGBS track represent read coverage. ATAC-seq signal is indicated by green peaks. Sense transcripts are colored in dark blue, while anti-sense transcripts are colored orange in nanoCAGE-seq and mRNA-seq tracks.
Targeted induction of TEAs with CRISPRa technology
Next, we wondered if CRISPRa technology could provide more precise activation of TE promoters to minimize antigen specificity issues of epigenetic therapy-induced TEA production. To test this idea, we used the CRISPR-SunTag-TET1CD system56–59 to epigenetically reactivate TEs through targeted DNA demethylation (Fig. 5a). To prioritize the selection of guide RNAs for targeting TEs, we utilized our extensive dataset to conduct comparative analyses of epigenetic and genetic profiles for the two most frequently activated TEs. This revealed critical transcription factor binding sites ~100bp upstream of transcription start site that must be accessible for proper transcriptional activation (e.g., GATA2 in LTR12C and GFX/kaiso in THE1 subfamily; Supplementary Fig. 14 & Supplementary Fig. 15). Therefore, we leveraged this information to design guide RNAs targeting ~150–200bp upstream of the transcription start site for LTR12C_TP63, LTR9_SCG2, and LTR12C_MARCH6 candidates. We observed high on-target DNA demethylation efficiency of the candidate TEs in B49 and B66 glioblastoma stem cells (Fig. 5b–d, Supplementary Fig. 16a–d). The targeted DNA demethylation was sufficient to reactivate the TE cryptic promoters (Fig. 5e–i). LTR12C_TP63 CRISPRa GSCs expressed TE-chimeric TP63 protein, which we confirmed by immunoprecipitation and LC-MS/MS experiments (Supplementary Fig. 17a,b). However, TP63 is involved in DNA damage response and can be artificially triggered by CRISPR activity. Therefore, we performed qPCR experiments to quantify LTR12C_TP63 and canonical TP63 expression in the LTR12C_MARCH6 and LTR9_SCG2 CRISPRa GSC samples; if TP63 expression is a technical artifact, then TP63 should also be induced in these other two CRISPRa-engineered GSCs. However, we did not detect LTR12C-derived TP63 and canonical TP63 expression in the LTR12C_MARCH6 and LTR9_SCG2 CRISPRa GSC samples (Supplementary Fig. 17c). These data suggest that TP63 expression in the LTR12C_TP63 CRISPRa GSCs is directly linked to the DNA methylation loss on LTR12C, which drives the LTR12C_TP63 isoform transcription. Thus, it is possible to use CRISPRa technology to resurrect TE promoter activity and generate tumor-specific TE-derived antigens in glioblastoma.
Figure 5. Targeted epigenetic reactivation of TE-chimeric transcripts with CRISPRa technology.

a, Schematic illustration of the CRISPR-SunTag-TET1CD system for targeted TE DNA demethylation and transcriptional reactivation. b-d, Line graphs showing DNA methylation levels across TEs in DMSO-treated, DAC & Panobinostat-treated, or CRISPRa-targeted GSC cells for SCG2 (b), MARCH6 (c), and TP63 (d) candidates. e, Schematic explaining qPCR primer specificity of canonical or TE-chimeric transcript detection. f-h, Relative fold-change of SCG2 (f), MARCH6 (g), and TP63 (h) candidate isoforms in CRISPRa-targeted GSCs compared to control treatment (DMSO). Data are the average from three biological replicates. Error bars are the standard error. P-values are from a two-tailed Student’s t-test. i, TP63 and beta-actin protein abundance in B49 and B66 GSCs across different treatment conditions. Western blots were repeated at least two times.
Discussion
Cancer immunotherapy is predicated on the idea that cancerous cells harbor somatic mutations that generate tumor-specific peptides or antigens, which can then be recognized by the host immune system or targeted immunotherapy. However, glioblastomas have relatively few somatic mutations and infiltrating T-cells relative to other tumor types. Thus, systemic immune checkpoint inhibitors have been largely ineffective in early clinical trials, with no obvious improvement in clinical outcomes5,6. Here, we explore whether epigenetic therapy can generate another source of tumor-specific antigens to augment personalized cancer vaccine strategies. This approach is predicated on the fact that cancer is just as much an epigenetic disease as it is a genetic disease, and that epigenetic drugs targeting DNA methyl transferases (Decitabine) or histone deacetylases (Panobinostat) can reactivate or silence the genome in a tumor-specific manner. With this in mind, we were intrigued by the fact that transposable elements (TEs) constitute ~50% of the mammalian genome, are often reactivated in cancers or by epigenetic therapies, and can splice into downstream genes to create underappreciated HLA-I antigens26–28,32,60 that will not be identified by whole-exome sequencing pipelines currently used to identify glioblastoma neoantigens. Indeed, we show here that treating patient-derived glioblastoma cells with epigenetic therapy increases cancer-intrinsic immunogenicity that alone might provide synergistic clinical benefit with current chemotherapy, radiation therapy, or immunotherapy18,61. In addition, epigenetic therapy drugs can reactivate hundreds of cryptic TE promoters to generate endogenous TE and TE-chimeric transcripts, some of which are translated into high-confidence, bona fide HLA-I-presented antigens in glioblastoma and acute myeloid leukemia31,39,42. Unfortunately, we did not have access to the peripheral blood samples collected from the patients from whom the GSCs were derived to assess the T cell recognition of TI-TEAs. However, several recent studies provide evidence of TE-derived antigens stimulating T cells in humans, including the works of Smith et al.43, Bonté et al.40, Krishnamurthy et al.62, Takahashi et al.63, Wang-Johanning et al.64, Mullins et al.65, Cherkasova et al.66, Bonaventura et al.41, and Merlotti et al.30. Additionally, in patients with myelodysplastic syndrome, there is direct evidence that DNA hypomethylating agents can reactivate specific long terminal repeats (LTRs) or human endogenous retroviruses (HERVs), leading to the production of treatment-induced HERV peptides that stimulate T cell recognition42. Recently, Goyal et al. revealed that T cells from two AML patients treated with Decitabine can recognize HLA-I and HLA-II antigens produced by treatment-induced ERV-chimeric transcripts31. Therefore, there is mounting evidence supporting the antigenicity and immunogenicity of TE-derived peptides in humans.
There is a rising interest in clinically translating TE-derived antigens into cancer vaccines. However, one of the most important (but easily overlooked) outcomes of this study is that epigenetic therapy might also reactivate TEs in normal cells (i.e., fibroblasts and astrocytes), resulting in endogenous or TE-chimeric transcripts that are translated into predicted HLA class I antigens. In this study, ~50% of the treatment-induced, glioblastoma TE-chimeric transcripts were lowly expressed in proliferating normal fibroblasts and astrocytes that were likewise treated with Decitabine and Panobinostat. However, ~70% of the TE transcripts (and potential TE-derived antigens) were transcriptionally silent in quiescent fibroblasts and astrocytes, and normal tissues. Therefore, while we and many others are enthusiastic about the clinical potential of TE-derived antigens, we recommend prioritizing TI-TEAs similar to tumor-enriched or tumor-associated antigen selection strategies and be conscientious about evaluating for potential on-target off-tumor consequences.
Many epigenetically reactivated TEs are evolutionarily young67,68, with significant sequence similarity. Thus, TE expression and antigen detection are typically averaged at the subfamily level and regardless of whether a start codon is detected or not, making it difficult to identify a unique genomic locus. We addressed this problem by taking advantage of long-read sequencing technology to resolve TE transcript isoforms, and found evidence that a conventional short-read pipeline generated false positive hits. Thus, long-read sequencing is more specific and powerful than short-read sequencing for detecting endogenous TE-derived peptides and TE-chimeric transcripts that can potentially produce promising vaccine targets.
Lastly, we recognize that the Decitabine and Panobinostat doses used here were chosen to maximize TE reactivation, and may not conform to existing epigenetic therapy regimens. It is therefore possible that different doses or treatment regimens will reactivate a different set of TEs in vitro or in vivo, and between cancerous and normal cells. This question speaks to the broader translational problem of using systematic therapy to treat a localized disease. One path forward could be to perform targeted delivery of epigenetic drugs to the tumor69,70 (or resected brain region), thus minimizing TE reactivation in adjacent normal tissue. Another exciting alternative is to use CRISPR technology71–73 to increase the expression of targeted, endogenous loci that generate immunogenic antigens. We show here that CRISPRa methods can in fact trigger the expression of TE-chimeric transcripts that produce TI-TEAs. For poly-valent immunotherapy, though, it becomes necessary to activate multiple loci. An inherent challenge of multiplex, gene-targeted CRISPR methods is related to the number of guide RNAs that must be introduced into a cell to activate the target genes antigens74. We suggest that TEs and TE-derived antigens are unique in this regard, because one (or a few) well-designed guide RNA can target multiple TEs75. Indeed, guide RNA selection tools are now available to target TE sequences for precise or broad epigenetic modulation of TEs76. In conclusion, we provide evidence that TI-TEAs can provide an important source of tumor-enriched antigens that may be leveraged for cancer vaccines, especially in those tumors with low mutation burden.
Methods
Cell culture and chemicals
All human study research related to this study has been approved by the Institutional Review Board (IRB #201211019 and #201409046, Washington University School of Medicine). All participants donating tissue signed informed consent prior to tissue banking. Patient-derived glioblastoma stem cell lines were established and cultured as previously described77,78, and are available by request from authors. In brief, culture plates were treated with 0.01% poly-L-orinithine (Sigma-Aldrich, P2533) at 37°C for 20 minutes. The plates were washed twice with PBS and then treated overnight with 1:200 diluted laminin solution (Sigma-Aldrich, L2020) at 37°C. After incubation, laminin was aspirated out and replaced with glioblastoma stem cell media [Neurocult NSA media (STEMCELL Technologies, 05750), 1x Glutamax (ThermoFisher Scientific, 35050061), 0.25x penicillin-streptomycin (ThermoFisher Scientific, 15140122), 75 ug/ml bovine serum albumin (Sigma-Aldrich, A8412), 1x B-27 supplement (ThermoFisher Scientific, 17504001), 1x N-2 supplement (ThermoFisher Scientific, 17502001), 2 ug/ml heparin (Sigma-Aldrich, H3149), 20 ng/ml FGF (PeproTech, 100–18B), and 20 ng/ml EGF (PeproTech, 315–09)]. Half of the cell culture media was exchanged with fresh media every two days. Glioblastoma cells were harvested with Accutase (Sigma-Aldrich, A6964).
Primary adult human fibroblasts (ATCC, PCS-201–012) were a generous gift from Andrew Yoo (Washington University, St. Louis), and were cultivated in published fibroblast media79. Primary normal human astrocytes (ScienCell, 1800) were grown in Astrocyte medium (ScienCell, 1801). Half of the cell culture media was refreshed every 2–3 days. HEK293T cells were purchased from ATCC and cultured in DMEM media (Genesee Scientific, 25–500) supplemented with 10% FBS (Genesee Scientific, 25–525) and 1x penicillin-streptomycin. Adult human fibroblasts were harvested with 0.25% Trypsin-EDTA (ThermoFisher Scientific, 25200056), while human astrocytes were harvested with Accutase. To induce quiescent states, primary cells were contact inhibited for 14 days before use.
Decitabine (LC laboratories, D-3899) was prepared as a 22 mM solution in saline (0.9% NaCl). Panobinostat (BioVision, 1612) was dissolved in DMSO at 2 mM concentration. Approximately 3–4 × 10⁵ GSCs or primary cells were plated in 10cm plates for epigenetic drug treatments. Culture media was refreshed every two days following the dosing schedule outlined in Fig. 1A.
RNA-seq and nanoCAGE-seq construction and analysis
RNA-seq and nanoCAGE-seq libraries were generated as detailed previously28. In brief, mRNA was extracted from harvested cells using a Dynabeads mRNA DIRECT Purification Kit (ThermoFisher Scientific, 61011). We enriched for 5’-capped mRNA by digesting purified mRNAs with Terminator exonuclease (Lucigen, TER51020) as per the manufacturer’s instructions. The enriched mRNA pool was then processed for downstream mRNA or nanoCAGE-seq library construction.
For RNA-seq library analysis, we followed the adaptor trimming and alignment pipeline outlined in Shah et al32. For differentially expressed gene (DEG) analysis as a function of epigenetic treatment, we counted reads per gene using featureCounts80 (v2.0.0) with “-O -s 1 --primary -p”, and identified DEGs using DESeq2 with ≥4 fold-change and <0.05 BH-adjusted-p value cutoff (two-sided negative binomial Wald test). SQuIRE44 (v0.9.9.92) was used to quantify loci-level transposable element expression from the trimmed reads. We converted loci-level expression in FPKM to TPM by
For nanoCAGE-seq library analysis, we used the previously published script55. Briefly, trimmed reads were aligned to the hg38 assembly using the same parameters as for the RNA-seq pipeline. Properly paired and uniquely mapped reads (useable reads) were converted into CAGE transcription start site (CTSS) format. We used CAGEr (v1.28.0) to call consensus CAGE peaks with ≥0.3, and discarded likely false positive peaks with <0.15 unencoded G read fraction38.
For Gene Set Enrichment Analysis (GSEA)81,82 of DEGs, genes were ranked by fold-change and p-value from DESeq2 outputs83. Ranked genes were compared against the Hallmark gene sets using the default GSEA parameters and an FDR cutoff of 0.25.
PacBio full-length transcript isoform library construction and analysis
We adapted the PacBio ISO-Seq library preparation method55,84 to use nanoCAGE template switching oligo (TSO) and a custom poly-dT RT primer for reverse transcription. Briefly, we isolated poly-A RNAs from ~2 × 10⁶ glioblastoma B49 cells with a Dynabeads mRNA purification kit (ThermoFisher Scientific, 61011). ~150 ng of purified poly-A RNA was then used as input for PacBio library preparation. Poly-A RNAs were treated with Terminator 5’-phosphate-dependent exonuclease (Lucigen, TER51020) to digest RNAs without a proper 5’ mRNA cap. These long-read transcriptomic libraries were sequenced using the PacBio Sequel II platform.
We used the previously published pipeline55 (https://github.com/twlab/LRCAGE) for PacBio library circular consensus sequencing (CCS) reads. Briefly, CCS reads were processed with lima (version 1.11.0) and isoseq3 refine (v3.1.2) to trim PCR primers and discard concatemers. After trimming TSO and 15As at 3’ ends, trimmed reads ≥250bp long were considered full-length non-chimeric (FLNC) reads. FLNC reads were aligned to the reference genome using minimap285 (v2.17-r974-dirty) with junc-bed input and the option “--secondary=yes -C5 --MD -uf -G 589824 -N 20”. We used a realign function to reduce spurious alignment at splice junctions, and retained primary, non-supplementary, and uniquely mapped reads. After deduplication, we filtered out reads with >3 soft-clip at either end of the read. TranscriptClean86 (v2.0.2) was used to correct sequencing errors, and error-corrected reads were annotated with TALON87 (v4.4.2) using GENCODE basic annotation (v.25). TALON outputted a list of transcript models, and we used the consensus CAGE peaks to obtain transcripts with complete 5’ ends.
Enrichment analysis of treatment-induced transposable elements
Treatment-induced transposable elements (TI-TEs) were defined as TEs overlapping CAGE peaks with the following characteristics: 1) Upregulated upon epigenetic treatment (≥4 fold change, <0.05 BH-adjusted p-value by DESeq2, two-sided negative binomial Wald test), and 2) ≥0.3 TPM in the treated condition but <0.3 TPM in DMSO-treated condition. The enrichment scores for TE subfamilies of TI-TEs were calculated as described in the previous studies25,88.
We removed TE subfamilies if there were 1) < 2 mean enrichment scores of all samples; 2) < 200 elements; or 3) zero enrichment scores in more than 5 samples. ComplexHeatmap89 was used to visualize the enrichment scores across TE subfamilies.
TEProf2 pipeline and HLA antigen prediction
We assembled the RNA-seq bam files using stringtie90,91 v1.3.3, and then used the previously developed TEProf2 pipeline for annotating TE-gene chimeric transcripts (https://github.com/twlab/TEProf2Paper). After running TEProf2 to identify TE-chimeric transcripts from short-read RNA-sequencing data, we overlapped TE-chimeric transcripts with transposable elements that had CAGE promoter peaks identified in the previous analysis. We retained those TE-chimeric transcripts that had a corresponding CAGE peak with the transposable element in the same strand. For subsequent steps, we used CAGE promoter peak expression in TPM as the expression of each isoform. A cutoff of 1.0 TPM was used for determining if a transcript was present in a particular sample. The previously mentioned criteria were used for identifying isoforms that were activated by the epigenetic drugs. Through TEProf2, we predicted the open reading frame of the transcript using Kozak context and CPC2. These open reading frames were used to create the following categories of predicted translation product: 1) none, 2) normal, 3) truncated, 4) chimeric normal, 5) chimeric truncated, and 6) out-of-frame. Those transcripts encoding a chimeric normal, chimeric truncated, or out-of-frame product were considered “antigenic candidates” for subsequent steps. A fasta format file was generated for antigenic proteins from TE-chimeric transcripts for mass spectrometry analysis.
With the RNA-sequencing data, we used OptiType92 to identify the HLA alleles of the GSC, fibroblast, and astrocyte cell lines. The fasta of the antigenic transcripts as well as the HLA alleles were used to predict binding of potential antigens to HLA use NetMHCpan v4.093. Antigens that originated from transcripts that were labeled as being present according to the CAGE data and a cutoff of 1.0 TPM were considered potential presented antigens for a particular cell line sample.
Long-read transcript annotation and expression analysis
From the TALON output, we obtained a GTF of the transcript isoforms that were detected and the read counts per sample in the B49 cell line. We annotated the GTF from TALON using the reference-guided mode of the TEProf2 pipeline. All transcripts that started from within a TE were included in this analysis. Reads were pooled between replicates, and a transcript was present in a sample if it had at least 2 reads supporting it in the sample from the TALON output. We translated the long-read transcripts in all 3 frames and took all open reading frames that were at least seven amino acids in length. These ORF sequences were combined with the uniport reference to create a custom database that was used for the mass-spectrometry data analysis.
HLA-I antigen pull-down and LC-MS/MS processing for antigen detection
We used a published protocol45,46 for HLA-I antigen pulldown, with slight modifications that are detailed below. First, we harvested anti-HLA-I antibodies from W6/32 (ATCC HB-95) growth medium, and crosslinked them onto Protein A-sepharose 4B beads (ThermoFisher Scientific, 101041) with dimethylpimelimedate. Approximately 3–5 × 10⁸ GSC cells were lysed on ice with gentle swirling (10 minute intervals) for 1 hour in a modified lysis buffer consisting of 0.3% sodium deoxycholate, 0.75% IGEPAL CA-630, 0.2mM iodoacetamide, 1mM EDTA, 1:200 Protease Inhibitors Cocktail, 1mM Phenyl-methylsulfonyl fluoride, and 1% octyl- β-D glucopyranoside in PBS. Lysed samples were centrifuged at at 21,000x g at 4°C for 1 hour, and the clarified supernatant processed through a 0.5 ml protein A-sepharose 4B bead column (Poly-Prep chromatography columns; Bio-Rad, 7311550) to remove endogenous antibodies. Next, we transferred the flow-through to a 1 ml W6/32-proteinA bead column, and repeated the binding step 3 times on the same column to maximize HLA-antigen capture. Bead-bound antigens were eluted in acetic acid. The eluates were dried in a vacuum centrifuge (ThermoFisher Scientific, SPD1030PI), and stored a −20°C.
HLA-I-bound antigens were identified by LC-MS/MS on an Orbitrap Fusion Lumos (Thermo Fisher Scientific, San Jose, CA) mass spectrometer. Antigens were first reconstituted in 0.1% formic acid, and then injected onto a C18 column (25 cm × 75 μm, Reprosil-Pur 120 C18-AQ, 1.9 μm; ESI Source Solutions, Woburn, MA) using a Dionex Ultimate 3000 RSLCnano HPLC (Thermo Fisher Scientific, San Jose, CA). Antigens were separated by HPLC at 0.3 μl/min, gradually transitioning from 0.1% formic acid in water (mobile phase A) to 0.1% formic acid in acetonitrile (mobile phase B) according to the following program: 0–4 min, 2% B; 4–8 min, 2–10% B; 8–83 min, 10–25% B; 83–97 min, 25–50% B; 97–105 min, 50–98%). MS/MS was performed in data-dependent acquisition mode using the Top Speed method. We set the MS1 mass range to 300 to 1800 m/z with a resolution of 120,000 (200 m/z). The automatic gain control target was set to 1,000,000 ions with a maximum fill time of 50 msec. Ions with charge state of 1 to 4 were selected for precursor selection. For the MS/MS portion, the selected precursors were fragmented in the Orbitrap using an isolation window of 1.6 m/z, a resolution of 30,000 (200 m/z), and maximum fill time of 54 msec. We set the fragmentation energy in HCD MS/MS to 32% to maximize fragmentation of charge state 1 precursors. Lastly, we performed dynamic exclusion with a repeat count of 1, exclusion duration of 15 sec, and a minimum 10000 MS ion counts for triggering MS/MS. For analysis of synthetic peptides, the same acquisition method was utilized and an inclusion list containing all the m/z of the 6 peptides was added to the method in order to collect high quality MS/MS scans of the 6 peptides.
We analyzed the LC MS/MS data from HLA-I pulldown using MaxQuant Version 1.6.3.4 and pFind3 (v3.1). Maxquant parameters were set to: unspecific enzyme digestion; no protein-level FDR; peptide FDR of 5%; peptide length limit between 8 and 15 AA; and maximum peptide mass = 1500 Da. pfind3 parameters were set to: Non-Specific NoEnzyme U_C enzyme setting with up to 3 missed cleavages; precursor tolerance of ± 20ppm; fragment tolerance of ± 20ppm; open search enabled with acetyl (proteinN-term) and Oxidation(M) variable modifications; labeling-none labeling type; and 1 multiplicity.
For synthetic peptide detection, we used the Thermo Xcalibur Qual Browser (v4.3.73.11) to manually select synthetic peptide spectra, and avoid oxidized peptides. We used the Universal Spectrum Explorer tool94 (https://www.proteomicsdb.org/use/) for the spectrum comparison of endogenous and synthetic peptides. To confidently identify an endogenous peptide, it needs to meet the criteria of all five following metrics in its spectrum: (1) more than 6 out of 8 or 9 fragmented bonds are detected in both endogenous and synthetic peptides; (2) both endogenous and synthetic peptides exhibit the same charge state; (3) the pattern and distribution of ions detected from endogenous and synthetic peptides show remarkable similarity on the m/z versus relative abundance plot, particularly among the top 3 ions with the highest relative abundance; (4) all the detected ions demonstrate an error of less than 10 ppm, indicating a high level of confidence in ion detection; (5) > 0.7 Pearson’s Correlation Coefficient (PCC) and > 0.6 Spectral Angle (SA) further support the validity of the identifications.
Endogenous TE transcript and antigen analysis
First, upregulated TE subfamilies across the GSC cell lines were identified. Then, all instances of that particular TE subfamily were translated in all 6 frames (3 forward and 3 reverse) using a custom script and a minimum peptide length of 7 AA. The unique amino acid sequences were then labeled and exported as a fasta file. We then created a reference database from the TE reading frames, the TE-chimeric antigen candidate protein sequences, and Uniprot, and used MaxQuant and pFind3 to identify HLA-I-bound peptides as described above.
We used SQuIRE and featureCounts to quantify TE expression. FPKM units from SQuIRE were converted into TPM units by , where was a specific TE locus. For featureCounts, uniquely aligned reads to each TE locus were normalized as , where was a specific TE locus. For a TE to be expressed in a sample, it had to either have a TPM of 1 or a CPM of 0.5.
CRISPR-mediated targeted TE activation
Guide RNAs (gRNAs) were designed to be ≤ 200bp away from the putative transcription start sites with high binding affinity and specificity (Supplementary Table 9). gRNA sequences were then cloned into a gRNA delivery plasmid (Addgene, #57824), and co-transfected with two other lentivirus packaging plasmids (psPAX2 (Addgene, #12260) and pMD2.G (Addgene, #12259)) into HEK293T using the PEI transfection method. Media supernatants were collected 48 hrs after transfection, and lentiviruses recovered using a Lenti-X concentrator (Takara Bio, 631231). Lentivirus preparations were also made from plasmids encoding dCas9 (Addgene, #60903) and TET1 (Addgene, #184439). GSCs were then co-transduced with the three types of lentiviruses using 8μg/ml polybrene (Sigma-Aldrich, TR-1003), followed by centrifuge at 900xg for 90mins. 4–7 days after transduction, GSCs were harvested with Accutase solution (Sigma-Aldrich, A6964) and subjected to flow cytometry to collect triple positive GSCs with all three components (dCas9, TET1, gRNA) expressed for subsequent profile.
TP63 Western blots
GSCs were collected using Accutase (Sigma-Aldrich, A6964), and washed in ice-cold PBS before being denatured with Blue Loading Buffer Pack (Cell Signaling Technology, 7722S). Cell lysates were then loaded into Novex 10% Tris-Glycine Mini Gels (Thermo Fisher Scientific, XP00100BOX), and separated by gel electrophoresis at 120 V for 2h. Gels were blocked for 1hr in 1x TBST + 5% BSA, and then incubated at 4°C overnight with anti-TP63 antibody (Abcam # ab124762, 1:1000) and anti-beta actin antibody (Cell Signaling Technology # 4967L, 1:1000). The next day, we gels were incubated at room temperature for 1 hr with anti-rabbit secondary antibody (Cell Signaling Technology, 7074; 1:2,000 dilution) with three washes of 1x TBST in between. Images were acquired on a Thermo Fisher Scientific myECL Imager (Thermo Fisher Scientific, 62236).
IP/MS experiment for LTR12C_TP63
Cell lysates are prepared with around 10 million CRISPRa treated cells extracted with 1X RIPA buffer (Cell Signaling Technology, #9806) substituted with 1x PMSF (Cell Signaling Technology, #8553) and Protease Inhibitor Cocktail (abcam, ab65400). For immunoprecipitation, 3.9μg of anti-TP63 antibody (Proteintech Cat # 12143–1-AP) was first bound to 1.5mg Protein A Dynabeads (Thermo, Cat #10001D) at room temperature for 30 minutes. Beads-antibody complex are later resuspended with aforementioned cell lysate and incubated at 4˚C, overnight with rotation. Beads were then washed with 0.01% Tween-20 in PBS before elution with 0.2M glycine, pH2.6 at room temperature for 30 minutes. Eluate was immediately neutralized with same volume of 1M Tris, pH 8.0. The neutralized eluates were concentrated for smaller volumes using a vacuum centrifuge (Thermo Fisher Scientific, SPD1030PI) before running on an SDS-PAGE (Thermo, XP00100BOX). Gel bands were cut at expected size range and submitted for Mass Spectrometry.
Gel band was washed in Ammonium Bicarbonate (AmBic)/Acetonitrile (ACN) and reduced with dithiothreitol. Cysteines were alkylated with iodoacetamide. Gel band was washed in AmBic/ACN prior to adding 1 ug trypsin for overnight incubation at 37 °C. Supernatant contain peptides was saved into a new tube. Gel was washed with gentle shaking in 50% ACN/5% FA, and supernatant was added to the saved peptide solution. Wash step was repeated each by 80% ACN/5% FA, and 100% ACN, and all supernatant was saved then subject to the speedvac dry. Dried peptides were reconstituted with 0.1% FA in water and injected onto a Neo trap cartridge coupled with an analytical column (75 μm ID x 50 cm PepMapTM C18, 2 μm). Samples were separated using a linear gradient of solvent A (0.1% formic acid in water) and solvent B (0.1% formic acid in ACN) over 60 minutes using a Vanquish Neo UHPLC System coupled to an Orbitrap Eclipse Tribrid Mass Spectrometer (Thermo Fisher Scientific). Data acquisition was performed using the DIA acquisition method, and subsequent data processing was carried out using Spectronaut 18 (Biognosys AG). Raw file was searched via directDIA analysis against the human SwissProt database in addition to the sequence of a custom protein (LTR12C-TP63). The identification filter was set to FDR 0.01 for PSM, Peptide, and Protein Group.
Extended Data
Extended Data Fig. 1. GSCs are treated with non-cytotoxic doses of Decitabine and Panobinostat.

a, Schematic of the different treatment conditions used to quantify GSC proliferation and cell death rates after epigenetic drug treatment. b, Control and treated GSCs at end of treatment (Day 6) show minimal differences in cell confluency; bright-field microscope images obtained at 10x magnification. c, Cell viability after epigenetic drug treatment. Live cells were identified by flow cytometry after propidium iodide (PI) and annexin staining. d, Example gating strategy for detection of live cells (that is B36 GSCs) after treatment. Population of PI-negative and annexin-negative were identified as live cells. The experiment was repeated twice with similar results.
Extended Data Fig. 2. LTR family of transposable elements are enriched to be activated by epigenetic therapy treatment.

a, Number of treatment-induced TSSs annotated with TE class. b, Number of treatment-induced TSSs annotated with LTR subfamilies. Nine LTR subfamilies that have at least 15 treatment-induced TSSs in at least one cell line are shown. Treatment-induced TSSs are defined as CAGE peaks with the minimum expression level of 0.3 TPM. Others = peaks not in TEs.
Extended Data Fig. 3. SQuIRE rescues transcriptional activation of young endogenous transposable elements.

Heatmap showing enrichment score of TE subfamilies that were activated by epigenetic therapy, after rescuing multi-mapped reads in CAGE-seq (left) and RNA-seq (right) with SQuIRE.
Extended Data Fig. 4. Expression of the unique genomic loci of endogenous TE antigens detected by HLA-pulldown mass spectrometry.
a, Number of HLA-I antigens detected across TE classes for the Decitabine+Panobinostat (DP) and DMSO treated B49 cell line (left), and Venn diagram comparing the antigens found between the two treatments (right). b, Same as (a) but for B66 cells. c, Number of endogenous TE antigens detected across replicate experiments in DP-treated B49 cells (top) and B66 cells (bottom). d, Venn diagram of the endogenous TE antigens found in DP-treated B49 and B66 cell lines. e, Stacked bar plot with the x-axis being the number of genomic loci found for a particular antigen using BLAT, and the y-axis is the number of HLA-I antigens detected after epigenetic therapy in B49 (left) and B66 (right) cell lines. The fill color is the class of transposable elements that the peptides originate from. f, Heatmap of the endogenous TE antigens with genomic support that are derived from unique loci. The highlighted boxes are the samples in which they are detected as being expressed.
Extended Data Fig. 5. Synthetic peptide validation of TI-TEAs.

Mass spectra for antigen candidates discovered in the HLA-pulldown mass spectrometry experiments (top), and the mass spectra of a corresponding synthetic peptide with same sequence (bottom). The TI-TEA candidate and synthetic peptide mass spectra for LISNSWGQAI did not match, so the LISNSWGQAI peptide was excluded from the TI-TEA candidate list. GLFCGDVHTV synthetic peptide was generated with a carbamidomethyl cysteine after consideration of cysteine alkylation caused by iodoacetamide in lysis buffer.
Extended Data Fig. 6. Long-read technology detects additional TE-derived antigens presented on HLA molecules in GSCs.

a, RNA-seq expression levels of TI-TEA encoding transcripts detected by long-read sequencing in GTEx samples. Peptide sequences for TI-TEAs are on the left of the heatmap. Transcript IDs are on the right of the heatmap. * denotes immune-privileged tissue. b, Detection of TE-derived antigens from HLA-pulldown experiments from B49 GSCs. Purple circles signify TE-derived antigens that were specifically induced by epigenetic therapy with genomic support. c, The number of genomic loci that encode each of the TI-TEAs, as estimated by BLAT. The value of 0 genomic loci represents antigens derived from TE-exon junctions of TE-derived transcripts. d, The number of coding transcripts that encode each of the TI-TEAs based on long-read data. For each TI-TEA, there is a primary transcript that originates from a treatment-induced TE. The coding transcripts are categorized into four groups based on their 5′ overlap with TE and their exon overlap with annotated genes; Same TE - transcripts derived from the same TE as the primary transcript; Alternative TE - transcripts that originate from a different TE compared to the primary transcript; Canonical Gene Isoform - transcripts that overlap with exons of annotated genes; Alternative Non-TE - transcripts that do not derive from a TE and do not overlap with exons of annotated genes. e, Transcript expression levels for TE-derived or other types of transcripts that are predicted to create 18 TI-TEAs in B49 GSCs.
Supplementary Material
Acknowledgements
We would like to thank J. Hoisington-López and M.L. Jaeger from The Edison Family Center for Genome Sciences & Systems Biology (CGSSB) for assistance with sequencing; B. Koebbe and E. Martin from CGSSB for data processing; M. Savio, M. Patana & D. Schweppe from the Siteman Flow Cytometry Core for FACS-related expertise; D. Mao from A. Kim lab for expertise pertaining to GSCs; D. Chandler from Van Andel Institute for valuable editorial help with the manuscript. T.W. was funded by NIH grants 5R01HG007175, U24ES026699, and U01HG009391 and the American Cancer Society Research Scholar grant RSG-14–049-01-DMC. N.M.S. was a Howard Hughes Medical Institute (H.H.M.I.) Medical Research Fellow. H.J.J. was supported by a grant from NIGMS (no. T32 GM007067). The LC–MS/MS work from the Proteomics & Mass Spectrometry Facility at the Danforth Plant Science Center for synthetic peptide analysis is supported by National Science Foundation grant DBI-1827534 for the acquisition of the Orbitrap Fusion Lumos LC–MS/MS. Mass Spectrometry analyses of the IP/MS experiment for LTR12C_TP63 were performed by the Mass Spectrometry Technology Access Center at the McDonnell Genome Institute (MTAC@MGI) at Washington University School of Medicine, supported by the Diabetes Research Center/NIH grant P30 DK020579, Institute of Clinical and Translational Sciences/NCATS CTSA award UL1 TR002345, and Siteman Cancer Center/NCI CCSG grant P30 CA091842.
Footnotes
Competing Interests Statement
A.H.K. is a consultant for Monteris Medical. All other authors declare no competing interests.
Code Availability
All custom scripts are available on Github (https://github.com/twlab/epitherapy_induced_antigen_GBM) and Zenodo (https://zenodo.org/records/11869293).
Data Availability
All omics data generated during this study are available through the Gene Expression Omnibus (GEO) (GSE227059) and Proteomics Identification Database (PRIDE) (PXD039893). GTEx transcriptomic data were obtained with dbGAP approval through the accession number phs000424.v9.p2.
References
- 1.Davis ME Glioblastoma: Overview of disease and treatment. Clin J Oncol Nurs 20, 1–8 (2016). [DOI] [PMC free article] [PubMed] [Google Scholar]
- 2.Tivnan A, Heilinger T, Lavelle EC & Prehn JHM Advances in immunotherapy for the treatment of glioblastoma. J Neurooncol 131, 1–9 (2017). [DOI] [PMC free article] [PubMed] [Google Scholar]
- 3.Brown CE et al. Regression of glioblastoma after chimeric antigen receptor T-cell therapy. New England Journal of Medicine 375, 2561–2569 (2016). [DOI] [PMC free article] [PubMed] [Google Scholar]
- 4.Gong J, Chehrazi-Raffle A, Reddi S & Salgia R Development of PD-1 and PD-L1 inhibitors as a form of cancer immunotherapy: A comprehensive review of registration trials and future considerations. Journal for ImmunoTherapy of Cancer vol. 6 Preprint at 10.1186/s40425-018-0316-z (2018). [DOI] [PMC free article] [PubMed] [Google Scholar]
- 5.Arrieta VA et al. ERK1/2 phosphorylation predicts survival following anti-PD-1 immunotherapy in recurrent glioblastoma. Nat Cancer 2, (2021). [DOI] [PMC free article] [PubMed] [Google Scholar]
- 6.Cloughesy TF et al. Neoadjuvant anti-PD-1 immunotherapy promotes a survival benefit with intratumoral and systemic immune responses in recurrent glioblastoma. Nat Med 25, (2019). [DOI] [PMC free article] [PubMed] [Google Scholar]
- 7.Yarchoan M, Johnson BA, Lutz ER, Laheru DA & Jaffee EM Targeting neoantigens to augment antitumour immunity. Nat Rev Cancer 17, 209–222 (2017). [DOI] [PMC free article] [PubMed] [Google Scholar]
- 8.Sahin U & Türeci Ö Personalized vaccines for cancer immunotherapy. Science (1979) 359, 1355–1360 (2018). [DOI] [PubMed] [Google Scholar]
- 9.Finn OJ The dawn of vaccines for cancer prevention. Nat Rev Immunol 18, 183–194 (2018). [DOI] [PubMed] [Google Scholar]
- 10.Hu Z, Ott PA & Wu CJ Towards personalized, tumour-specific, therapeutic vaccines for cancer. Nat Rev Immunol 18, 168–182 (2018). [DOI] [PMC free article] [PubMed] [Google Scholar]
- 11.Lim M, Xia Y, Bettegowda C & Weller M Current state of immunotherapy for glioblastoma. Nat Rev Clin Oncol 15, 422–442 (2018). [DOI] [PubMed] [Google Scholar]
- 12.Johanns TM et al. Detection of neoantigen-specific T cells following a personalized vaccine in a patient with glioblastoma. Oncoimmunology 8, 1–10 (2019). [DOI] [PMC free article] [PubMed] [Google Scholar]
- 13.Keskin DB et al. Neoantigen vaccine generates intratumoral T cell responses in phase Ib glioblastoma trial. Nature 565, 234–239 (2019). [DOI] [PMC free article] [PubMed] [Google Scholar]
- 14.Hilf N et al. Actively personalized vaccination trial for newly diagnosed glioblastoma. Nature 565, 240–245 (2019). [DOI] [PubMed] [Google Scholar]
- 15.Charoentong P et al. Pan-cancer Immunogenomic Analyses Reveal Genotype-Immunophenotype Relationships and Predictors of Response to Checkpoint Blockade. Cell Rep 18, 248–262 (2017). [DOI] [PubMed] [Google Scholar]
- 16.Dutoit V et al. Exploiting the glioblastoma peptidome to discover novel tumour-associated antigens for immunotherapy. Brain 135, (2012). [DOI] [PubMed] [Google Scholar]
- 17.Winograd EK, Ciesielski MJ & Fenstermaker RA Novel vaccines for glioblastoma: Clinical update and perspective. Immunotherapy vol. 8 Preprint at 10.2217/imt-2016-0059 (2016). [DOI] [PMC free article] [PubMed] [Google Scholar]
- 18.Brown NF, Carter TJ, Ottaviani D & Mulholland P Harnessing the immune system in glioblastoma. British Journal of Cancer vol. 119 Preprint at 10.1038/s41416-018-0258-8 (2018). [DOI] [PMC free article] [PubMed] [Google Scholar]
- 19.Lybaert L et al. Challenges in neoantigen-directed therapeutics. Cancer Cell 41, 15–40 (2023). [DOI] [PubMed] [Google Scholar]
- 20.Egger G, Liang G, Aparicio A & Jones PA Epigenetics in human disease and prospects for epigenetic therapy. Nature 429, 457–463 (2004). [DOI] [PubMed] [Google Scholar]
- 21.Valdespino V & Valdespino PM Potential of epigenetic therapies in the management of solid tumors. Cancer Manag Res 7, 241–251 (2015). [DOI] [PMC free article] [PubMed] [Google Scholar]
- 22.Sharma S, Kelly TK & Jones PA Epigenetics in cancer. Carcinogenesis vol. 31 27–36 Preprint at 10.1093/carcin/bgp220 (2009). [DOI] [PMC free article] [PubMed] [Google Scholar]
- 23.Chiappinelli KB et al. Inhibiting DNA Methylation Causes an Interferon Response in Cancer via dsRNA Including Endogenous Retroviruses. Cell 162, 974–986 (2015). [DOI] [PMC free article] [PubMed] [Google Scholar]
- 24.Roulois D et al. DNA-Demethylating Agents Target Colorectal Cancer Cells by Inducing Viral Mimicry by Endogenous Transcripts. Cell 162, 961–973 (2015). [DOI] [PMC free article] [PubMed] [Google Scholar]
- 25.Brocks D et al. DNMT and HDAC inhibitors induce cryptic transcription start sites encoded in long terminal repeats. Nat Genet 49, 1052–1060 (2017). [DOI] [PMC free article] [PubMed] [Google Scholar]
- 26.Attig J et al. LTR retroelement expansion of the human cancer transcriptome and immunopeptidome revealed by de novo transcript assembly. Genome Res (2019) doi: 10.1101/gr.248922.119. [DOI] [PMC free article] [PubMed] [Google Scholar]
- 27.Burbage M et al. Epigenetically controlled tumor antigens derived from splice junctions between exons and transposable elements. Sci Immunol 8, eabm6360 (2023). [DOI] [PubMed] [Google Scholar]
- 28.Jang HS et al. Transposable elements drive widespread expression of oncogenes in human cancers. Nat Genet 51, 611–617 (2019). [DOI] [PMC free article] [PubMed] [Google Scholar]
- 29.Liang Y, Qu X, Shah NM & Wang T Towards targeting transposable elements for cancer therapy. Nat Rev Cancer 24, 123–140 (2024). [DOI] [PubMed] [Google Scholar]
- 30.Merlotti A et al. Noncanonical splicing junctions between exons and transposable elements represent a source of immunogenic recurrent neo-antigens in patients with lung cancer. Sci Immunol 8, (2023). [DOI] [PubMed] [Google Scholar]
- 31.Goyal A et al. DNMT and HDAC inhibition induces immunogenic neoantigens from human endogenous retroviral element-derived transcripts. Nat Commun 14, 6731 (2023). [DOI] [PMC free article] [PubMed] [Google Scholar]
- 32.Shah NM et al. Pan-cancer analysis identifies tumor-specific antigens derived from transposable elements. Nat Genet 55, (2023). [DOI] [PubMed] [Google Scholar]
- 33.Pollard SM et al. Glioma Stem Cell Lines Expanded in Adherent Culture Have Tumor-Specific Phenotypes and Are Suitable for Chemical and Genetic Screens. Cell Stem Cell 4, 568–580 (2009). [DOI] [PubMed] [Google Scholar]
- 34.Lee J et al. Tumor stem cells derived from glioblastomas cultured in bFGF and EGF more closely mirror the phenotype and genotype of primary tumors than do serum-cultured cell lines. Cancer Cell 9, 391–403 (2006). [DOI] [PubMed] [Google Scholar]
- 35.Aum DJ et al. Molecular and cellular heterogeneity: The hallmark of glioblastoma. Neurosurg Focus 37, 1–11 (2014). [DOI] [PubMed] [Google Scholar]
- 36.Liu M et al. Vitamin C increases viral mimicry induced by 5-aza-2’-deoxycytidine. Proc Natl Acad Sci U S A 113, (2016). [DOI] [PMC free article] [PubMed] [Google Scholar]
- 37.Salimullah M, Mizuho S, Plessy C & Carninci P NanoCAGE: A high-resolution technique to discover and interrogate cell transcriptomes. Cold Spring Harb Protoc (2011) doi: 10.1101/pdb.prot5559. [DOI] [PMC free article] [PubMed] [Google Scholar]
- 38.Cumbie JS, Ivanchenko MG & Megraw M NanoCAGE-XL and CapFilter: an approach to genome wide identification of high confidence transcription start sites. BMC Genomics 16, 597 (2015). [DOI] [PMC free article] [PubMed] [Google Scholar]
- 39.Kong Y et al. Transposable element expression in tumors is associated with immune infiltration and increased antigenicity. Nat Commun (2019) doi: 10.1038/s41467-019-13035-2. [DOI] [PMC free article] [PubMed] [Google Scholar]
- 40.Bonté PE et al. Single-cell RNA-seq-based proteogenomics identifies glioblastoma-specific transposable elements encoding HLA-I-presented peptides. Cell Rep 39, (2022). [DOI] [PubMed] [Google Scholar]
- 41.Bonaventura P et al. Identification of shared tumor epitopes from endogenous retroviruses inducing high-avidity cytotoxic T cells for cancer immunotherapy. Sci Adv 8, (2022). [DOI] [PMC free article] [PubMed] [Google Scholar]
- 42.Saini SK et al. Human endogenous retroviruses form a reservoir of T cell targets in hematological cancers. Nat Commun (2020) doi: 10.1038/s41467-020-19464-8. [DOI] [PMC free article] [PubMed] [Google Scholar]
- 43.Smith CC et al. Endogenous retroviral signatures predict immunotherapy response in clear cell renal cell carcinoma. Journal of Clinical Investigation 128, (2018). [DOI] [PMC free article] [PubMed] [Google Scholar]
- 44.Yang WR, Ardeljan D, Pacyna CN, Payer LM & Burns KH SQuIRE reveals locus-specific regulation of interspersed repeat expression. Nucleic Acids Res (2019) doi: 10.1093/nar/gky1301. [DOI] [PMC free article] [PubMed] [Google Scholar]
- 45.Bassani-Sternberg M Mass spectrometry based immunopeptidomics for the discovery of cancer neoantigens. Methods in Molecular Biology 1719, 209–221 (2018). [DOI] [PubMed] [Google Scholar]
- 46.Bassani-Sternberg M et al. Direct identification of clinically relevant neoepitopes presented on native human melanoma tissue by mass spectrometry. Nat Commun 7, (2016). [DOI] [PMC free article] [PubMed] [Google Scholar]
- 47.Tyanova S, Temu T & Cox J The MaxQuant computational platform for mass spectrometry-based shotgun proteomics. Nat Protoc 11, 2301–2319 (2016). [DOI] [PubMed] [Google Scholar]
- 48.Chi H et al. Comprehensive identification of peptides in tandem mass spectra using an efficient open search engine. Nature Biotechnology 2018 36:11 36, 1059–1061 (2018). [DOI] [PubMed] [Google Scholar]
- 49.Miyaguchi K et al. Activated T cell therapy targeting glioblastoma cancer stem cells. Sci Rep 13, 196 (2023). [DOI] [PMC free article] [PubMed] [Google Scholar]
- 50.Kang YJ et al. CPC2: A fast and accurate coding potential calculator based on sequence intrinsic features. Nucleic Acids Res 45, W12–W16 (2017). [DOI] [PMC free article] [PubMed] [Google Scholar]
- 51.Kozak M Regulation of translation via mRNA structure in prokaryotes and eukaryotes. Gene Preprint at 10.1016/j.gene.2005.06.037 (2005). [DOI] [PubMed] [Google Scholar]
- 52.Jurtz V et al. NetMHCpan-4.0: Improved Peptide–MHC Class I Interaction Predictions Integrating Eluted Ligand and Peptide Binding Affinity Data. The Journal of Immunology ji1700893 (2017) doi: 10.4049/jimmunol.1700893. [DOI] [PMC free article] [PubMed] [Google Scholar]
- 53.Kovaka S et al. Transcriptome assembly from long-read RNA-seq alignments with StringTie2. Genome Biol 20, (2019). [DOI] [PMC free article] [PubMed] [Google Scholar]
- 54.Berrens RV et al. Locus-specific expression of transposable elements in single cells with CELLO-seq. Nat Biotechnol 40, (2022). [DOI] [PMC free article] [PubMed] [Google Scholar]
- 55.Maeng JH, Jang HJ, Du AY, Tzeng S-C & Wang T Using long-read CAGE sequencing to profile cryptic-promoter-derived transcripts and their contribution to the immunopeptidome. Genome Res 33, 2143–2155 (2023). [DOI] [PMC free article] [PubMed] [Google Scholar]
- 56.Huang YH et al. DNA epigenome editing using CRISPR-Cas SunTag-directed DNMT3A. Genome Biol 18, 1–11 (2017). [DOI] [PMC free article] [PubMed] [Google Scholar]
- 57.Tanenbaum ME, Gilbert LA, Qi LS, Weissman JS & Vale RD A protein-tagging system for signal amplification in gene expression and fluorescence imaging. Cell 159, 635–646 (2014). [DOI] [PMC free article] [PubMed] [Google Scholar]
- 58.Pflueger C et al. A modular dCas9-SunTag DNMT3A epigenome editing system overcomes pervasive off-target activity of direct fusion dCas9-DNMT3A constructs. Genome Res (2018) doi: 10.1101/gr.233049.117. [DOI] [PMC free article] [PubMed] [Google Scholar]
- 59.Morita S et al. Targeted DNA demethylation in vivo using dCas9-peptide repeat and scFv-TET1 catalytic domain fusions. Nat Biotechnol 34, 1060–1065 (2016). [DOI] [PubMed] [Google Scholar]
- 60.Merlotti A et al. Noncanonical splicing junctions between exons and transposable elements represent a source of immunogenic recurrent neo-antigens in patients with lung cancer. Sci Immunol 8, eabm6359 (2023). [DOI] [PubMed] [Google Scholar]
- 61.Sahebjam S, Sharabi A, Lim M, Kesarwani P & Chinnaiyan P Immunotherapy and radiation in glioblastoma. Journal of Neuro-Oncology vol. 134 Preprint at 10.1007/s11060-017-2413-0 (2017). [DOI] [PubMed] [Google Scholar]
- 62.Krishnamurthy J et al. Genetic engineering of T cells to target HERV-K, an ancient retrovirus on melanoma. Clinical Cancer Research 21, (2015). [DOI] [PMC free article] [PubMed] [Google Scholar]
- 63.Takahashi Y et al. Regression of human kidney cancer following allogeneic stem cell transplantation is associated with recognition of an HERV-E antigen by T cells. Journal of Clinical Investigation 118, (2008). [DOI] [PMC free article] [PubMed] [Google Scholar]
- 64.Wang-Johanning F et al. Human endogenous retrovirus K triggers an antigen-specific immune response in breast cancer patients. Cancer Res 68, (2008). [DOI] [PMC free article] [PubMed] [Google Scholar]
- 65.Mullins CS & Linnebacher M Endogenous retrovirus sequences as a novel class of tumor-specific antigens: An example of HERV-H env encoding strong CTL epitopes. Cancer Immunology, Immunotherapy 61, (2012). [DOI] [PMC free article] [PubMed] [Google Scholar]
- 66.Cherkasova E et al. Detection of an immunogenic HERV-E envelope with selective expression in clear cell kidney cancer. Cancer Res 76, (2016). [DOI] [PMC free article] [PubMed] [Google Scholar]
- 67.Ohtani H et al. Activation of a Subset of Evolutionarily Young Transposable Elements and Innate Immunity are Linked to Clinical Responses to 5-Azacytidine. Cancer Res (2020) doi: 10.1158/0008-5472.can-19-1696. [DOI] [PMC free article] [PubMed] [Google Scholar]
- 68.Ohtani H, Liu M, Zhou W, Liang G & Jones PA Switching roles for DNA and histone methylation depend on evolutionary ages of human endogenous retroviruses. Genome Res 28, (2018). [DOI] [PMC free article] [PubMed] [Google Scholar]
- 69.Singleton WG et al. Convection enhanced delivery of panobinostat (LBH589)-loaded pluronic nano-micelles prolongs survival in the F98 rat glioma model. Int J Nanomedicine 12, 1385–1399 (2017). [DOI] [PMC free article] [PubMed] [Google Scholar]
- 70.Yang J, Li Y, Zhang T & Zhang X Development of bioactive materials for glioblastoma therapy. Bioact Mater 1, 29–38 (2016). [DOI] [PMC free article] [PubMed] [Google Scholar]
- 71.Gillmore JD et al. CRISPR-Cas9 In Vivo Gene Editing for Transthyretin Amyloidosis. New England Journal of Medicine 385, (2021). [DOI] [PubMed] [Google Scholar]
- 72.Liu W, Li L, Jiang J, Wu M & Lin P Applications and challenges of CRISPR-Cas gene-editing to disease treatment in clinics. Precision Clinical Medicine vol. 4 Preprint at 10.1093/pcmedi/pbab014 (2021). [DOI] [PMC free article] [PubMed] [Google Scholar]
- 73.Ledford H CRISPR treatment inserted directly into the body for first time. Nature vol. 579 Preprint at 10.1038/d41586-020-00655-8 (2020). [DOI] [PubMed] [Google Scholar]
- 74.Wang G et al. Multiplexed activation of endogenous genes by CRISPRa elicits potent antitumor immunity. Nat Immunol 20, (2019). [DOI] [PMC free article] [PubMed] [Google Scholar]
- 75.Ohtani H, Liu M, Liang G, Jang HJ & Jones PA Efficient activation of hundreds of LTR12C elements reveals cis-regulatory function determined by distinct epigenetic mechanisms. Nucleic Acids Res gkae 498 (2024) doi: 10.1093/nar/gkae498. [DOI] [PMC free article] [PubMed] [Google Scholar]
- 76.Guo Y et al. CRISPR-TE: a web-based tool to generate single guide RNAs targeting transposable elements. Mob DNA 15, 3 (2024). [DOI] [PMC free article] [PubMed] [Google Scholar]
Methods-only References
- 77.Gujar AD et al. An NAD+-dependent transcriptional program governs self-renewal and radiation resistance in glioblastoma. Proc Natl Acad Sci U S A (2016) doi: 10.1073/pnas.1610921114. [DOI] [PMC free article] [PubMed] [Google Scholar]
- 78.Mao DD et al. A CDC20-APC/SOX2 Signaling Axis Regulates Human Glioblastoma Stem-like Cells. Cell Rep (2015) doi: 10.1016/j.celrep.2015.05.027. [DOI] [PMC free article] [PubMed] [Google Scholar]
- 79.Richner M, Victor MB, Liu Y, Abernathy D & Yoo AS MicroRNA-based conversion of human fibroblasts into striatal medium spiny neurons. Nat Protoc (2015) doi: 10.1038/nprot.2015.102. [DOI] [PMC free article] [PubMed] [Google Scholar]
- 80.Liao Y, Smyth GK & Shi W FeatureCounts: An efficient general purpose program for assigning sequence reads to genomic features. Bioinformatics 30, 923–930 (2014). [DOI] [PubMed] [Google Scholar]
- 81.Subramanian A et al. Gene set enrichment analysis: A knowledge-based approach for interpreting genome-wide expression profiles. Proc Natl Acad Sci U S A 102, (2005). [DOI] [PMC free article] [PubMed] [Google Scholar]
- 82.Mootha VK et al. PGC-1α-responsive genes involved in oxidative phosphorylation are coordinately downregulated in human diabetes. Nat Genet 34, (2003). [DOI] [PubMed] [Google Scholar]
- 83.Xiao Y et al. A novel significance score for gene selection and ranking. Bioinformatics 30, (2014). [DOI] [PMC free article] [PubMed] [Google Scholar]
- 84.Wang B et al. Unveiling the complexity of the maize transcriptome by single-molecule long-read sequencing. Nat Commun 7, (2016). [DOI] [PMC free article] [PubMed] [Google Scholar]
- 85.Li H Minimap2: Pairwise alignment for nucleotide sequences. Bioinformatics 34, (2018). [DOI] [PMC free article] [PubMed] [Google Scholar]
- 86.Wyman D & Mortazavi A TranscriptClean: Variant-aware correction of indels, mismatches and splice junctions in long-read transcripts. Bioinformatics 35, (2019). [DOI] [PMC free article] [PubMed] [Google Scholar]
- 87.Wyman D et al. A technology-agnostic long-read analysis pipeline for transcriptome discovery and quantification. bioRxiv (2020). [Google Scholar]
- 88.Xie M et al. DNA hypomethylation within specific transposable element families associates with tissue-specific enhancer landscape. Nat Genet 45, 836–41 (2013). [DOI] [PMC free article] [PubMed] [Google Scholar]
- 89.Gu Z, Eils R & Schlesner M Complex heatmaps reveal patterns and correlations in multidimensional genomic data. Bioinformatics (2016) doi: 10.1093/bioinformatics/btw313. [DOI] [PubMed] [Google Scholar]
- 90.Pertea M et al. StringTie enables improved reconstruction of a transcriptome from RNA-seq reads. Nat Biotechnol 33, 290–295 (2015). [DOI] [PMC free article] [PubMed] [Google Scholar]
- 91.Pertea M, Kim D, Pertea GM, Leek JT & Salzberg SL Transcript-level expression analysis of RNA-seq experiments with HISAT, StringTie and Ballgown. Nat Protoc 11, (2016). [DOI] [PMC free article] [PubMed] [Google Scholar]
- 92.Szolek A et al. OptiType: Precision HLA typing from next-generation sequencing data. Bioinformatics 30, (2014). [DOI] [PMC free article] [PubMed] [Google Scholar]
- 93.Jurtz V et al. NetMHCpan-4.0: Improved Peptide–MHC Class I Interaction Predictions Integrating Eluted Ligand and Peptide Binding Affinity Data. The Journal of Immunology 199, 3360–3368 (2017). [DOI] [PMC free article] [PubMed] [Google Scholar]
- 94.Schmidt T et al. Universal Spectrum Explorer: A Standalone (Web-)Application for Cross-Resource Spectrum Comparison. J Proteome Res 20, (2021). [DOI] [PubMed] [Google Scholar]
Associated Data
This section collects any data citations, data availability statements, or supplementary materials included in this article.
Supplementary Materials
Data Availability Statement
All omics data generated during this study are available through the Gene Expression Omnibus (GEO) (GSE227059) and Proteomics Identification Database (PRIDE) (PXD039893). GTEx transcriptomic data were obtained with dbGAP approval through the accession number phs000424.v9.p2.