

Abstract
Blebs are spherical cellular protrusions that occur in many physiological situations. Two distinct phases make up the life of a bleb, each of which have their own biology and physics: expansion, which lasts ∼30 s, and retraction, which lasts ∼2 min. We investigate these phases using optical microscopy and simple theoretical concepts, seeking information on blebbing itself, and on cytomechanics in general. We show that bleb nucleation depends on pressure, membrane-cortex adhesion energy, and membrane tension, and test this experimentally. Bleb growth occurs through a combination of bulk flow of lipids and delamination from the cell cortex via the formation and propagation of tears. In extreme cases, this can give rise to a traveling wave around the cell periphery, known as “circus movement.” When growth stalls, an actin cortex reforms under the bleb membrane, and retraction starts, driven by myosin-II. Using flicker spectroscopy, we find that retracting blebs are fivefold more rigid than expanding blebs, an increase entirely explained by the properties of the newly formed cortical actin mesh. Finally, using artificially nucleated blebs as pressure sensors, we show that cells rounded up in mitosis possess a substantial intracellular pressure.
Introduction
Blebs are blisterlike protrusions that appear and disappear from the surface of a cell; their spatiotemporal dynamics can be complicated, but they typically grow to a size of ∼2 μm over ∼30 s before shrinking over ∼120 s, typically reappearing elsewhere in a repetitive asynchronous manner. Blebbing is a common phenomenon in animal cells; it is observed during the cytokinesis phase of cell division (1,2), apoptosis (3), some types of cell migration (4–7), and in nonmotile embryonic blastomeres (8). For convenience, we and others have analyzed blebbing in a human melanoma cell line deficient in the actin cross-linking protein filamin, which blebs continuously when stimulated with serum (9–11). Although the size and distribution of blebs varies somewhat in the different situations, the basic mechanism and kinetics appear remarkably similar and this is described in detail in the following paragraph. Embryonic blastomere blebbing sometimes appears morphologically distinct because in these cells a single bleb can propagate around the cell as a traveling wave akin to a “circus movement” (12–14). We show below that this traveling behavior occurs via a simple modification of typical bleb dynamics.
Blebbing is to a large extent a physical, rather than chemical process, and it occurs over time- and length-scales that have been little investigated in animal cells, especially in the molecular era. It is thus an open and exciting area for biophysical investigation of the forces and mechanics that shape animal cells. During nucleation, a small area of the bilayer membrane detaches from the cortex, and if it reaches a critical size, it grows into a bleb. This detachment is driven by localized contractions of the actin cortex powered by the motor protein myosin II (11,15). Once a bleb is nucleated, it grows by filling up with cytosol and eventually forms a quasihemispherical protrusion 1–10 μm in diameter devoid of actin or other cytoskeletal structures. Total cell volume is preserved throughout blebbing (10). An important aspect of both the nucleation and growth phases of a bleb is that it can be localized to just part of a cell, so that different parts of the cell can be mechanically isolated, just as they are often chemically isolated (10). Bleb expansion eventually slows down as the contraction of the cortex cannot force sufficient liquid into the bleb to maintain constant growth rate and further due to the fact that the bleb membrane undergoes a transition from a lipid bilayer with an erythrocytic cytoskeleton to one coated with an actin cortex (11,15). During this transition, membrane-actin linker proteins are recruited to the bleb rim independently of actin, then an actin cortex appears, and, shortly after, actin-bundling proteins are recruited. At the ultrastructural level, the newly formed cortex resembles a cage formed of actin filaments with an average mesh size of ∼200 nm (11). Finally, the motor protein myosin II is recruited to the bleb rim and powers retraction.
Here, we develop simple concepts to describe bleb nucleation, expansion, and retraction, and test them experimentally by measuring and perturbing the biophysical parameters involved (summarized in Fig. 1). We use these concepts to explain the motion of blebs during circus movements. Finally, we induce blebs in metaphase cells by weakening the link between the membrane and the cytoskeleton to provide proof of the existence of a resting intracellular pressure created by actinomyosin contraction.
Figure 1.

Diagram of the different physical phases of blebbing along with possible theoretical predictions, experimental perturbations, and their outcomes, as well as the experimental technique used to assess the effect of perturbations.
Material and methods
Cell culture
Filamin-deficient M2 cells were cultured in MEM with Earle's salts (Invitrogen, Carlsbad, CA) with penicillin streptomycin, 0.01 M HEPES, and 10% 80:20 mix of donor calf serum/fetal calf serum. All imaging was carried in Leibovitz L-15 media (Invitrogen) supplemented with 10% 80:20 mix of donor calf serum/fetal calf serum. M2-ezrin T567D-GFP cell lines were cultured in the same medium with the addition of 500 μg ml−1 G418 as a selection agent (11).
Hela cells were cultured in DMEM (Invitrogen) with penicillin streptomycin and 10% fetal calf serum. For metaphase arrest, cells were incubated overnight in culture medium supplemented with 100 nM nocodazole (Sigma, St. Louis, MO) or S-trityl-L-cysteine (an inhibitor of the kinesin Eg5; EMD Biosciences, Darmstadt, Germany (16)).
Xenopus blastomeres were harvested and imaged as described in Kwan and Kirschner (17).
Plasmids and transfections
The cell membrane was imaged by transfecting the cells with the PH domain of Phospholipase C δ tagged with GFP (a kind gift of Dr. Tamas Balla, National Institutes of Health). For expression in Xenopus blastomeres, PH-PLCδ-GFP was inserted into pCS2+ using the XhoI/NotI restriction sites. The cDNA was linearized and used as a template for mRNA synthesis with the mMessage machine kit (Ambion, Austin, TX). The synthesized mRNA was ethanol-purified and resuspended in RNase free water. mRNA microinjection was performed as described in Kwan and Kirschner (17). Plasmids for expression of EGFP-C1 (BD Clontech, Mountainview, CA), actin-GFP, myosin regulatory light chain (MRLC)-GFP, α-actinin-GFP, and tropomyosin-GFP were described in Charras et al. (11). GFP-actin adenovirus was used as described in Charras et al. (10). Plasmid transfections were effected using lipofectamine Plus or lipofectamine 2000 according to the manufacturer protocol using 1 μg of cDNA per well of a six-well plate (Invitrogen) and cells were examined the next day.
Microscopy and microinjections
All imaging was done on a TE-2000 inverted microscope (Nikon, Yokohama, Japan). Both a 100× 1.3 NA oil immersion objective and a 20× objective were used for imaging. Fluorophores were excited either with epifluorescence illumination and the appropriate filter sets or a 3W tunable laser. For confocal microscopy, a spinning disk confocal head (PerkinElmer, Wellesley, MA) was interfaced to the microscope. Images were captured on an Orca ER CCD camera (Hamamatsu, Hamamatsu, Japan) and acquired on a PC using MetaMorph software (Molecular Devices, Sunnyvale, CA). Images of the cells were acquired either at 488 nm wavelength for GFP-tagged proteins or 568 nm wavelength for RFP-tagged proteins. For display, images were low-pass-filtered and scaled such that background fluorescence was minimal. In some cases, projection images were created by projecting the maximal intensity of fluorescence at several time-points onto one image.
Microinjections were performed as described in Charras et al. (11). Polyethylene-glycol-passivated 565 quantum dots (Invitrogen) were diluted in injection buffer (50 mM K-glutamate, 0.5 mM MgCl2, pH 7.0) to achieve a final concentration of 0.1 μM.
Local perfusion
Local treatment of cells was performed as described in Charras et al. (10). Briefly, a laminar flow of medium was established in the flow chamber. The tip of a micropipette containing latrunculin B and a fluorescent tracer were brought into the vicinity of the cell to be treated and the position was adjusted such that the fluorescent tracer only bathed one half of the cell. Treatment was pursued until blebs appeared on the cells and reached a stable size. Blebs were then allowed to retract. During the experiment, images were acquired at 5 s interval using differential interference contrast illumination and 568 nm excitation to visualize the cells and the fluorescent tracer, respectively.
Pharmacological perturbations
Blebbistatin was purchased from Tocris Bioscience (Bristol, UK). Wheat germ agglutinin labeled with Alexa-488 or Alexa-560 was purchased from Molecular Probes (Eugene, OR). Calyculin A and Latrunculin B were from EMD Biosciences.
Sucrose was purchased from Sigma. For hyperosmotic treatment, cells were exposed to medium with sucrose concentrations increasing from 1 mM to 300 mM. For hypotonic series, the medium was diluted with water.
Thin sectioning and scanning electron microscopy
Transmission electron microscopy (TEM) and scanning electron microscopy (SEM) were performed as described in Charras et al. (11).
Assessment of bleb retraction mechanism
To investigate the mechanism of bleb retraction, we imaged the trajectory of actin speckles incorporated into the cortex polymer (18). Cells were incubated overnight with very low titer of GFP-actin adenovirus and imaged the next day as described previously except that exposure times of 2–3 s were necessary to obtain sufficient signal to detect speckles.
Assessment of blebbing activity
Changes in blebbing activity due to drugs or mutant protein expression were assessed by computing a blebbing index for each experimental situation: with Nblebs the number of blebs observed during a given period t (which was kept constant from one experiment to the next) over the cell perimeter L. Populations were compared with a Student t-test and the level of significance was taken to be p < 0.01.
Evaluation of protein turnover and recruitment
The evolution of integrated protein fluorescence intensity during retraction was analyzed to assess recruitment over time. Since, actin, α-actinin, and tropomyosin form a rim spanning the whole perimeter of the bleb, regions were manually drawn around the bleb rim and total intensity was measured at several time points using MetaMorph. As myosin appeared only in puncta at the bleb rim, we thresholded the image such that the puncta appeared clearly and the bleb interior was excluded. Then, we drew a region around the whole bleb at its maximal extension, the total fluorescence of the thresholded regions was measured at several time points during bleb retraction. Total fluorescence at the end of retraction was compared to initial protein fluorescence with a student t-test. Tests were considered significant if p < 0.01.
Image processing
All image processing was carried out using either MetaMorph software or custom-written programs running under Pv-wave (Visual Numerics, routines available upon request).
Cell volume estimation
The volume of the GFP-transfected cells was estimated by acquiring optical sections through the cells at 1.5-μm intervals. The area of each optical section was estimated, and the sum of the areas was multiplied by the thickness of an optical section to obtain an estimate of the volume. To estimate the area in each optical section, a histogram plot of the intensities was generated and fit to a Gaussian. The main peak in any image represented the background pixels. Pixels with intensities larger than the value of the peak plus eight standard deviations were considered signal. The volume evolution was computed and normalized to the average volume of the first five time points.
Computing blebbing probability as a function of position and time
To evaluate the probability of blebbing, cells were transfected with EGFP-C1 and imaged as previously described. Images were read into Pv-wave and thresholded as described in the cell volume estimation. The cell center was manually input and the cell was subdivided into 360 angular sectors (Fig. 3 A). Cell width along each sector was determined for each time point and compared to the previous time point to determine whether cell width had increased, stayed constant, or decreased in that sector. This yielded a color-coded map of cell behavior over time t and angular coordinate θ with expanding regions in red, stationary regions in black, and retracting regions in green (Fig. 3 B). This map was then segmented into an expansion map and a retraction map. The probability of expansion given prior expansion pee(θ,t) was computed as follows. For each position where expansion occurred, a new expansion map centered on that position was created by shifting the original map in t and θ. Then, the shifted expansion maps for all expanding points were averaged yielding a probability map pee(θ,t). The same method was used to compute the probability of expansion given prior retraction per(θ,t), the probability of retraction given prior retraction prr(θ,t), and the probability of retraction given prior expansion pre(θ,t) (Fig. 3, C and D).
Figure 3.

Experimental variation of nucleation parameters. (A) Evolution of the number of blebs per cell per unit time as a function of the increase in extracellular osmolarity. (B) Evolution of the number of blebs per cell per unit time as a function of increasing concentration of the myosin II ATPase blocker blebbistatin. Increasing concentrations of blebbistatin block an increasing proportion of myosin motor heads and blebbing ceases. (C) Evolution of the number of blebs per cell per unit time as a function of increasing concentration of wheat germ agglutinin (a lectin known to cross-link membrane polysaccharides). (D) Effect of modulating cytoskeleton-membrane adhesion energy and myosin contractility. Increasing the adhesion energy between the cytoskeleton and the membrane by overexpressing a constitutively active form of the membrane-actin cross-linker ezrin decreased the number of blebs per unit perimeter per unit time. This effect could be partially compensated by increasing contractility by treating cells with the general phosphatase inhibitor calyculin.
Tracking bleb apex position over time
To track the position of the bleb apex over time, cells were transfected with the PH domain of PLCδ tagged with GFP. Images were acquired at high frame rate (10–25 Hz) with a 100× objective. A line was drawn from the cell body to the final position of the bleb apex. For each time point, the intensity profile along this line was extracted, fit to a Gaussian, and the position of the membrane was taken to be the position of the peak.
Tracking the angle between the cell body and the bleb membrane over time
First, we tracked the position of one point of the bleb membrane close to the bleb neck as described for the bleb apex. Then, we determined the position of the membrane along a line parallel to the previous but shifted toward the bleb apex. These two points gave us a tangent to the bleb membrane. Then, we determined a tangent to the cell body by determining the position of the membrane along two lines perpendicular to the original line and away from the bleb interior. The angle between these two tangents was taken to be the angle between the cell body and the bleb membrane. The position of the bleb neck was taken to be the intersection point between these two lines. The accuracy of this method was inspected visually for both the angle and the intersection points and inaccurate data points were manually deleted from the data.
Flicker spectroscopy
For flicker spectroscopy analysis, cells were transfected with PH-PLCδ-GFP and imaged as described above. Flicker spectroscopy analysis was implemented as described in Pecreaux et al. (19). Briefly, a point in the bleb interior was chosen and the surface of the bleb was subdivided into 32 separate angular sectors (Fig. 5 A). In each sector, the position of the membrane was tracked over time as described above. For each time point and angular position, an average position was computed by averaging 32 time points centered on the time of interest and subtracting any translational displacement. This yielded the average bleb surface for each time point (Fig. 5 B). Fluctuations around this position were obtained by subtracting the membrane position at time t from the average membrane position at time t. For each time point, the radius of curvature of the bleb surface was computed and a spatial-Fourier transform of the fluctuations was computed as described in Pecreaux et al. (19). The mean-square amplitude of the normal fluctuations uq was fit to for wave vectors q up to 2 106 m−1 with kb the Boltzmann constant, T the temperature, Tm the membrane tension, and B the bending rigidity. For each fit, a goodness of fit was computed, fits with an r2 value inferior to 0.9 were discarded (between 30 and 70% of data was discarded because it was too poor), and data points were averaged in bins of five to reduce noise. The average bleb surface position over time was determined and this was used to classify blebs into three categories: expanding, stationary, or retracting. For each treatment, Nblebs > 25 in Ncells > 10 were measured. Controls were effected by measuring membrane bending rigidity in cells incubated with 2.5 μM latrunculin B or 2.5 μM cytochalasin D alone for 5 min (which yields stationary blebs devoid of an actin cortex (11)), or latrunculin B or cytochalasin D for 5 min and then wheat germ agglutinin for 15 min. To verify that the fluctuations had a thermal origin, we depleted the energy supplies of the cells by incubating them with 10 mM 2-deoxy-glucose and 2 mM sodium azide simultaneously with latrunculin B for 30 min. All statistics were computed using a student's t-test and differences were deemed significant for p < 0.01.
Figure 5.
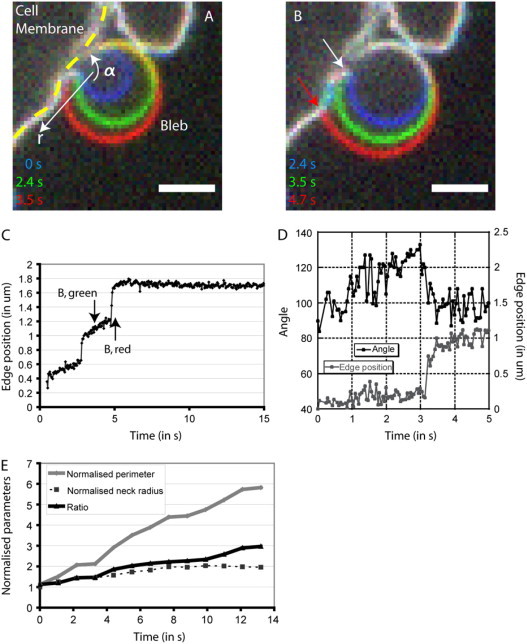
Mechanisms of bleb growth. (A) Increase in bleb volume can be accommodated through changes in the aspect ratio of blebs. Three times points are superimposed to show the evolution of aspect ratio. The cell membrane is delineated by the yellow dashed line. The position of the bleb is indicated. As the bleb increases in size, the angle of contact between the bleb membrane and the cell body increases (α). (B) Increase in bleb volume can cause tearing of the cell membrane from the cell body. Three time points are superimposed to show the evolution of the point and angle of contact between the bleb membrane and the cell body. When bleb volume increase becomes too great, more membrane tears from the cell body, the angle of contact drops, and the point of contact changes. For the first two time points (in blue and green), the point of contact between the bleb membrane and the cell body is shown by the white arrow. The point of contact for the last time point (in red) is shown by a red arrow and is clearly distinct from the point of contact for earlier time points. Panels A and B were acquired using spinning disk confocal microscopy. Scale bars = 2 μm. (C) Time course of the bleb edge position. The position of the membrane in the bleb is tracked over time along the white arrow in panel A. When there is no detachment, the position of the membrane varies smoothly and linearly because the angle of contact increases (white arrow in B, corresponding to the time point shown in green in B). When detachment occurs, the membrane position changes rapidly (∼2 μm s−1, red arrow in B, corresponding to the time point shown in red in B). (D) Time course of the angle and point of contact between the bleb membrane and the cell body (for the bleb shown in A and B). The angle increases linearly when there is no detachment and the point of contact stays constant (0–3 s). When detachment occurs, the angle drops rapidly and the point of contact changes (at 3 s). (E) Time course of the normalized perimeter, neck radius, and ratio of perimeter to neck radius. Both the normalized perimeter and the normalized neck radius increase as the bleb grows. However, the ratio of bleb perimeter/neck radius also increases, showing that there needs to be flow of membrane into the bleb.
Curve fitting
Curve fitting was done with Kaleidagraph (Synergy Software, Reading, PA) or with Pv-wave. Goodness of fit was assessed with r2 values.
Results and theory
The cytoplasm as an active fluid-infiltrated network
Theory
When viewed at the ultrastructural level, the cytoplasm has a networklike structure that sequesters organelles (such as mitochondria, ribosomes, lipid vesicles, etc.) and is infiltrated by cytosol, a combination of proteins and other solutes in water (20,21). To understand the behavior of this composite material, the traditional approach has been to model the cell as a viscoelastic or viscoplastic medium, which has a fluid or solidlike behavior depending on the strain rates it is subjected to. However, this picture is fundamentally flawed because it cannot account for the movement of the fluid phase relative to the solid skeletal elements. The requirement for a physical picture of cytoplasm that takes into account relative motion between phases is particularly evident in blebbing, where liquid cytosol must flow through the porous network of the cytoplasm during both expansion and contraction phases. Experimentally, different regions of the cell are out of equilibrium with respect to the pressure differentials that drive these flows (10), demanding a picture in which cytoplasm is considered as a multiphase material. Accounting for the dynamics of a multiphase cytoplasm allows us to explain the phenomenon of blebbing quantitatively, and also has broad implications for the cytomechanics of cell shape, migration, and division.
A natural framework for this is an active version of the theory of poroelasticity (22,23), introduced in geophysics in a passive setting to explain the dynamics of fluid-infiltrated rocks. Here, we view the cytoplasm as a two-phase system, with a porous solid (cytoskeleton, organelles, ribosomes, and other RNA-protein complexes) bathed in a viscous interstitial fluid, the cytosol (water, ions, metabolites, soluble proteins). This view is similar to, but much simpler than, the reactive interpenetrating flow formalism used earlier to describe aspects of cell motility (24). Both phases are treated as continua and can move relative to one another. Stresses applied onto the cytoplasm are distributed between the solid matrix and the fluid. If the fluid phase can move through the solid matrix (as is the case in a sponge, in cartilage, or in the cytoskeleton), it will drain until all of the applied stress is borne by the solid phase. At long times, the poroelastic equilibrium is that predicted by static elasticity. However, many important phenomena, including blebbing, occur over timescales short compared to this purely elastic limit.
To quantify these ideas in the simplest possible scenario, we focus on the one-dimensional case. We assume both phases are incompressible. Since flow speeds and length scales at the cellular level are small, the ratio of inertial forces to viscous forces (the Reynolds number) is negligible, and we may neglect the effects of inertia. In addition, if the deformations of the network are small, we may use a geometrically and physically linear theory of elasticity. Then, the constitutive equation relating the effective stress σ to the strain ɛ may be derived using either mixture theory or asymptotic methods that account for the scale separation due to the smallness of the pore size compared to the system size. In its simplest form, it reads: σ(x,t) = Eɛ − p with E(φ) the bulk drained elastic modulus of the solid phase, p the interstitial fluid pressure, φ the fluid fraction, and the mechanical strain with being the displacement field. Then, force balance for a slice of material of thickness yields: with f(x) the force density exerted by motors in the gel. The applied forces lead to a stress that causes relative movements between the solid and fluid phases, leading to a drainage flow with a relative velocity between the phases given by Darcy's law: with p(x,t) the pressure, vf the velocity of the fluid phase, and k(φ) the hydraulic permeability of the solid matrix. Since drainage occurs in response to movement of the solid matrix, the fluid, and solid velocities are linked by volume conservation: Combining this with Darcy's law yields the equation
| (1) |
which dictates the dynamics of deformation of the multiphase material in the presence of a body force such as that due to contractility. From Eq. 1, we see that displacement satisfies a driven-diffusion equation with a diffusion constant D = kE. To derive an estimate of the hydraulic permeability from the microstructure, we assume that the fluid phase is contained within identical cylindrical pores of radius ξ spanning the length of a unit volume in the cell. Application of a pressure gradient to a pore gives rise to a Poiseuille flow where the microscopic velocity scales as with μ the viscosity of cytosol. Averaging the microscopic velocity over the width of the matrix yields the macroscopic velocity and by analogy with Darcy's law We note that this immediately leads to a scaling relation for the diffusion constant so that the diffusion constant can be easily changed by orders of magnitude by locally varying the pore radius of the network.
Estimation of cellular poroelastic parameters
To analyze blebbing in this framework, we need to know the drained elastic modulus E, the pore radius ξ, the cytosolic viscosity μ, the fluid fraction φ, and the cortical pressure p.
The elastic modulus of filamin deficient melanoma cells has been measured using force microscopy microindentation (E ∼ 2 kPa (10)) and magnetic bead twisting (E ∼ 300 Pa (25)). The value of the cytosolic viscosity μ varies widely depending on the measurement technique and ranges from μ = 3 10−3 Pa s (measured using spin-labeling (26)) to 2 10−1 Pa s (measured using fluorescence recovery after photobleaching (27)).
To determine the network pore radius of blebbing cells, we microinjected polyethylene glycol-passivated quantum dots into blebbing cells (hydrodynamic diameter ∼25 nm). Under isoosmotic conditions, the quantum dots diffused freely within the cell cytoplasm and into blebs (Fig. 2 A). Upon exposure to medium containing 600 mM sucrose, the quantum dots were trapped in the solid matrix and stopped moving (Fig. 2 B). Cellular fluid fraction was determined by measuring cell volume before and after exposure to a hyperosmotic solution containing 600 mM sucrose (described in (10)). Upon exposure to sucrose, cell volume decreased by 34 ± 19% (N = 13, Fig. 2 C) and hence we will take φ ∼ 0.34 and a normalized cell volume of Vsucrose ∼ 0.66. Using the assumptions made to describe the pores, we have giving a range 12.5–15.5 nm for the pore radius ξ. In the following calculations, we will use ξ ∼ 15 nm.
Figure 2.
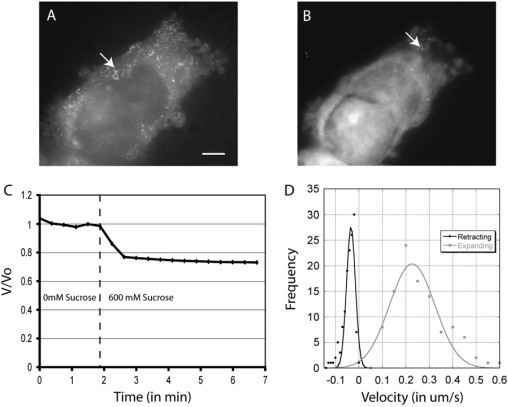
Experimental determination of poroelastic parameters for blebbing cells. (A and B) Blebbing cell microinjected with quantum dots in isoosmotic solution (A) and in a hyperosmotic solution (B). Both images are the maximum projection of 200 frames representing a total of 2 s acquired using wide field-fluorescence microscopy. In isoosmotic solution, the quantum dots diffuse freely and their trajectory can clearly be seen (arrow, A). In hyperosmotic solution, the quantum dots appear frozen in place and do not move (arrow, B). Scale bar = 5 μm. (C) Cell volume decreases in response to a hyperosmotic shock. The graph was normalized to the average volume of the cell during the first five time points. 600 mM sucrose was added at t = 2 min. (D) Histogram of bleb expansion and retraction velocities.
Taking these experimental values for the poroelastic parameters together with a bulk elastic modulus E = 300–2000 Pa and the cytosolic viscosity μ = 3 10−3–10−1 Pa s yields a stress diffusion constant of D = 6.75 10−13–1.5 10−10 m2 s−1and a hydraulic permeability k = 2.2 10−15–7.5 10−14 m2 Pa−1 s−1. Hydraulic permeability can also be estimated experimentally by measuring maximal bleb velocity. Indeed, when the pressure p is initially applied, the rate of cytosol efflux is with h the radius of the cell. Therefore, and the pore size The measured average maximal velocity was v = 0.25 ± 0.1 μm s−1 (N = 103 blebs from >20 cells; Fig. 2 D). This yields k ∼ 2.5 10−14 m2 Pa−1 s−1 and ξ ∼ 8–50 nm with h ∼ 10 μm, p ∼ 100 Pa (see Blebs as pressure gauges: intracellular pressure in mitotic cells), and μ ∼ 3 10−3–10−1 Pa s. These values are close to the range determined experimentally using quantum dots and sucrose-mediated dehydration.
Our estimates of pore radius and fluid fraction are consistent with some (28), but not all, previous estimates (20). Our pore diameter is smaller than estimates of the gaps between cytoskeleton filaments obtained by electron microscopy (11,20), but comparable to the size of ribosomes, the most abundant particles in the cytoplasm (29). We envisage a cytoplasm where the cytoskeleton and large organelles provide a large mesh sieve. When the soluble fraction flows through the sieve in response to stress, abundant particles (smaller organelles, ribosomes) tend to block the holes, clogging the sieve and reducing its effective pore size. The low fluid fraction measured in cells reflects the abundance of these sieve-clogging particles that, though loose, are effectively part of the solid phase.
Nucleation of a bleb
Theory
During blebbing, the pressure p produced by myosin motor proteins acts to shrink the actin cortex (3,30) giving rise to a localized centripetal compression of the cytoplasm. Because the cytosol cannot drain instantaneously, a pressure transient arises. If the pressure transient is large enough, the bilayer membrane tears from the actin cortex and nucleates a bleb; if not, the cytosol drains from the compressed area and gives rise to a local increment in intracellular pressure that eventually equilibrates as the motors stall and/or detach from the actin. The critical diameter d of a patch membrane detached from the cortex needed for a bleb to grow (nucleation size) can be estimated from considerations of the change in the free energy of the system
| (2) |
which has four components due to
-
1.
The pressure-volume work done by the contractions, with p the hydrostatic pressure in the cytosol, and δ the membrane deflection perpendicular to the cortex, so that the volume of the incipient bleb is d2δ.
-
2.
Loss of adhesion of the bilayer to the cortex over an area d2, with J the membrane-cytoskeleton adhesion energy.
-
3.
Bending the bilayer with a bending rigidity B by an amount δ over an area d2.
-
4.
The work done in stretching out the bilayer during blister formation, with T the membrane tension, and a characteristic strain of order over a patch of area d2.
Since much of the cell membrane is maintained in a folded state by the submembranous cytoskeleton (31), the membrane can unwrinkle and flow in the plane to accommodate bleb formation and membrane tension remains approximately constant for small deflections. Furthermore, for small values of the membrane deflection, the membrane bending energy is smaller than the stretching energy, so that we may neglect the energy of bending the bilayer compared to that for stretching it and then check for consistency later. At very short times after the onset of blebbing, the cortical contraction pressure may be assumed to be constant. Then the critical detachment size above which a bleb will grow catastrophically in a pressure-controlled situation can be obtained by minimizing the above free energy with respect to both changes in the patch size and membrane deflections, so that This yields relations for the critical size of the patch of bilayer membrane dc and the deflection δc, which must occur if the bleb is to nucleate and grow:
| (3) |
As we might expect, the size of the patch is dependent on the pressure of contraction and decreases as this pressure increases; in addition, there is a dependence on adhesion energy and the bending rigidity that is qualitatively consistent with our intuition. There is also a critical deflection that arises since the work done by the pressure must exceed a critical value before bleb nucleation is energetically favorable.
Experimental verification
The above simple theory provides some qualitative guidance for experimental tests of the theory. First, a counter-pressure can be applied by changing the osmolarity of the medium or the driving pressure can be decreased by incubating the cell with blockers of contractility. Second, the adhesion energy between the membrane and the cytoskeleton can be increased by overexpressing constitutively active membrane-actin linkers (11,32). Third, the membrane resting tension can be increased by incubation with wheat germ agglutinin (33).
To verify that osmotic pressure could impede blebbing, cells were exposed to increasing concentrations of hyperosmotic solutions and bleb frequency was measured. The sucrose concentration needed to impede bleb nucleation by 50% was c ∼ 150 mM (N = 6; Fig. 3 A). When cells were exposed to gradually increasing concentrations of sucrose, blebbing frequency decreased until total cessation of blebbing for concentrations above 300 mM (Fig. 3 A, data from (10)). Consistent with our simple theory, the bleb nucleation size increases with decreasing pressure and therefore, the rate of nucleation decreases. Using a nucleation pressure p ∼ 100 Pa (see Blebs as Pressure Gauges: Intracellular Pressure in Mitotic Cells), an estimate of the critical detachment size is dc ∼ 34 nm and δc ∼ 60 nm for T ∼ 2 10−6 N m−1 (Fig. 6 F), and J ∼ 6 10−6 J m−2 with data from the literature (24).
Figure 6.

Measurement of the bending rigidity of the bleb membrane. (A) Cells were transfected with the pleckstrin homology domain of Phospholipase C δ tagged with GFP, which highlights the cell membrane, and movies were acquired at high frame rate using spinning disk confocal microscopy. The angular sector denotes the part of the bleb membrane on which experimental measurements shown in panels B and C were effected. Scale bar = 5 μm. (B) Time course of the surface of the bleb shown in panel A. The bleb initially expands, then stays stationary, and finally retracts. (C) Temporal evolution of the bending rigidity and position of the bleb shown in panel A. During expansion, the bending rigidity of the bleb membrane is ∼4 10−20 N m. When retraction starts, the bending rigidity increases to ∼2 10−19 N m due to polymerization of an actin shell under the bleb membrane. (D) Ultrastructure of the submembranous actin shell acquired using scanning electron microscopy. The submembranous actin shell had a cagelike structure with distances between cross-links ∼100–200 nm apart. (E) Changes in bending rigidity of blebs in response to chemical treatments. Retracting blebs with a fully formed actin cytoskeleton had a fourfold higher bending rigidity than expanding blebs. In the absence of an actin cytoskeleton (expanding blebs or stationary blebs treated with latrunculin or cytochalasin), the bending rigidity of blebs was close to that of red blood cells. Treatment of blebs devoid of an actin cortex with wheat germ agglutinin resulted in a 9–12-fold increase in membrane-bending rigidity. (F) Changes in membrane tension of blebs in response to chemical treatments. Expanding and retracting blebs did not have significantly different membrane tensions. Blebs treated with actin depolymerizing drugs had significantly lower membrane tensions and this could be compensated by subsequent treatment with wheat germ agglutinin.
When myosin contractility was impeded by treatment with increasing doses of the myosin II ATPase blocker blebbistatin, bleb frequency decreased until total cessation occurred for concentrations above 50 μM (Fig. 3 B). Blebbistatin traps myosin-II in a conformation with a low affinity for actin (36), i.e., the effect of the drug is similar to removing myosin-II molecules from the cell. With increasing concentration of blebbistatin, fewer myosin motors work; therefore, the driving pressure decreases and nucleation decreases. Since the dose-response for inhibiting blebbing is similar to that for inhibiting other contractile processes such as cytokinesis, we estimate that a 50% reduction in the number of active myosin motors is sufficient to significantly reduce bleb nucleation (37). When membrane rigidity and tension was increased using wheat germ agglutinin (WGA) ((33) and Fig. 6 F), the frequency of blebs decreased with increasing WGA concentration (Fig. 3 C). With increasing concentrations of wheat germ agglutinin, the cell membrane tension increases, increasing the bleb nucleation radius, and decreasing nucleation rate. When actin-membrane adhesion energy was increased by overexpression of active ezrin (ezrinT567D, (32)), the cells had significantly lower blebbing indices than wild-type cells 4 h after plating (BT567D = 0.14 ± 0.26, Bwt = 0.90 ± 0.47, N = 34 in both cases, p < 0.01; Fig. 3 D). Indeed, increasing the membrane-cortex adhesion energy increases the bleb nucleation radius and decreases bleb frequency. This effect could be partially reversed by treating M2-ezrin T567D cells with the general phosphatase inhibitor Calyculin A, that blocks inactivation of myosin contractility and leads to increased contractility (Bcaly = 0.42 ± 0.32, p < 0.01 when compared to BT567D; Fig. 3 D). Increased contractility creates a higher driving force which compensates for increased adhesion energy. Taken together, these results qualitatively confirm our simple model of bleb nucleation.
Probability of bleb nucleation as a function of space and time
To ask whether bleb nucleation in a given location depended on events at other times or locations, we computed the experimental probability of bleb expansion Pee(t, θ) given prior expansion, the probability of expansion given prior retraction Per(θ,t), the probability of retraction given prior retraction Prr(θ,t), and the probability of retraction given prior expansion Pre(θ,t) as a function of time t and angular position θ. Qualitatively, the results were similar for all of the cells we examined (N = 11).
No strong predictors of expansion or retraction were found. Pee displayed a checkered pattern and reached a global maximum for t = 0 s and θ = 0. For t = 0 s, blebbing was impeded in angular sectors directly adjacent to θ = 0 (white arrows, Fig. 4 C; Pee). For θ = 0, blebbing was impeded for short times before and after t = 0 s (black arrows, Fig. 4 C, Pee). Increased probabilities of blebbing were found at short negative times for small angular sectors both positive and negative (red arrows, Fig. 4 C; Pee). Biologically, this corresponds to there having been a bleb to the left or the right before bleb expansion at θ = 0. Something similar occurred for short positive times. A retraction at θ = 0 for short positive or negative times gave rise to an increased probability of expansion Per at t = 0 s and θ = 0 (white arrows, Fig. 4 D; Per,). Retraction at t = 0 s for small positive or negative θ gave rise to increased blebbing probabilities (black arrows, Fig. 4 D; Per). In conclusion, apart from obvious relationships, bleb nucleation did not depend strongly on past history or spatial arrangement of blebs in filamin-deficient melanoma cells.
Figure 4.

Probability of bleb appearance as a function of position and time. (A) Cells transfected with GFP were imaged on a confocal microscope at 5 s intervals. The cell center was manually input and the cell area was divided into 360 sectors. Expansion and retraction were tracked along each sector independently to create a color-coded map of spatiotemporal cell behavior (B). Scale bar = 5 μm. (B) Spatiotemporal map of cell behavior. Time is shown on the horizontal axis and angular coordinates on the vertical axis. Red zones represent expansion, green zones retraction, and black zones no movement. (C) Probability of expansion on past expansion (pee(θ,t)). For t = 0 s, blebbing was impeded in angular sectors directly adjacent to θ = 0 (white arrows). For θ = 0, blebbing was impeded for short times before and after t = 0 s (black arrows). Increased probabilities of blebbing were found at short negative times for small angular sectors both positive and negative (red arrows). Biologically, this corresponds to there having been a bleb to the left or the right before bleb expansion at θ = 0. (D) Probability of expansion on past retraction (per(θ,t)). A retraction at θ = 0 for short positive or negative times gave rise to an increased probability of expansion per at t = 0 s and θ = 0 (white arrows). Retraction at t = 0 s for small positive or negative θ gave rise to increased blebbing probabilities (black arrows).
Growth of a bleb
Growth occurs through a combination of tearing and bulk flow of lipids
As bleb volume increases, bleb surface area must increase because lipid membranes cannot be stretched (lytic strains ∼2–3%, (38)). We envisage several different mechanisms through which this could occur. Since the cell has excess membrane compared to its isotonic volume (31,38), bleb formation could simply be the result of local unwrinkling of the cell membrane. Since the cell membrane is a two-dimensional fluid, bleb growth may also be the result of net membrane flow into the bleb through the bleb neck. Additionally bleb growth could result from tearing of membrane from the actin cortex. Finally, new membrane could be inserted by exocytosis. At any time, a large amount of plasma membrane is stored as endosomes under the cortex, and these two membrane pools can exchange by exo- and endocytosis on a timescale of seconds (39). Experimentally, the extent of tearing can be crudely assessed by measuring the diameter of the bleb neck over time during bleb expansion, and the extent of unwrinkling can be estimated by measuring the ratio of bleb perimeter/bleb neck diameter. If unwrinkling is the main source of area increase, the ratio of bleb perimeter/bleb neck diameter should stay constant; whereas, if lipids flow into blebs, this ratio should increase over time. Vesicle fusion can be observed using membrane markers such as 1,1′-dioctdecyl-3,3,3′,3′-tetramethylindocarbocyanine perchlorate.
As bleb growth proceeded, the diameter of the neck increased approximately twofold (2.04 ± 0.69-fold, N = 50), the bleb perimeter increased fivefold (5.36 ± 1.61, N = 50), and the ratio of bleb perimeter/neck diameter increased 2.8-fold (2.77 ± 0.96, N = 50, p < 0.01; Fig. 5 E). Thus, growth occurs through a combination of tearing and bulk flow of lipids rather than unwrinkling. Exo- and endocytosis may be important to supply and retrieve membranes over the whole cell, but it is unlikely that significant exocytosis occurs within the expanding bleb, because we never observed endosome fusion close to nascent blebs (data not shown), rarely-found endosomes in blebs by thin-section electron microscopy (data not shown), and finally, microtubules that help position endosomes were absent from blebs (11).
In this scenario with tearing from the cytoskeleton and membrane flow supporting rapid increase in bleb surface area, two different regimes of bleb growth exist. First, if growth is slow, increases in bleb volume increase membrane tension causing net flow of lipids into the bleb through the bleb neck adding sufficient surface area to accommodate expansion (35). If bleb growth is more rapid, the membrane tension becomes sufficient to break links between the membrane and the actin cortex, and the bleb neck diameter increases. Tearing occurs if f = Tm (1 − cos(α)) > J, with α the angle between the bleb membrane and the cell body (shown on Fig. 5 C), and J the adhesion energy between the membrane and the cortex. Tearing continues until α and T decrease sufficiently. These two phases can be observed experimentally by measuring the angle of contact α and the bleb neck radius over time.
Experimental observation of tearing
In most cells, the bleb neck diameter grew smoothly with velocities of ∼0.1 μm.s−1; in a subset of cells (∼5%), two very distinct phases of growth could be resolved (Fig. 5, C and D).
In the first phase, the bleb grew in radius without change in bleb neck diameter (Fig. 5, A and C, arrow A). During this phase, the angle of contact between the bleb and the cell body grew (Fig. 5 D), the point of contact did not change, and bleb surface area increased presumably through flow of lipids into the bleb via the neck. Blebs with this biphasic expansion behavior enabled us to estimate the velocity of membrane flow into the blebs with R1 the initial bleb radius, R2 the final bleb radius, a the neck radius, and δt the duration of growth. Furthermore, vm was used to estimate membrane tension using the simple relation with ηm ∼10−6 N s m−1 the effective membrane viscosity (35). For the bleb in Fig. 5 A, the velocity of membrane flow was vm ∼ 2 μm s−1 and the membrane tension was Tm ∼ 6 10−6 N m−1 (close to estimates described in Fig. 6 F and values reported by (34)).
In the second phase, bleb neck diameter grew rapidly and the angle of contact decreased (Fig. 5, B and C, arrows B and D). Flow of lipids into the bleb through the bleb neck perimeter is dominated by tearing of the bilayer from the cortex. Tearing events took place over periods of 100–800 ms and over distances of 50–600 nm with velocities ranging from 0.25 to 3.4 μm s−1 (N = 9; Fig. 5 C). Knowing the angle at which tearing starts (α ∼ 130°; Fig. 5 D) and the membrane tension in the bleb (Tm ∼ 8 10−7–6 10−6 N m−1; Fig. 6 F and (34)) allows us to estimate the adhesion energy between the membrane and the cortex J ∼ 1.3–9.8 10−6 J m−2. In this regime, bleb growth occurs via stick-slip-like behavior of a growing crack. We explore this concept further below in the case of circus movement, where blebs travel sideways via steady crack propagation and healing.
End of growth
Bleb growth eventually ceases for one of two reasons: either because the local pressure transient eventually falls below the threshold for growth, in which case the bleb would reach an equilibrium where this pressure is balanced by a combination of the membrane tension and curvature; or because reassembly of a cortical cytoskeleton might limit bleb growth before the pressure falls too much. When cortex assembly was acutely blocked with cytochalasin or latrunculin, blebs typically grew somewhat larger (11), arguing that cortex assembly does in part limit growth, but interpretation of this experiment is complicated by observations of the simultaneous disassembly of the actin cortex in the whole cell and subsequent destabilization of membrane-actin links.
Maturation and retraction
Membrane rigidification during bleb retraction
During retraction, the assembly of the actin cytoskeleton onto a bleb membrane stabilized only by submembranous cytoskeleton components (11) offers us the opportunity to examine the respective contributions of actin and the submembranous cytoskeleton to membrane rigidity. The actin cytoskeleton in blebs has a cagelike structure (11), whose bending rigidity can be estimated from its microstructure (40,41). To simplify calculations, we assume that the unit mesh of the gel is a pore of dimension l (the distance between cross-links) with l ≪ lp the persistence length of an actin filament (∼10 μm (42)). In this limit, we can assume that we have a network of stiff filaments, each akin to a cantilever beam of elastic modulus E and radius r. The effective modulus of such a network is (43) so that the bending modulus of a gel of thickness h is Scanning and transmission electron microscopy of the cytoskeleton of blebs revealed that the bleb cortex is composed of multiple layers of filamentous actin tethered by bundling proteins (11), therefore r ∼ ract and h ∼ Nract with N the number of actin layers giving TEM images of retracting blebs (Fig. 8 D) reveal that the actin cortex is ∼50-nm-thick, comprising 8–9 layers of actin filaments. The predicted bending rigidity for such a gel is B ∼ 2.8 10−19 N m with l ∼ 200 nm, Eact = 2.6 GPa (42), and ract = 6 nm.
Figure 8.

Membrane topography during retraction. (A) Membrane crumpling during retraction. As retraction proceeds, the membrane becomes more crumpled. Maximum projection of seven spinning disk confocal microscopy images. Scale bar = 2 μm. (B) Surface topography of a bleb. Image acquired using scanning electron microscopy. (C) Transmission electron microscopy image of the final stages of retraction of a bleb in a Hela cell blocked in metaphase. The membrane has a very convoluted morphology and an actin cortex (arrow) coats the underside of the bleb membrane. (Inset) Boxed location of the main image in relation to the whole cell. Scale bar = 500 nm. (D) Evolution of the bleb perimeter and bleb neck radius during retraction. The perimeter decreases linearly with time. The bleb neck radius does not change during retraction.
The bending rigidity of the cortex underlying blebs can be measured experimentally using flicker spectroscopy of a fluorescent reporter protein that localizes to the cell membrane (Fig. 6, A and B). To validate this measurement technique, we measured the bending rigidity of blebs in cells incubated with drugs that promote actin depolymerization (cytochalasin D or latrunculin B). The bending rigidity of blebs without an actin cortex was Blat = 2.9 10−20 N m (N = 45) and Bcyt = 5.33 10−20 N m (N = 26), close to the bending rigidity of the erythrocytic membrane (BRBC = 2 10−20 N m (44)) (Fig. 6 E). When latrunculin- or cytochalasin-treated cells were incubated with WGA, a membrane polysaccharide cross-linker, the bleb membrane became significantly more rigid (BlatWGA = 3.6 10−19 N m, N = 41, and BcytWGA = 3.2 10−19 N m, N = 30, p < 0.01 for both; Fig. 6 E). The change in bending rigidity after incubation with WGA was 12-fold for latrunculin and sixfold for cytochalasin, comparable to results obtained using micropipette aspiration (∼30-fold increase (33)). To verify that membrane fluctuations were due to thermal energy and not active biological processes we depleted the cellular ATP stocks with sodium azide and deoxyglucose in latrunculin-treated cells (Blat, azide = 3.3 10−20 N m, N = 40, p = 0.93 when compared to latrunculin treatment). In control cells, expanding blebs had an average bending rigidity of Bexp = 4.7 10−20 N m (N = 79). Retracting blebs had a significantly higher bending rigidity Bretr = 2.15 10−19 N m (p < 0.01, N = 162; Fig. 6 E). In some cases, a clear transition between expanding and retracting bleb rigidities could be seen (Fig. 6 C). Membrane tension in retracting blebs did not differ significantly from that in expanding blebs (T = 8.1 10−7 N m−1, T = 9.7 10−7 N m−1, p = 0.5; Fig. 6 F). Treatment with both latrunculin and cytochalasin significantly decreased membrane tension (T = 3.0 10−7 N m−1, T = 4.6 10−7 N m−1, p < 0.01 in both cases). WGA treatment significantly increased membrane tension (TlatWGA = 1.8 10−6 N m−1, TcytWGA = 1.9 10−6 N m−1, p < 0.01 in both cases).
Our experiments suggest that the increase in bending rigidity observed during retraction can be entirely attributed to the formation of an actin cortex. The bundling proteins copolymerized with actin in the bleb (α-actinin, fimbrin, coronin) probably tether actin filaments to one another at the apices of the network rather than along the whole length of the vertices.
Bleb retraction occurs through crumpling of the actin network
The exact mechanism through which the actin cortex promotes bleb retraction is unclear. We envisaged two possible mechanisms: sliding (Fig. 7 D) or crumpling (Fig. 7 E). In the former, retraction happens through the sliding of two layers of actin past one another as in sarcomeric contraction. Speckles of actin incorporated within either layer move tangentially to the bleb surface at all times and their trajectories move away from the bleb midline (Fig. 7 D). During crumpling, the polymeric structure is deformed by myosin-based contraction. Actin speckles move toward the bleb midline driven by contraction (Fig. 7 E). Experimental observation of speckles of actin incorporated within the actin rim and foci of myosin showed that these move toward the bleb center rather than tangentially during retraction (Fig. 7, A and F), which favors the crumpling model.
Figure 7.

Mechanisms of bleb retraction. All images were acquired using spinning disk confocal microscopy. Scale bars = 2 μm. (A) Myosin dynamics during bleb retraction. Maximum projection of myosin intensity during bleb retraction. Myosin foci describe a centripetal trajectory and grow in intensity and breadth over time. (B) Actin dynamics during bleb retraction. Maximum projection of actin intensity during retraction. (C) Evolution of total myosin and actin intensity during retraction. Myosin intensity grew fourfold during retraction. Total actin intensity did not vary significantly. (D and E) Models for actin-based bleb retraction. Retraction can either be the result of interlayer actin filament sliding (D) or actin shell crumpling (E). The trajectory of actin monomers incorporated within the cortical shell moves toward the interior of the bleb if retraction proceeds through crumpling (E), whereas it moves toward the exterior of the bleb if retraction proceeds through interlayer sliding (D). (F) Trajectory of actin speckles incorporated within the cortical shell. Maximum projection of ∼60 time points representing ∼300 s. Actin speckles move toward the interior of the bleb as it retracts pointing toward a crumpling mechanism.
The total amount of actin polymer within the bleb did not change significantly during retraction (total actin fluorescence 0.89 ± 0.23, p = 0.1, N = 14; Fig. 7, B and C) indicating that net actin polymerization ceased once a continuous actin rim had been formed, in agreement with prior observations (11). Corroborating this was the fact that total α-actinin and tropomyosin fluorescence was also constant during retraction (respectively, 0.92 ± 0.2, p = 0.15, N = 18; and 0.99 ± 0.07, p = 0.85, N = 14) indicating that the recruitment of these cross-linking proteins comes to steady state once retraction starts. We hypothesize that myosin-II bundles attach to the meshwork and travel along filaments, tightening the meshwork and putting it under stress (Fig. 7 A). During bleb retraction, MRLC localized to distinct puncta that grew in area (normalized area after retraction, A = 5 ± 2.11, N = 19) and total fluorescence (5.22 ± 1.9, N = 19; Fig. 7 C), indicating ongoing recruitment of myosin to new areas of the bleb rim.
Estimation of the number of myosin needed for crumpling suggests dynamic turnover of actin-bundling proteins
Myosin heads moving along actin filaments provide the mechanical work needed to force cytosol back in to the cell body and crumple the actin cytoskeleton (Fig. 8) (11). The total force per unit time developed by N myosin heads is F ∼ Nfmyoωmyo, with fmyo the force developed by a myosin head in a cycle and ωmyo the motor cycle frequency (45). Myosin contraction is resisted by two separate forces: the pressure arising from forcing cytosol into the cell body (Darcy's law) and the restoration force arising from bending the actin mesh. In the initial stages of retraction, the latter is negligible. If the motors are distributed homogenously along the perimeter of the bleb, the Laplace hoop stress gives the pressure with T the membrane tension and Rb the bleb radius. Using Darcy's law, we can estimate the speed of retraction with d the cell radius. As retraction progresses, the actin mesh crumples. The restoring force arising from crumpling is with B the bending rigidity of the actin cortex, and λ the wavelength of the wrinkles (46). The total force resisting myosin movement is therefore
During retraction, the diameter of the bleb neck did not change (Fig. 7 D), the bleb perimeter decreased linearly over time and the average retraction speed was −0.047 ± 0.023 μm s−1 (N = 138 blebs from >20 cells, Fig. 2 D). Therefore, in the initial stages of retraction, the number of myosin heads needed to force the cytosol back into the cell body is Nmyoinit ∼ 50, with k the experimentally measured hydraulic permeability k ∼ 2.5 10−14 m2 Pa−1 s−1, Rb ∼ 2 μm the average bleb radius, d ∼ 10 μm, ωmyo ∼10 Hz, and fmyo ∼ 1.5 pN (45). Fluorescence imaging of myosin reporter construct in blebs showed that recruitment occurs during retraction and the final number of myosin heads is Nmyofinal ∼ 5.22 × Nmyoinit ∼ 260 or a density of dmyo ∼ 20 μm−2, assuming a hemispherical bleb. This is comparable to the density of myosin heads estimated in the cleavage furrow of dividing Dictyostelium dmyof ∼ 5 μm−2 assuming a cylindrical cleavage furrow with area Af = 2πRfwf ∼ 157 μm2 with the furrow radius Rf ∼ 5 μm, the furrow width wf ∼ 5 μm and the number of myosin heads in the furrow Nmyof ∼ 840 (8.4% of the total number of myosin heads in the cell Nmyototal ∼ 104 (47,48)).
Membrane crumpling was apparent in retracting blebs using either fluorescence microscopy (Fig. 8 A), SEM (Fig. 8 B), or TEM (Fig. 8 C). In the early stages of retraction, typical wavelengths of ∼1 μm could be seen on the membrane (Fig. 8, A and B). In the final stages of retraction, blebs had very convoluted morphologies with multiple in-foldings of wavelength ∼50–100 nm (Fig. 8 C). The force needed to crumple the actin cortex in the initial stages is Fcrumple ∼ 0.8 μN, necessitating Nmyo > 5 104 with Bcortex ∼ 2 10−19 N m−4, Rb ∼ 2 μm, λ ∼ 1 μm, ωmyo ∼ 10 Hz, and fmyo ∼ 1.5 pN. This is larger than the total number of myosin motors present in the whole cell (48). However, if the attachment of bundling proteins is transient, the following scenario might explain our observations: myosin motors exert tension on the actin network but the network does not deform because the force is too weak. Instead, a transient, local delamination of the cortex occurs through detachment of a bundling protein, so that the remaining softer actin layer deforms. Indeed, rheological measurements of gels of actin cross-linked with α-actinin revealed that α-actinin dissociation constants from actin are >2 s−1 (49), much shorter than the lifetime of a retracting bleb. After this, relamination occurs between the deformed layer and other layers. This process when iterated would lead to crumpled bleb meshes with very convoluted morphologies (Fig. 8 C). For delaminations resulting in a reduction of the number of layers to two and a doubling in mesh size, the number of myosin heads needed for λ ∼ 1 μm drops to Nmyo ∼ 60, which is comparable to the number of myosins derived from experimental measurements. In this scenario, the rate of bleb retraction may be limited by the rate of dissociation of bundling factors, a hypothesis originally proposed by Sato et al. (49). However, for the shorter wavelengths observed in fully retracted blebs (∼100 nm, Fig. 8 C), the number of myosins rises to unrealistic numbers (∼6 105), which requires that actin be severed through some unknown mechanism.
Traveling blebs: circus movement in blastomeres
Circus movements are commonly observed in embryonic blastomeres, where a relatively long-lived bleb travels tangentially to the cell body. These traveling blebs provide a window into continuous tearing and healing of the membrane from the cortex. During circus movements, blebs occasionally travel several times around the whole circumference of the cell (Fig. 9, A–E). More often, they only travel over part of it before retracting, or changing direction (data not shown and (50)). Confirming their mechanistic relation to other blebs, we found that circus movements were blocked by inhibiting actomyosin contraction (using cytochalasin D, blebbistatin, or Y-27632) or by applying an osmotic counter pressure with sucrose (N = 3 for each treatment, in agreement with the literature (12,14,50)).
Figure 9.

Circus movements. (A) A Bleb travels around the circumference of a Xenopus blastomere in fits and starts. Xenopus embryos were injected with PH-PLCδ-GFP mRNA. At time t = 0 s (red), the angle θ between the cell body and the bleb membrane is small. At t = 4 s (green), the angle has increased but the point of contact remains the same. At t = 10 s (blue), the membrane has torn from the cell body, the point of contact has changed, and the angle has decreased. Finally, retraction of the bleb is apparent at the rear. Three time points were superimposed on this image. The arrow shows the direction of travel and the angle θ is shown. Scale bar = 10 μm. (B) Hela cell blocked in metaphase transfected with MRLC-TDRFP (red) and actin-GFP (green). As the bleb travels counter-clockwise (direction shown by arrow at t = 0 s), an actinomyosin cortex is reformed at the trailing edge of the bleb (arrow, t = 26 s). Scale bar = 5 μm. Panels A and B were acquired using spinning disk microscopy. (C) Phase contrast image of a Xenopus blastomere. The direction of travel is indicated by the curved arrow. The white circle denotes the location of the kymograph shown in panel E. The straight arrow denotes the location of the kymograph shown in panel D. Scale bar = 10 μm. (D) Kymograph of the expansion and retraction kinetics normal to the cell body for the cell shown in panel C at the location marked by the straight arrow. Whereas expansion occurs mainly tangentially to the cell body, retraction occurs normal to the cell body. The kymograph can be utilized to measure retraction speed (dotted line). (E) Kymograph of bleb dynamics along the circle in panel C. The bleb travels around the whole circumference of the cell multiple times before reversing (arrow). The travel velocity at mid bleb-height stays relatively constant and can be measured (dotted line). (F) Velocity of the leading edge of a traveling bleb. The position of the point of contact between the bleb membrane and the cell body varies cyclically over time, alternating stationary periods with periods of rapid displacement. (G) Evolution of the angle and point of contact of the bleb over time. The angle between the bleb membrane and the cell body varies cyclically over time, alternating periods of increase with periods of decrease (location of angle indicated on panel A). When the angle between the bleb membrane and the cell body increases, the position of the point of contact varies little (3–8 s). Eventually, the angle reaches a value such that tearing occurs, the angle decreases, and the point of contact changes rapidly (8–11 s). Later, tearing reaches a steady state and proceeds as the angle changes (11–20 s).
During circus movements, once a bleb forms, an actin cortex is thought to reform asymmetrically (14). When retraction starts, this forces cytosol to the unconsolidated side of the bleb rather than into the cell body, causing polarized delamination of the membrane. The phenomenon propagates because one side of the bleb is always older than the other, and as it retracts, it forces cytosol into the younger side, promoting further delamination. We were unable to image cortex reformation in blastomeres, but noticed that HeLa cells transfected with actin-GFP and MRLC-TDRFP and blocked in mitosis with S-trytil-l-cysteine or nocodazole occasionally exhibited traveling blebs (Fig. 9 B). In these cells, the trailing side of the traveling bleb had a well-developed actin cortex containing myosin II, whereas the leading side was devoid of actin (Fig. 9 B).
Traveling blebs in Xenopus blastomeres typically have a constant volume (V/V0 = 1.03 ± 0.10, N = 21). In these cells, the rear of the bleb retracted at a constant rate normal to the cell body vr = 0.37 ± 0.21 μm s−1 (N = 22, measured using kymographs as in Fig. 9 D). Granules within the bleb could be seen moving in the direction of travel, giving a clear indication of flow of cytosol. In contrast, the leading edge of the bleb moved discontinuously, exhibiting pronounced pauses and accelerations (Fig. 9, A, F, and G), with maximal velocities reaching 3 μm s−1. The average velocity, while moving, was vle = 1.61 ± 0.45 μm s−1 at mid bleb height (N = 22, kymograph in Fig. 9 E). This discontinuous movement suggested that periods of delamination alternate with periods of membrane flow into the bleb, due to stick-slip behavior of the adhesive interaction between the cytoskeleton and the membrane. In agreement with this interpretation, the angle between the bleb leading edge and the cell body grew linearly during pauses and decreased during periods of travel (Fig. 9, A and G). The position of the crack front varied little or slowly during periods of angular growth, and rapidly during periods of angular decrease (Fig. 9 G, t = 0–11 s). Occasionally, tearing reached a steady state and proceeded even as the angle changed (Fig. 9 G, t = 11–20 s). The reason for the nonuniformity of circus movements in different types of cells such as blastomeres and filamin deficient cells is not understood; blastomeres often form a single traveling bleb, while filamin-deficient melanoma cells (as well as dividing and apoptosing tissue culture cells) tend to form multiple, nontraveling blebs. However, one possibility is that the cytoplasm of blastomeres has a smaller pore size that makes it energetically more costly to push fluid back into the bulk cytoplasm, favoring sideways propagation of the bleb.
Blebs as pressure gauges: intracellular pressure in mitotic cells
Intracellular pressure may play a significant role in shaping animal cells, but it has been difficult to measure. Our experiments show that blebs are natural pressure gauges. This may be used to measure the internal pressure of rounded cells, such as mitotic animal cells which tend to round-up due to increased cortical tension. We used drug-induced blebbing as a pressure gauge in Hela cells arrested in mitosis by overnight treatment with 100 nM nocodazole (which inhibits microtubule polymerization) or 5 μM S-trityl-l-cysteine (which inhibits kinesin-5) (Fig. 10 A, t = 0 s). Cells arrested in mitosis are known to have a pronounced spherical cortical shell containing actin and myosin-II (51), which presumably leads to high cortical tension. However, mitotic cells do not typically bleb, possibly because the membrane-cortex adhesion energy is too high. To induce blebbing, we added drugs that weaken the actin cytoskeleton: either the actin monomer sequesterer, latrunculin (Fig. 10 A) or the F-actin barbed-end capper cytochalasin D (not shown). In both cases, the drug induced multiple large blebs (N = 11 cells, Fig. 10 A, t = 260 s). At longer times, these blebs reintegrated the cell body as the cortex completely depolymerized (Data not shown). When metaphase cells were treated with 50 μM blebbistatin or 25 μM Y-27632 for 30 min before latrunculin exposure, no blebs appeared (N = 9 and 5 cells, respectively; Fig. 10, B and C). Since blebs occur in response to pressure gradients, these data point to the existence of a resting intracellular pressure created by myosin contractility within metaphase cells.
Figure 10.
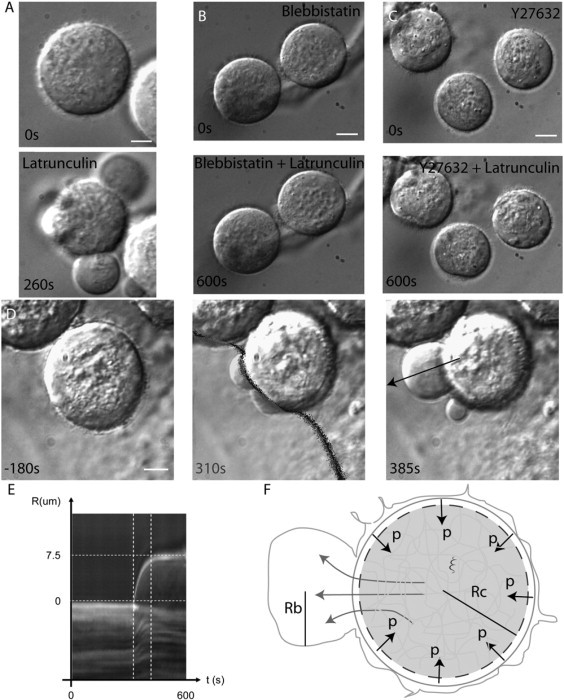
Latrunculin-induced blebs in metaphase cells are due to an actinomyosin-mediated resting intracellular pressure. All images were acquired using differential interference contrast wide-field microscopy. Scale bars = 2 μm (A) or 5 μm (B–D). (A) Hela cells blocked in metaphase have a rounded morphology. Treatment with latrunculin causes the emergence of a few large blebs (t = 260 s). (B) Pretreatment with the myosin II ATPase inhibitor blebbistatin prevents the emergence of latrunculin-induced blebs. (C) Pretreatment with the contractility inhibitor Y27632 prevents the emergence of latrunculin-induced blebs. (D) Local latrunculin treatment of a cell arrested in metaphase causes the emergence of blebs on the treated side only. The location of treatment is shown by the shaded zone (t = 310 s). (E) Kymograph of the velocity of the bleb from panel D (arrow on panel D, t = 385 s). (F) Line drawing of blebbing in metaphase cells. Rc is the cell radius, Rb the bleb radius, p the intracellular pressure, and ξ the pore size. When the membrane detaches from the cortex, cytosol rushes out from the cell body into the bleb.
Locally perfusion of mitotic cells with latrunculin induced one or two large blebs that were easier to measure (N = 13 cells, Fig. 10 D). This treatment also had the advantage of preserving an intact contractile cortex on the other side (Fig. 10 F). The volumetric strain applied by the cortex onto the solid phase of the cytoplasm is therefore (N = 13 cells). Knowing the drained elastic modulus of the cell body E = 0.3–2 kPa, we can deduce the applied stress (or intracellular pressure) and combining this with the Laplace hoop stress we can compute the cortical tension This cortical tension is comparable to experimentally measured cortical tensions in phagocytosing neutrophils using micropipette aspiration (up to 1 mN m−1 (52)). An estimate for intracellular pressure in blebbing cells can be obtained by comparing the mean radius of Hela metaphase blebs (RHela = 4.57 ± 1.35 μm, N = 28 blebs) to those of blebbing cells (RM2 = 1.48 ± 0.36 μm, N = 172 blebs): close to the values reported in Dai and Sheetz (34). Measuring the average maximal bleb expansion velocity, vmax = 0.2 ± 0.1 μm s−1 (N = 13 cells, Fig. 9 E) enabled us to estimate the hydraulic permeability of metaphase cells, and their pore radius with μ = 3 10−3–10−1 Pa s, Rcell = 12.1 ± 1.5 μm. We conclude that when cells round-up in mitosis, they have a pronounced cortical tension and intracellular pressure, consistent with a model in which cortical tension drives mitotic rounding. The activation of the RhoA pathway reported by Maddox and Burridge (51) during mitosis argues that cortical tension probably increases. However, more work is required to determine whether cortical tension increases during mitosis to drive rounding or it remains constant.
Discussion
We have used a combination of microscopy, manipulation, and biophysical concepts to study the nucleation, growth, maturation, and retraction of blebs. Our study builds on an earlier proposal by us that the cytoplasm was best described as a porous solid infiltrated by an interstitial fluid that can be studied in the framework of poroelasticity (10). This description allows us to quantify the mechanical behavior of cells using measurable parameters of the cell structure and microstructure rather than phenomenological (viscoelastic/viscoplastic) descriptions that are the basis for previous descriptions of the cytoplasm. Our current experiments go further in validating aspects of this new idea, although the large range of values of the elastic modulus of the network and the viscosity of the cytoplasm suggest that we need quantitative microscopic probes based on spatial and temporal correlations before we can make further headway on these questions.
During nucleation, a small area of membrane detaches from the cortex, and if it reaches a critical size, it grows into a bleb. This critical detachment size depends on membrane tension, cytosolic pressure, and the adhesion energy between the membrane and the actin cortex, and leads to simple estimates for the nucleation of a bleb. These estimates suggested experiments to probe the nucleation of a bleb, which we carried out. Decreasing the pressure transient by decreasing contractility decreased nucleation, increasing adhesion energy between the cell membrane and the cortex decreased nucleation, and increasing membrane tension decreased bleb nucleation. All of these observations confirm our simple model for bleb nucleation. In filamin-deficient cells, nucleation was little influenced by location and history. In cell types that use blebbing as a means of locomotion, such as newt blastomeres (13), walker carcinoma cells (53), Dictyostelium (7), and zebrafish germ cells (6), blebbing must be polarized to the leading edge. In dividing cells, blebs tend to form away from the cleavage furrow (unpublished observations). Polarized blebbing could reflect greater pressure transients at the front of the cell, or weaker membrane adhesions there, or both—an interesting topic for further study.
During bleb growth, the bleb surface area increased through a combination of bulk flow of lipids into the bleb and tearing from the actin cortex. Two distinct bleb populations were observed: one where bleb neck radius growth was smooth; the other where periods of stalling alternated with periods of rapid growth. The latter was particularly extreme in traveling blebs such as circus movements in dissociated Xenopus embryos. During tearing of membrane from the cortex, cracks propagated at velocities reaching 3 μm s−1. During periods of growth with no tearing, bulk flows of lipids into the membrane reached velocities up to 2 μm s−1. The bending rigidity in growing blebs was comparable to that of red blood cells and significantly lower than in retracting blebs. During the final stages of bleb growth, no tearing was observed and only the aspect ratio of the bleb changed.
Once growth ended, a cagelike actin mesh was reformed under the bleb membrane. The apparent bleb membrane bending rigidity increased fourfold and this could be fully explained by the assembly of an actin cortex. This actin mesh was 8–9 layers of actin thick, cross-linked by actin-bundling proteins, and no further recruitment of actin occurred during retraction. Myosin motor proteins provided the motive force for bleb retraction. Retraction was not the result of interlayer sliding but rather due to crumpling of the actin mesh. Though few myosin motors were needed to start retraction (∼50), more were recruited over time, increasing fivefold on average by the end of retraction. The final myosin density was comparable to that present in the cleavage furrow. However, too few myosin heads were present to explain crumpling of a static cortex, suggesting that crumpling of the actin mesh proceeds through transient delaminations of the actin mesh due to detachment of actin-bundling proteins (49). These transient delaminations would enable local buckling of the mesh and subsequent relamination would allow myosin motor heads to detach and reattach elsewhere and continue the crumpling process. Experimentally, this could be tested by assessing the dynamics of the various bundling proteins (e.g., α-actinin or coronin) by fluorescence recovery after photobleaching or probing bleb cortex rheology using beads tethered to blebs and oscillating them using optical tweezers (54). At later stages of crumpling, delamination alone is insufficient, and severing of actin filaments may occur to give rise to the very convoluted morphologies observed by TEM. One mechanism through which this could occur would be through coronin-aip1-cofilin mediated actin depolymerization as coronin is recruited to retracting blebs (11,55).
Using blebs as detectors of intracellular pressure in conjunction with latrunculin treatment to destabilize the attachment between the cell membrane and the actin cortex, we were able to provide unequivocal proof of the existence of an intracellular hydrostatic pressure. Indeed, cells arrested in metaphase and treated with inhibitors of contractility before latrunculin treatment, did not bleb. Selectively depolymerizing the actin cortex on one side of the cell yielded one or two large blebs while preserving an intact cortex on the opposite side. This enabled us to estimate the intracellular pressure (45–300 Pa) and the cortical tension (0.13–0.9 mN m−1). Hence, the apparent rigidity of the actin cortex in metaphase is due to active contraction of the actin cortex and myosin contractility may play an indirect role in spindle centering by rigidifying the actin cortex. In a recent article (10), latrunculin treatment on blebbing cells impeded bleb creation on the treated side and had no effect on the untreated side. Why is this result different from local latrunculin treatment of cells arrested in metaphase? The constitutively blebbing cells used in our previous study are deficient in the actin-binding protein filamin, which also links the actin cytoskeleton to the cell membrane (56). Therefore, in those cells, the critical detachment size is small because the membrane-cortex adhesion energy is reduced and even small pressure transients give rise to a bleb preventing global pressure build-up. In Hela cells arrested in metaphase, the adhesion between the membrane and the cortex is stronger and therefore, localized contractions of the actin cortex give rise to a global increment in intracellular pressure rather than a bleb. When the cortex is locally depolymerized, this built-up global pressure (∼300 Pa; Fig. 2 A) is released and forms a large bleb, whereas in blebbing cells, global pressure is much smaller (∼40 Pa, (33)) and no bleb forms.
While blebs clearly serve literally and figuratively as a window into cytomechanics, it is also interesting to consider their biological function. In the context of embryonic cell migration and some cell lines such as walker carcinosarcoma (53), polarized blebbing at the front of the cell leads to the formation of protrusions known as “lobopodia”. Concomitant with lobopodium protrusion, a uropod at the rear of the cell contracts, and the cell mass streams forward. For these dynamics to translate into net movement, the cell must somehow coordinate local adhesion to the extracellular matrix with bleb and uropod dynamics. Bleb protrusion may have a general role in promoting de-adhesion. Indeed, the dramatic plasma membrane movement associated with blebbing might break adhesive bonds, and/or the new membrane may protrude faster than it can adhere to the substrate, thereby allowing the front of the cell to move forward. Speculating further, blebbing in cancer cells might promote extrusion of cells from epithelia before metastasis, and blastomere blebbing might help reverse adhesion before cell rearrangement. These are interesting avenues for further study.
Acknowledgments
The authors thank the Nikon Imaging Center and its director Dr. Jennifer Waters. The authors also thank the Center for Nanoscale Systems at Harvard University and particularly Drs. Richard Schalek and David Bell. G.T.C. thanks Kristen Kwan, Saori Haigo, and Bill Brieher for help with the circus movement studies.
G.T.C. was supported by an overseas fellowship from the Wellcome Trust and a University Research Fellowship from the Royal Society.
Footnotes
Editor: Alexander van Oudenaarden.
Contributor Information
Guillaume T. Charras, Email: g.charras@ucl.ac.uk.
L. Mahadevan, Email: lm@seas.harvard.edu.
References
- 1.Fishkind D.J., Cao L.G., Wang Y.L. Microinjection of the catalytic fragment of myosin light chain kinase into dividing cells: effects on mitosis and cytokinesis. J. Cell Biol. 1991;114:967–975. doi: 10.1083/jcb.114.5.967. [DOI] [PMC free article] [PubMed] [Google Scholar]
- 2.Paluch E., Sykes C., Prost J., Bornens M. Dynamic modes of the cortical actomyosin gel during cell locomotion and division. Trends Cell Biol. 2006;16:5–10. doi: 10.1016/j.tcb.2005.11.003. [DOI] [PubMed] [Google Scholar]
- 3.Mills J.C., Stone N.L., Erhardt J., Pittman R.N. Apoptotic membrane blebbing is regulated by myosin light chain phosphorylation. J. Cell Biol. 1998;140:627–636. doi: 10.1083/jcb.140.3.627. [DOI] [PMC free article] [PubMed] [Google Scholar]
- 4.Trinkaus J.P. Surface activity and locomotion of Fundulus deep cells during blastula and gastrula stages. Dev. Biol. 1973;30:69–103. doi: 10.1016/0012-1606(73)90049-3. [DOI] [PubMed] [Google Scholar]
- 5.Friedl P., Wolf K. Tumor-cell invasion and migration: diversity and escape mechanisms. Nat. Rev. Cancer. 2003;3:362–374. doi: 10.1038/nrc1075. [DOI] [PubMed] [Google Scholar]
- 6.Blaser H., Reichman-Fried M., Castanon I., Dumstrei K., Marlow F.L., Kawakami K., Solnica-Krezel L., Heisenberg C.P., Raz E. Migration of zebrafish primordial germ cells: a role for myosin contraction and cytoplasmic flow. Dev. Cell. 2006;11:613–627. doi: 10.1016/j.devcel.2006.09.023. [DOI] [PubMed] [Google Scholar]
- 7.Yoshida K., Soldati T. Dissection of amoeboid movement into two mechanically distinct modes. J. Cell Sci. 2006;119:3833–3844. doi: 10.1242/jcs.03152. [DOI] [PubMed] [Google Scholar]
- 8.Johnson K.E. Circus movements and blebbing locomotion in dissociated embryonic cells of an amphibian, Xenopus laevis. J. Cell Sci. 1976;22:575–583. doi: 10.1242/jcs.22.3.575. [DOI] [PubMed] [Google Scholar]
- 9.Cunningham C.C., Gorlin J.B., Kwiatkowski D.J., Hartwig J.H., Janmey P.A., Byers H.R., Stossel T.P. Actin-binding protein requirement for cortical stability and efficient locomotion. Science. 1992;255:325–327. doi: 10.1126/science.1549777. [DOI] [PubMed] [Google Scholar]
- 10.Charras G.T., Yarrow J.C., Horton M.A., Mahadevan L., Mitchison T.J. Non-equilibration of hydrostatic pressure in blebbing cells. Nature. 2005;435:365–369. doi: 10.1038/nature03550. [DOI] [PMC free article] [PubMed] [Google Scholar]
- 11.Charras G.T., Hu C.K., Coughlin M., Mitchison T.J. Reassembly of contractile actin cortex in cell blebs. J. Cell Biol. 2006;175:477–490. doi: 10.1083/jcb.200602085. [DOI] [PMC free article] [PubMed] [Google Scholar]
- 12.Olson E.C. Onset of electrical excitability during a period of circus plasma membrane movements in differentiating Xenopus neurons. J. Neurosci. 1996;16:5117–5129. doi: 10.1523/JNEUROSCI.16-16-05117.1996. [DOI] [PMC free article] [PubMed] [Google Scholar]
- 13.Kubota H.Y. Creeping locomotion of the endodermal cells dissociated from gastrulae of the Japanese newt, Cynops pyrrhogaster. Exp. Cell Res. 1981;133:137–148. doi: 10.1016/0014-4827(81)90364-5. [DOI] [PubMed] [Google Scholar]
- 14.Fujinami N. Studies on the mechanism of circus movement in dissociated embryonic cells of a teleost, Oryzias latipes: fine-structural observations. J. Cell Sci. 1976;22:133–147. doi: 10.1242/jcs.22.1.133. [DOI] [PubMed] [Google Scholar]
- 15.Cunningham C.C. Actin polymerization and intracellular solvent flow in cell surface blebbing. J. Cell Biol. 1995;129:1589–1599. doi: 10.1083/jcb.129.6.1589. [DOI] [PMC free article] [PubMed] [Google Scholar]
- 16.Skoufias D.A., DeBonis S., Saoudi Y., Lebeau L., Crevel I., Cross R., Wade R.H., Hackney D., Kozielski F. S-trityl-L-cysteine is a reversible, tight binding inhibitor of the human kinesin Eg5 that specifically blocks mitotic progression. J. Biol. Chem. 2006;281:17559–17569. doi: 10.1074/jbc.M511735200. [DOI] [PubMed] [Google Scholar]
- 17.Kwan K.M., Kirschner M.W. Xbra functions as a switch between cell migration and convergent extension in the Xenopus gastrula. Development. 2003;130:1961–1972. doi: 10.1242/dev.00412. [DOI] [PubMed] [Google Scholar]
- 18.Waterman-Storer C.M., Danuser G. New directions for fluorescent speckle microscopy. Curr. Biol. 2002;12:R633–R640. doi: 10.1016/s0960-9822(02)01139-9. [DOI] [PubMed] [Google Scholar]
- 19.Pecreaux J., Dobereiner H.G., Prost J., Joanny J.F., Bassereau P. Refined contour analysis of giant unilamellar vesicles. Eur. Phys. J. E Soft Matter. 2004;13:277–290. doi: 10.1140/epje/i2004-10001-9. [DOI] [PubMed] [Google Scholar]
- 20.Heuser J.E., Kirschner M.W. Filament organization revealed in platinum replicas of freeze-dried cytoskeletons. J. Cell Biol. 1980;86:212–234. doi: 10.1083/jcb.86.1.212. [DOI] [PMC free article] [PubMed] [Google Scholar]
- 21.Medalia O., Weber I., Frangakis A.S., Nicastro D., Gerisch G., Baumeister W. Macromolecular architecture in eukaryotic cells visualized by cryoelectron tomography. Science. 2002;298:1209–1213. doi: 10.1126/science.1076184. [DOI] [PubMed] [Google Scholar]
- 22.Biot M. General theory of three-dimensional consolidation. J. Appl. Phys. 1941;12:155–164. [Google Scholar]
- 23.Wang H. Princeton University Press; Princeton, NJ: 2000. Theory of Linear Poroelasticity with Applications to Geomechanics and Hydrogeology. [Google Scholar]
- 24.Dembo M., Harlow F. Cell motion, contractile networks, and the physics of interpenetrating reactive flow. Biophys. J. 1986;50:109–121. doi: 10.1016/S0006-3495(86)83444-0. [DOI] [PMC free article] [PubMed] [Google Scholar]
- 25.Coughlin M.F., Puig-de-Morales M., Bursac P., Mellema M., Millet E., Fredberg J.J. Filamin-a and rheological properties of cultured melanoma cells. Biophys. J. 2006;90:2199–2205. doi: 10.1529/biophysj.105.061267. [DOI] [PMC free article] [PubMed] [Google Scholar]
- 26.Mastro A.M., Babich M.A., Taylor W.D., Keith A.D. Diffusion of a small molecule in the cytoplasm of mammalian cells. Proc. Natl. Acad. Sci. USA. 1984;81:3414–3418. doi: 10.1073/pnas.81.11.3414. [DOI] [PMC free article] [PubMed] [Google Scholar]
- 27.Kreis T.E., Geiger B., Schlessinger J. Mobility of microinjected rhodamine actin within living chicken gizzard cells determined by fluorescence photobleaching recovery. Cell. 1982;29:835–845. doi: 10.1016/0092-8674(82)90445-7. [DOI] [PubMed] [Google Scholar]
- 28.Luby-Phelps K., Castle P.E., Taylor D.L., Lanni F. Hindered diffusion of inert tracer particles in the cytoplasm of mouse 3T3 cells. Proc. Natl. Acad. Sci. USA. 1987;84:4910–4913. doi: 10.1073/pnas.84.14.4910. [DOI] [PMC free article] [PubMed] [Google Scholar]
- 29.Alberts B., Bray D., Lewis J., Raff M., Roberts K., Watson J. Garland; New York: 2004. Molecular Biology of the Cell. [Google Scholar]
- 30.Cheung A., Dantzig J.A., Hollingworth S., Baylor S.M., Goldman Y.E., Mitchison T.J., Straight A.F. A small-molecule inhibitor of skeletal muscle myosin II. Nat. Cell Biol. 2002;4:83–88. doi: 10.1038/ncb734. [DOI] [PubMed] [Google Scholar]
- 31.Boal D.H. Cambridge University Press; Cambridge, UK: 2002. Mechanics of the Cell. [Google Scholar]
- 32.Gautreau A., Louvard D., Arpin M. Morphogenic effects of ezrin require a phosphorylation-induced transition from oligomers to monomers at the plasma membrane. J. Cell Biol. 2000;150:193–203. doi: 10.1083/jcb.150.1.193. [DOI] [PMC free article] [PubMed] [Google Scholar]
- 33.Evans E., Leung A. Adhesivity and rigidity of erythrocyte membrane in relation to wheat germ agglutinin binding. J. Cell Biol. 1984;98:1201–1208. doi: 10.1083/jcb.98.4.1201. [DOI] [PMC free article] [PubMed] [Google Scholar]
- 34.Dai J., Sheetz M.P. Membrane tether formation from blebbing cells. Biophys. J. 1999;77:3363–3370. doi: 10.1016/S0006-3495(99)77168-7. [DOI] [PMC free article] [PubMed] [Google Scholar]
- 35.Hochmuth R.M., Marcus W.D. Membrane tethers formed from blood cells with available area and determination of their adhesion energy. Biophys. J. 2002;82:2964–2969. doi: 10.1016/S0006-3495(02)75637-3. [DOI] [PMC free article] [PubMed] [Google Scholar]
- 36.Ramamurthy B., Yengo C.M., Straight A.F., Mitchison T.J., Sweeney H.L. Kinetic mechanism of blebbistatin inhibition of nonmuscle myosin IIb. Biochemistry. 2004;43:14832–14839. doi: 10.1021/bi0490284. [DOI] [PubMed] [Google Scholar]
- 37.Straight A.F., Cheung A., Limouze J., Chen I., Westwood N.J., Sellers J.R., Mitchison T.J. Dissecting temporal and spatial control of cytokinesis with a myosin II inhibitor. Science. 2003;299:1743–1747. doi: 10.1126/science.1081412. [DOI] [PubMed] [Google Scholar]
- 38.Hamill O.P., Martinac B. Molecular basis of mechano-transduction in living cells. Physiol. Rev. 2001;81:685–740. doi: 10.1152/physrev.2001.81.2.685. [DOI] [PubMed] [Google Scholar]
- 39.McNeil P.L., Vogel S.S., Miyake K., Terasaki M. Patching plasma membrane disruptions with cytoplasmic membrane. J. Cell Sci. 2000;113:1891–1902. doi: 10.1242/jcs.113.11.1891. [DOI] [PubMed] [Google Scholar]
- 40.Gardel M.L., Shin J.H., MacKintosh F.C., Mahadevan L., Matsudaira P., Weitz D.A. Elastic behavior of cross-linked and bundled actin networks. Science. 2004;304:1301–1305. doi: 10.1126/science.1095087. [DOI] [PubMed] [Google Scholar]
- 41.Shin J.H., Gardel M.L., Mahadevan L., Matsudaira P., Weitz D.A. Relating microstructure to rheology of a bundled and cross-linked F-actin network in vitro. Proc. Natl. Acad. Sci. USA. 2004;101:9636–9641. doi: 10.1073/pnas.0308733101. [DOI] [PMC free article] [PubMed] [Google Scholar]
- 42.Gittes F., Mickey B., Nettleton J., Howard J. Flexural rigidity of microtubules and actin filaments measured from thermal fluctuations in shape. J. Cell Biol. 1993;120:923–934. doi: 10.1083/jcb.120.4.923. [DOI] [PMC free article] [PubMed] [Google Scholar]
- 43.Gibson L., Ashby M. The mechanics of three-dimensional cellular materials. Proc. R. Soc. Lond. A. 1982;382:43–59. [Google Scholar]
- 44.Zilker A., Ziegler M., Sackmann E. Spectral analysis of erythrocyte flickering in the 0.3–4- μm-1 regime by microinterferometry combined with fast image processing. Phys. Rev. A. 1992;46:7998–8001. doi: 10.1103/physreva.46.7998. [DOI] [PubMed] [Google Scholar]
- 45.Howard J. Sinauer Associates; Sunderland, MA: 2001. Mechanics of Motor Proteins and the Cytoskeleton. [Google Scholar]
- 46.Cerda E., Mahadevan L. Geometry and physics of wrinkling. Phys. Rev. Lett. 2003;90:074302. doi: 10.1103/PhysRevLett.90.074302. [DOI] [PubMed] [Google Scholar]
- 47.Robinson D., Cavett G., Warrick H., Spudich J. Quantitation of the distribution and flux of myosin-II during cytokinesis. BMC Cell Biol. 2002;3:4. doi: 10.1186/1471-2121-3-4. [DOI] [PMC free article] [PubMed] [Google Scholar]
- 48.Evans E., Leung A., Zhelev D. Synchrony of cell spreading and contraction force as phagocytes engulf large pathogens. J. Cell Biol. 1993;122:1295–1300. doi: 10.1083/jcb.122.6.1295. [DOI] [PMC free article] [PubMed] [Google Scholar]
- 49.Sato M., Schwartz W., Pollard T. Dependence of the mechanical properties of actin/α-actinin gels on deformation rate. Nature. 1987;325:828–830. doi: 10.1038/325828a0. [DOI] [PubMed] [Google Scholar]
- 50.Fujinami N., Kageyama T. Circus movement in dissociated embryonic cells of a teleost, Oryzias latipes. J. Cell Sci. 1975;19:169–182. doi: 10.1242/jcs.19.1.169. [DOI] [PubMed] [Google Scholar]
- 51.Maddox A., Burridge K. RhoA is required for cortical retraction and rigidity during mitotic cell rounding. J. Cell Biol. 2003;160:255–265. doi: 10.1083/jcb.200207130. [DOI] [PMC free article] [PubMed] [Google Scholar]
- 52.Herant M., Heinrich V., Dembo M. Mechanics of neutrophil phagocytosis: experiments and quantitative models. J. Cell Sci. 2006;119:1903–1913. doi: 10.1242/jcs.02876. [DOI] [PubMed] [Google Scholar]
- 53.Keller H.U. Redundancy of lamellipodia in locomoting Walker carcinosarcoma cells. Cell Motil. Cytoskeleton. 2000;46:247–256. doi: 10.1002/1097-0169(200008)46:4<247::AID-CM2>3.0.CO;2-8. [DOI] [PubMed] [Google Scholar]
- 54.Helfer E., Harlepp S., Bourdieu L., Robert J., MacKintosh F., Chatenay D. Microrheology of biopolymer-membrane complexes. Phys. Rev. Lett. 2000;85:457–460. doi: 10.1103/PhysRevLett.85.457. [DOI] [PubMed] [Google Scholar]
- 55.Brieher W.M., Kueh H.Y., Ballif B.A., Mitchison T.J. Rapid actin monomer-insensitive depolymerization of Listeria actin comet tails by cofilin, coronin, and Aip1. J. Cell Biol. 2006;175:315–324. doi: 10.1083/jcb.200603149. [DOI] [PMC free article] [PubMed] [Google Scholar]
- 56.Stossel T.P., Condeelis J., Cooley L., Hartwig J.H., Noegel A., Schleicher M., Shapiro S.S. Filamins as integrators of cell mechanics and signaling. Nat. Rev. Mol. Cell Biol. 2001;2:138–145. doi: 10.1038/35052082. [DOI] [PubMed] [Google Scholar]