

Abstract
Evaluation of the T cell receptor (TCR) Vβ repertoire by flow cytometric analysis has been used for studying the T cell compartments for diseases in which T cells are implicated in the pathogenesis. For the interpretation of these studies information is needed about Vβ usage in healthy individuals and there are few data for normal usage in paediatric populations. We examined the T lymphocyte (sub)populations in 47 healthy controls (age range: 3 months−16 years). We found non-random Vβ usage with skewed reactivity of some families towards CD4+ or CD4– T cells. Importantly, there appeared to be no significant change in Vβ usage according to age group. Some controls showed expansions in some Vβ families, although incidence of such expansions was low. We went on to examine the repertoire of CD4+CD25Bright T regulatory cells in 25 healthy controls. We found overlapping quantitative usage for each of the Vβ families between CD4+CD25– and CD4+CD25Bright T cells. However, there was a significant preferential usage for five Vβ families and decreased usage of two Vβ families in the CD4+CD25Bright T cells, suggesting that although they overlap there may be subtle but important differences in the TCR repertoire of T regulatory cells.
Keywords: clonality, T cell receptor, Vβ repertoire
Introduction
T lymphocytes recognize antigens presented by self-major histocompatibility complex (MHC) molecules via the T cell receptor (TCR). TCRs are formed by random recombination of TCR gene elements and junctional region diversity during T cell intrathymic maturation, a process which allows for an extensive TCR repertoire, and the diversity of TCRs in a human at any given time has been estimated to be up to > 2 × 10⁷ [1]. The majority of peripheral blood T lymphocytes express the αβ-TCR receptor comprising a heterodimer of α- and β-chains. A complete TCR repertoire is indicative of an intact T cell population with the ability to recognize a wide range of immunogens [2].
Analysis of the TCR repertoire plays a crucial role in understanding the evolution and role of TCR diversity in immune responses. TCR repertoire analysis has been used for studying selective T cell responses in autoimmune diseases, transplantation, immune deficiency and protective immunity against tumour and microbial antigens. CDR3 length spectratyping and flow cytometric analysis of TCR Vβ families labelled with specific monoclonal antibodies are the most frequently used assays for the analysis of TCR Vβ repertoire. Flow cytometric analysis has advantages in that it is a rapid, relatively inexpensive test that is reproducible between laboratories and gives quantitative information within different T cell subsets [3–5]. Monoclonal antibodies to TCR Vβ families are now available covering > 70% of the whole TCR Vβ repertoire [4].
CD4+CD25+ T cells are crucial mediators of peripheral immune tolerance and are able to suppress T cells in a cell-contact dependent manner. The forkhead box P3 transcription factor (FoxP3) has been identified as the key gene required for generation of these so-called natural T regulatory cells (Tregs) [6]. Generation of Tregs from FoxP3– T cells has been described, although the role of this in vivo remains unclear [7,8]. Studies examining the TCR repertoire of CD4+CD25+ Tregs have varied. Some suggest a diverse repertoire with overlap of Treg repertoire with normal CD4+CD25– cells [7,9–11], whereas others have suggested that Tregs express different TCRs which are usually self-reactive [12,13].
References values for Vβ domain usage in healthy controls are essential for interpreting Vβ usage in disease states. Some control data are available for adult patients, but there are relatively few data available for paediatric populations. Here, using flow cytometric analysis, we analyse the repertoire of 47 healthy children from five different age groups ranging from 3 months to 16 years of age looking at CD3+, CD3+CD4+ and CD3+CD4– T cell subsets. We also analyse the TCR repertoire in CD4+CD25Bright Tregs and compare this to the CD4+CD25– T cell population in 25 controls.
Materials and methods
Blood samples
Peripheral blood samples were obtained from 47 (30 males, 17 females) apparently healthy, unrelated children undergoing a general anaesthetic at an elective day-case surgery unit. Samples were collected from five different age groups: 3–9 months (n = 5), > 9–24 months (n = 10), > 24 months−5 years (n = 10), > 5–10 years (n = 12) and > 10–16 years (n = 10). Notes were reviewed prior to approaching controls and children with infection, inflammation, allergic disease or other major comorbidity were excluded. Ethical approval for the study was obtained from the Newcastle and North Tyneside Research Ethics Committee 1 and written consent obtained from all patients and/or parents.
Immunofluorescent staining
Vβ staining was determined using four-colour flow cytometry with the IOTest Beta Mark TCR Repertoire Kit (Beckman Coulter, Marseille, France) which consists of monoclonal antibodies (mAbs) designed to identify 24 distinct TCR Vβ families. Each set consisted of three distinct anti-Vβ family-specific mAb labelled with fluorescein isothiocyanate (FITC), phycoerythrin (PE) or doubly labelled with FITC and PE. Fresh whole blood was stained simultaneously for tube 1 with CD3-peridinin chlorophyll (PerCP) (clone SK7) and CD4-allophycocyacin (APC) (clone SK3) and tube 2 with CD4-PerCP (clone SK3) and CD25-APC (clone 2A3) (BD Biosciences, Oxford, UK) to allow evaluation of the CD3+, CD3+CD4+, CD3+CD4–, CD4+CD25Bright and CD4+CD25– T cell subpopulations. Two hundered μl of whole blood was washed prior to incubation with CD3-PerCP/CD4-APC or CD4-PerCP/CD25-APC antibody mix with 20 μl of appropriate TCR-Vβ antibody for 20 min in the dark at room temperature. Erythrocytes were lysed using fluorescence activated cell sorter (FACS) lysing solution (Becton Dickinson, Oxford, UK) and cells washed before fixation in 1% formaldehyde. At least 10 000 CD3+ lymphocyte events for tube 1 and 10 000 CD4+ lymphocyte events for tube 2 were collected for analysis. For tube 1 the CD3+, CD3+CD4+ and CD3+CD4– populations lymphocytes were gated using forward- and side-scatter characteristics and cell populations gated according to CD3 and CD4 staining (Fig. 1). For tube 2 the CD4+CD25Bright and CD4+CD25– populations lymphocytes were gated using forward- and side-scatter characteristics and cell populations gated as for peripheral blood mononuclear cells (PBMCs) below. T cells were also analysed for TCR expression using TCR-αβ (clone WT31) and TCR-γδ (clone 11F2) (BD Biosciences).
Fig. 1.

Forward- and side-scatter (FSC/SSC) pattern of lysed whole blood (a) and gate settings for CD3+ (b), CD3+CD4+ and CD3+CD4– lymphocytes (c). Cell staining for T cell receptor (TCR) families Vβ 5·3 [phycoerythrin (PE)], Vβ 3 [fluorescein isothiocyanate (FITC)] and Vβ 7·1 (PE and FITC) in the CD3+CD4+ lymphocytes (d).
Intracellular FoxP3 expression was analysed using a commercially available kit (eBioesciences, San Diego, CA, USA). Briefly, PBMCs were separated over a Fycoll gradient. Twenty μl of CD4 (clone RPA-T4) and CD25 cocktail (clone BC96) was added to 1 × 10⁶ PBMCs and incubated for 30 min in the dark at 4°C. Cells were washed in 1 ml of cold flow cytometry buffer and incubated in 1 ml of fixation/permeabilization solution (eBioesciences) for 45 min in the dark at 4°C. Cells were then washed in permeabilization buffer (eBioesciences) and incubated with 20 μl of FoxP3 for 30 min in the dark at 4°C. Cells were then washed in permeabilization buffer and resuspended in flow cytometry buffer. At least 100 000 PBMCs were collected for analysis. To discriminate between CD25Bright Treg and CD25+ activated effector-memory T cells, we used CD25 expression on CD4– cells as an internal control (Fig. 2). Only CD4+ cells expressing CD25 with higher intensities than the CD4– cells were included in the gate for CD25Bright cells.
Fig. 2.

(a) To discriminate between CD25Bright T regulatory and CD25+ activated effector-memory T cells in separated peripheral blood mononuclear cells (PBMCs) we used CD25 expression on CD4– cells as an internal control. Only CD4+ cells expressing CD25 with higher intensities than the CD4– cells were included in the gate for CD25Bright cells. (b) To gate for forkhead box P3 (FoxP3) expression in PBMCs we used CD4– cells as an internal control. Only CD4+ cells expressing FoxP3 with higher intensities than the CD4– cells were considered FoxP3 positive. (c) Percentage of FoxP3 positivity for cells through the CD4+CD25Bright gate. (d) Percentage of FoxP3 positivity for cells through the CD4+CD25– gate.
Data acquisition was performed using a FACSCalibur flow cytometer and Cellquest software (BD Biosciences). FlowJo 7·2 (Tree Star) was used for data analysis.
Calculation of Vβ expression
In order to correct for differing frequencies of TCR-αβ and TCR-δγ T cells causing unwanted variability in Vβ expression, the relative frequency of TCR-αβ T cells in each of the CD3+, CD3+CD4+ and CD3+CD4– T cell subsets was analysed. Because γδ T cells exhibit negligible expression of CD4 [3], the CD3+CD4+ population was assumed to contain no γδ T cells. The percentage of TCR-αβ in the CD3+CD4– population was calculated by dividing the total numbers of TCR-γδ CD3+ T cells by the total numbers of CD3+CD4– T cells × 10−2 to obtain a percentage of TCR-γδ CD3+CD4– T cells (and hence percentage of TCR-αβ). The relative frequency of Vβ expression in the CD3+ and CD3+CD4– gates was then calculated per TCR-αβ T lymphocytes by dividing the percentage Vβ family expression per CD3 (or CD3+CD4–) by the percentage of TCR-αβ per CD3 (or CD3+CD4–) × 10−2. To analyse the difference in TCR Vβ usage we calculated P-values for the difference between lymphocytes subpopulations using the Wilcoxon signed-ranks test. Analysis of usage for TCR Vβ families between the different age groups was analysed using a one-way analysis of variance (anova) test.
Results
We first analysed TCR Vβ usage using the panel of 24 monoclonal antibodies to TCR Vβ families that stained approximately 75% of CD3+, CD3+CD4+ and CD3+CD4– TCR-αβ T cells. Table 1 shows the mean values and standard deviations of the TCR repertoire of CD3+ TCR-αβ, CD3+CD4+ TCR-αβ and CD3+CD4– TCR-αβ in each age group as well as the total group. TCR Vβ usage appears to be non-random, varying from mean values of less than 0·53% for Vβ 23 to high mean values of 10·32% for Vβ 2 in CD3+CD4+ T cells.
Table 1.
Vβ repertoire usage in T cell receptor (TCR)αβ+ T cell (sub)populations.
| 2 weeks−9 months (n = 5) | 9 months−2 years (n = 10) | 2–5 years (n = 10) | 5–10 years (n = 12) | 10–16 years (n = 10) | Total (n = 47) | |||||||
|---|---|---|---|---|---|---|---|---|---|---|---|---|
| M | s.d. | M | s.d. | M | s.d. | M | s.d. | M | s.d. | M | s.d. | |
| % per CD3+/TCRVαβ+ | ||||||||||||
| Vβ 1 | 3·64 | 0·15 | 4·12 | 0·78 | 3·99 | 0·88 | 3·87 | 0·94 | 4·07 | 0·87 | 3·97 | 0·81 |
| Vβ 2 | 9·97 | 0·31 | 9·02 | 1·53 | 8·86 | 1·56 | 8·02 | 1·52 | 8·69 | 1·15 | 8·76 | 1·44 |
| Vβ 3 | 5·69 | 3·07 | 6·53 | 2·27 | 4·98 | 2·88 | 3·61 | 2·59 | 3·74 | 2·97 | 4·77 | 2·85 |
| Vβ 4 | 2·08 | 0·18 | 2·11 | 0·36 | 2·17 | 0·31 | 2·21 | 0·27 | 2·15 | 0·38 | 2·15 | 0·31 |
| Vβ 5·1 | 5·86 | 0·77 | 4·77 | 0·67 | 4·99 | 1·10 | 5·33 | 0·74 | 5·04 | 0·65 | 5·13 | 0·83 |
| Vβ 5·2 | 1·31 | 0·26 | 1·66 | 0·51 | 1·67 | 0·22 | 1·57 | 0·34 | 1·62 | 0·25 | 1·59 | 0·34 |
| Vβ 5·3 | 0·73 | 0·32 | 0·98 | 0·22 | 1·19 | 0·45 | 1·07 | 0·14 | 0·91 | 0·17 | 1·01 | 0·30 |
| Vβ 7·1 | 2·71 | 0·51 | 2·63 | 0·81 | 2·67 | 0·53 | 3·02 | 0·67 | 2·74 | 0·69 | 2·77 | 0·65 |
| Vβ 7·2 | 1·03 | 0·77 | 1·68 | 0·73 | 1·48 | 0·91 | 1·40 | 0·57 | 1·66 | 0·84 | 1·49 | 0·76 |
| Vβ 8 | 4·49 | 0·86 | 4·60 | 0·84 | 5·42 | 1·01 | 4·75 | 0·88 | 5·16 | 0·78 | 4·92 | 0·91 |
| Vβ 9 | 2·95 | 0·22 | 3·51 | 1·00 | 3·35 | 0·41 | 3·50 | 1·06 | 3·46 | 0·85 | 3·40 | 0·82 |
| Vβ 11 | 0·88 | 0·08 | 1·16 | 0·73 | 0·92 | 0·13 | 1·06 | 0·26 | 1·04 | 0·34 | 1·03 | 0·40 |
| Vβ 12 | 1·68 | 0·29 | 1·66 | 0·33 | 1·81 | 0·38 | 1·54 | 0·46 | 1·74 | 0·38 | 1·68 | 0·38 |
| Vβ 13·1 | 4·52 | 0·55 | 4·98 | 0·88 | 5·02 | 0·59 | 4·73 | 0·76 | 4·55 | 0·57 | 4·78 | 0·70 |
| Vβ 13·2 | 3·18 | 1·22 | 3·63 | 1·03 | 3·53 | 1·40 | 3·72 | 0·79 | 4·02 | 1·22 | 3·67 | 1·10 |
| Vβ 13·6 | 1·79 | 0·33 | 1·86 | 0·25 | 1·79 | 0·45 | 1·70 | 0·22 | 1·78 | 0·19 | 1·78 | 0·29 |
| Vβ 14 | 4·49 | 0·94 | 4·73 | 1·11 | 4·49 | 0·94 | 4·28 | 0·87 | 4·01 | 0·70 | 4·38 | 0·91 |
| Vβ 16 | 1·25 | 0·89 | 1·02 | 0·31 | 0·89 | 0·24 | 1·02 | 0·18 | 1·13 | 0·09 | 1·04 | 0·35 |
| Vβ 17 | 5·07 | 0·41 | 5·36 | 0·86 | 5·73 | 1·18 | 5·11 | 0·45 | 5·40 | 0·50 | 5·35 | 0·77 |
| Vβ 18 | 1·40 | 0·39 | 1·09 | 0·16 | 1·31 | 0·60 | 1·23 | 0·36 | 1·18 | 0·20 | 1·23 | 0·37 |
| Vβ 20 | 3·22 | 0·70 | 3·12 | 1·28 | 2·85 | 0·82 | 2·47 | 1·12 | 2·82 | 0·65 | 2·84 | 0·97 |
| Vβ 21·3 | 2·54 | 0·41 | 2·80 | 0·21 | 2·56 | 0·39 | 2·62 | 0·47 | 2·56 | 0·31 | 2·63 | 0·37 |
| Vβ 22 | 3·03 | 0·30 | 3·41 | 0·62 | 3·57 | 0·50 | 3·82 | 0·45 | 3·55 | 0·69 | 3·54 | 0·57 |
| Vβ 23 | 0·72 | 0·12 | 1·13 | 0·28 | 1·13 | 0·39 | 1·01 | 0·29 | 1·09 | 0·38 | 1·05 | 0·33 |
| Total TCR | 74·23 | 2·70 | 77·55 | 3·98 | 75·62 | 3·47 | 72·67 | 3·18 | 74·11 | 5·15 | 74·97 | 3·93 |
| % per CD3+CD4+/TCRVαβ+ | ||||||||||||
| Vβ 1 | 3·54 | 0·10 | 3·38 | 0·54 | 3·52 | 0·77 | 3·37 | 0·75 | 3·51 | 0·57 | 3·45 | 0·62 |
| Vβ 2 | 12·16 | 0·93 | 10·98 | 1·90 | 10·34 | 1·62 | 9·44 | 1·58 | 9·79 | 1·22 | 10·32 | 1·70 |
| Vβ 3 | 5·87 | 3·19 | 6·17 | 2·43 | 5·14 | 3·07 | 3·76 | 2·74 | 3·57 | 2·47 | 4·75 | 2·84 |
| Vβ 4 | 2·09 | 0·23 | 2·12 | 0·30 | 2·23 | 0·28 | 2·28 | 0·21 | 2·28 | 0·45 | 2·22 | 0·30 |
| Vβ 5·1 | 6·74 | 0·58 | 5·88 | 1·02 | 6·32 | 1·15 | 7·09 | 0·97 | 6·24 | 0·69 | 6·45 | 1·00 |
| Vβ 5·2 | 1·36 | 0·25 | 1·49 | 0·25 | 1·59 | 0·20 | 1·49 | 0·27 | 1·64 | 0·19 | 1·53 | 0·24 |
| Vβ 5·3 | 0·73 | 0·31 | 0·98 | 0·22 | 1·06 | 0·14 | 1·05 | 0·18 | 0·99 | 0·08 | 0·99 | 0·20 |
| Vβ 7·1 | 2·04 | 0·20 | 1·98 | 0·66 | 2·16 | 0·58 | 2·31 | 0·78 | 2·33 | 0·64 | 2·18 | 0·63 |
| Vβ 7·2 | 0·86 | 0·74 | 1·25 | 0·51 | 1·13 | 0·72 | 1·05 | 0·45 | 1·29 | 0·66 | 1·14 | 0·60 |
| Vβ 8 | 4·26 | 0·67 | 4·68 | 0·63 | 5·63 | 0·93 | 5·19 | 0·76 | 5·25 | 0·51 | 5·09 | 0·81 |
| Vβ 9 | 3·20 | 0·28 | 3·95 | 0·97 | 3·73 | 0·51 | 4·08 | 1·05 | 3·98 | 0·75 | 3·86 | 0·82 |
| Vβ 11 | 0·95 | 0·11 | 1·13 | 0·66 | 0·95 | 0·14 | 1·04 | 0·21 | 0·95 | 0·14 | 1·01 | 0·33 |
| Vβ 12 | 1·76 | 0·38 | 1·86 | 0·36 | 1·90 | 0·33 | 1·72 | 0·43 | 1·91 | 0·36 | 1·83 | 0·37 |
| Vβ 13·1 | 4·71 | 0·58 | 5·18 | 0·89 | 4·93 | 0·38 | 5·13 | 0·87 | 4·69 | 0·41 | 4·96 | 0·68 |
| Vβ 13·2 | 3·12 | 1·32 | 3·48 | 1·02 | 3·27 | 1·28 | 3·27 | 0·80 | 3·70 | 1·27 | 3·39 | 1·09 |
| Vβ 13·6 | 1·88 | 0·33 | 2·07 | 0·19 | 1·97 | 0·36 | 1·89 | 0·17 | 2·05 | 0·24 | 1·98 | 0·26 |
| Vβ 14 | 3·44 | 0·82 | 3·22 | 0·80 | 3·07 | 0·70 | 2·54 | 0·48 | 2·78 | 0·60 | 2·94 | 0·71 |
| Vβ 16 | 0·85 | 0·12 | 0·94 | 0·25 | 0·85 | 0·20 | 0·94 | 0·17 | 1·07 | 0·15 | 0·94 | 0·20 |
| Vβ 17 | 5·09 | 0·22 | 5·22 | 0·91 | 5·77 | 1·13 | 5·03 | 0·59 | 5·68 | 0·48 | 5·37 | 0·80 |
| Vβ 18 | 1·76 | 0·50 | 1·44 | 0·23 | 1·70 | 0·82 | 1·71 | 0·36 | 1·66 | 0·38 | 1·64 | 0·49 |
| Vβ 20 | 3·16 | 0·55 | 3·29 | 1·29 | 3·08 | 0·83 | 2·66 | 1·30 | 3·04 | 0·75 | 3·02 | 1·03 |
| Vβ 21·3 | 2·58 | 0·43 | 2·66 | 0·25 | 2·48 | 0·32 | 2·64 | 0·36 | 2·53 | 0·29 | 2·58 | 0·32 |
| Vβ 22 | 3·33 | 0·46 | 3·44 | 0·57 | 3·59 | 0·34 | 4·27 | 0·54 | 3·89 | 0·64 | 3·77 | 0·61 |
| Vβ 23 | 0·46 | 0·11 | 0·55 | 0·09 | 0·57 | 0·19 | 0·51 | 0·17 | 0·53 | 0·17 | 0·53 | 0·15 |
| Total TCR | 75·93 | 2·84 | 77·30 | 3·63 | 76·98 | 2·23 | 74·44 | 1·68 | 75·37 | 4·16 | 75·95 | 3·10 |
| % per CD3+CD4–/TCRVαβ+ | ||||||||||||
| Vβ 1 | 4·15 | 0·71 | 5·51 | 1·26 | 4·91 | 1·23 | 4·38 | 1·70 | 5·18 | 1·60 | 4·88 | 1·44 |
| Vβ 2 | 4·95 | 0·35 | 6·21 | 1·13 | 6·49 | 1·75 | 6·38 | 1·80 | 7·21 | 1·59 | 6·39 | 1·58 |
| Vβ 3 | 5·47 | 3·01 | 7·11 | 2·07 | 4·89 | 2·78 | 3·39 | 2·45 | 4·23 | 4·07 | 4·90 | 3·10 |
| Vβ 4 | 2·40 | 0·31 | 2·55 | 0·55 | 2·37 | 0·39 | 2·16 | 0·38 | 2·12 | 0·33 | 2·30 | 0·43 |
| Vβ 5·1 | 3·93 | 1·06 | 3·23 | 0·83 | 2·82 | 0·82 | 3·29 | 0·82 | 3·46 | 0·70 | 3·28 | 0·85 |
| Vβ 5·2 | 1·33 | 0·46 | 2·01 | 1·06 | 1·88 | 0·41 | 1·75 | 0·50 | 1·65 | 0·51 | 1·77 | 0·65 |
| Vβ 5·3 | 0·76 | 0·36 | 1·05 | 0·35 | 1·46 | 1·11 | 1·12 | 0·42 | 0·87 | 0·28 | 1·09 | 0·62 |
| Vβ 7·1 | 4·61 | 1·14 | 3·90 | 1·31 | 3·85 | 0·70 | 3·84 | 0·81 | 3·50 | 1·10 | 3·86 | 1·02 |
| Vβ 7·2 | 1·43 | 1·09 | 2·32 | 1·08 | 1·81 | 1·22 | 1·79 | 0·79 | 2·22 | 1·21 | 1·96 | 1·07 |
| Vβ 8 | 5·18 | 1·94 | 4·83 | 1·48 | 5·44 | 1·64 | 4·20 | 1·29 | 5·31 | 1·74 | 4·94 | 1·58 |
| Vβ 9 | 2·51 | 0·34 | 3·24 | 1·44 | 2·90 | 0·61 | 2·97 | 1·52 | 2·93 | 1·11 | 2·95 | 1·15 |
| Vβ 11 | 0·77 | 0·09 | 1·14 | 0·73 | 0·91 | 0·20 | 1·09 | 0·43 | 1·37 | 1·26 | 1·09 | 0·71 |
| Vβ 12 | 1·48 | 0·17 | 1·41 | 0·34 | 1·66 | 0·68 | 1·29 | 0·59 | 1·56 | 0·47 | 1·47 | 0·51 |
| Vβ 13·1 | 4·21 | 0·71 | 4·56 | 0·93 | 5·37 | 1·40 | 4·25 | 0·65 | 4·58 | 1·28 | 4·62 | 1·10 |
| Vβ 13·2 | 3·47 | 0·95 | 4·21 | 1·25 | 4·26 | 1·53 | 4·21 | 1·19 | 4·86 | 1·38 | 4·28 | 1·30 |
| Vβ 13·6 | 1·55 | 0·48 | 1·59 | 0·32 | 1·66 | 0·66 | 1·47 | 0·30 | 1·47 | 0·30 | 1·54 | 0·41 |
| Vβ 14 | 7·46 | 1·95 | 7·33 | 1·58 | 7·33 | 2·20 | 6·26 | 1·44 | 6·15 | 1·76 | 6·82 | 1·79 |
| Vβ 16 | 2·36 | 3·46 | 1·13 | 0·49 | 1·00 | 0·38 | 1·14 | 0·34 | 1·27 | 0·32 | 1·27 | 1·15 |
| Vβ 17 | 5·38 | 1·01 | 5·74 | 1·20 | 5·96 | 1·88 | 5·18 | 1·10 | 5·07 | 0·75 | 5·46 | 1·26 |
| Vβ 18 | 0·64 | 0·17 | 0·69 | 0·34 | 0·67 | 0·39 | 0·66 | 0·34 | 0·64 | 0·32 | 0·66 | 0·32 |
| Vβ 20 | 4·00 | 1·07 | 3·34 | 1·39 | 2·77 | 1·37 | 2·28 | 1·03 | 2·93 | 1·04 | 2·93 | 1·26 |
| Vβ 21·3 | 2·75 | 0·75 | 3·02 | 0·57 | 2·72 | 0·74 | 2·64 | 0·68 | 2·73 | 0·47 | 2·77 | 0·63 |
| Vβ 22 | 2·50 | 0·37 | 3·47 | 0·92 | 3·62 | 1·27 | 3·31 | 0·63 | 3·16 | 0·97 | 3·29 | 0·94 |
| Vβ 23 | 2·34 | 0·84 | 2·22 | 0·47 | 2·12 | 0·71 | 1·60 | 0·53 | 1·93 | 0·64 | 1·99 | 0·65 |
| Total TCR | 75·63 | 5·37 | 81·82 | 5·87 | 77·78 | 8·78 | 70·66 | 5·43 | 76·38 | 8·39 | 76·29 | 7·79 |
M: mean values; s.d.: standard deviation.
Comparison of TCR Vβ usage between CD3+CD4+ and CD3+CD4– T cell subpopulations showed significant differences between the groups, with an increased frequency of Vβ 2, Vβ 5·1, Vβ 9, Vβ 12, Vβ 13·6, Vβ 18 and Vβ 22 usage in CD3+CD4+ T cells (P < 0·001) and increased frequency of Vβ 1, Vβ 7·1, Vβ 7·2, Vβ 14, Vβ 16 and Vβ 23 usage in CD3+CD4– subsets (P < 0·001) (Fig. 3).
Fig. 3.
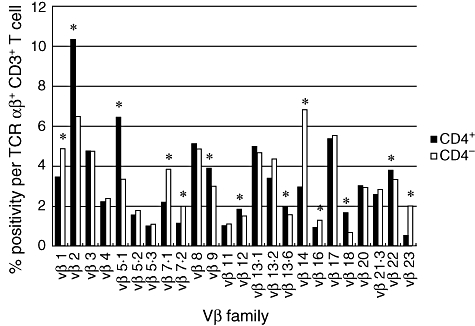
Schematic overview showing mean values of all controls for Vβ positivity for T cell receptor (TCR) αβ+CD3+ T lymphocytes in CD4+ and CD4– subpopulations using a panel of 24 TCR Vβ monoclonal antibodies. *Vβ families with skewed reactivity toward CD4+ or CD4– T cells (P < 0·001).
There was no statistical difference in Vβ usage between all the different age groups for each of the 24 TCR Vβ families in the CD3+ and CD3+CD4– T cell populations (P > 0·01) (Fig. 4). In the CD3+CD4+ group for 20 of 24 families there were no significant differences between the age groups. There was increased Vβ2 usage in the < 9 months compared to the 5–10-year age group only; a decreased Vβ 5·3 usage in the < 9 months group compared to the 2–5- and 5–10-year age groups but not the 9 months−1 year or 10–16-year age groups; an increased Vβ 8 usage in the 2–5-year group compared to patients aged < 9 months only and an increase in Vβ 22 usage in < 9-month-olds compared to children aged only 5–10 years P < 0·01).
Fig. 4.

Means ± 1 standard deviation for Vβ positivity within the CD3+ T cell receptor-αβ+ for each of the five age groups. Within each Vβ family there are five sets of values representing (from left to right) 3–9 months, > 9–24 months, > 24 months−5 years, > 5–10 years and > 10–16 years. There were no statistical differences between age groups for each Vβ family.
We analysed the incidence of perturbations in Vβ families using the arbitrary definition of an expansion/dropout as outwith 3 standard deviations as suggested previously [3,14]. Strikingly, there were no dropouts in any Vβ family of the controls studied. We identified seven controls with CD3 Vβ expansions, six with one expansion and one with two expansions. In all cases the expansion correlated with an expansion in the same Vβ family in either the CD4+ or CD4– groups. In the CD4+ T cell subset four controls had one expansion (three correlating with an expansion in CD3+). In the CD4– T cell subset eight controls had one expansion (four correlating to an expansion in CD3) and two had two expansions (one of which in each case correlated with CD3+ family expansion). In total, nine controls had expansions of a single Vβ family and three controls had expansions in two Vβ families in either the CD4+ or CD4– T cell subpopulations. No expansions occurred in the same Vβ family in different controls. No expansion was greater than 6·5 times the mean (average 2·6 times the mean value). Overall, these represent expansion in only 0·71% of all Vβ families studied from all normal controls (0·71% CD3+, 0·35% CD4+, 1·06% CD4–). The presence or absence of expansions did not correlate significantly with age.
We then compared the TCR Vβ usage in CD4+, CD4+CD25– and CD4+CD25Bright T cell subsets for 25 of the normal controls (five from each of the five age groups) (Table 2). For the majority of Vβ families usage by CD4+CD25– and CD4+CD25Bright T cells correlated closely (P < 0·01) with the exception of Vβ 11, Vβ 14, Vβ 21·3 and Vβ 23. However, CD4+CD25Bright cells showed significantly higher usage of Vβ 5·1, Vβ 7·1, Vβ 12, Vβ 13·6 and Vβ 21·3 families and lower usage of Vβ 9 and Vβ 13·1 when compared to CD4+CD25– (P < 0·001). FoxP3 expression in the CD4+CD25Bright and CD4+CD25– populations was analysed (Fig. 2). Within the CD4+CD25Bright population FoxP3 expression was 31·2–85·4% (mean 57·2), whereas in the CD4+CD25– population FoxP3 expression was 0·06–2·45% (mean 0·64).
Table 2.
T cell receptor (TCR) Vβ repertoire usage in CD4+, CD4+CD25– and CD4+CD25Bright T cell subpopulations from 25 controls.
| % per CD4 | % per CD4+CD25– | % per CD4+CD25Bright | ||||
|---|---|---|---|---|---|---|
| M | s.d. | M | s.d. | M | s.d. | |
| Vβ 1 | 3·81 | 1·35 | 3·86 | 1·19 | 3·99 | 1·05 |
| Vβ 2 | 9·87 | 2·35 | 9·90 | 2·40 | 9·91 | 2·06 |
| Vβ 3 | 4·56 | 2·88 | 4·58 | 2·85 | 4·24 | 3·03 |
| Vβ 4 | 2·16 | 0·50 | 2·16 | 0·41 | 1·98 | 0·48 |
| Vβ 5·1 | 6·47 | 1·26 | 6·31 | 1·23 | 7·72* | 1·92 |
| Vβ 5·2 | 1·44 | 0·62 | 1·55 | 0·61 | 1·40 | 0·38 |
| Vβ 5·3 | 1·37 | 1·03 | 1·41 | 0·99 | 1·46 | 1·09 |
| Vβ 7·1 | 2·43 | 1·21 | 2·34 | 1·22 | 2·93* | 1·33 |
| Vβ 7·2 | 1·33 | 0·68 | 1·28 | 0·68 | 1·41 | 0·65 |
| Vβ 8 | 4·69 | 0·77 | 4·65 | 0·81 | 4·71 | 0·62 |
| Vβ 9 | 3·20 | 1·10 | 3·29* | 1·15 | 2·66 | 1·20 |
| Vβ 11 | 0·97 | 0·19 | 1·11 | 0·34 | 0·94 | 0·73 |
| Vβ 12 | 2·05 | 0·74 | 2·01 | 0·71 | 2·50* | 0·74 |
| Vβ 13·1 | 4·60 | 0·70 | 4·87* | 0·73 | 4·02 | 1·07 |
| Vβ 13·2 | 3·26 | 1·11 | 3·36 | 1·17 | 3·81 | 1·72 |
| Vβ 13·6 | 2·20 | 0·94 | 2·12 | 0·80 | 2·80* | 0·61 |
| Vβ 14 | 3·06 | 0·74 | 3·02 | 0·75 | 3·19 | 1·20 |
| Vβ 16 | 1·22 | 1·28 | 1·21 | 1·29 | 1·28 | 1·39 |
| Vβ 17 | 5·02 | 1·24 | 5·13 | 1·35 | 4·78 | 1·14 |
| Vβ 18 | 1·90 | 0·56 | 1·96 | 0·58 | 1·71 | 0·53 |
| Vβ 20 | 2·20 | 0·88 | 2·24 | 0·90 | 1·94 | 0·99 |
| Vβ 21·3 | 2·43 | 0·40 | 2·38 | 0·42 | 3·13* | 1·01 |
| Vβ 22 | 3·63 | 0·66 | 3·59 | 0·64 | 3·37 | 1·07 |
| Vβ 23 | 0·54 | 0·16 | 0·60 | 0·19 | 0·55 | 0·30 |
| Total TCR | 74·40 | 2·61 | 74·92 | 2·93 | 76·44 | 3·87 |
Vβ families with skewed reactivity toward CD4+CD25– or CD4+CD25Bright T cells (P < 0·001). M: mean values; s.d.: standard deviation.
Discussion
Although TCR repertoires have been analysed in a number of conditions where T cells are believed to play a significant role in the pathogenesis of disease the interpretation has often been difficult, especially in children, due to a lack of control data in relevant populations. This study analysed the usage of 24 different TCR Vβ families in a homogeneous paediatric population using flow cytometric analysis. Our data confirmed non-random usage of TCR Vβ families similar to that seen in other studies of normal individuals from various ethnic groups [3,15]. Importantly, our results show that there was no significant difference between the different age groups for TCR Vβ family usage for all 24 families in the CD3+ and CD3+CD4– T cell subsets. In the case of CD3+CD4+ T cell subsets the majority (20 of 24) did not show any significant differences, with four families showing some minor but inconsistent differences between the age groups. Together, these data suggest that there is no significant change in TCR Vβ use in healthy children according to age from 3 months to 16 years of age. Whether there are differences in the early neonatal to 3 months period is not known.
We found a bias in Vβ family usage between CD3+CD4+ or CD3+CD4– T cell subsets which was seen consistently in all age groups (Fig. 3). Although direct comparison between our results and other studies of Vβ usage are difficult due to the differing numbers and specificity of anti-TCR Vβ monoclonal antibodies used, these results are similar to previously reported differences between the CD4+ and CD8+ T cell subpopulations [3,15,16].
There was a significantly higher frequency of expansions per individual in the CD3+CD4– T cell subset compared to CD3+CD4+ T lymphocytes. Previous studies have shown increased numbers of CD8 expansions compared to CD4 with significant correlation between the age of subjects and the number of CD8 expansions in adults [15]. However, in children there did not appear to be any correlation with age, due possibly to lack of long-term exposure to antigens such as viral and tumour antigens postulated to drive normal CD8+ memory expansion. It is possible that these expansions represent transient clonal expansion during recent immune responses, but longitudinal analysis over time would be required to confirm this. While some patients exhibited expansions there were no dropouts in the normal controls. Whether the presence of dropouts may be more sensitive to identify individuals with disturbances in their Vβ repertoires is not yet clear.
Previous studies have suggested correlation of TCR Vβ expression in peripheral blood between CD4+CD25– and CD4+CD25+ T cell subsets. We looked at the TCR Vβ expression in the CD4+CD25Bright populations which have been shown previously to correlate strongly with FoxP3 expression and Treg suppressor activity [17–19]. Analysis of FoxP3 expression in these cells showed a significant increase in FoxP3 expression in CD4+CD25Bright compared to CD4+CD25– T cells with significant variability between individuals analysed, similar to previous studies [20,21]. We found a similarly diverse repertoire in the CD25– and CD25Bright population with similar overlapping quantitative usage for each of the Vβ families and sharing of dominant clones. However, there was a significant preferential usage for five Vβ families and decreased usage of two Vβ families in the CD4+CD25Bright population. This suggests that there may be significant differences in the Treg repertoire compared to normal CD4+ T cells. Evidence has suggested that reactivity to self-antigens is an important feature of the Tregs TCR repertoire [13,22,23]. Whether TCRs containing these preferentially used Vβ families are more likely to bind to self-peptide is not clear. However, it must be remembered that quantitative differences in the repertoires do not confirm significant differences qualitatively at the level of antigen specificity.
Our study shows that a pattern of TCR Vβ usage in paediatric population is similar to previous studies reported in adults. Importantly, there does not appear to be any change in Vβ usage according to age. Analysis of CD4+CD25Bright Tregs showed that while there was overlap between TCR repertoires there was preferential usage of some Vβ families by Tregs. Whether this represents significant differences in TCR specificity is not yet clear.
Acknowledgments
We would like to thank the staff on the Paediatric Surgical Unit at the Royal Victoria Infirmary for their assistance and Dr Stafford and colleagues for collection of blood samples.
References
- 1.Venturi V, Kedzierska K, Turner SJ, Doherty PC, Davenport MP. Methods for comparing the diversity of samples of the T cell receptor repertoire. J Immunol Methods. 2007;321:182–95. doi: 10.1016/j.jim.2007.01.019. [DOI] [PubMed] [Google Scholar]
- 2.Kharbanda M, McCloskey TW, Pahwa R, Sun M, Pahwa S. Alterations in T-cell receptor Vbeta repertoire of CD4 and CD8 T lymphocytes in human immunodeficiency virus-infected children. Clin Diagn Lab Immunol. 2003;10:53–8. doi: 10.1128/CDLI.10.1.53-58.2003. [DOI] [PMC free article] [PubMed] [Google Scholar]
- 3.van den Beemd R, Boor PP, van Lochem EG, et al. Flow cytometric analysis of the Vbeta repertoire in healthy controls. Cytometry. 2000;40:336–45. doi: 10.1002/1097-0320(20000801)40:4<336::aid-cyto9>3.0.co;2-0. [DOI] [PubMed] [Google Scholar]
- 4.Hodges E, Krishna MT, Pickard C, Smith JL. Diagnostic role of tests for T cell receptor (TCR) genes. J Clin Pathol. 2003;56:1–11. doi: 10.1136/jcp.56.1.1. [DOI] [PMC free article] [PubMed] [Google Scholar]
- 5.Gratama JW, Kraan J, Adriaansen H, et al. Reduction of interlaboratory variability in flow cytometric immunophenotyping by standardization of instrument set-up and calibration, and standard list mode data analysis. Cytometry. 1997;30:10–22. [PubMed] [Google Scholar]
- 6.Schwartz RH. Natural regulatory T cells and self-tolerance. Nat Immunol. 2005;6:327–30. doi: 10.1038/ni1184. [DOI] [PubMed] [Google Scholar]
- 7.Pacholczyk R, Ignatowicz H, Kraj P, Ignatowicz L. Origin and T cell receptor diversity of Foxp3+CD4+CD25+ T cells. Immunity. 2006;25:249–59. doi: 10.1016/j.immuni.2006.05.016. [DOI] [PubMed] [Google Scholar]
- 8.Walker MR, Carson BD, Nepom GT, Ziegler SF, Buckner JH. De novo generation of antigen-specific CD4+CD25+ regulatory T cells from human CD4+CD25– cells. Proc Natl Acad Sci USA. 2005;102:4103–8. doi: 10.1073/pnas.0407691102. [DOI] [PMC free article] [PubMed] [Google Scholar]
- 9.Kasow KA, Chen X, Knowles J, Wichlan D, Handgretinger R, Riberdy JM. Human CD4+CD25+ regulatory T cells share equally complex and comparable repertoires with CD4+CD25- counterparts. J Immunol. 2004;172:6123–8. doi: 10.4049/jimmunol.172.10.6123. [DOI] [PubMed] [Google Scholar]
- 10.Fujishima M, Hirokawa M, Fujishima N, Sawada K. TCRalphabeta repertoire diversity of human naturally occurring CD4+CD25+ regulatory T cells. Immunol Lett. 2005;99:193–7. doi: 10.1016/j.imlet.2005.02.011. [DOI] [PubMed] [Google Scholar]
- 11.Wong J, Obst R, Correia-Neves M, Losyev G, Mathis D, Benoist C. Adaptation of TCR repertoires to self-peptides in regulatory and nonregulatory CD4+ T cells. J Immunol. 2007;178:7032–41. doi: 10.4049/jimmunol.178.11.7032. [DOI] [PubMed] [Google Scholar]
- 12.Picca CC, Larkin J, Boesteanu A, Lerman MA, Rankin AL, Caton AJ. Role of TCR specificity in CD4+CD25+ regulatory T-cell selection. Immunol Rev. 2006;212:74–85. doi: 10.1111/j.0105-2896.2006.00416.x. [DOI] [PubMed] [Google Scholar]
- 13.Hsieh CS, Liang Y, Tyznik AJ, Self SG, Liggitt D, Rudensky AY. Recognition of the peripheral self by naturally arising CD25+CD4+ T cell receptors. Immunity. 2004;21:267–77. doi: 10.1016/j.immuni.2004.07.009. [DOI] [PubMed] [Google Scholar]
- 14.Langerak AW, van Den Beemd R, Wolvers-Tettero IL, et al. Molecular and flow cytometric analysis of the Vbeta repertoire for clonality assessment in mature TCRalphabeta T-cell proliferations. Blood. 2001;98:165–73. doi: 10.1182/blood.v98.1.165. [DOI] [PubMed] [Google Scholar]
- 15.Bonfigli S, Doro MG, Fozza C, Derudas D, Dore F, Longinotti M. T-cell receptor repertoire in healthy Sardinian subjects. Hum Immunol. 2003;64:689–95. doi: 10.1016/s0198-8859(03)00086-7. [DOI] [PubMed] [Google Scholar]
- 16.Wedderburn LR, Patel A, Varsani H, Woo P. The developing human immune system: T-cell receptor repertoire of children and young adults shows a wide discrepancy in the frequency of persistent oligoclonal T-cell expansions. Immunology. 2001;102:301–9. doi: 10.1046/j.1365-2567.2001.01194.x. [DOI] [PMC free article] [PubMed] [Google Scholar]
- 17.Baecher-Allan C, Brown JA, Freeman GJ, Hafler DA. CD4+CD25high regulatory cells in human peripheral blood. J Immunol. 2001;167:1245–53. doi: 10.4049/jimmunol.167.3.1245. [DOI] [PubMed] [Google Scholar]
- 18.Hoffmann P, Eder R, Kunz-Schughart LA, Andreesen R, Edinger M. Large-scale in vitro expansion of polyclonal human CD4(+) CD25high regulatory T cells. Blood. 2004;104:895–903. doi: 10.1182/blood-2004-01-0086. [DOI] [PubMed] [Google Scholar]
- 19.Baecher-Allan C, Wolf E, Hafler DA. Functional analysis of highly defined, FACS-isolated populations of human regulatory CD4+CD25+ T cells. Clin Immunol. 2005;115:10–18. doi: 10.1016/j.clim.2005.02.018. [DOI] [PubMed] [Google Scholar]
- 20.Yagi H, Nomura T, Nakamura K, et al. Crucial role of FOXP3 in the development and function of human CD25+CD4+ regulatory T cells. Int Immunol. 2004;16:1643–56. doi: 10.1093/intimm/dxh165. [DOI] [PubMed] [Google Scholar]
- 21.Fontenot JD, Rasmussen JP, Williams LM, Dooley JL, Farr AG, Rudensky AY. Regulatory T cell lineage specification by the forkhead transcription factor foxp3. Immunity. 2005;22:329–41. doi: 10.1016/j.immuni.2005.01.016. [DOI] [PubMed] [Google Scholar]
- 22.Hsieh C-S, Zheng Y, Liang Y, Fontenot JD, Rudensky AY. An intersection between the self-reactive regulatory and nonregulatory T cell receptor repertoires. Nat Immunol. 2006;7:401. doi: 10.1038/ni1318. [DOI] [PubMed] [Google Scholar]
- 23.Hsieh CS, Rudensky AY. The role of TCR specificity in naturally arising CD25+CD4+ regulatory T cell biology. Curr Top Microbiol Immunol. 2005;293:25–42. doi: 10.1007/3-540-27702-1_2. [DOI] [PubMed] [Google Scholar]