



Abstract
Despite their wide use, the physiological relevance of organotypic slices remains controversial. Such cultures are prepared at 5 days postnatal. Although some local circuitry remains intact, they develop subsequently in isolation from the animal and hence without plasticity due to experience. Development of synaptic connectivity and morphology might be expected to proceed differently under these conditions than in a behaving animal. To address these questions, patch-clamp techniques and confocal microscopy were used in the CA1 region of the rat hippocampus to compare acute slices from the third postnatal week with various stages of organotypic slices. Acute slices prepared at postnatal days (P) 14, 17 and 21 were found to be developmentally equivalent to organotypic slices cultured for 1, 2 and 3 weeks, respectively, in terms of development of synaptic transmission and dendritic morphology. The frequency of inhibitory and excitatory miniature synaptic currents increased in parallel. Development of dendritic length and primary branching as well as spine density and proportions of different spine types were also similar in both preparations, at these corresponding stages. The most notable difference between organotypic and acute slices was a four- to five-fold increase in the absolute frequency of glutamatergic (but not GABAergic) miniature postsynaptic currents in organotypic slices. This was probably related to an increase in complexity of higher order dendritic branching in organotypic slices, as measured by fractal analysis, resulting in an increased total synapse number. Both increased excitatory miniature synaptic current frequency and dendritic complexity were already established during the first week in culture. The level of complexity then stayed constant in both preparations over subsequent stages, with synaptic frequency increasing in parallel. Thus, although connectivity was greater in organotypic slices, once this was established, development continued in both preparations at a remarkably similar rate. We conclude that, for the parameters studied, changes seem to be preprogrammed by 5 days and their subsequent development is largely independent of environment.
Experience-dependent synaptic plasticity has attracted enormous interest over recent decades (for reviews, see Lüscher et al. 2000; Sorra & Harris, 2000; Malinow & Malenka, 2002), especially in the hippocampus in relation to its role in spatial learning (Martin et al. 2000). This study addresses the putative importance of experience in the determination of synaptic strength and spine shapes during a period of postnatal development in rats when they are rapidly undergoing new experiences. During the third week of postnatal life the rat opens its eyes and begins actively to explore its environment. Moreover during this period, weaning begins, with the animal seeking food for the first time, and becoming independent of the mother's milk. It is thus of interest to study synaptic activity and morphology over this period in hippocampal slices (Yamamoto & Mcllwain, 1966). We compared acute slices in which development occurred in vivo to an organotypic slice preparation (Gähwiler, 1981; Stoppini et al. 1991), where the hippocampus is removed after 5 days of postnatal experience and subsequently develops in the total absence of sensory input or indeed any input from other brain areas.
In recent years, organotypic slices have been increasingly used for the study of synaptic plasticity, particularly in relation to spine shape and development (Nimchinsky et al. 2002). Establishing the relationship between development of spine types in culture and their physiological in vivo development is thus essential for the interpretation of such studies. Various comparisons have been made between synapses in culture or acute slices and reports in the literature using other preparations (Muller et al. 1993; Collin et al. 1997; Gähwiler et al. 1997; Boyer et al. 1998). Some information is available on development of synapses in acute slices (reviewed in Sorra & Harris, 2000) but much less information is available for development in organotypic preparations. Here we study the development of synapses onto CA1 pyramidal cells in organotypic culture, but in all cases refer back to data collected in parallel from acute slices under identical conditions.
We have concentrated on electrophysiological measures of spontaneous and miniature synaptic currents in CA1 neurones, and related these to a morphological study of their dendritic length and complexity and the density and detailed shapes of their dendritic spines. We come to the surprising conclusion that development of synapses, although progressing rapidly at this stage in the rat hippocampus, is largely independent of experience. Rather, ongoing development of synaptic activity and morphology, as measured in CA1 pyramidal cells, seems to have been preprogrammed by 5 days in vivo. Rewiring of cut axons inevitably occurs over the first few days in culture and some of the new targets must be different. However, from 1 week onwards, development of synapses in vitro is remarkably similar to the in vivo development of synapses onto CA1 pyramidal cells, as assessed from acute slices.
METHODS
Preparation of acute slices
Acute brain slices were prepared from Sprague-Dawley rats (Edwards et al. 1989; Gibb & Edwards, 1994). Briefly, animals were rapidly decapitated and the brain immersed in ice-cold artificial cerebrospinal fluid (ACSF) within 30 s. The brain was hemisected and a segment cut away by hand from the top of each hemisphere at an angle of approximately 105 deg from the midline surface. The hemisphere was stuck down on this surface onto a vibrating tissue slicer (Camden Instruments, Loughborough, UK) for preparation of hippocampal slices (400 μm thick). Slices were then transferred into an incubating chamber containing circulating ACSF, held at 35 °C for 1 h and then allowed to return to room temperature (22–24 °C). The animals used were male 14, 17 or 21 postnatal day rats. Recordings were made 2–8 h after slicing. All work was carried out under UK Home Office regulations in conformation with national ethics committee guidelines.
Preparation of organotypic slices
Organotypic slices were prepared using the method of Stoppini et al. (1991). In brief, under sterile conditions in a flow cabinet, 300 μm thick parasagittal slices were prepared as above from 5-day-old male rat pups. Each slice was immediately placed on a filter in the bottom of a Millicell culture plate (Millipore) such that each of six chambers of the plate contained three slices. The slices were at the interface of a serum culture medium: 25 % horse serum, 50 % minimal essential medium, 23 % Earle's balanced salt solution (all from GIBCO BRL), 5000 u (100 ml)−1 penicillin (0.08 mM), 1200 u (100 ml)−1 nystatin (both from Sigma-Aldrich). The medium was changed three times per week. Individual slices were removed from the incubator, as required, at 6–8 days in vitro (DIV, designated DIV7), 13–15 DIV (designated DIV14) or 20–22 DIV (designated DIV21). Sister cultures were compared at different stages.
Note that a portion of the enthorinal cortex was left attached to the hippocampal slice. This avoids excess sprouting of granule cell axons in the dentate gyrus and thus maintains a more physiological synaptic connectivity within the hippocampus in culture (Coltman et al. 1995).
Electrophysiology
Whole-cell patch-clamp recordings from CA1 pyramidal neurones were made at a holding potential of −70 mV with an Axopatch 200B (Axon Instruments), at room temperature (22–24 ° C). Electrodes had resistances of 4–5 MΩ and were pulled from borosilicate glass (World Precision Instruments) and filled with a CsCl-based intracellular solution (see below). Series resistance (15–20 MΩ) was not compensated but the seal and access were monitored regularly by injecting a small voltage pulse (5 mV). Recordings were rejected if the size of current in response to the pulse altered by more than 20 %. As the currents measured were very small (usually < 100 pA), series resistance would have caused minimal voltage error and it was considered more important to record with minimal baseline noise and for all conditions to be identical throughout the recordings than for maximal compensation to be obtained.
Analysis of spontaneous and miniature synaptic currents
Current signals were filtered at 10 kHz and subsequently at 2 kHz during digitization (10 kHz) onto the computer. CDR and WCP synaptic analysis software (kindly supplied by Dr John Dempster, http://innovol.sibs.strath.ac.uk/physpharm/ses.shtml) were used for detection and analysis of spontaneous miniature currents. The threshold for detection was set at −3 pA and currents had to remain above this threshold for 0.5 ms to be included. Note that detection thresholds and measured background noise (S.D., 1–3 pA) were the same throughout development and in both acute and organotypic slices. All signals were then inspected by eye with the criterion that the rise time must be faster than the decay time. Rise times were measured from 10 to 90 % of the maximum amplitude and decay times were fitted with a single exponential.
Solutions
ACSF contained (mM): NaCl 125, KCl 2.4, NaHCO3 26, NaH2PO4 1.25, glucose 25, CaCl2 2, MgCl2 1; and was bubbled with 95 % O2-5 % CO2. Intracellular solution contained (mM): CsCl 140, Hepes 5, EGTA 10, Mg-ATP 2; with pH adjusted to 7.4 with CsOH. Various fluorophores were also included in most recordings for morphological analysis (see Imaging section below).
Drugs (Tocris Cookson Ltd) were bath applied. Tetrodotoxin (TTX, 1 μM) was used to block Na+ action potentials; bicuculline (10 μM) was used to block GABAA receptors.
Imaging and analysis of morphology
The imaging was performed on an Olympus Fluoview confocal microscope (generously supplied by Olympus, London, UK) on an upright Olympus BX50WI using the following Olympus objectives: 20 × water immersion, numerical aperture (NA) 0.5; 60 × water immersion, NA 0.9, or 60 × oil immersion, NA 1.4. The morphological analysis was performed using Image J (National Institute of Health, USA, http://rsb.info.nih.gov/nih-image/), AnalySIS (Norfolk Analytical Ltd) and Lucida Analyse (Kinetic Imaging).
During recording, a variety of different dyes were included in the intracellular solution (all from Molecular Probes) as follows: Alexa Red (Alexa Fluor 594), 0.2 mg ml−1; Alexa Yellow (Alexa Fluor 488), 0.2 mg ml−1; Texas Red, 0.1 mg ml−1. The dye used did not alter the electrophysiological data nor the measured morphology. In some cases the morphology of the cell was analysed ‘live’ immediately after careful removal of the electrode, and in other cases the slice was fixed overnight in 4 % paraformaldehyde for subsequent analysis. In a few cases the same cell was analysed live and then subsequently fixed and the same dendritic sections re-analysed. Fixation made no difference to the analysis and the position, size and angle of spines remained identical to that seen live. Thus no detectable shrinkage occurred, presumably because no drying or clearing procedures were used.
Analysis of dendritic organization
The overall dendritic morphology of CA1 neurones was analysed using a low magnification objective on the confocal microscope, acquiring an image every 1.5 or 2 μm step. All the measurements were taken from sequential z-series scans of the cells using Image J software and dividing the dendrites into multiple parts which ran in approximately straight lines. The segments that remained in a single section were measured by projection images, while the lengths of those sloping through several sections were calculated using Pythagoras' theorem. In addition to the length of the apical dendrite, the extension of the basal dendrites was measured, using the radius of the circumference that contains the longest basal dendrites. The number of dendrites that arose from the soma of each neurone was also counted as well as the number of branches arising from the apical dendrite (primary apical branches).
The fractal dimension of the neurones was calculated using Flok's border-dilation method (Jelinek & Fernandez, 1998) and NIH Image software. For this analysis, neurones were projected at the same scale, converted to binary files and skeletonized so that throughout the profile of the neurone all processes were one pixel in diameter. To avoid interference in the binary image from inclusion of low intensity pixels representing background signal, the cells were previously deconvolved using Huygens software to enhance the contrast.
Fractal analysis has been used previously to describe the increased complexity of fluorescent glial cells with development in culture (Smith & Behar, 1994). More recently the calculation of the fractal dimension has been validated for assessment of the morphology of neurones (Jelinek & Fernández, 1998; Jelinek & Elston, 2001 but see Cannon et al. 1999).
Analysis of spines
The spine density was calculated in images from high-resolution confocal scans (60 × water or oil immersion objectives). Spines were counted in each frame at high (2.5–3) zoom and the number divided by the length of the dendrite within the frame (15–60 μm). In each section of dendrite chosen, all the spines present were included in the analysis. The analysis employed Image J, Lucida Analyse and AnalySIS software in combination. While counting the spines in the reconstructed images, position and verification of spines were aided by rotation of three-dimensional reconstructions and by observation of the images in consecutive single planes. Thus no correction was needed for hidden spines. Numbers quoted in the text refer to numbers of slices used from different animals but at least 51 spines were analysed per slice and in most slices several hundred. Various compartments of the neurone were analysed separately with a total of at least 36 spines (usually > 70) being counted per compartment across animals with the exception of the proximal apical dendrite where so few spines were present that the numbers were necessarily lower at the earlier stages. The basal compartment included all the basal dendrites but was subdivided according to the order of dendrite considered, i.e. ‘primary’ arising directly from the soma; ‘secondary’ and ‘tertiary’ arising respectively after subsequent branching points. We then considered the branches departing from the apical dendrite, similarly dividing them in three parts as above. Generally definition of the order of dendrites beyond tertiary was ambiguous and so higher order dendrites were considered as one group. As the parameters measured in higher order dendrites were not significantly different from the tertiary dendrites, these groups were pooled. The single apical dendrite was analysed separately, but again subdivided into three sections: the proximal 20 μm from the soma; the medial section (within the stratum radiatum) and the distal extension to the stratum lacunosum-moleculare.
The spine shapes were analysed as above. For this analysis we selected only the best resolution images in which the edges of the spines were clearly distinguishable, and only cells filled with Alexa dyes were used. The dendrites analysed were randomly distributed in the dendritic tree and we did not consider the shape distribution in the different compartments of the cells, but grouped all the dendrites of the neurone as a whole. The percentage of each spine type was calculated for each cell and the results were then averaged between the cells at each developmental stage.
We divided the spine shapes into four categories according to Kaiserman-Abramof (1969), Peters & Kaiserman-Abramof (1969) and Harris et al. (1992), as follows:
A stubby spine where the diameter of the neck was similar to the total length of the spine.
A thin spine where the head was clearly distinguishable, the length of the spine was greater than the neck diameter and the diameters of the head and neck were similar.
A filopodium, similar to a thin spine but with no distinguishable head.
A mushroom spine where the diameter of the head was > 2-fold the diameter of the neck.
The confocal lateral resolution ranged from 0.16 μm (with Alexa Yellow and 60 × oil immersion objective) to 0.29 μm (with Alexa Red and 60 ×water immersion objective). The zoom factor used (2.5–3) resulted in 8–10 pixels μm−1 which is optimal for this resolution. The z-axis resolution was approximately 0.4 μm, and we could rotate the entire dendrite in three dimensions. Thus our resolution limits should have allowed accurate determination of spine number, at least in the lateral dimensions, although some stubby spines could be missed, but only if directly aligned in the z-axis. Such an underestimate would be small and the same across all groups.
Statistical analysis
Unless otherwise stated, two factor analysis of variance with the Bonferroni post test was used to compare differences between acute and organotypic slices over three developmental stages. Acute slices at P14, P17 and P21 were compared to organotypic slices at DIV7, DIV14 and DIV21 respectively. Normality of distribution was tested using the Kolmogorov-Smirnov test.
All data were analysed using the statistics package PRISM, version 3 (GraphPad Software Inc.). Results are expressed as means ±s.e.m. In some cases where distributions are skewed, the data are expressed as medians, as detailed in the text.
The numbers quoted throughout refer to the number of cells analysed. No more than one cell was ever recorded in the same slice, and for every pooled data point the data came from at least three different animals.
RESULTS
Neurones were studied at each of the first 3 weeks of development in organotypic cultures, (DIV7, DIV14 and DIV21, respectively). As it was not possible to assume how development proceeds after plating of the organotypic slices and thus which stages of acute slices would be equivalent, for initial comparison acute slices were studied from rats at 2 and 3 weeks postnatal (P14 and P21). Once the rapid development and the similarity of these acute preparations to organotypic preparations at DIV7 and DIV21 became clear, an intermediate stage for acute slices from P17 rats was added to the study.
Analysis of spontaneous synaptic activity
We restricted the analysis to spontaneous activity to avoid the difficulties of comparisons associated with evoking currents in slices of different sizes, which makes it impossible to define the number and identity of axons stimulated. In order to gain a range of data in each cell, the following protocol was usually employed. Firstly for a general overview of activity, spontaneous currents were recorded in control solution (Fig. 1A, top trace). Tetrodotoxin (TTX, 1 μM) was then added to inhibit the occurrence of spontaneous action potentials, thus generating data for all miniature currents, whether carried by glutamate or GABA (mEPSCs or mIPSCs, respectively; Fig. 1A, middle trace). Finally bicuculline (10 μM) was added to the TTX solution to block GABAergic activity, thus allowing a study of mEPSCs in isolation (Fig. 1A, bottom trace). In some cases, to ensure that the frequency of miniature currents was not affected by the long recording time, we compared experiments where only mEPSCs were recorded from the start of the experiment and found no difference in frequency in either acute or organotypic slices.
Figure 1. Relative frequency of action potential-dependent and miniature currents in acute and organotypic slices during development.
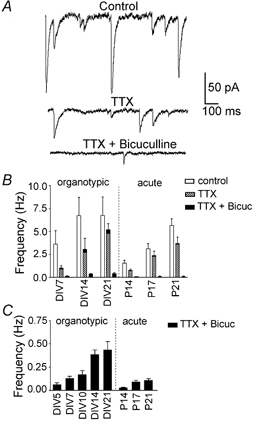
A, current traces showing the total synaptic activity at DIV21 in control solution (upper trace), miniature currents in TTX (1 μM, middle trace) and mEPSCs remaining when bicuculline (10 μM) was added to the bath solution (lower trace). B, frequencies of synaptic activity for organotypic and acute slices. Frequencies of both spontaneous and miniature currents increased during development (P < 0.05, n > 4 in each group). Hatched columns represent mIPSC frequency after subtraction of the bicuculline-insensitive mEPSCs (black columns). The composite columns (hatched + black) and error bars represent the mean ±s.e.m. recorded frequencies of total miniature currents. C, mEPSC frequencies on a larger scale. The mEPSCs become more frequent with development, with consistantly higher values for organotypic slices (P < 0.0005).
Frequency of synaptic activity (Fig. 1B)
In normal ACSF, acute slices showed a frequency of synaptic currents of 1.5 ± 0.3 Hz (n = 7) at P14, increasing steadily to 5.6 ± 0.8 Hz (n = 5) by P21. The developmental pattern was similar in organotypic slices, with a frequency of 3.6 ± 1.5 Hz (n = 6) at DIV7, increasing to 6.7 ± 2.0 Hz (n = 7) by DIV14 and then remaining at this level at DIV21 (6.8 ± 2.0 Hz, n = 4). Overall there was a significant increase in frequency during development (P = 0.05) but differences between the acute and organotypic preparations did not reach statistical significance (P = 0.07).
Miniature synaptic currents
In organotypic slices, when spontaneous action potentials were prevented by adding TTX (1 μM), the frequency of synaptic currents decreased by approximately 70 % at DIV7. By DIV21, however, the proportion of TTX-sensitive events had decreased to about 25 %. In acute slices a similar trend was seen, although there tended to be a lower percentage of TTX-sensitive action potential-mediated activity at earlier stages, approximately 50 % at P14. At P21 in the acute slices, the proportion of TTX-sensitive events was similar to that in the organotypic slices, with 35 % of currents remaining in TTX (Fig. 1B). Overall however, there was no significant difference in tetrodotoxin sensitivity between the groups.
GABAergic miniature postsynaptic currents
In TTX alone, all miniature synaptic currents were measured together. The proportion carried by GABAA receptors was assessed by adding the GABAA antagonist bicuculline (10 μM). Bicuculline blocked a high proportion of miniature synaptic currents in both organotypic and acute preparations throughout development (≈90 % in organotypic slices and ≈97 % in acute slices; Fig. 1B). Thus to estimate the frequency of GABAergic miniature currents alone, the frequency of bicuculline-insensitive miniature currents was subtracted from the total miniature frequency.
After subtraction, the current frequency was seen to increase significantly, approximately five-fold, with development (P < 0.05) in both organotypic and acute slices. Moreover there was no significant difference between the frequency of GABAergic miniature currents in acute and organotypic slices at any stage (P = 0.18).
Glutamatergic miniature synaptic currents (Fig. 1B and C)
Similarly to mIPSCs, the frequency of mEPSCs increased significantly, about four-fold, over the stages studied in both organotypic and acute slices (P < 0.05). Again the development was remarkably similar between the two preparations.
A major difference was, however, seen in the absolute frequency of mEPSCs. Organotypic slices showed a four- to five-fold greater frequency at all stages studied and the difference between organotypic and acute slices was highly significant (P < 0.0005).
Thus the increase in frequency of both excitatory and inhibitory synaptic currents was similar during development in both preparations. The only major difference was that the frequency of mEPSCs was considerably higher throughout development in organotypic slices compared to acute slices.
Amplitude distribution and kinetics of synaptic currents Miniature EPSCs (Fig. 2A-D)
Figure 2. Amplitudes and kinetics of miniature currents in organotypic (blue) and acute slices (red) during development.
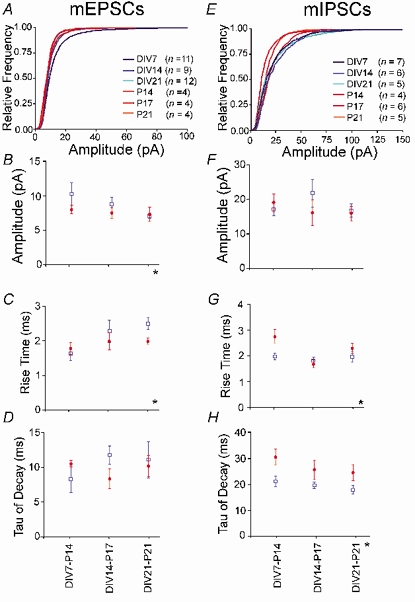
A and E, cumulative relative amplitude distributions of mEPSCs and mIPSCs, respectively; bin width 1 pA. Numbers in parenthese refer to the number of slices. B and F, mean of the median amplitudes of mEPSCs and mIPSCs, respectively. C and G, mean rise times of mEPSCs and mIPSCs, respectively. D and H, mean decay time constants of mEPSCs and mIPSCs, respectively. *Significant differences at P ≤ 0.05 by two-way ANOVA. Asterisks below the x-axis indicate a significant difference between acute and organotypic slices; asterisks above the x-axis indicate significant changes during development. •, data from acute slices; □, data from organotypic slices.
Due to the extremely low frequency of mEPSCs, it was not possible to gather very large numbers of currents. Nevertheless in all groups, at least 50 events were collected in at least four cells and only these cells were included in the analysis (Fig. 2A and B). In both organotypic and acute slices, amplitude distributions of mEPSCs were generally skewed, being significantly different from Gaussian distributions in 29/31 cells in organotypic slices and in 8/12 cells in acute slices. Cumulative histograms showed similar distributions with the exception of an increase in the skew of amplitudes at DIV7 (Fig. 2A).
The graph in Fig. 2B represents the means ±s.e.m. of the median amplitudes of each group. Overall there was no change in amplitude of mEPSCs during development but the amplitudes in organotypic slices were significantly higher than in acute slices (P < 0.01). This difference was small and was only evident at early stages, while similar amplitudes were observed when comparing P21 with DIV21 slices (P = 0.26 two-tailed unpaired t test). This convergence of amplitudes during development between the preparations reflected the fact that, in organotypic slices, the average median amplitudes decrease during development due a decrease in skew of the distribution over the time in vitro (DIV7, 11.0 ± 0.7 pA, n = 9 to DIV21, 8.4 ± 0.3 pA, n = 12, P < 0.05, one-way ANOVA).
The rise time showed a significant parallel increase in both acute and organotypic slices (P < 0.05), with no difference between the two preparations (Fig. 2C). In organotypic slices the variation tended to be greater, and even at DIV21 vs. P21, where a trend was seen to greater rise times in organotypic slices, this was not significant (P > 0.08 unpaired t test). The decay time of mEPSCs did not change between slice type nor during development (Fig. 2D). The averaged values were 10.1 ± 1.2 ms (n = 16) for organotypic and 9.5 ± 0.7 ms (n = 16) for acute slices.
Hence overall, the only difference between organotypic and acute slices was a slightly greater median amplitude of mEPSCs in organotypic slices at earlier stages, probably reflecting a tendency to greater skew of these distributions compared to acute slices.
Miniature IPSCs; spontaneous activity in the presence of tetrodotoxin (Fig. 2E-H)
As outlined above, under the conditions of this study, ≈90 % of miniature currents in organotypic slices and ≈97 % in acute slices are carried by GABAA receptors. Thus the amplitude and kinetics of mIPSCs were evaluated by taking overall measurements from the total miniature current population. Glutamatergic antagonists were not included in these recordings so that the same cells could be used to analyse and compare GABAergic and glutamatergic currents.
In all cells, the mIPSCs showed a skewed distribution, with the peak centred at about 10 pA. Cumulative histograms were similar in all groups. The skew to larger amplitudes in organotypic slices was constant throughout development, whereas in acute slices, while the distribution at P14 was very similar to organotypic slices, the skew tended to decrease with age (Fig. 2E). There were no significant differences between the average median amplitudes either during development or between the slice preparations (Fig. 2F). The overall average was 18.7 ± 1.7 pA (n = 19) for cultures and 17.0 ± 1.6 pA (n = 17) for acute slices.
The rise time of miniature IPSCs showed a significant change during development (P < 0.05), but there was no overall difference between organotypic and acute slices. There was, however, a strong trend (P < 0.06, Fig. 2G) with organotypic slices tending to show faster rise times. The greatest difference was seen at the earliest stages, and when rise times at DIV7 vs. P14 were compared using an unpaired t test, a significant difference was seen (P < 0.02).
The miniature current decay time tended to decrease during development, though not significantly, and was longer in acute than organotypic slices (P < 0.002, Fig. 2H). The presence of about 10 % mEPSCs in the organotypic slices could well have been a factor in this difference, as the mean decay of mEPSCs was considerably shorter than the mean decay of the total population of miniature currents. We re-analysed the amplitude and kinetic data omitting the 10 % of currents with the fastest decay time constants. This is a maximum estimate of the error introduced by inclusion of mEPSCs. Even with this correction, the decay time of the currents in organotypic slices was still significantly shorter than in the equivalent acute preparations (P < 0.05).
CA1 neurone morphology
The projection of the low resolution scans (20 × water immersion objective) gives an overall picture of the cell (Fig. 3). The depth reached by the dendritic tree differed between the two preparations, reaching an average of 47 ± 4 μm (n = 19) in organotypic and 83 ± 4 μm (n = 21) in acute slices. Neurones with processes extending to deeper than 150 μm into the slice were excluded from analysis.
Figure 3. Morphology of CA1 neurones in acute and organotypic slices.
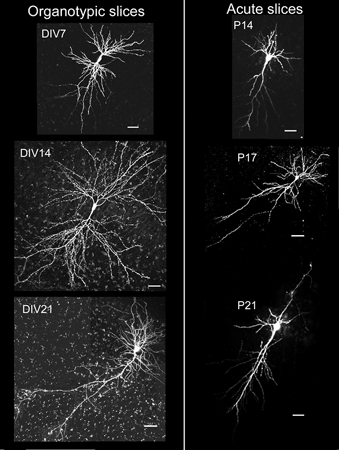
Note the overall greater complexity of neurones in organotypic slices throughout development. The scale bar in each panel represents 50 μm.
The results of the morphological analysis are shown in Table 1. The length of the apical dendrite and the number of basal dendrites increased with the age of the preparation (P < 0.05) but showed no significant difference between organotypic and acute slices. In contrast, the number of primary order branches from the apical dendrite stayed constant over the stages and preparations studied. The extension of the basal dendrites did not change with development, but the values were about 40 % greater in organotypic cultures than in acute slices (P < 0.01).
Table 1.
Morphology of CA 1 neurones in acute and organotypic slices
| Age | Length apical dendrite (μm) | Basal radius (μm) | Number of dendrites of primary order from soma | Number of branches of primary order from apical dendrite |
|---|---|---|---|---|
| DIV7 | 371.2 ± 36.3 n = 13 | 184.2 ± 29.0 n = 14 | 4.5 ± 0.4 n = 15 | 12.5 ± 1.8 n = 12 |
| DIV14 | 498.2 ± 38.1 n = 12 | 185.8 ± 17.1 n = 12 | 6.0 ± 0.9 n = 12 | 12.8 ± 1.7 n = 11 |
| DIV21 | 538.5 ± 51.1 n = 6 | 194.8 ± 22.7 n = 9 | 6.1 ± 0.6 n = 9 | 13.6 ± 2.5 n = 6 |
| P14 | 379.0 ± 48.3 n = 10 | 122.4 ± 10.7 n = 10 | 3.9 ± 0.3 n = 13 | 11.0 ± 0.9 n = 11 |
| P17 | 457.0 ± 69.3 n = 4 | 134.3 ± 11.5 n = 6 | 5.1 ± 0.2 n = 7 | 10.7 ± 2.0 n = 4 |
| P21 | 518.8 ± 57.2 n = 4 | 154.3 ± 9.9 n = 9 | 5.2 ± 0.3 n = 10 | 14.2 ± 1.5 n = 4 |
Morghological parameteres of dendrites of CA1 neurones in acute and organotypic slices over development. The basal radius represents the radius of the circumference that contains the longest basal dendrites. n = number of cells.
Overall these simple measures of the dendritic tree were remarkably similar in organotypic vs. acute slices, throughout the developmental stages studied. However, it is obvious on observing the projections in Fig. 3 that the neurones in organotypic slices were more complex. Presumably this complexity comes from increased branching of higher order dendrites.
Fractal analysis of dendritic tree
In order to compare the complexity of higher order dendrites in the two developmental environments, we used fractal analysis, a technique that has been used to measure the complexity of pyramidal neurones (Sholl, 1953; Jelinek & Elston, 2001; Elston & Jelinek, 2001). An example of a skeletonized neurone used for such analysis is shown in Fig. 6A. Note that we do not wish to draw any conclusions from the absolute numbers obtained from this analysis. Clearly we are analysing projections in two dimensions with no correction for crossing points at different levels and it could be argued that the shapes are not strictly fractal. However, it is a useful method for objectively comparing the different preparations under the same conditions, with the same limitations.
Figure 6. The spine density and shape change similarly during in vivo and in vitro development.
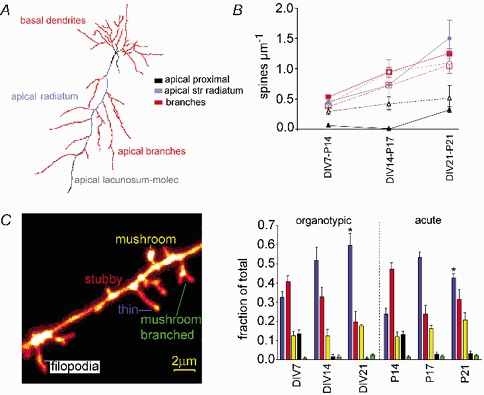
A, a skeletonized neurone as used for fractal analysis. The different compartments of the dendritic tree are indicated. The colour key refers to A and B. B, spine density during development. Open symbols with dotted lines represent densities in organotypic slices and filled symbols with continuous lines are data in acute slices. C, a confocal micrograph from a DIV7 slice showing the five different spine shapes analysed. The colours for each spine type are the same as in D. D, plot of spine shape distribution in organotypic and acute slices. Each bar represents the mean percentage ±s.e.m. of spine type. The pattern of spine shape changes was very similar during development in vivo as seen in acute slices and in vitro. * Significant differences, P < 0.05.
The average fractal dimension (D) of CA1 pyramidal neurones in acute and organotypic slices is shown in Fig. 4. The values did not change during development, but there was a highly significant difference between the two preparations (P < 0.0001, mean D for organotypic slices 1.53 ± 0.01, n = 19; mean D for acute slices 1.38 ± 0.02, n = 15). As D is dependent on the ratio of two logarithmic numbers, a change from 1.38 to 1.53 in D indicates a more than two-fold increase in complexity. Note that as the acute slices are thicker than the organotypic slices, it could be suggested that the apparent relative simplicity of the neurones in acute slices was due to the dendrites reaching more deeply into the slice. However, while there was no significant correlation between the measured fractal dimension and the depth reached by the dendrite in organotypic slices (P = 0.33), in acute slices there was a positive correlation with fractal dimension slightly increasing with depth (slope 0.17 ± 0.08 μm−1, P < 0.05). Hence the greater thickness of acute slices tends to increase rather than decrease the measured difference in fractal dimension. As the total length of the neurones and the primary order branching from the soma and the apical dendrite were similar in the two preparations, this increased fractal dimension implies an increase in the number of higher order dendrites in organotypic slices.
Figure 4. Fractal dimension of CA1 neurones in organotypic (□) compared to acute slices (•).
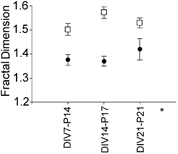
No difference was found during development; organotypic slices featured a higher fractal dimension at all stages. * Significant difference between acute and organotypic slices, P < 0.0001.
Thus overall, despite the fact that the length of the dendritic trees continued to increase over the period studied in both preparations, the branching of the dendrites did not change during development. However, presumably as a result of remodelling after slicing, higher order dendrites were already more complex in organotypic slices at DIV7 than in acute slices.
Spine density
To study the likely pattern of excitatory synaptic connections further we went on to study the details of spine density and shape, which could be well resolved in the two preparations using confocal microscopy (Fig. 5). In both organotypic and acute slices, development was similar, with the CA1 neurones showing at least a two-fold increase in spine density throughout the dendritic field over the period studied (P < 0.0001, Table 2, Fig. 6B).
Figure 5. Development of spines in CA1 neurones in organotypic and acute slices.
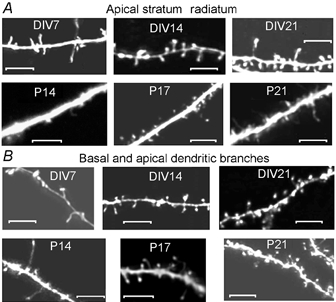
Note the prevalence of filopodia at early stages and the increased density of spines at later stages. A variety of spine shapes can be seen throughout development. A, examples of resolution of primary dendrites in stratum radiatum. B, examples of spines in the branches of dendrites in statum radiatum or stratum lucidum, between which there are no significant differences. Scale bars 5 μm.
Table 2.
Spine density in acute and organotypic slices
| Apical dendrite (spines μm−1) | Apical brancehes (spines μm−1) | Basal dendrites (spines μm−1) | |||||||
|---|---|---|---|---|---|---|---|---|---|
| Age | Proximal | Radiatum | Lac-molec | Primary | Secondary | Tertiary | Primary | Secondary | Tertiary |
| 0.30 ± 0.06 | 0.42 ± 0.06 | 0.37 ± 0.07 | 0.47 ± 0.05 | 0.33 ± 0.07 | 0.25 ± 0.11 | 0.46 ± 0.12 | 0.34 ± 0.06 | 0.37 ± 0.01 | |
| DIV7 | n = 8 | n = 8 | n = 9 | n = 7 | n = 5 | n = 3 | n = 3 | n = 4 | n = 4 |
| 0.42 ± 0.11 | 0.94 ± 0.09 | 0.66 ± 0.08 | 0.86 ± 0.07 | 0.68 ± 0.06 | 0.56 ± 0.11 | 0.49 ± 0.10 | 0.55 ± 0.11 | 0.72 ± 0.10 | |
| DIV14 | n = 9 | n = 8 | n = 9 | n = 8 | n = 5 | n = 3 | n = 3 | n = 3 | n = 5 |
| 0.52 ± 0.20 | 1.09 ± 0.18 | 0.99 ± 0.17 | 1.17 ± 0.14 | 1.08 ± 0.14 | 1.20 ± 0.22 | 0.93 ± 0.15 | 0.97 ± 0.08 | 0.77 ± 0.02 | |
| DIV21 | n = 7 | n = 7 | n = 6 | n = 7 | n = 3 | n = 3 | n = 3 | n = 5 | n = 4 |
| 0.06 ± 0.02 | 0.45 ± 0.04 | 0.52 ± 0.09 | 0.44 ± 0.03 | 0.54 ± 0.10 | 0.61 ± 0.17 | 0.14 ± 0.07 | 0.46 ± 0.05 | 0.63 ± 0.09 | |
| P14 | n = 4 | n = 6 | n = 3 | n = 5 | n = 4 | n = 3 | n = 3 | n = 6 | n = 4 |
| 0.01 ± 0.01 | 0.73 ± 0.04 | 0.77 ± 0.17 | 1.02 ± 0.12 | 1.01 ± 0.23 | 0.87 ± 0.12 | 0.49 ± 0.09 | 0.98 ± 0.11 | 0.83 ± 0.14 | |
| P17 | n = 4 | n = 4 | n = 3 | n = 3 | n = 3 | n = 3 | n = 3 | n = 3 | n = 3 |
| 0.33 ± 0.04 | 1.49 ± 0.30 | 1.10 ± 0.24 | 0.96 ± 0.15 | 1.30 ± 0.10 | 1.12 ± 0.42 | 0.72 ± 0.21 | 1.41 ± 0.24 | 1.37 ± 0.05 | |
| P21 | n = 3 | n = 3 | n = 3 | n = 3 | n = 4 | n = 3 | n = 3 | n = 3 | n = 4 |
Spine density in different compartments of CA1 neurones in acute and organotypic alices during development. n = number of cells. Lac-molec refers to the most distal section of the apical dendrite in the stratum lacunosum-moleculare.
Throughout the basal and apical branches, there were no significant differences between areas of the dendritic tree, within each neuronal group studied. The development of spine density over time showed a parallel increase of about two-fold in both preparations (P < 0.0001). Though the absolute difference between organotypic and acute slices was small throughout, it was nevertheless highly significant with dendrites in acute slices having 16–28 % more spines than those in organotypic slices (P < 0.0001).
Development of spine density on the primary apical dendrite (Fig. 6B) was slightly different from the pattern in dendritic branches. In both the stratum radiatum and the stratum lacunosum-moleculare there were significant increases during development (P < 0.005) but there was no difference between the density in organotypic vs. acute slices (P > 0.3). In contrast, however, the spine density for the proximal 20 μm of the apical dendrite showed a significant difference between preparations (P < 0.05) and is plotted separately (Fig. 6B). In both preparations, spines were sparse at all stages in this compartment, but unlike in acute slices, where in most neurones no spines were seen on the proximal apical dendrite in the early stages of development, a low density of spines was evident throughout development of organotypic slices. P21 was the first stage where spines were consistently present in this compartment in acute slices and, although the density was still more than three-fold lower than in other compartments, it was not significantly different from the density in organotypic slices.
Other subtle differences between the two preparations, at early stages, are detailed in Table 2 but by DIV21 these differences were no longer evident when compared to P21.
Overall the two- to three-fold increase in spine density seen in most compartments across the stages of development studied correlates well with the increase in frequency of mEPSCs recorded. This suggests that substantial synaptogenesis is taking place over this period.
Spine shape
An example of each of the spine types analysed (as defined in the Methods) is labelled in Fig. 6C. We analysed here a total of at least 660 μm of dendrites and 445 spines for each stage in organotypic and acute slices. In early development, when the spine density was lower, total lengths of 1409 and 1364 μm, and total numbers of 627 and 641 spines were analysed for DIV7 (n = 4) and P14 (n = 7), respectively.
The pattern of shape distribution in organotypic slices was remarkably similar to the distribution in acute slices at all stages, suggesting that maturation of spines in organotypic cultures proceeds physiologically. Overall there were no significant differences between the organotypic and acute slices in the proportions of any spine type, except for the thin spines which formed a higher final proportion in DIV21 than in P21 (P < 0.05, unpaired t test). All groups except the mushroom spines changed significantly during development, with similar patterns seen in both organotypic and acute slices.
In agreement with previous reports of spine type distributions in an electron microscopy study of sections from perfusion fixed brains (Harris et al. 1992), we found that stubby spines were prevalent at the early stages DIV7 and P14 (DIV7, 40 ± 2 %, n = 4; P14, 47 ± 3 %, n = 7), but decreased proportionally by the last developmental stages studied (DIV 21, 20 ± 9 % n = 3; P21, 31 ± 5 % n = 6; significant change with development, P < 0.001). In contrast the proportion of thin spines increased during development, making them the prevalent type by DIV21 and P21 (DIV7, 32 ± 3 %, n = 4; P14, 24 ± 3 %, n = 7; DIV21, 60 ± 6 %, n = 3; P21, 43 ± 2 %, n = 6; significant change with development, P < 0.0001). The filopodia tended to disappear in both acute and organotypic slices, with an initial value of 13 % in both preparations, decreasing to 0.6 ± 0.6 % (n = 3) at DIV21 and 3 ± 1 % (n = 6) at P21 (significant change with development, P < 0.0001).
The slight increase in mushroom and mushroom-branched spines was not significant, with very similar values in acute and cultured slices.
Interestingly, unlike observations previously reported (e.g. Fischer et al. 1998), there was no evidence of gross spine movement (over minutes or hours) in these preparations, either during imaging of living slices or when the same spines were compared between living and fixed tissue. This apparent lack of movement is possibly due to the fact that all recordings and analyses in the present study were performed at room temperature.
DISCUSSION
This study addresses the extent to which development of synapses onto CA1 pyramidal neurones and the morphology of these neurones are dependent on their environment within the third postnatal week of a rat's life. We compared equivalent stages in organotypic culture to development in vivo, as seen in acute slices, during this important period of new experiences for the rat. It is clear that considerable change continues over this time in the length of the dendritic tree, the density and features of spines and also in the frequency of synaptic currents. Thus ages, even in acute slices, must be tightly defined if synaptic mechanisms are to be considered. Moreover, in both preparations, development is clearly continuing even at the oldest stages tested here, and thus neither P21 nor DIV21 can be considered adult.
The comparison of organotypic cultures with acute slices suggests that the main difference between development in vitro and in vivo occurs within the first week after preparation of the cultures. During slicing, axons of many CA3 cells and all CA1 cells are cut and left without postsynaptic partners. This will occur in both preparations but as acute slices are used within the following 8 h, they have little chance for remodelling. In organotypic slices however, cutting of axons inevitably leads to a rearrangement of connectivity over the following days. By 1 week in culture, when this study started, the dendritic trees of the CA1 neurones have already become more complex at the level of higher order dendrites, and a substantial increase in the frequency of excitatory miniature synaptic currents is established, despite a similar spine density. Although we cannot completely discount the possibility that the increased frequency of excitatory miniature currents was due to a very large change in release probability at excitatory synapses, without a change in connectivity, this seems an unlikely explanation. Note that there was no difference in the frequency of inhibitory miniature currents, possibly reflecting the fact that the inhibitory circuits are largely local, within each slice area, and axons of such local interneurones would be less likely to be cut during slicing. This reveals, however, that there was no general depolarization of the slice, nor was there any factor present extracellularly to change the release probability of the whole network. Another possibility is that at P5, the age when organotypic slices are prepared, the dendritic trees of CA1 neurones may be more complex than is observed later, at P14 in the present study, and this simplification may occur through a process of pruning of sections of the dendritic tree in vivo that does not occur in vitro. There have, however, been several studies of the dendritic trees of these neurones at early stages (e.g. Haschke et al. 1980; Pokorny & Yamamoto, 1981) and only increases in the dendritic length and complexity of CA1 pyramidal neurones are described from P5. In the light of these observations and as a clear increase in complexity of the higher order dendrites is evident, the formation of new synaptic connections in these distal areas of the apical and basal dendrites, during this first week in vitro, seems a more plausible explanation for the dramatic increase in excitatory miniature frequency. It also seems likely that the number of autapses might increase within the CA1 region with cut axons synapsing back onto their cell of origin. Indeed the extended and more complex basal dendritic tree is in the right position to receive the cut CA1 axons which form collaterals extending back through this region (preliminary data not shown), while the more complex apical dendrites might be likely to receive axons and collaterals of CA3 neurones.
The primary and perhaps the most surprising finding in this study is that, once these changes are established, within the first week after the cultures are made, development then seems to proceed almost entirely normally in the culture dish, paralleling development in vivo. Thus outgrowth of the apical dendrite, increases in spine density, details of spine shape development and synaptic activity all proceed normally in the organotypic slice despite a complete lack of external input. Even the factor which is different, the frequency of miniature excitatory currents, increases by the same proportion over this developmental period.
The similarity of development in these different preparations raises interesting questions in terms of homeostasis. In experiments in dissociated cultures, where synaptic activity is altered pharmacologically, amplitudes of miniature synaptic currents have been reported to change considerably so as to maintain homeostasis of synaptic activity (Turrigiano et al. 1998; Kilman et al. 2002). In the present study such homeostasis can be considered at three different levels.
(1) Over the developmental period studied, homeostatic changes are seen in both preparations. Thus, as the spine density increases about two-fold over the developmental period studied, the amplitude of miniature excitatory synaptic currents decreases, at least partially compensating for the spine density increase in terms of total excitatory synaptic input. Moreover the rate of increase of both glutamatergic and GABAergic miniature frequency is similar, maintaining the balance of excitation and inhibition.
(2) Homeostasis is also maintained in that the spine density is almost as high in organotypic as in acute slices, despite the fact that a high proportion of inputs are presumably lost and new synapses must be formed to replace them. Thus within the existing branches from which inputs are lost, an appropriate number of new synapses is formed.
(3) In contrast, however, the very substantial increase in dendritic complexity already seen at DIV7 is maintained throughout the stages studied. This results in a very substantial overall increase in excitatory input to each CA1 neurone in organotypic slices without compensatory mechanisms apparently coming into effect. Note, however, that even in these newly formed branches the spine density and indeed distribution of spine types is similar to that seen in other parts of the dendritic tree or in acute slices.
These observations indicate that homeostatic maintenance of the strength of synaptic input to a neurone may be a more local phenomenon than has been previously suggested. Note that the pharmacological studies mentioned above have concerned the effects of changes in activity throughout the dendritic tree and hence could not distinguish between global or local effects. In the organotypic slices studied here, however, in the branches that were already formed, homeostatic mechanisms are evident, whereas new branches can be added to increase the total input without compensatory decreases ensuing. Nevertheless, even within the new branches the pattern of synapse development is clearly tightly controlled, resulting in similar spine densities and synaptic activity throughout.
Note that although the dendritic trees of CA1 neurones in both acute and organotypic slices continue to grow throughout the developmental period studied, the fractal dimension does not change in either preparation. Interestingly this is a feature of the growth of fractal objects as defined by Caserta et al. (1990). One possible explanation for the apparently slower development is that the synapses newly formed within the first week in culture are retarded in development compared to those remaining after slicing, and hence this subsection of synapses is effectively only as old as of the culture. Another possibility is that this is a form of partial homeostatic compensation for the greater synaptic input in the organotypic slices resulting in slowing of developmental increases. What is clear is that it is not possible simply to add 5 days (the age of the rat when the cultures are made) to the in vitro period to calculate the equivalent stage in vivo. Nevertheless equivalent stages can be found, and by DIV21 the cultures are very similar in detail to the features of the acute slice at P21.
Overall this means that development of neurones, details of their morphology and changes in the incoming synaptic activity seem to be largely programmed by P5, with very little influence of environment or experience over the following weeks, at least in animals reared in a simple laboratory environment. It would be interesting to study acute slices from animals reared in a more complex environment in which hippocampus-dependent learning may be more prevalent (Weiler et al. 1995).
The present study confirms previous estimates for spine density at all these stages between 7 and 21 DIV of organotypic cultures of this type (Collin et al. 1997). When compared to electron microscopy data on acute slices, however, the two- to three-fold developmental change is in close agreement, but the overall spine density reported here is lower than has been reported for acute slices at P21 (≈4 spines μm−1, Kirov et al. 1999). It is, however, interesting to note that, in this latter study, these authors report an increase in spine density in acute slices compared to slices of perfused tissue and suggest that this is a result of slicing. When compared to data from perfused tissue (P15, 1.4 ± 0.6 spines μm−1, mean ± S.D., Harris et al. 1992; P21, ≈2 spines μm−1, Kirov et al. 1999), the results of the present study are similar and well within the same range, if short segments of dendrite like those measured by electron microscopy are considered. It is thus possible that the increase in spine density previously reported due to slicing is dependent on the slicing methods (tissue chopper rather than vibrating slicer) or factors such as strain of rat or solutions used. The similarity of the present data to those from perfused tissue suggests that such changes in density may not occur under the conditions of this study. In dissociated cultures a similar developmental relationship is also observed, with a two- to three-fold increase in spine density over the first 3 weeks in vitro (Boyer et al. 1998). Moreover in this study, similar results were reported whether spine density was measured with confocal or electron microscopy.
Previous studies on spine shapes in perfused tissue using electron microscopy (Harris et al. 1992; Kirov et al. 1999) are also in agreement with the present data, confirming that the resolution of confocal microscopy is sufficient for such analysis. Moreover the only equivalent data in organotypic slices (McKinney et al. 1999) are also compatible with the results presented here. However in their confocal microscopy study, McKinney et al. (1999) used the roller tube method, and rather than studying changes during development, data from DIV14-DIV21 were pooled.
Conclusions
This is the first detailed developmental study of synaptic transmission and morphology in organotypic slices, and the only direct comparison between equivalent stages of organotypic slices and acute slices performed under the same conditions, in a single study.
The rapid rate of development over the time period of the study for both preparations must, however, raise a note of caution such that studies must be restricted to very defined time periods if results are to be consistent. Our results also stress the importance of defining the real developmental stage of organotypic slice cultures in relation to physiological development.
Overall the findings of this study reveal that organotypic slices are remarkably similar to acute slices in their development over the period in which they are most commonly used for studies of synaptic transmission. While surprising in terms of the lack of dependence of development on experience and environment, this result confirms that such cultures can be used as an excellent model system for synaptic development.
Acknowledgments
We thank Dr H. Jelinek for the assistance with fractal analysis and D. Ciantar for valuable help with the image processing. We would also like to thank Drs Y. Goda and B. Lancaster for very helpful comments on the manuscript. We acknowledge the valuable contribution of Olympus, UK for supplying the confocal microscope and Kinetic Imaging for use of Lucida software. This work was supported by the BBSRC grant C08004, a Marie Curie Fellowship to ADeS and a Deutscher Akademischer Austausch Dienst Fellowship to CBG.
REFERENCES
- Boyer C, Schikorski T, Stevens CF. Comparison of hippocampal dendritic spines in culture and in brain. J Neurosci. 1998;18:5294–5300. doi: 10.1523/JNEUROSCI.18-14-05294.1998. [DOI] [PMC free article] [PubMed] [Google Scholar]
- Cannon RC, Wheal HV, Turner DA. Dendrites of classes of hippocampal neurons differ in structural complexity and branching patterns. J Comp Neurol. 1999;413:619–633. [PubMed] [Google Scholar]
- Caserta F, Stanley HE, Eldred WD, Daccord G, Hausman RE, Nittmann J. Physical mechanisms underlying neurite outgrowth: a quantitative analysis of neuronal shape. Phys Rev Lett. 1990;64:95–98. doi: 10.1103/PhysRevLett.64.95. [DOI] [PubMed] [Google Scholar]
- Collin C, Miyaguchi K, Segal M. Dendritic spine density and LTP induction in cultured hippocampal slices. J Neurophysiol. 1997;77:1614–1623. doi: 10.1152/jn.1997.77.3.1614. [DOI] [PubMed] [Google Scholar]
- Coltman BW, Earley EM, Shahar A, Dudek FE, Ide CF. Factors influencing mossy fiber collateral sprouting in organotypic slice cultures of neonatal mouse hippocampus. J Comp Neurol. 1995;362:209–222. doi: 10.1002/cne.903620205. [DOI] [PubMed] [Google Scholar]
- Edwards FA, Konnerth A, Sakmann B, Takahashi T. A thin slice preparation for patch clamp recordings from neurones of the mammalian central nervous system. Pflugers Arch. 1989;414:600–612. doi: 10.1007/BF00580998. [DOI] [PubMed] [Google Scholar]
- Eltson GN, Jelinek HF. Dendritic branching patterns of pyramidal cells in the visual cortex of the new world marmoset monkey, with comparative notes on the old world macaque monkey. Fractals. 2001;9:297–303. [Google Scholar]
- Fischer M, Kaech S, Knutti D, Matus A. Rapid actin-based plasticity in dendritic spines. Neuron. 1998;20:847–854. doi: 10.1016/s0896-6273(00)80467-5. [DOI] [PubMed] [Google Scholar]
- Gähwiler BH. Organotypic monolayer cultures of nervous tissue. J Neurosci Methods. 1981;4:329–342. doi: 10.1016/0165-0270(81)90003-0. [DOI] [PubMed] [Google Scholar]
- Gähwiler BH, Capogna M, Debanne D, Mckinney RA, Thompson SM. Organotypic slice cultures: a technique has come of age. Trends Neurosci. 1997;20:471–477. doi: 10.1016/s0166-2236(97)01122-3. [DOI] [PubMed] [Google Scholar]
- Gibb AJ, Edwards FA. Patch clamp recording from cells in sliced tissues. In: Ogden D, editor. Microelectrode Techniques. The Plymouth Workshop Handbook. Cambridge: The Company of Biologists Limited; 1994. pp. 255–274. [Google Scholar]
- Harris KM, Jensen FE, Tsao B. Three-dimensional structure of dendritic spines and synapses in rat hippocampus (CA1) at postnatal day 15 and adult ages: Implications for the maturation of synaptic physiology and long- term potentiation. J Neurosci. 1992;12:2685–2705. doi: 10.1523/JNEUROSCI.12-07-02685.1992. [DOI] [PMC free article] [PubMed] [Google Scholar]
- Haschke A, Mende W, Minkwitz HG. Zur Entwicklung von Dentritenstrukturen an CA1-Pyramidenneuronen des Hippocampus der Ratte in Abhaengingkeit ihrer Schichtenzugehoerigkeit mit und ohne unspezifischer experimenteller Beeinflussung. (Development of dendrite structures on CA 1 hippocampal pyramidal neurons of rat dependent on their stratification with and without non-specific experimental influence.) Z Mikrosk Anat Forsch. pp. 593–622. [PubMed]
- Jelinek HF, Elston GN. Pyramidal neurones in macaque visual cortex: interareal phenotypic variation of dendritic branching patterns. Fractals. 2001;9:287–295. [Google Scholar]
- Jelinek HF, Fernández E. Neurons and fractals: how reliable and useful are calculations of fractal dimensions? J Neurosci Methods. 1998;81:9–18. doi: 10.1016/s0165-0270(98)00021-1. Kaiserman-Abramof IR 1969. [DOI] [PubMed] [Google Scholar]
- Kaiserman-Abramof IR. The spines of pyramidal cell dendrites. A light and electron microscope study. Anat Rec. 1969;163:208. [Google Scholar]
- Kilman V, van Rossum MCW, Turrigiano GG. Activity deprivation reduces miniature IPSC amplitude by decreasing the number of postsynaptic GABAA receptors clustered at neocortical synapses. J Neurosci. 2002;22:1328–1337. doi: 10.1523/JNEUROSCI.22-04-01328.2002. [DOI] [PMC free article] [PubMed] [Google Scholar]
- Kirov SA, Sorra KE, Harris KM. Slices have more synapses than perfusion-fixed hippocampus from both young and mature rats. J Neurosci. 1999;19:2876–2886. doi: 10.1523/JNEUROSCI.19-08-02876.1999. [DOI] [PMC free article] [PubMed] [Google Scholar]
- Lüscher C, Nicoll RA, Malenka RC, Muller D. Synaptic plasticity and dynamic modulation of the postsynaptic membrane. Nat Neurosci. 2000;3:545–550. doi: 10.1038/75714. [DOI] [PubMed] [Google Scholar]
- McKinney RA, Capogna M, Dürr R, Gähwiler BH, Thompson SM. Miniature synaptic potentials mediated by AMPA receptors maintain dendritic spines in CA1 pyramidal neurons. Nat Neurosci. 1999;2:1–7. [Google Scholar]
- Malinow R, Malenka RC. AMPA receptor trafficking and synaptic plasticity. Annu Rev Neurosci. 2002;25:103–126. doi: 10.1146/annurev.neuro.25.112701.142758. [DOI] [PubMed] [Google Scholar]
- Martin SJ, Grimwood PD, Morris RGM. Synaptic plasticity and memory: An evaluation of the hypothesis. Annu Rev Neurosci. 2000;23:649–711. doi: 10.1146/annurev.neuro.23.1.649. [DOI] [PubMed] [Google Scholar]
- Muller D, Buchs PA, Stoppini L. Time course of synaptic development in hippocampal organotypic cultures. Dev Brain Res. 1993;71:93–100. doi: 10.1016/0165-3806(93)90109-n. [DOI] [PubMed] [Google Scholar]
- Nimchinsky EA, Sabatini BL, Svoboda K. Structure and function of dendritic spines. Annu Rev Physiol. 2002;64:313–353. doi: 10.1146/annurev.physiol.64.081501.160008. [DOI] [PubMed] [Google Scholar]
- Peters A, Kaiserman-Abramof IR. The small pyramidal neuron of the rat cerebral cortex: the synapses upon dendritic spines. Z Zellforsch. 1969;100:487–506. doi: 10.1007/BF00344370. [DOI] [PubMed] [Google Scholar]
- Pokorny J, Yamamoto T. Postnatal ontogenesis of hippocampal CA1 area in rats. I. Development of dendritic arborisation in pyramidal neurons. Brain Res Bull. 1981;7:113–120. doi: 10.1016/0361-9230(81)90075-7. [DOI] [PubMed] [Google Scholar]
- Sholl DA. Dendritic organization in the neurons of the visual and motor cortices of the cat. J Anat. 1953;87:387–406. [PMC free article] [PubMed] [Google Scholar]
- Smith TG, Jr, Behar TN. Comparative fractal analysis of cultured glia derived from optic nerve and brain demonstrate different rates of morphological differentiation. Brain Res. 1994;634:181–190. doi: 10.1016/0006-8993(94)91921-6. [DOI] [PubMed] [Google Scholar]
- Sorra KE, Harris KM. Overview on the structure, composition, function, development, and plasticity of hippocampal dendritic spines. Hippocampus. 2000;10:501–511. doi: 10.1002/1098-1063(2000)10:5<501::AID-HIPO1>3.0.CO;2-T. [DOI] [PubMed] [Google Scholar]
- Stoppini L, Buchs PA, Muller D. A simple method for organotypic cultures of nervous tissue. J Neurosci Methods. 1991;37:173–182. doi: 10.1016/0165-0270(91)90128-m. [DOI] [PubMed] [Google Scholar]
- Turrigiano GG, Leslie KR, Desai NS, Rutherford LC, Nelson SB. Activity-dependent scaling of quantal amplitude in neocortical neurons. Nature. 1998;391:892–896. doi: 10.1038/36103. [DOI] [PubMed] [Google Scholar]
- Weiler IJ, Hawrylak N, Greenough WT. Morphogenesis in memory formation: Synaptic and cellular mechanisms. Behav Brain Res. 1995;66:1–6. doi: 10.1016/0166-4328(94)00116-w. [DOI] [PubMed] [Google Scholar]
- Yamamoto C, Mcllwain H. Electrical activities in thin sections from the mammalian brain maintained in chemically-defined media in vitro. J Neurochem. 1966;13:1333–1343. doi: 10.1111/j.1471-4159.1966.tb04296.x. [DOI] [PubMed] [Google Scholar]