

Abstract
We tested the hypothesis that glaucoma disrupts electrophysiological conduction properties and axon function in optic nerve as a function of intraocular pressure (IOP) levels and age in the DBA/2J mouse model of glaucoma. The amplitude and the integral of electrical signals evoked along the axons decreased considerably by 6 months of age as a function of increasing IOP levels. At young ages, raised IOP was directly associated with increased vulnerability to metabolic challenge. Changes in the physiological function of the optic nerves were accentuated with aging, leading to loss of compound action potential in an entire population of fibers: small, slow conducting axons. This loss was accompanied with loss of small fiber axon counts and declining metabolic reserve by demonstrating IOP-dependent ATP decrease in mouse optic nerves. These data shed light on a novel potential mechanism of glaucoma pathology whereby increased IOP and declining metabolic capacity lead to axon liability and eventually dysfunction and loss.
Introduction
Intraocular pressure (IOP) increase, a major risk factor for glaucoma development (Flanagan, 1998; Friedman et al., 2004), is a result of pigment dispersion that blocks aqueous humor outflow in eyes from the DBA/2J mouse glaucoma model (John et al., 1998; Anderson et al., 2002; Libby et al., 2005b). The resultant IOP increase has been correlated with neurodegenerative changes such as axon loss (John et al., 1998; Libby et al., 2005b; Inman et al., 2006). The mechanism of vision loss in glaucoma is not understood, but evidence, such as transport blockade of tracers or cargo at the optic nerve head (ONH) (Johansson, 1986, 1988; Quigley et al., 2000), retention of intraretinal retinal ganglion cell (RGC) axons concomitant with axon loss in the optic nerve (Soto et al., 2008), a retrograde course of degeneration as assessed through axon quantification (Schlamp et al., 2006), and maintenance of RGC somata while retrograde label is lost (Buckingham et al., 2008), demonstrates that RGC axons are a critical site of early pathological change. Bax knock-out mice in which degeneration proceeds in the axon while RGC somata survive increased IOP (Libby et al., 2005a) further illustrates the compartmentalization of degenerative changes that can occur. These data indicate a primary sensitivity of the optic nerve to glaucomatous insult and argue strongly for additional analysis of potential mechanisms that underpin axonal vulnerability.
There are a number of optic nerve qualities that may contribute to a unique sensitivity to injury in glaucoma, a disease whose chronic nature implicates age in the pathophysiology of the disease. Studies of optic nerve in the context of white matter injury demonstrate that age is a determining factor in ischemic injury response. In contrast to young optic nerve, severity of injury from the same ischemic insult was greater in optic nerve from older mice (≥12 months) (Baltan et al., 2008). Increased vulnerability of aging white matter to ischemia has clear implications for glaucoma because age is a major risk factor. In addition, the vascular dysregulation that has been correlated with increased progression of visual field defect in glaucoma patients (Tokunaga et al., 2004; Grieshaber and Flammer, 2005; Resch et al., 2009) and underlies the impaired RGC activity in animal models (Grehn and Prost, 1983; Siliprandi et al., 1988) likely leads to ischemic damage.
To characterize the onset and mechanisms of optic nerve functional decline in the DBA/2J mouse glaucoma model, we used an in vitro optic nerve preparation that allows quantitative evaluation of injury using electrophysiology and immunochemical and biochemical methods. Our results demonstrate an IOP-dependent increased vulnerability to oxygen-glucose deprivation (OGD) in the young optic nerve (ON) of DBA/2J mice. We also observed an interaction of IOP and aging that contributed to prominent loss of slow conducting fibers in old mice with high IOP. Increased IOP hindered the compound action potential (CAP) area recovery after OGD in young ONs, whereas recovery in old ONs was independent of IOP. Consistent with this, increased IOP compromised ATP levels in young and old ON, but age had a greater impact on ON ATP levels in older mice.
Parts of this work were presented previously in abstract form (Baltan et al., 2009; Inman et al., 2009).
Materials and Methods
Subjects.
These experiments adhered to the Association for Research in Vision and Ophthalmology Statement for the Use of Animals in Ophthalmic and Vision Research. DBA/2J and C57BL/6 mice were originally obtained from The Jackson Laboratory and then bred and housed in a specific pathogen-free barrier facility at Harborview Medical Center (Seattle, WA). New breeders were added to the DBA/2J colony every 4 months to counteract any potential genetic drift. Mice were maintained in a 12 h light/dark cycle with standard rodent chow available ad libitum. The University of Washington Institutional Animal Care and Use Committee approved all experimental procedures.
Intraocular pressure measurement.
Intraocular pressure was measured in lightly anesthetized (Avertin, 1.3% tribromoethanol, 0.8% tert-amyl alcohol) mice using the TonoLab rebound tonometer from Tiolat Oy, calibrated for mice. Proparacaine (0.5% proparacaine hydrochloride ophthalmic solution; Bausch & Lomb) was applied to the eye before IOP measurement. Twenty IOP measurements were taken and averaged for each eye, each month between 2 and 10 months of age. IOP does not increase equally in both eyes in the DBA/2J mice. IOP is a continuous variable, and mice were chosen for their IOP extremes within their respective age groups. For example, from all mice at 10 months of age, we chose the ones with the highest and the lowest IOP. Instrument averages (automatic to the device after every sixth reading) and readings beyond 1 SD (indicative of an incorrect reading) were omitted. IOP readings shown in Figures 1 and 6 are the final averaged measure taken from that respective eye.
Figure 1.
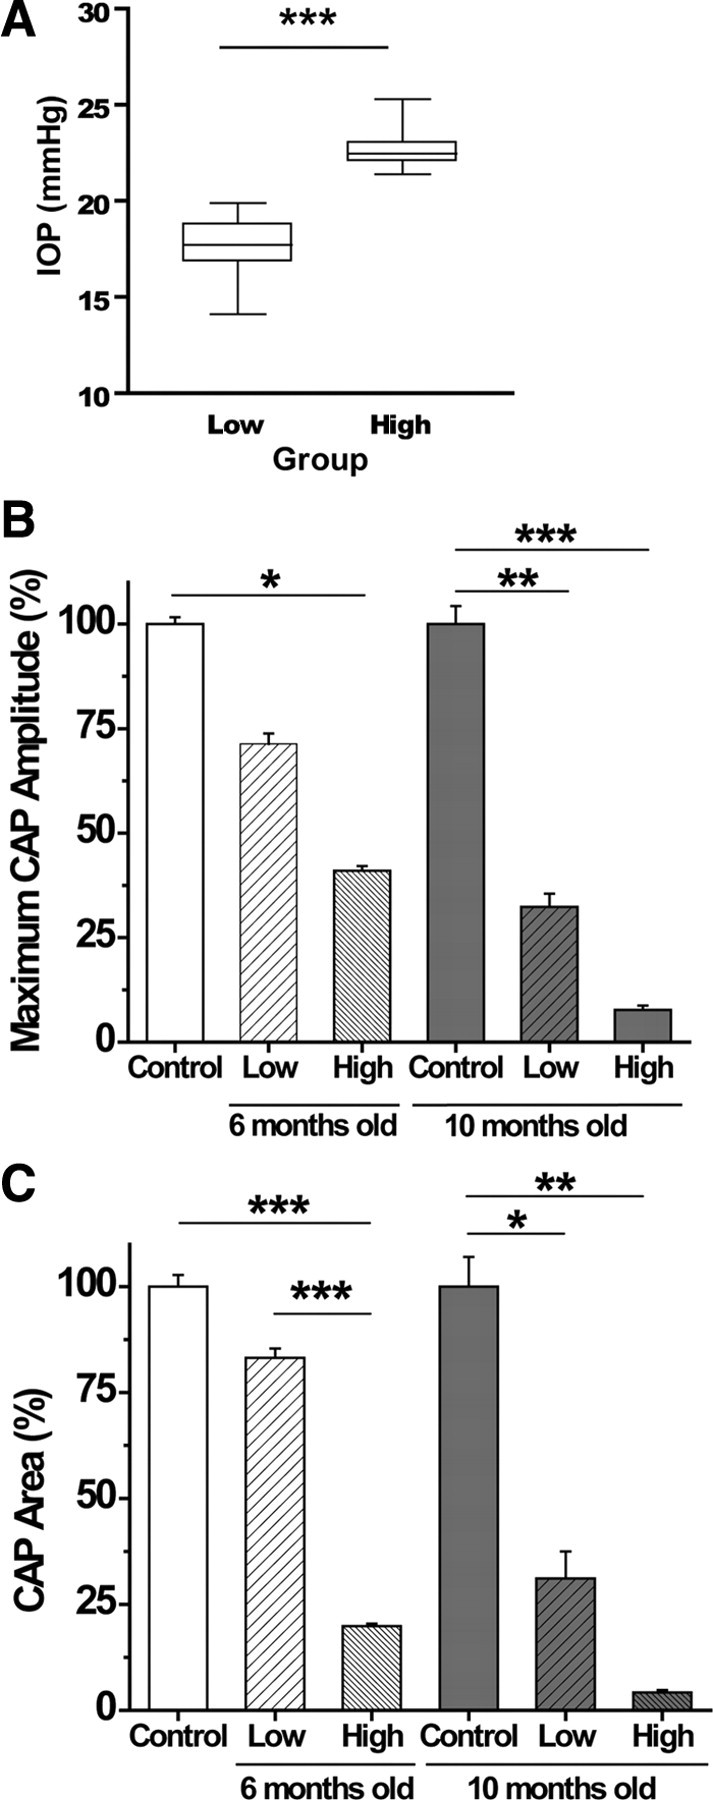
A, Final IOP measurements taken from eyes used in the physiology experiments. Low and high IOP groups contain measures from 6- and 10-month-old DBA/2 mice that were chosen for their IOP difference within their age group. Mean IOP in the low group is 17.5 ± 0.3 mmHg, and the high group mean is 22.6 ± 0.25 mmHg; these means are significantly different (t test, ***p < 0.0001). B, Maximum CAP amplitude (millivolts) as a percentage of control for each of the control and experimental groups. There is a significant decrease in maximum CAP amplitude with high IOP, regardless of age (6 months, ANOVA, *p < 0.05; and 10 months, ANOVA, ***p < 0.001). Maximum CAP amplitudes for low versus high IOP in both 6 and 10 month groups are significantly different (p < 0.001). Young and 10 month control maximum CAP amplitude are significantly different (**p < 0.01), as are 6 and 10 month high IOP maximum CAP amplitudes (p < 0.001). C, CAP area (millivolts per milliseconds) as a percentage of control for control and experimental groups. There is a significant decrease in CAP area with high IOP, regardless of age (6 months, ANOVA, ***p < 0.0001; and 10 months, ANOVA, **p < 0.01). CAP areas for low versus high IOP in both 6 and 10 month groups are significantly different (***p < 0.001). Young and 10 month control CAP areas are significantly different (*p < 0.05), as are 6 and 10 month high IOP CAP areas (p < 0.01). See Table 2 for values and n values. For graphs in B and C and all graphs in subsequent figures, the young control group (white bar) is 6-week-old DBA/2J ON, whereas the 10-month-old control (black bar) is C57BL/6 ON; non-glaucomatous mice with a DBA/2J genetic background could not be obtained.
Figure 6.
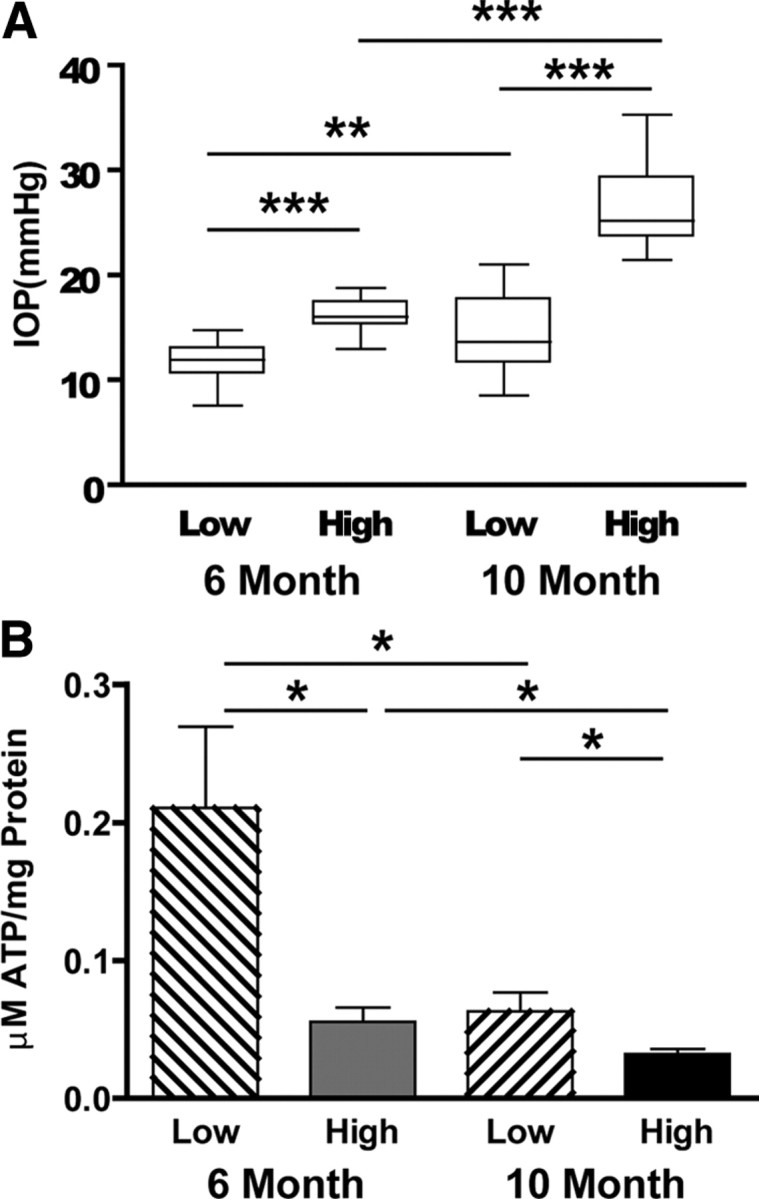
A, Box plots of mean IOP for mice used in the ON ATP determinations. Mean IOP of young (6 month) low is 11.7 ± 1.8 mmHg (n = 12), and high is 16.3 ± 1.5 mmHg (n = 13); mean IOP of old (10 month) low is 14.7 ± 3.8 mmHg (n = 16), and high is 26.3 ± 3.6 mmHg (n = 15; t test, **p < 0.01, ***p < 0.001). B, ATP levels (micromoles of ATP per milligrams of ON protein) were measured in young and old DBA/2J ON at low and high IOP. IOP had a significant effect on ATP levels in young and old ON, with significantly decreased ON ATP in low versus high IOP groups (t test, *p < 0.012 for young; *p < 0.049 for old). There is also a significant difference in the ATP levels in young versus old at low (t test, *p < 0.014) and high (t test, *p < 0.028) IOP.
ATP measurements.
ATP extraction was done using a method first described for brain and modified for optic nerve tissue (Khan, 2003). The nerve was cut in two to three small pieces using a small needle while in 75 μl 10% HClO4, then homogenized five times by sonication for 1 s, and centrifuged at 4500 rpm for 10 min at 40°C. The supernatant was collected, then neutralized with 30 μl of 2.5 m KOH, and centrifuged at 14,000 rpm for 10 min at 40°C. The precipitate was removed, and the supernatant was kept on ice for additional ATP measurement. Total cellular ATP concentrations were measured using the ATP bioluminescence assay kit (Roche), based on the ATP dependence of luciferase catalyzed oxidation of luciferin. Samples were diluted and mixed with the luciferase reagent and then absorbance was measured at 560 nm. Blank values were subtracted from the raw data, and ATP concentrations were calculated from a log–log plot of the standard curve data and normalized by the protein concentration. The values are expressed as micromoles of ATP per milligrams of protein.
Axon counts.
Mice were transcardially perfused with 4% paraformaldehyde in 0.1 m phosphate buffer, pH 7.4 (PFA). Optic nerves were dissected free, then postfixed for 24 h in PFA before rinsing in cacodylate buffer, and then further fixation in 1% osmium (OsO4) in sodium cacodylate buffer for 30 min. Nerves were then rinsed in cacodylate buffer, dehydrated in graded alcohol solutions, and embedded in Epon–Araldite at 60°C for 72 h. For axon quantification, we used an Olympus Provis AX70 microscope equipped with a motorized x–y–z stage, a digital video camera, and 100× oil-immersion, differential interference contrast optics. We collected photomicrographs from 1–2 μm cross-sections of each nerve en montage so that the entire surface area of the nerve was represented. Each micrograph was contrast and edge enhanced using macro-routines written using the ImagePro software package (Media Cybernetics). An additional routine was used to identify and count each axon for which a single, intact myelin sheath could be identified and to calculate the internal cross-sectional area of each identified axon. Ten mouse ONs each at low and high IOP were quantified.
Electrophysiological recordings.
The experimenter was blinded to the IOP levels of the mice during the preparation of the optic nerves and physiological recordings. Optic nerves were removed from DBA/2J of C57BL/6 mice following CO2 narcosis and decapitation. Preparation of nerves, recording technique, and ischemic insult proceeded as described previously (Baltan et al., 2008). After gently removing the dural sheath, optic nerves were placed in an interface perfusion chamber (Medical Systems). Both nerves from each animal were used simultaneously on identical setups to keep animal numbers to a minimum. Mouse ONs were superfused with artificial CSF (ACSF) containing the following (in mmol/L): 124 NaCl, 3.0 KCl, 2.0 CaCl2, 2.0 MgCl2, 1.25 NaH2PO4, 23 NaHCO3, and 10 glucose. The perfusion chamber was continuously aerated by a humidified gas mixture of 95% O2/5% CO2. All experiments were performed at 37°C.
Suction electrodes backfilled with ACSF were used for stimulation (Isostim 520; WPI) and recording CAP. The recording electrode was connected to an Axoclamp 2A amplifier, and the signal was amplified 50 times, filtered at 30 kHz, and acquired at 20–30 kHz. Stimulus pulse (30–50 μs duration) strength was adjusted to evoke the maximum CAP possible and then increased an additional 25% for supramaximal stimulation. The ONs were equilibrated for at least 15 min in the chamber in normal ACSF before experiments. During experiments, the supramaximal CAP was elicited every 30s.
OGD was induced by switching to glucose-free ACSF (replaced with equimolar sucrose to maintain osmolarity) and a gas mixture containing 95% N2/5% CO2. To ensure no oxygen was inadvertently delivered by the superfusate, ACSF was always bubbled with 95% N2/5% CO2 (Ransom and Philbin, 1992). OGD was applied for 45 or 60 min to determine the effects on axonal conduction and recovery. After OGD, control ACSF and O2 were restored and CAPs were recorded for up to 6 h.
The suction electrode recording configuration at supramaximal stimulation allows all axons in optic nerve to be activated and the resultant action potential from each axon to be recorded. This method has the advantage of enabling stable recording of three-peaked (P1, P2, and P3) characteristic shape of CAPs (see Fig. 2A). These peaks reflect three subgroups of axon populations based on their conduction velocity (Geddes, 1972) and the area under the CAP reflecting the number of contributing axons (Cummins et al., 1979). Supramaximally evoked CAPs were used to assess the characteristic three-peaked shape, the maximum CAP amplitude (P2 amplitude), the CAP area, and the latency. The CAP latency was measured as the time between the onset of the stimulus artifact to the first peak as described previously (Nashmi et al., 1997). The CAP amplitude, the CAP area, and the latency were calculated for each animal after averaging 30 traces from baseline conditions. The stimulus artifact was isolated after addition of 1 μm TTX in the bath at the end of the experiments to accurately determine latency measurements.
Figure 2.
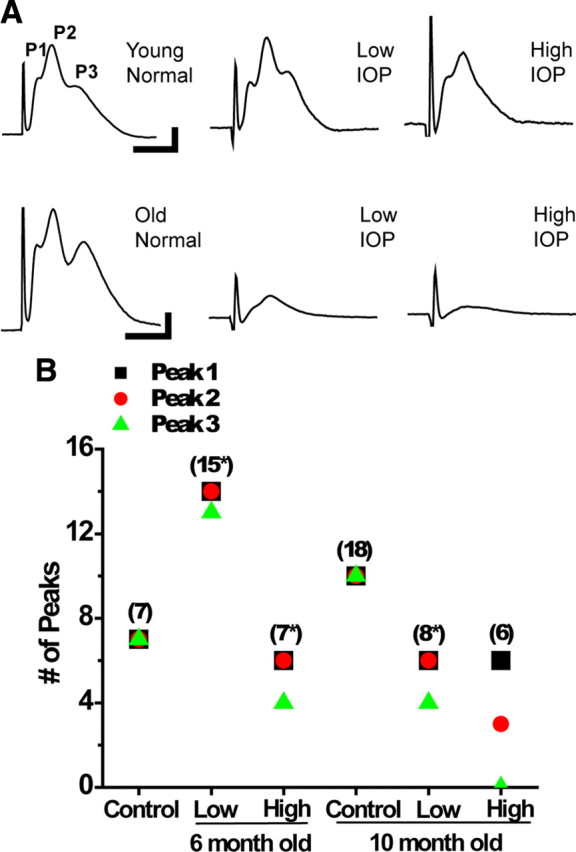
A, Representative CAP traces for the control and experimental groups. The CAP peaks (P1, P2, and P3) are labeled, with each peak depicting the output from the fast (P1), medium (P2), and slow (P3) conducting axons within the mouse optic nerve. Young normal IOP (6 week DBA/2J) and young mice (6-month-old) with low IOP look similar, whereas some decrement in the size and features of the CAP trace can be observed in the young mice with high IOP. The old normal IOP (10 month C57BL/6) mouse has a recognizable three-peaked CAP trace, whereas there is a noticeable decline in CAP trace size at both 10 month low and high IOP. B, Graph showing number of CAP peaks across control and experimental groups. Number in parentheses (n) indicates number of ON, and * indicates that there was 1 (or more, note symbol placement) ON in that group in which no CAP could be elicited using supramaximal stimulation. Position of squares shows the number of ON CAPs with P1, circles represent P2 numbers, and triangles represent P3. There was one CAP that did not have P3 in the 6 month low IOP group, whereas two CAPs lacked P3 in the 6 month high IOP group. At 10 months, the low IOP group had two ONs lacking P3; two ONs overall in this group could not generate a CAP. Every ON in the 10 month high IOP group has lost P3 from the CAP trace, whereas half also lost P2, a significant decrease in peak number (one-way ANOVA, p < 0.01). See Table 2 for values and n values.
K+ channel blocker 4-aminopyridine (4-AP) (100 μm; Tocris Bioscience) dissolved in ACSF was applied while recording baseline CAPs to determine whether fast-acting K+ channels contributed to noted decrease in the CAP area and the CAP amplitude with increased IOP in the young or with aging in the older mice as a result of dysmyelination.
Data analysis.
Optic nerve function was monitored quantitatively as the area under the supramaximal CAP. The CAP area is proportional to the total number of excited axons and represents a convenient and reliable means of monitoring optic nerve axon function (Cummins et al., 1979; Stys et al., 1991). CAP recovery was measured by determining residual CAP area, normalized to control CAP area, 4–6 h after the conclusion of OGD. Data were normalized by setting the mean of initial baseline values (measured over 15 min) to a value of 1.0. Results from several nerves were pooled, averaged, and plotted against time. All data are presented as mean ± SEM. In time course plots, SEM bars are only shown every 3 min to make the illustration less cluttered; n indicates the number of optic nerves used in experiments (see Table 2).
Table 2.
Peak, latency, amplitude, duration, and area measures for CAP
| # of peaks | P1 latency | P2 latency | P3 latency | CAP amplitude | CAP duration | CAP area | 60 min OGD CAP recovery | 45 min OGD CAP recovery | n | |
|---|---|---|---|---|---|---|---|---|---|---|
| Young | ||||||||||
| DBA/2, 6 weeks | ||||||||||
| Control (n = 7) | 3.00 ± 0 | 1.39 ± 0.03 | 1.78 ± 0.04 | 2.23 ± 0.05 | 100 ± 1.61 | 2.34 ± 0.19 | 100 ± 2.76 | 35.63 ± 1.63 | 42.6 ± 4.3 | 7 |
| DBA/2, 6 months | ||||||||||
| Low IOP (n = 14) | 2.92 ± 0.08 | 1.42 ± 0.03 | 1.85 ± 0.04 | 2.38 ± 0.08 | 71.4 ± 2.47 | 2.59 ± 0.16 | 83.2 ± 2.16 | 16.92 ± 3.06 | 16.05 ± 3.5 | 4 |
| DBA/2, 6 months | ||||||||||
| High IOP (n = 6) | 2.66 ± 0.21 | 1.35 ± 0.04 | 1.72 ± 0.05 | 2.22 ± 0.07 | 41 ± 1.14 | 2.18 ± 0.25 | 19.9 ± 0.56 | 9.52 ± 2.23 | 22.1 ± 6.3 | 4 |
| Old | ||||||||||
| C57BL/6 | ||||||||||
| Control (n = 10) | 3.00 ± 0 | 1.38 ± 0.02 | 1.74 ± 0.02 | 2.34 ± 0.07 | 100 ± 6.3 | 2.28 ± 0.14 | 100 ± 6.99 | 13.6 ± 1.1 | 17.7 ± 2.9 | 10 |
| DBA/2, 10 months | ||||||||||
| Low IOP (n = 9) | 2.50 ± 0.29 | 1.60 ± 0.11 | 2.06 ± 0.11 | 2.48 ± 0.01 | 32.4 ± 3.11 | 2.51 ± 0.42 | 31.1 ± 6.4 | 3.30 ± 2.43 | 16.9 ± 8.1 | 2 |
| DBA/2, 10 months | ||||||||||
| High IOP (n = 6) | 1.66 ± 0.37 | 1.77 ± 0.14 | 1.97 ± 0.08 | No peaks | 7.7 ± 1.04 | 2.28 ± 0.13 | 4.2 ± 0.56 | 8.68 ± 3.19 | 22.1 ± 8.99 | 2 |
Results
Figure 1A shows a box plot of IOP from all DBA/2J mice (6 and 10 months old) used in the electrophysiological experiments; the low and high IOP groups were significantly different (t test, p < 0.001). Differential IOP allows us to distinguish between changes in pathology attributable to IOP, and thus glaucomatous changes, as opposed to aging in these mice. By calculating the average difference in IOP for low and high IOP groups at 6 and 10 months, we were able to estimate differences in the magnitude of IOP exposure (Table 1). For low versus high IOP groups at 6 months, the high IOP mice have experienced an average of 99.7 mmHg/d of additional intraocular pressure. At 10 months, the difference in IOP exposure between low and high IOP was 528 mmHg/d.
Table 1.
Differences in IOP exposure at 6 and 10 months in DBA/2J optic nerve
| Low versus high IOP |
||
|---|---|---|
| Average IOP difference | IOP integral difference (mmHg/d) | |
| 6 months (n = 30) | 4.42 | 99.7 |
| 10 months (n = 30) | 5.52 | 528 |
The CAP area decreases with age and increased IOP
Optic nerves from DBA/2J mice at 6 weeks (“control”), at 6 months (“young”), and at 10 months of age (“old”) were used to evoke supramaximal CAPs. Six-week-old DBA/2J mice were used as control mice for the young group, because they have the DBA/2J background but do not exhibit signs of glaucomatous changes. Lacking old mice with a DBA/2J background that do not have glaucomatous changes, we used C57BL/6 mice at 9–12 months of age as controls. IOP for C57BL/6 mice ranged between 11.2 ± 3 mmHg (Zhou et al., 2005) and ∼13 mmHg (Savinova et al., 2001) but is significantly lower than IOP in DBA/2J mice (Fig. 1A). Hence, the C57BL/6 mouse serves as a mouse with normal IOP, a control for old DBA/2J mice with either high or low pressure.
In the young mice, the maximum CAP amplitude was only reduced in the high IOP group (one-way ANOVA, p < 0.05) (Fig. 1B, Table 2). In the old group, the effect of IOP levels on the maximum CAP amplitude became more prominent. There was major reduction of the maximum CAP amplitude in both the low IOP (one-way ANOVA, p < 0.01) and high IOP (one-way ANOVA, p < 0.001) groups compared with old control ONs.
Whereas the maximum CAP amplitude, measured as the amplitude of the second peak (P2), represents the majority of axons with medium conduction velocity in optic nerve (see below), the CAP area (the area under the entire CAP amplitude curve) provides a reliable measure of the size of the axon population contributing to the CAP (Cummins et al., 1979; Stys et al., 1991). Changes in the CAP area indicate loss of the individual conduction potential contribution from axons in the ON. As observed with maximum CAP amplitude, the CAP area showed depression with age and IOP levels (Fig. 1C). In the young mice, the CAP area was reduced in ONs from the high IOP group compared with the low IOP group (one-way ANOVA, p < 0.001) and control group (one-way ANOVA, p < 0.001). Among old ONs, IOP levels dictated the extent of the CAP area decline. The CAP area was reduced considerably in low IOP (one-way ANOVA, p < 0.05) and high IOP (one-way ANOVA, p < 0.01) groups compared with old control ONs.
Increased IOP specifically disrupts slow conducting lightly myelinated axons in older optic nerves
Compound action potentials recorded from optic nerve in suction electrode configuration exhibit three peaks (P1, P2, and P3); each peak corresponds in general to axons conducting at speeds that are fast (P1), medium (P2), or slow (P3) (Fig. 2A). This characteristic of axon conduction is well preserved with age (Baltan et al., 2008) (Fig. 2A, bottom). A change in characteristics of CAPs such as loss of a peak may indicate loss of a group or subset of axons contributing to the CAPs (Geddes, 1972). To test how IOP affects physiology, we recorded baseline CAPs from young and old ONs with low and high IOP levels. Figure 2A demonstrates representative CAPs from each of the experimental groups. Young ONs showed modest decline in peak number with increasing IOP (Table 2, Fig. 2A,B). In control mice, all seven ONs tested exhibited three-peaked CAPs. Figure 2B illustrates this finding with overlapping of P1 (black squares), P2 (red circles), and P3 (green triangles) symbols for all seven CAPs. In this age group, 15 ONs were evaluated with low IOP levels, and the CAPs were evoked in 14, whereas P3 was lost in only one nerve (Fig. 2B, note P3 green triangle showing 13 P3s of a possible 14). Among young high IOP ONs, the CAPs were evoked in six of seven ONs, and P3 was lost only in two CAPs. Aging had no effect on whether the CAPs had three peaks; however, IOP levels gravely affected the CAP shape and presence of peaks in old ONs. Among old low IOP ONs, the CAPs were evoked in six of eight ONs, and P3 was missing in two of these ONs. In the high IOP group, although the CAPs were evoked in all nerves tested, only three nerves exhibited P2 and none presented with P3 (Fig. 2B, note green triangle for P3 at zero).
Our results suggested that the degree of IOP exposure dictated the shape of the CAPs even in the young group. In the old high IOP group, loss of P3 in all ONs and P2 in three of six mice suggested that an entire class of slow conducting fibers and a major portion of medium conducting fibers were dysfunctional.
To determine whether glaucomatous changes were associated with conduction delay along optic nerve, the CAP latency, a measure of speed of axon responsiveness to stimulation, was assessed. Latency was measured as the time from the end of stimulus artifact to the peak amplitude of P1, P2, and P3. IOP levels did not alter latency to P1, P2, or P3 in the young ONs (Table 2, Fig. 3A), whereas IOP changes in the old ONs slightly but significantly prolonged latency to P1 between control and high IOP groups (Fig. 3A) (one-way ANOVA, p = 0.001). P3 was missing completely in the old high IOP group. Figure 3B shows no differences in the CAP duration across the control and experimental groups. The absence of conduction delay between young and old control groups together with latency changes in old ON with increased IOP implied an IOP-dependent disturbance in optic nerve conduction as a contributing factor in chronic glaucoma.
Figure 3.
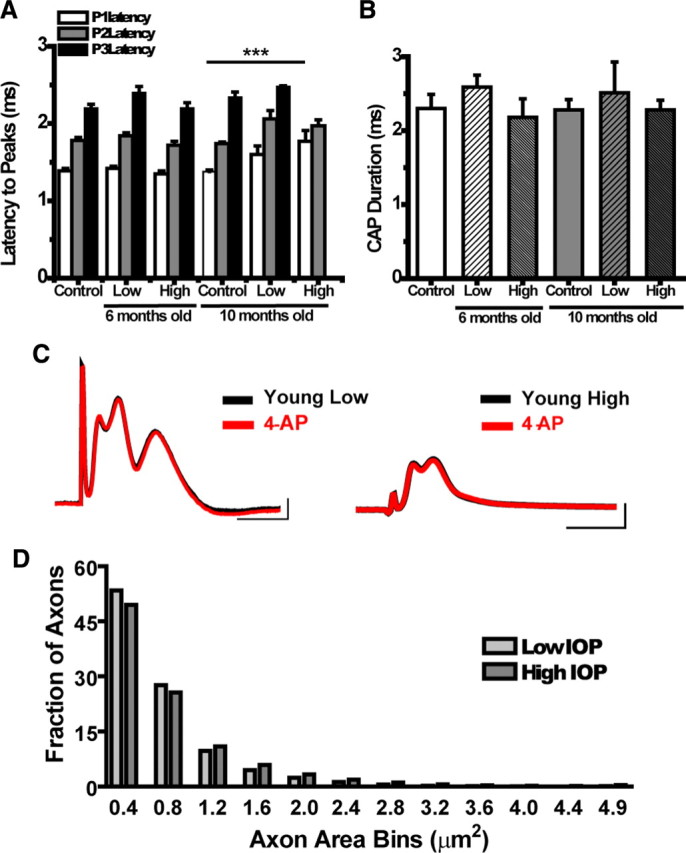
A, Graph showing latency to peak (milliseconds) for each control and experimental group. There are no significant differences in peak latency within the young (6 month) group; by 10 months, latency for each of the peaks at low IOP has crept up, a trend that is exacerbated in the 10 month high IOP group. The latency for P1 in high IOP at 10 months is significantly different from control (t test, ***p < 0.0001). P3 never arrives for the 10 month high IOP group. B, CAP duration (milliseconds) for control and experimental groups. The CAP recording time for each nerve does not vary significantly across age or IOP. See Table 2 for values and n values. C, Representative CAP traces in young ON at low and high IOP before and after treatment with 4-AP. The absence of changes in CAP amplitude or latency with 4-AP suggest that K+ channels are not exposed as they would be in demyelinated axons. D, Histogram of axon area measures as a fraction of total axons obtained from high-magnification plastic ON cross-sections in 5- to 8-month-old DBA/2J mice with low or high IOP (n = 20 for each IOP group). Axons were binned into 0.4 μm groups. There is a decrease in the fraction of axons with areas (not including myelin) between 0.0 and 0.4 μm2 and 0.5 and 0.8 μm2 in the high IOP mice. These areas correspond to axons with diameters between 0.01 and 0.56 μm.
Changes in the CAP electrophysiological properties are not attributable to demyelination
Application of 4-AP, a voltage-sensitive K+ channel blocker, improves abnormal electrophysiological properties, including attenuation of the CAP amplitude and conduction velocity attributable to demyelination or dysmyelination (Blight, 1989; Nashmi et al., 2000). To rule out whether demyelination contributes to glaucoma-related changes in electrophysiological properties of ONs (Fig. 3A), we applied 4-AP to the bath while recording from young ONs with low or high IOP. We recorded baseline CAPs for 30 min and then applied 4-AP and monitored the CAPs for another 30 min. There was no change in the CAP amplitude or the CAP area with 4-AP application (Fig. 3C), suggesting that the exposure of K+ channels attributable to myelination abnormalities do not contribute to electrophysiological CAP changes observed in DBA/2J ONs. Figure 3C shows sample CAP traces from a young low (left) and high (right) IOP DBA/2J ON before and after 4-AP bath application. Application of 4-AP had no effect on control ON baseline responses (data not shown). If the decrease in conduction velocity is not attributable to demyelination, as suggested by the 4-AP data, then axon integrity or energy availability may be contributing to CAP changes.
Axon counts support loss of small- and medium-diameter fibers
Histopathological confirmation of small-caliber axon dropout was obtained by quantifying myelinated axon area across plastic embedded ON cross-sections taken 100–300 μm distal to the optic nerve head. Figure 3D shows a histogram of axon area distribution, comparing ONs with low and high IOP from 5 to 8 months of age. The percentage of total axons with cross-sectional area between 0.4 and 0.8 μm2 decreased in the ONs from mice with high IOP (Fig. 3D). These areas correspond to axons with diameters between 0.36 and 0.56 μm, meeting the criteria of small and medium fibers in ONs (Honjin et al., 1977).
IOP exposure accentuates OGD-induced axon injury in young ONs
To identify metabolic challenges imposed by glaucomatous changes in the optic nerve, we investigated the extent of functional recovery in axons damaged in response to oxygen (60 min) or OGD (for 45 or 60 min). The ability of axons to use glucose to maintain their function in the absence of oxygen only (anoxia) was identical in ONs from low and high IOP at young ages (data not shown). In contrast, the effects of OGD on axon excitability in ONs obtained from young and old DBA/2J mice with low or high IOP changed significantly. Under normoxic conditions, axon function (quantified as the area under the CAP evoked by supramaximal stimulation) remained stable over many hours at 37°C in all groups. After 1 h of displaying stable control CAPs, OGD was imposed and resulted in a progressive loss of the CAP area. The extent of irreversible injury detected after exposure to OGD varied as a function of OGD duration, age, and IOP levels (Fig. 4C–F). For example, after 45 min of OGD in young ONs, the CAP area recovered to 42.6 ± 4.3% (n = 7) in control, whereas the CAP area recovered significantly less in low IOP (16.05 ± 3.5%, n = 4, p < 0.01, one-way ANOVA) and high IOP (22.1 ± 6.3%, n = 4, p < 0.05, one-way ANOVA) ONs. Similarly, the extent of irreversible axon injury after 60 min OGD was also highly dependent on IOP levels in young ONs (Fig. 4A,E). The CAP area recovery in young low IOP and high IOP (Fig. 4E) groups was progressively reduced compared with control ONs (35. 6 ± 1.6%, n = 7 for control, 16. 9 ± 3.1%, n = 14 for low IOP, one-way ANOVA, p < 0.001; and 9.5 ± 2.2%, n = 6 for high IOP, one-way ANOVA, p < 0.001). These data suggest that IOP exposure exacerbated OGD-induced axon injury in young ONs. In agreement with this, a scatter plot of the CAP area recovery after 60 min OGD in young ONs showed that IOP reasonably predicted CAP recovery in young DBA/2J mice with high IOP (r2 = 0.63) (Fig. 5) but not for DBA/2J mice with low IOP (data not shown). Mice with the highest IOP showed the least recovery after OGD (Figs. 4E, 5).
Figure 4.

A, B, Graphs of normalized percentage CAP area (recovery) after 60 min OGD in young (A) and old (B) optic nerve (companion bar charts in E and F). CAPs are elicited for 60 min before initiation of OGD. Collapse of CAP occurs within minutes of OGD; at 120 min of recording, oxygen and glucose are returned to the bath and CAPs recorded. Control (open circles) ON shows greatest CAP recovery after OGD at young ages (A); control CAP does not recover in old age (B). A, Young ON with low IOP (open squares) has CAP recovery lower than control but higher than high IOP (filled circles). B, In old ON, mice with high IOP (filled circles) recover significantly more CAP area than low IOP (open squares). C, Percentage of CAP recovery from 45 min of OGD in young ON. With this level of OGD in young ON, there is no difference of IOP exposure to CAP recovery, but recovery for both was significantly different from control (one-way ANOVA, **p < 0.01, *p < 0.05). D, Percentage of CAP recovery from 45 min OGD in old ON. As with the young ON, there is no difference in CAP recovery between low and high IOP groups in old ON. E, Percentage of CAP recovery from 60 min of OGD in young ON. There was a significant decrease in CAP recovery with increasing IOP (one-way ANOVA, ***p < 0.0001). F, Percentage of CAP recovery from 60 min OGD in old ON. In contrast to young ON, there was better CAP recovery at high IOP in old ON, but recovery was significantly different from control for both low (one-way ANOVA, ***p < 0.001) and high (one-way ANOVA, **p < 0.01) IOP groups. See Table 2 for values and n values.
Figure 5.

Scatter plot of CAP recovery percentage by IOP (mmHg) after 60 min OGD for young mice in the high IOP group. IOP is a reliable predictor of CAP recovery (r2 = 0.63) for young DBA/2J; mice with the highest final IOP had the poorest CAP recovery overall.
IOP exposure and OGD duration contributed to axon injury in old ONs
IOP levels did not have a significant effect on the OGD-induced axon injury in old ONs during either 45 or 60 min OGD. The similar extent of the CAP area recovery in old ONs with low and high IOP compared with control after 45 min OGD suggested that IOP levels had little effect on axon function recovery at this level of OGD (Fig. 4D). After 60 min of OGD, regardless of IOP levels, axon function showed lower recovery in ONs from DBA/2J mice compared with control (Fig. 4F). The CAP area in ONs from the old control group recovered to 13.6 ± 1.1% (n = 18) of control (Table 2, Fig. 4B,F), whereas ONs from old low and old high IOP mice recovered modestly to 3.3 ± 2.4% (n = 6, one-way ANOVA, p < 0.001) and 8.7 ± 3.2% (n = 6, one-way ANOVA, p > 0.01) of control, respectively (Fig. 4B,F). In contrast with the young ONs at 60 min OGD, there was no significant difference between CAP recovery in old low and old high IOP ONs after 60 min OGD, suggesting that IOP levels did not determine the extent of recovery in old DBA/2J ONs. These results suggested that duration of OGD was the determining factor in axon function recovery in old mice.
It should be noted that the CAP area recovery remained stable after OGD among young ONs with low or high IOP, without any significant change over 6 h of recording in each age group (Fig. 4A). Curiously, in the old group with low or high IOP, axon function showed a delayed loss of excitability that became prominent 90 min after the end of OGD (Fig. 4B).
Optic nerve ATP levels decrease with high IOP and age
The Na+/K+ ATPase maintains the ionic gradients that enable action potential conduction, consuming nearly half of the available ATP in the axon (Erecińska and Silver, 1994). ATP levels were measured in individual optic nerves from 6- and 10-month-old mice with low and high IOP. Figure 6A shows the IOP distribution in these mice, with significant differences in IOP across the two age groups but also between low and high within each age group. ATP levels decreased significantly in ONs from mice with increased IOP. Mice with low IOP had significantly higher ATP levels when compared with high IOP in both age groups, but the effect was especially pronounced in young ONs, suggesting that some mechanism associated with aging also readily depletes ATP levels (Fig. 6B). To quantify the contribution of aging to ON ATP levels, we measured ATP levels in the two control groups. There was a decrease in ATP levels with aging in the control groups (32.7 ± 12.9%; t test, NS, p = 0.18), but it was exceeded by the decreases that resulted from high IOP as displayed in Figure 6B. There was a 73.5 ± 5.0% decrease in ATP levels in young low versus young high IOP (t test, p < 0.05) and a 49.3 ± 6.0% decrease in the old low versus old high IOP group (t test, p < 0.05). Between young and old low IOP ONs, the ATP decrease was 70 ± 6.5% (t test, p < 0.05). Between young and old high IOP ONs, the ATP decrease was 42.5 ± 6.8% (t test, p < 0.05). The magnitude of the ATP decrease with aging in the low IOP group is more than double what would have been expected attributable to aging alone (70 vs 32.7%). This may be explained by the length of time of IOP exposure (10 months) and the fact that membership in the “low” IOP group at 10 months is attributable to relative IOP measured at that age. In the high IOP group, aging is responsible for the bulk of the ATP decrease (32.7% of a 42.5% decrease) in ON, but increased IOP still contributes to the decrease.
Discussion
We tested the hypothesis that glaucoma disrupts optic nerve conduction properties as a function of IOP levels and age in this first electrophysiological characterization of the DBA/2J mice. We found that the amplitude and integral of electrical signals evoked in RGC axons decreased considerably by age 6 months as a function of increasing IOP. We observed that, at young ages, raised IOP is directly associated with increased vulnerability to metabolic challenge. Changes in physiological nerve function were accentuated with aging, leading to CAP loss in an entire population of ON fibers: small, slow conducting axons. We confirmed this loss with axon counts and implicated declining metabolic reserve by demonstrating IOP-dependent ATP decrease in ON. These data shed light on a novel potential mechanism of glaucoma pathology whereby increased IOP and declining metabolic capacity lead to axon liability, eventual dysfunction, and loss.
Axon loss from decreased CAP amplitude and area
The entire RGC axon population contributes to optic nerve function, so the CAP area provides a measure of total axon function. Variations in amplitude and the conduction velocity of axons dictate the three-peaked shape of CAPs. Despite the fact that RGC loss is minimal at 6 months in the DBA/2J model (Buckingham et al., 2008), axon electrophysiological properties were drastically altered. The prominent decrease in the CAP area at 6 months with high IOP demonstrated loss of axon function at an age when RGC somas remained intact. Axon function in this age group was characterized by decreases in the maximum CAP amplitude (P2 amplitude) (Fig. 1B) and by the beginning of P3 loss in some ONs, particularly in high IOP mice (Fig. 2B). These changes were accentuated with age, confirming additional axon loss. The onset of P3 loss at 6 months became very prominent by 10 months: CAPs from four of eight mice lost P3 with low IOP, and all mice lost P3 with high IOP. In addition to P3 in the high IOP group, P2 was lost in three of six mice. Decreases in the CAP amplitude by 6 months are the first evidence that axon dysfunction occurs upstream of axonal transport deficits. These findings demonstrated that slow conduction fibers are the first to display functional decline in glaucoma, although with age and increased IOP, medium-sized fibers also decline. Such alterations in the shape and conduction properties of CAPs are sufficient to cause interruption of visual information transfer in glaucoma.
Slow conducting fibers belong to specific RGC populations
Physiological loss of small- and medium-caliber axons means absence of visual information from subclasses of RGCs. RGC morphological analyses showed a strong correlation between soma diameter and axon diameter across RGC subtypes (Huxlin and Goodchild, 1997; Coombs et al., 2006). This, combined with highly detailed studies of rodent RGC subtypes (Huxlin and Goodchild, 1997; Combs et al., 2000; Sun et al., 2002; Badea and Nathans, 2004; Kong et al., 2005; Völgyi et al., 2009), provides insight into which RGCs undergo conduction failure with increased IOP in the DBA/2J mice. The RGCs with the smallest axons (as measured 100–300 μm closest to the soma) have been classified as clusters M1 and M11 (Coombs et al., 2006) or groups RGB2 and RGC1 (Huxlin and Goodchild, 1997). The M1 RGCs are monostratified (Coombs et al., 2006), similar to classes B2 and B4 (Sun et al., 2002) and cluster 1 (Badea and Nathans, 2004), whereas the M11 cluster is bistratified, similar to class B2 (Sun et al., 2002) and Badea and Nathans cluster 4 (Coombs et al., 2006). These cells have small somas, small proximal axons, and smaller dendritic fields compared with other RGCs. Most of these small-axon-bearing RGCs have dendritic arbors stratified in the middle (∼50%) (Badea and Nathans, 2004; Kong et al., 2005; Coombs et al., 2006; Völgyi et al., 2009) to outer (∼35%) (Sun et al., 2002) inner plexiform layer. The M1 and M11 cluster cells (Coombs et al., 2006) have axon diameters that are ∼0.65 μm, which corresponds to axon areas of ∼0.33 μm2, a size within the range of axons that decrease in DBA/2J ON with high IOP (0.25–0.8 μm2) (Fig. 3D).
Loss of P2, indicative of medium fiber conduction decline, occurred with high IOP in old ONs (Fig. 2B). This fiber caliber corresponds to the majority of RGC subtypes, limiting our ability to implicate specific cell types in these physiological changes.
In humans, evidence suggests preferential loss of large RGC axons. The optic nerve areas most susceptible to axon loss were superior and inferior central optic nerve, and, within these regions, a greater proportion of larger axons were lost (Quigley et al., 1988). A comparison of the proportion of surviving fibers in the most and least damaged nerves from laser trabeculotomy-induced glaucoma in monkey showed few large fibers in the most damaged nerves but also greater numbers of small fibers when compared with the least damaged (Quigley et al., 1987). In the perifoveal region in retina, there was no preferential RGC loss (Quigley et al., 1989). Differences in modeling may account for the disparate observations regarding axon populations lost in glaucoma, but the simplest explanation might lie in morphology versus physiology. Axons may no longer conduct action potentials yet remain in the optic nerve. For example, slow conducting fibers ceased to function before larger, faster fibers after optic nerve stimulation in cats whose IOP equaled mean arterial blood pressure (Grehn and Prost, 1983). Low perfusion pressures could halt all RGC axon conduction (Grehn and Prost, 1983). In addition, there is evidence that some RGCs are more physiologically sensitive to increased IOP (Zhou et al., 1994).
Slow conducting fiber loss suggests disease etiology
By demonstrating physiological dropout of slow conducting axons, our data argue against mechanisms of glaucoma that would predict global loss of axons. Physical infringement on axons within the ONH is one such hypothesis, predicting axon compromise across all classes of conduction. Our data show that small fibers are preferentially affected with glaucoma. As the disease progresses, medium-sized fibers are recruited by the injury process. This specificity eliminates indiscriminate pathological mechanisms. A slightly larger percentage of the smallest RGC axons reside more centrally in the ON (Honjin et al., 1977), but it is unclear whether loss of these specific axons would account for loss of P3 in the CAP. With only 1.2% of the ON unmyelinated (Honjin et al., 1977), P3 includes small, lightly myelinated fibers and unmyelinated axons. Unmyelinated fibers have higher energy requirements given the enormous levels of ATP required to sustain action potentials without saltatory conduction. Axons with high ATP requirements (Bristow et al., 2002) have many more mitochondria per unit length, but these axons would also be preferentially targeted by low ATP conditions. The unique finding of the sensitivity of small-caliber axons suggests that high metabolic demand is a key predictor of axon vulnerability to raised IOP.
IOP exposure accentuates injury in young metabolically challenged axons
Axons need a constant supply of oxygen and glucose to maintain moment-to-moment function. The rate of axon function loss is closely correlated to the depletion of energy substrates and ATP (Swanson et al., 1989; Wender et al., 2000). Furthermore, OGD mainly disrupts oligodendrocytes and axons (Tekkök et al., 2007), indicating that myelinated axon function is intimately correlated to energy status in ONs. Increased IOP exposure determined the CAP recovery after 60 min of OGD in young ONs (Fig. 4C,D), but recovery was determined primarily by age in old ONs (Fig. 4F). Despite the apparent lack of significant impact of IOP on CAP recovery, we did observe a significant effect of IOP on ATP levels in the DBA/2J ON.
Many aspects of ON function change with aging, and we measured ATP levels in ONs to determine whether IOP would have an effect on energy availability in the ON. Young and old control ONs showed that aging accounts for ∼33% of ATP level decreases. Quantification of ATP levels in young and old DBA/2J ONs showed a considerable reduction in ATP levels with increased IOP (Fig. 6). At 6 months of age in the DBA/2J, 100% of mice have at most mild axon degeneration (2% or fewer axons lost) in the ON. By 10 months of age, a minority of DBA/2J mice (∼30%) have >50% axon loss (Anderson et al., 2005; Libby et al., 2005b). An ON has ∼50,000 axons. If an aged cohort had 80% axon loss in 30% of the mice, that is an average decrease of 28% (14,000 axons) overall. With this most extreme scenario, the number of axons lost on average in the 10 month DBA/2J would not account for the observed decreases in ATP levels. Additionally, the significant differences in ATP levels between low and high IOP groups reinforces the effect that glaucomatous changes exert on ON energy availability. These data, combined with the OGD results, demonstrate that a key, early pathological feature in glaucoma is the presence of a lower bioenergetic reserve in optic nerve that correlates with their exposure to raised IOP. Both high IOP and age contributed to lower ATP in ON in a manner similar to the CAP area and the CAP amplitude findings. Besides having a significant, negative impact on axon transport, low ATP indicates fundamental problems with mitochondrial function. Mitochondrial dysfunction has been implicated in several mechanisms of neurodegeneration, including glaucoma (Tezel, 2006) and optic neuropathy (Yu Wai Man et al., 2005). These data argue for additional studies on axon physiology and bioenergetics and suggest that interceding before damage to metabolic machinery or boosting metabolic substrates in the optic nerve will likely have therapeutic value.
Footnotes
This work was supported by the American Heart Association National Scientist Development Grant (S.B.), the Glaucoma Research Foundation and The Melza M. and Frank Theodore Barr Foundation (P.J.H., D.J.C.), and National Institutes of Health Grants NS35533 and NS056031 (R.S.M.).
References
- Anderson MG, Smith RS, Hawes NL, Zabaleta A, Chang B, Wiggs JL, John SW. Mutations in genes encoding melanosomal proteins cause pigmentary glaucoma in DBA/2J mice. Nat Genet. 2002;30:81–85. doi: 10.1038/ng794. [DOI] [PubMed] [Google Scholar]
- Anderson MG, Libby RT, Gould DB, Smith RS, John SW. High-dose radiation with bone marrow transfer prevents neurodegeneration in an inherited glaucoma. Proc Natl Acad Sci U S A. 2005;102:4566–4571. doi: 10.1073/pnas.0407357102. [DOI] [PMC free article] [PubMed] [Google Scholar]
- Badea TC, Nathans J. Quantitative analysis of neuronal morphologies in the mouse retina visualized by using a genetically directed reporter. J Comp Neurol. 2004;480:331–351. doi: 10.1002/cne.20304. [DOI] [PubMed] [Google Scholar]
- Baltan S, Besancon EF, Mbow B, Ye Z, Hamner MA, Ransom BR. White matter vulnerability to ischemic injury increases with age because of enhanced excitotoxicity. J Neurosci. 2008;28:1479–1489. doi: 10.1523/JNEUROSCI.5137-07.2008. [DOI] [PMC free article] [PubMed] [Google Scholar]
- Baltan S, Inman DM, Danilov C, Morrison RS, Calkins DJ, Horner PJ. Reduced ATP levels dispose small size axons to dysfunction in DBA/2J glaucoma mice. Soc Neurosci Abstr. 2009;35:724–5. [Google Scholar]
- Blight AR. Effect of 4-aminopyridine on axonal conduction-block in chronic spinal cord injury. Brain Res Bull. 1989;22:47–52. doi: 10.1016/0361-9230(89)90126-3. [DOI] [PubMed] [Google Scholar]
- Bristow EA, Griffiths PG, Andrews RM, Johnson MA, Turnbull DM. The distribution of mitochondrial activity in relation to optic nerve structure. Arch Ophthalmol. 2002;120:791–796. doi: 10.1001/archopht.120.6.791. [DOI] [PubMed] [Google Scholar]
- Buckingham BP, Inman DM, Lambert W, Oglesby E, Calkins DJ, Steele MR, Vetter ML, Marsh-Armstrong N, Horner PJ. Progressive ganglion cell degeneration precedes neuronal loss in a mouse model of glaucoma. J Neurosci. 2008;28:2735–2744. doi: 10.1523/JNEUROSCI.4443-07.2008. [DOI] [PMC free article] [PubMed] [Google Scholar]
- Combs CK, Johnson DE, Karlo JC, Cannady SB, Landreth GE. Inflammatory mechanisms in Alzheimer's disease: inhibition of β-amyloid-stimulated proinflammatory responses and neurotoxicity by PPARγ agonists. J Neurosci. 2000;20:558–567. doi: 10.1523/JNEUROSCI.20-02-00558.2000. [DOI] [PMC free article] [PubMed] [Google Scholar]
- Coombs J, van der List D, Wang GY, Chalupa LM. Morphological properties of mouse retinal ganglion cells. Neuroscience. 2006;140:123–136. doi: 10.1016/j.neuroscience.2006.02.079. [DOI] [PubMed] [Google Scholar]
- Cummins KL, Dorfman LJ, Perkel DH. Nerve fiber conduction-velocity distributions. II. Estimation based on two compound action potentials. Electroencephalogr Clin Neurophysiol. 1979;46:647–658. doi: 10.1016/0013-4694(79)90102-0. [DOI] [PubMed] [Google Scholar]
- Erecińska M, Silver IA. Ions and energy in mammalian brain. Prog Neurobiol. 1994;43:37–71. doi: 10.1016/0301-0082(94)90015-9. [DOI] [PubMed] [Google Scholar]
- Flanagan JG. Glaucoma update: epidemiology and new approaches to medical management. Ophthalmic Physiol Opt. 1998;18:126–132. [PubMed] [Google Scholar]
- Friedman DS, Wilson MR, Liebmann JM, Fechtner RD, Weinreb RN. An evidence-based assessment of risk factors for the progression of ocular hypertension and glaucoma. Am J Ophthalmol. 2004;138:S19–S31. doi: 10.1016/j.ajo.2004.04.058. [DOI] [PubMed] [Google Scholar]
- Geddes LA. Electrodes and the measurement of bioelectric events. New York: Wiley; 1972. p. 364. [Google Scholar]
- Grehn F, Prost M. Function of retinal nerve fibers depends on perfusion pressure: neurophysiologic investigations during acute intraocular pressure elevation. Invest Ophthalmol Vis Sci. 1983;24:347–353. [PubMed] [Google Scholar]
- Grieshaber MC, Flammer J. Blood flow in glaucoma. Curr Opin Ophthalmol. 2005;16:79–83. doi: 10.1097/01.icu.0000156134.38495.0b. [DOI] [PubMed] [Google Scholar]
- Honjin R, Sakato S, Yamashita T. Electron microscopy of the mouse optic nerve: a quantitative study of the total optic nerve fibers. Arch Histol Jpn. 1977;40:321–332. doi: 10.1679/aohc1950.40.321. [DOI] [PubMed] [Google Scholar]
- Huxlin KR, Goodchild AK. Retinal ganglion cells in the albino rat: revised morphological classification. J Comp Neurol. 1997;385:309–323. [PubMed] [Google Scholar]
- Inman DM, Sappington RM, Horner PJ, Calkins DJ. Quantitative correlation of optic nerve pathology with ocular pressure and corneal thickness in the DBA/2 mouse model of glaucoma. Invest Ophthalmol Vis Sci. 2006;47:986–996. doi: 10.1167/iovs.05-0925. [DOI] [PubMed] [Google Scholar]
- Inman DM, Baltan S, Calkins DJ, Horner PJ. High IOP decreases compound action potential amplitude and leads to preferential loss of physiologically identified small caliber axons in DBA/2 optic nerve. Invest Ophthalmol Vis Sci [Abstr] 2009;50:E-6482. [Google Scholar]
- Johansson JO. Retrograde axoplasmic transport in rat optic nerve in vivo. What causes blockage at increased intraocular pressure? Exp Eye Res. 1986;43:653–660. doi: 10.1016/s0014-4835(86)80031-8. [DOI] [PubMed] [Google Scholar]
- Johansson JO. Inhibition and recovery of retrograde axoplasmic transport in rat optic nerve during and after elevated IOP in vivo. Exp Eye Res. 1988;46:223–227. doi: 10.1016/s0014-4835(88)80079-4. [DOI] [PubMed] [Google Scholar]
- John SW, Smith RS, Savinova OV, Hawes NL, Chang B, Turnbull D, Davisson M, Roderick TH, Heckenlively JR. Essential iris atrophy, pigment dispersion, and glaucoma in DBA/2J mice. Invest Ophthalmol Vis Sci. 1998;39:951–962. [PubMed] [Google Scholar]
- Khan HA. Bioluminometric assay of ATP in mouse brain: determinant factors for enhanced test sensitivity. J Biosci. 2003;28:379–382. doi: 10.1007/BF02705114. [DOI] [PubMed] [Google Scholar]
- Kong JH, Fish DR, Rockhill RL, Masland RH. Diversity of ganglion cells in the mouse retina: unsupervised morphological classification and its limits. J Comp Neurol. 2005;489:293–310. doi: 10.1002/cne.20631. [DOI] [PubMed] [Google Scholar]
- Libby RT, Li Y, Savinova OV, Barter J, Smith RS, Nickells RW, John SW. Susceptibility to neurodegeneration in a glaucoma is modified by Bax gene dosage. PLoS Genet. 2005a;1:17–26. doi: 10.1371/journal.pgen.0010004. [DOI] [PMC free article] [PubMed] [Google Scholar]
- Libby RT, Anderson MG, Pang IH, Robinson ZH, Savinova OV, Cosma IM, Snow A, Wilson LA, Smith RS, Clark AF, John SW. Inherited glaucoma in DBA/2J mice: pertinent disease features for studying the neurodegeneration. Vis Neurosci. 2005b;22:637–648. doi: 10.1017/S0952523805225130. [DOI] [PubMed] [Google Scholar]
- Nashmi R, Imamura H, Tator CH, Fehlings MG. Serial recording of somatosensory and myoelectric motor evoked potentials: role in assessing functional recovery after graded spinal cord injury in the rat. J Neurotrauma. 1997;14:151–159. doi: 10.1089/neu.1997.14.151. [DOI] [PubMed] [Google Scholar]
- Nashmi R, Jones OT, Fehlings MG. Abnormal axonal physiology is associated with altered expression and distribution of Kv1.1 and Kv1.2 K+ channels after chronic spinal cord injury. Eur J Neurosci. 2000;12:491–506. doi: 10.1046/j.1460-9568.2000.00926.x. [DOI] [PubMed] [Google Scholar]
- Quigley HA, Sanchez RM, Dunkelberger GR, L'Hernault NL, Baginski TA. Chronic glaucoma selectively damages large optic nerve fibers. Invest Ophthalmol Vis Sci. 1987;28:913–920. [PubMed] [Google Scholar]
- Quigley HA, Dunkelberger GR, Green WR. Chronic human glaucoma causing selectively greater loss of large optic nerve fibers. Ophthalmology. 1988;95:357–363. doi: 10.1016/s0161-6420(88)33176-3. [DOI] [PubMed] [Google Scholar]
- Quigley HA, Dunkelberger GR, Green WR. Retinal ganglion cell atrophy correlated with automated perimetry in human eyes with glaucoma. Am J Ophthalmol. 1989;107:453–464. doi: 10.1016/0002-9394(89)90488-1. [DOI] [PubMed] [Google Scholar]
- Quigley HA, McKinnon SJ, Zack DJ, Pease ME, Kerrigan-Baumrind LA, Kerrigan DF, Mitchell RS. Retrograde axonal transport of BDNF in retinal ganglion cells is blocked by acute IOP elevation in rats. Invest Ophthalmol Vis Sci. 2000;41:3460–3466. [PubMed] [Google Scholar]
- Ransom BR, Philbin DM., Jr Anoxia-induced extracellular ionic changes in CNS white matter: the role of glial cells. Can J Physiol Pharmacol [Suppl] 1992;70:S181–S189. doi: 10.1139/y92-261. [DOI] [PubMed] [Google Scholar]
- Resch H, Garhofer G, Fuchsjäger-Mayrl G, Hommer A, Schmetterer L. Endothelial dysfunction in glaucoma. Acta Ophthalmol. 2009;87:4–12. doi: 10.1111/j.1755-3768.2007.01167.x. [DOI] [PubMed] [Google Scholar]
- Savinova OV, Sugiyama F, Martin JE, Tomarev SI, Paigen BJ, Smith RS, John SW. Intraocular pressure in genetically distinct mice: an update and strain survey. BMC Genet. 2001;2:12. doi: 10.1186/1471-2156-2-12. [DOI] [PMC free article] [PubMed] [Google Scholar]
- Schlamp CL, Li Y, Dietz JA, Janssen KT, Nickells RW. Progressive ganglion cell loss and optic nerve degeneration in DBA/2J mice is variable and asymmetric. BMC Neurosci. 2006;7:66. doi: 10.1186/1471-2202-7-66. [DOI] [PMC free article] [PubMed] [Google Scholar]
- Siliprandi R, Bucci MG, Canella R, Carmignoto G. Flash and pattern electroretinograms during and after acute intraocular pressure elevation in cats. Invest Ophthalmol Vis Sci. 1988;29:558–565. [PubMed] [Google Scholar]
- Soto I, Oglesby E, Buckingham BP, Son JL, Roberson ED, Steele MR, Inman DM, Vetter ML, Horner PJ, Marsh-Armstrong N. Retinal ganglion cells downregulate gene expression and lose their axons with the optic nerve head in a mouse glaucoma model. J Neurosci. 2008;28:548–561. doi: 10.1523/JNEUROSCI.3714-07.2008. [DOI] [PMC free article] [PubMed] [Google Scholar]
- Stys PK, Ransom BR, Waxman SG. Compound action potential of nerve recorded by suction electrode: a theoretical and experimental analysis. Brain Res. 1991;546:18–32. doi: 10.1016/0006-8993(91)91154-s. [DOI] [PubMed] [Google Scholar]
- Sun W, Li N, He S. Large-scale morphological survey of mouse retinal ganglion cells. J Comp Neurol. 2002;451:115–126. doi: 10.1002/cne.10323. [DOI] [PubMed] [Google Scholar]
- Swanson RA, Sagar SM, Sharp FR. Regional brain glycogen stores and metabolism during complete global ischaemia. Neurol Res. 1989;11:24–28. doi: 10.1080/01616412.1989.11739856. [DOI] [PubMed] [Google Scholar]
- Tekkök SB, Ye Z, Ransom BR. Excitotoxic mechanisms of ischemic injury in myelinated white matter. J Cereb Blood Flow Metab. 2007;27:1540–1552. doi: 10.1038/sj.jcbfm.9600455. [DOI] [PubMed] [Google Scholar]
- Tezel G. Oxidative stress in glaucomatous neurodegeneration: mechanisms and consequences. Prog Retin Eye Res. 2006;25:490–513. doi: 10.1016/j.preteyeres.2006.07.003. [DOI] [PMC free article] [PubMed] [Google Scholar]
- Tokunaga T, Kashiwagi K, Tsumura T, Taguchi K, Tsukahara S. Association between nocturnal blood pressure reduction and progression of visual field defect in patients with primary open-angle glaucoma or normal-tension glaucoma. Jpn J Ophthalmol. 2004;48:380–385. doi: 10.1007/s10384-003-0071-6. [DOI] [PubMed] [Google Scholar]
- Völgyi B, Chheda S, Bloomfield SA. Tracer coupling patterns of the ganglion cell subtypes in the mouse retina. J Comp Neurol. 2009;512:664–687. doi: 10.1002/cne.21912. [DOI] [PMC free article] [PubMed] [Google Scholar]
- Wender R, Brown AM, Fern R, Swanson RA, Farrell K, Ransom BR. Astrocytic glycogen influences axon function and survival during glucose deprivation in central white matter. J Neurosci. 2000;20:6804–6810. doi: 10.1523/JNEUROSCI.20-18-06804.2000. [DOI] [PMC free article] [PubMed] [Google Scholar]
- Yu Wai Man CY, Chinnery PF, Griffiths PG. Optic neuropathies: importance of spatial distribution of mitochondria as well as function. Med Hypotheses. 2005;65:1038–1042. doi: 10.1016/j.mehy.2004.10.021. [DOI] [PubMed] [Google Scholar]
- Zhou X, Li F, Kong L, Tomita H, Li C, Cao W. Involvement of inflammation, degradation, and apoptosis in a mouse model of glaucoma. J Biol Chem. 2005;280:31240–31248. doi: 10.1074/jbc.M502641200. [DOI] [PubMed] [Google Scholar]
- Zhou Y, Wang W, Ren B, Shou T. Receptive field properties of cat retinal ganglion cells during short-term IOP elevation. Invest Ophthalmol Vis Sci. 1994;35:2758–2764. [PubMed] [Google Scholar]