

Abstract
Purpose
Variability in CT/MR cranial image registration was assessed using a benchmark case developed by the Quality Assurance Review Center (QARC) to credential institutions for participation in Children's Oncology Group Protocol ACNS0221 for treatment of pediatric low-grade glioma.
Methods and Materials
Two DICOM image sets, an MR and a CT of the same patient, were provided to each institution. A small target in the posterior occipital lobe was readily visible on two slices of the MR scan and not visible on the CT scan. Each institution registered the two scans using whatever software system and method it ordinarily uses for such a case. The target volume was then contoured on the two MR slices and the coordinates of the center of the corresponding target in the CT coordinate system were reported. The average of all submissions was used to determine the “true” center of the target.
Results
Results are reported from 51 submissions representing 45 institutions and 11 software systems. The average error in the position of the center of the target was 1.8 mm (1 S.D. = 2.2 mm). The least variation in position was in the lateral direction. Manual registration gave significantly better results than automatic registration (p=0.02).
Conclusion
When MR and CT scans of the head are registered with currently available software, there is inherent uncertainty of approximately 2 mm (1 standard deviation), which should be considered when defining PTVs and PRVs for organs at risk on registered image sets.
Keywords: image registration, image fusion, image correlation
Introduction
Imaging has become an essential and routine part of defining target volumes and critical normal structures in radiation therapy. Multiple techniques and modalities are often employed for the same patient. CT scans with and without contrast, MRI scans with different echo sequencing, and PET scans are often required to define adequately the volumes to be treated and the volumes to be avoided. Accurate target definition is increasingly important as the ability to closely conform the dose has increased with technologies such as intensity modulated radiation therapy and tomotherapy.
Modern treatment planning is usually based on a CT scan acquired with the patient immobilized in the treatment position CT scans allow accurate calculation of dose in heterogeneous material, which is not currently possible for other imaging modalities. Target volumes and organs at risk are defined on the CT planning scan so that conformal treatments may be devised. Software is often provided to allow registration and visualization of other three dimensional (3D) imaging sets, which may better show the extent of disease. The importance of image registration for accurate target definition is now widely acknowledged. (1-3)
Planning systems provide various tools for performing this registration. Typical options include matching DICOM coordinates, manual selection of the same anatomic points on both imaging sets, manual translation and rotation, and various “automatic” algorithms that look at matching similar pixel patterns and gradients.
To evaluate the accuracy of the registration, visualization tools usually include overlay of the imaging sets with variable degrees of transparency and/or split images. Assessment of the success of the registration is usually a subjective judgment by the individual performing the registration, usually a radiologist, radiation oncologist, physicist, or dosimetrist.
Several studies have attempted to assess the accuracy of image registration in a systematic way (4-11). Sarkar et al (4) compared the use of match points versus two algorithms for “automatic” registration of cranial CT and MR image sets. Veninga et al (5) assessed the accuracy of the normalized mutual information method for cranial CT/MR image registration. Dean et al (8) developed an analytical method for comparing results for CT/MR image registration from two software systems used in radiotherapy. Phantoms have been used to assess the accuracy of image registration (9-11), but phantoms lack the anatomical complexity needed for a complete test of the process.
The Children's Oncology Group (COG) has developed a protocol for the treatment of pediatric low-grade glioma (COG ACNS0221). Many of these tumors can be visualized on MRI, but not on CT. To verify that institutions could accurately perform image registration, the Quality Assurance Review Center (QARC) was asked to develop a test case. The QARC is an organization funded by the National Cancer Institute to provide quality assurance of the radiation therapy of patients treated on protocols sponsored by COG and other cooperative groups. It has developed sample cases, termed benchmarks, to credential institutions for participation in various protocols with various technologies. QARC developed an “image fusion” benchmark, which required registration of a cranial CT scan with a MRI scan, to credential institutions for participation in ACNS0221. Here we report the results from 51 submissions.
Methods and Materials
Two anonymized DICOM image sets were provided (Figure 1). The MR scan consisted of 83 slices with a uniform slice thickness of 2.0 mm. The reconstruction diameter was 250 mm, with resultant pixel size of 0.977 mm. A small lesion in the left occipital lobe was clearly visible on two of the MR slices. The CT scan was obtained with the patient in a BRW stereotactic head frame. The scan set included 62 slices with a slice thickness of 2.5 mm. The reconstruction diameter was 320 mm and pixel size was 0.625 mm. The lesion was not visible on any of the CT slices.
Figure 1.
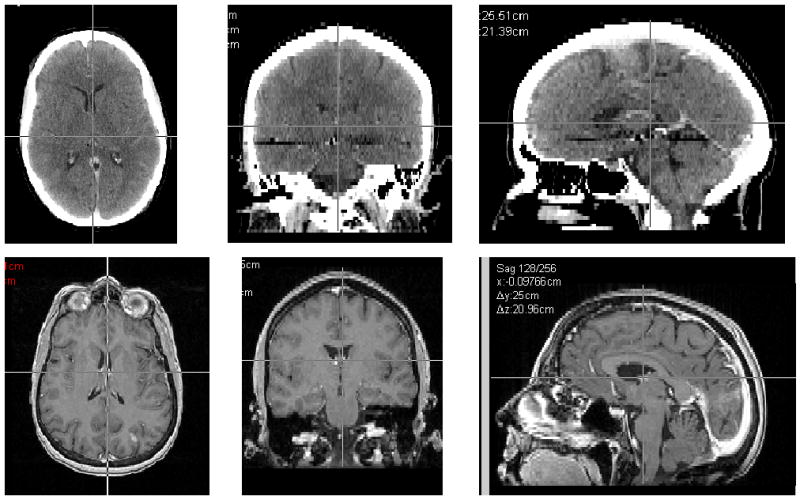
Transverse, coronal and sagittal slices of the CT and MR image sets used for the registrations.
Institutions were instructed to register these scans using whichever personnel, software and method they normally would use for such a case. The target volume was to be outlined on the two MR slices on which it was visible (Figure 2) and projected onto the CT scan. The x, y, z coordinates of the center of the target on the CT scan were reported. (Figure 3) In addition, the x, y, z coordinates of the center of rod 1 of the BRW frame on the most inferior CT slice were reported (Figure 4). This allowed us to establish a common reference point for all submissions, independent of the coordinate system used by different software applications.
Figure 2.

MRI sections on which the target volume, the contrast enhancing lesion in the posterior occipital lobe, was to be outlined.
Figure 3.

A sample registration result showing the target volume, as drawn on the MRI scan, projected onto the CT scan. The coordinates of the center of the target volume (in the CT coordinate system) were to be reported.
Figure 4.

The coordinates in the CT coordinate system of the center of the large rod on the BRW frame (indicated by the arrow) were reported to define a common reference point.
In addition to reporting the coordinates, institutions submitted split or overlaid images showing the results of the registration and any report from the software system of the results of the registration.
The position of the center of the target relative to the center of rod 1, r = (Δx, Δy, Δz), was tabulated for each case. The average position of the center was then calculated from all submissions, rav = (Δxav, Δyav, Δzav). The deviation for each submission was calculated as the modulus of the distance from the average center (|r-rav|). The standard deviation in the displacement from the average center was calculated as ((1/(N-1))Σ |r-rav|2)1/2. All results exceeding two standard deviations were then excluded from the analysis, and a new average position was calculated and defined to be the “true center.”
For the purpose of credentialing institutions for participation in ACNS0221, criteria of acceptability were needed early in the submission process. The first 17 submissions were used to establish a preliminary value for the true target center and to develop acceptability criteria for subsequent submissions. The process used for analyzing results from the first 17 submissions was identical to the process described above for analyzing the full data set.
Results
Fifty-one submissions have been received from 45 institutions. Six institutions performed the exercise using two different software systems. The systems used for the registrations are listed in Table 1, as is the type of registration reported as having been employed, e.g. “match points”, “automatic”, “manual”. For the 51 submissions, 15 were performed by dosimetrists, 35 by physicists, and 1 by the radiation oncologist.
Table 1.
Software systems and type of matching
| Software System (manufacturer) | type of matching reported | Software System (manufacturer) | type of matching reported |
|---|---|---|---|
| BrainScan | automaticmanual and automaticmatch points | Philips Pinnacle | automaticmanual and automaticmanual |
| Corvus | match points | Pinnacle/Syntegra | automaticmanual and automatic |
| Varian Eclipse | automaticmanual and automaticmatch points | Plato | match points |
| CMS Focal | automaticmanual and automatic | PLUNC | manual |
| In-house system | manual | Radionics XKnife | match points |
| Oncentra MasterPlan | automatic |
For this study the true target center on the CT scan (rav) was determined as the average position of all submissions within 2 standard deviations of the mean (48 submissions). From these 48 submissions the standard deviation of the mean (1 SD/N1/2) was calculated and was used as a measure of the uncertainty in the true target center. This was equal to 0.3 mm. The average displacement from this true target center was determined by calculating for each submission the modulus of the distance of the reported target center from the true center and averaging the deviations over all the submissions, (1/N)Σ|r-rav|. This was equal to 1.8 mm. One standard deviation in the distance of the target center from the true center, ((1/(N-1))Σ |r-rav|2)1/2, was equal to 2.2 mm. Figure 5 shows the distribution of errors for the fifty-one submissions.
Figure 5.

Distribution of errors indicating the number of submissions falling within 5 mm error bins.
To assess what error, if any, was introduced by using the first 17 submissions to establish acceptability criteria, the distance between the preliminary value of the center of the target, determined from the first 17 submissions, and the “true center,” determined from all submissions, was calculated and determined to be 0.6 mm, which is within the uncertainty (2 S.D. of the mean) in its true position.
Looking at the x, y, and z coordinates independently, there is the least variability in the lateral direction (1 standard deviation = 0.9 mm). Uncertainties in the anterior/posterior and the cephalad/caudad directions are nearly the same (1 standard deviation = 1.5 mm and 1.4 mm respectively). Figure 6 shows three scatter diagrams that indicate the distribution of results in the axial, coronal, and sagittal planes relative to the “true” center of the target.
Figure 6.

Distribution of results in the axial, coronal, and sagittal planes relative to the “true” center of the target.
The method used for registration influenced the variability of the results. Table 2 shows the average error for each of the registration methods that were used. For those using manual registration methods the average error was 1.1 mm. For automatic registration and use of match points, the average errors were 1.9 and 3.1 mm, respectively. Since manual registration appeared to give better results, the two-tailed t-test was used to assess whether or not the difference was significant. The difference between manual registration and automatic registration was significant (p=0.02) while that between manual registration and match points was not (p=0.11). The training of the personnel did not affect the accuracy of the registration; the average error in registrations performed by dosimetrists (1.7 mm) was comparable to that of physicists (1.7 mm).
Table 2.
Average error in the matching for different registration techniques, with the number of cases for each indicated.
| Registration Method | # of benchmarks | Average Error (mm) |
|---|---|---|
| manual | 11 | 1.1 |
| automatic | 27 | 1.9 |
| Manual and automatic | 8 | 1.4 |
| Match points | 5 | 3.1 |
| Overall | 51 | 1.8 |
Discussion and Conclusions
Registration of different 3D imaging sets is important in radiation therapy for definition of target volumes and critical normal tissues. Software for performing the registrations is available from multiple commercial vendors, most of whom offer several means of performing the registration. Except for DICOM coordinate matching (in which the imaging studies are performed in the identical coordinate system), regardless of system, there is always some uncertainty in the registration.
In the 51 registrations reported here, from 45 institutions and 11 planning systems, the average error in the position of the center of the target was 1.8 mm, with an uncertainty in the position of the true target center of ∼0.3 mm (one standard deviation of the mean). One standard deviation in the displacement of the target center from the “true target center” was 2.2 mm. When the three outliers were removed from the analysis, the average error in the position of the center of the target was 1.5 mm, and the standard deviation in the displacement of the target center from the “true target center” was 1.8 mm.
The pixel sizes for the CT and MR images were 0.625mm and 0.976 mm respectively; slice thicknesses were 2.5 mm for the CT and 2.0 mm for the MR. The effect of these differences on the registration accuracy is difficult to assess but are typical of clinical situations. Since the same image sets were used by all participants, that error should be considered systematic, and did not affect the variability of the registration results.
The effect of contouring variability was not accounted for. However, the target is quite small (∼ 1.0 × 0.5 × 0.5 cm) and well-defined, and the use of the center of the target as the basis for analysis should have minimized the effects of variations in contouring.
The variability in the location of the lesion on the registered CT scan was least in the lateral direction (0.9 mm SD). Variability in cephalad/caudad and AP/PA directions was greater, and comparable (1.4 mm and 1.5 mm SD respectively). This is not a surprise since the gantry pitch was significantly different in the CT and MR image sets and pitch minimally affects lateral position. It is expected that the position of the target affected the results of this study. The peripheral location of the target in this exercise made it a better test for rotational alignment than if it had been centrally located.
Most software packages offer several options for registering image sets; the most common are “match points”, “automatic”, and “manual”. “Match points” requires the user to select several of the same anatomic points on both image sets. How the registration is performed when “automatic” is selected is usually a proprietary algorithm of the vendor; specific details are available but in general these algorithms align regions of comparable pixel value gradients. “Manual” methods require the user to manipulate the visual alignment of the images using a cursor. In this study, the results indicate that manual registration may be more accurate than automatic registration. A possible explanation of this is simply that those using manual methods may have taken more care in performing the registration process.
The profession of the user also did not affect the accuracy of the results. Registrations performed by dosimetrists and physicists had comparable variability. Our belief is that the most important factor affecting the results was the care taken in performing the registration.
For the purpose of credentialing institutions for participation in ACNS0221, criteria for acceptability were required early in the submission process. The results of the first 17 submissions were used to derive a preliminary value for the “true” center of the target and a standard deviation of the displacements. It was determined that for an acceptable result, the center of the target on the CT scan had to be within 3 mm of this “true” center. Forty three of the fifty one submissions (84%) were able to achieve this accuracy on the first try. Nearly all were able to pass this credentialing test when given a second chance with suggestions for improvement if necessary. One submission has unresolved issues and was not included in this analysis.
Overall, when MR and CT scans of the head are registered with currently available software, there is inherent uncertainty. In assessing the implication of these results on the definition of margins, it is reasonable to exclude the three outliers from the analysis as such large discrepancies would likely be detected by a careful evaluation of alignment. Even when such outliers were excluded, one standard deviation of the position of the center of a small target volume was ∼1.8 mm; ∼95% of the displacements were within ∼3.6 mm of the true position. It is important to consider this uncertainty when defining PTVs and PRVs for organs at risk on registered image sets.
Acknowledgments
This work was supported by NCI-H Grant 5U10CA029511.
We acknowledge and thank T.J. FitzGerald, M.D., and Fran Laurie for the support for this project.
Footnotes
Conflicts of Interest Notification: No conflicts of interest exist.
Publisher's Disclaimer: This is a PDF file of an unedited manuscript that has been accepted for publication. As a service to our customers we are providing this early version of the manuscript. The manuscript will undergo copyediting, typesetting, and review of the resulting proof before it is published in its final citable form. Please note that during the production process errors may be discovered which could affect the content, and all legal disclaimers that apply to the journal pertain.
References
- 1.Hamm KD, Surber G, Schmucking M, et al. Stereotactic radiation treatment planning and follow-up studies involving fused multimodality imaging. J Neurosurg. 2004;101(Suppl 3):326–333. [PubMed] [Google Scholar]
- 2.Balter JM, Kessler ML. Imaging and alignment for image-guided radiation therapy. J Clin Oncol. 2007;25:931–937. doi: 10.1200/JCO.2006.09.7998. [DOI] [PubMed] [Google Scholar]
- 3.Jin JY, Ryu S, Faber K, et al. 2D/3D image fusion for accurate target localization and evaluation of a mask based stereotactic system in fractionated stereotactic radiotherapy of cranial lesions. Med Phys. 2006;33:4557–4566. doi: 10.1118/1.2392605. [DOI] [PubMed] [Google Scholar]
- 4.Sarkar A, Santiago RJ, Smith R, et al. Comparison of manual vs. automated multimodality (CT-MRI) image registration for brain tumors. Med Dosim. 2005;30:20–24. doi: 10.1016/j.meddos.2004.10.004. [DOI] [PubMed] [Google Scholar]
- 5.Veninga T, Huisman H, van der Maazen, et al. Clinical validation of the normalized mutual information method for registration of CT and MR images in radiotherapy of brain tumors. J Appl Clin Med Phys. 2004;5:66–79. doi: 10.1120/jacmp.v5i3.1959. [DOI] [PMC free article] [PubMed] [Google Scholar]
- 6.Cattaneo GM, Reni M, Rizzo G, et al. Target delineation in post-operative radiotherapy of brain gliomas: interobserver variability and impact of image registration of MR(pre-operative) images on treatment planning CT scans. Radiother Oncol. 2005;75:217–223. doi: 10.1016/j.radonc.2005.03.012. [DOI] [PubMed] [Google Scholar]
- 7.Vogel WV, Schinagl DA, Van Dalen JA, et al. Validated image fusion of dedicated PET and CT for external beam radiation therapy in the head and neck area. Q J Nucl Med Mol Imaging. 2007;51 Epub ahead of print. [PubMed] [Google Scholar]
- 8.Dean CJ, Sykes JR, Morgan AM. A methodology for comparing results from two image registration systems used in MR based radiotherapy. Clin Oncol. 2007;19:S27. [Google Scholar]
- 9.Mutic S, Dempsey JF, Bosch WR, et al. Multimodality image registration quality assurance for conformal three-dimensional treatment planning. Int J Radiat Oncol Biol Phys. 2001;51:255–260. doi: 10.1016/s0360-3016(01)01659-5. [DOI] [PubMed] [Google Scholar]
- 10.Moore CS, Liney GP, Beavis AW. Quality assurance of registration of CT and MRI data sets for treatment planning of radiotherapy for head and neck cancers. J Appl Clin Med Phys. 2004;5:25–35. doi: 10.1120/jacmp.v5i1.1951. [DOI] [PMC free article] [PubMed] [Google Scholar]
- 11.Kashani R, Hub M, Kessler ML, et al. Technical note: a physical phantom for assessment of accuracy of deformable alignment algorithms. Med Phys. 2007;34:2785–2788. doi: 10.1118/1.2739812. [DOI] [PubMed] [Google Scholar]