

Abstract
How do individuals decide to act based on a rewarding status quo versus an unexplored choice that might yield a better outcome? Recent evidence suggests individuals may strategically explore as a function of the relative uncertainty about the expected value of options. However, the neural mechanisms supporting uncertainty-driven exploration remain underspecified. The present fMRI study scanned a reinforcement learning task in which participants stop a rotating clock hand in order to win points. Reward schedules were such that expected value could increase, decrease, or remain constant with respect to time. We fit several mathematical models to subject behavior to generate trial-by-trial estimates of exploration as a function of relative uncertainty. These estimates were used to analyze our fMRI data. Results indicate that rostrolateral prefrontal cortex tracks trial-by-trial changes in relative uncertainty, and this pattern distinguished individuals who rely on relative uncertainty for their exploratory decisions versus those who do not.
Introduction
Learning to make choices in a complex world is a difficult problem. The uncertainty attending such decisions requires a trade-off between two contradictory courses of action: (i) to choose from among known options those which are believed to yield the best outcomes, or (ii) to explore new, unknown alternatives in hope of an even better result (e.g., when at your favorite restaurant, do you try the chef’s new special or your “usual” choice?). This well-known exploration-exploitation dilemma (Sutton and Barto, 1998) deeply complicates decision-making, with optimal solutions for even simple environments often being unknown or computationally intractable (Cohen et al., 2007). Abundant evidence now supports striatal dopaminergic mechanisms in learning to exploit (see Doll and Frank, 2009; Maia, 2009 for review). By contrast, considerably less is know about the neural mechanisms driving exploration (Aston-Jones and Cohen, 2005; Daw et al., 2006; Frank et al., 2009).
In the reinforcement learning literature, exploration is often modeled using stochastic choice rules. Such rules permit agents to exploit the best known actions for reward while also discovering better actions over time by periodically choosing at random or by increasing stochasticity of choice when options have similar expected values (Sutton and Barto, 1998). A more efficient strategy is to direct exploratory choices to those actions about which one is most uncertain (Dayan and Sejnowski, 1996; Gittins and Jones, 1974). Put another way, the drive to explore may vary in proportion to the differential uncertainty about the outcomes from alternative courses of action. Thus, from this perspective, the brain should track changes in relative uncertainty among options, at least in those individuals who rely on this strategy for exploratory choices.
Neurons in prefrontal cortex (PFC) may track relative uncertainty during decision making. Using fMRI, Daw et al., (2006) observed activation in rostrolateral prefrontal cortex (RLPFC; approximately Brodmann area [BA] 10/46) during a “multi-armed bandit task” when participants selected slot machines that did not have the highest expected value. Daw et al. tested whether participants guide exploration toward uncertain options, but did not find evidence for an “uncertainty bonus”. However, the reward contingencies were not stationary, and participants over-estimated the rate of change, effectively only including the last trial’s reward in their expected value estimations (i.e., they had a learning rate near 1.0). Thus, while the dynamic contingencies strongly induced uncertainty about the value of unexplored options, this manipulation may have paradoxically precluded the identification of an uncertainty bonus, because participants believed that only the previous trial was relevant.
Frank et al. (2009) recently showed evidence that quantitative trial-by-trial exploratory responses are in part driven by relative uncertainty when reinforcement contingencies are stationary over time. Moreover, substantial individual differences in uncertainty-driven exploration were observed, a large part of which were accounted for by a polymorphism in the catechol-O-methyl transferase (COMT) gene that affects PFC dopamine levels. A subsequent study with the same task found that uncertainty-driven exploration was substantially reduced in patients with schizophrenia as a function of anhedonia, also thought to be related to PFC dysfunction (Strauss et al., 2011). These findings provide a general link between relative uncertainty-based exploration and PFC function. Frank et al. (2009) further hypothesized that RLPFC, in particular, may track relative uncertainty among options.
Despite the failure to observe uncertainty-based modulation of RLPFC activity in previous gambling tasks, the hypothesis that RLPFC computes relative uncertainty is consistent with the broader human neuroimaging literature. Activation in RLPFC is greater during computations of uncertainty during goal attainment in navigation (Yoshida and Ishii, 2006) and has been shown to track relative reward probabilities for alternative courses of action (Boorman et al., 2009). More broadly, growing evidence suggests that RLPFC is at the apex of a caudal to rostral hierarchical organization in frontal cortex (Badre, 2008; Koechlin et al., 2003; Koechlin and Summerfield, 2007). In this organization, more rostral PFC regions exert control over action at more abstract levels. One conception of abstraction is that which involves tracking higher order relations (Braver and Bongiolatti, 2002; Bunge and Wendelken, 2009; Bunge et al., 2005; Christoff et al., 2001; Kroger et al., 2002; Koechlin et al., 1999).
In this respect, Bunge & Wendelken (2009) interpreted the Boorman et al. (2009) result as indicative of a more fundamental computation of the RLPFC in tracking the relative advantage of switching to alternative courses of action, rather than of reward probabilities, per se. In keeping with this suggestion, we hypothesized that, while in environments in which participants explore based on relative uncertainty, activation in RLPFC would track changes in relative uncertainty. We further posited that individual differences in uncertainty-driven exploration might be accompanied by differences in the RLPFC response to relative uncertainty.
In order to test our hypotheses, we scanned participants in fMRI while they performed a temporal utility integration task (Frank et al., 2009; Moustafa et al., 2008). In this task, participants observe a clock hand make a clockwise rotation about a clock face over a 5 sec interval (Fig. 1a). Participants press a button on a keypad to stop the rotation and win points. The probability and magnitude of rewards varied as a function of response time (RT), such that the expected value increased, decreased, or stayed constant for different levels of RT (Fig. 1c–d). For a given function, participants can learn the optimal style of responding (e.g., fast or slow) to maximize their reward.
Figure 1.

Behavioral task with plots of reward function conditions. (a) On each trial, participants stopped a rotating clock hand to win points. (b) The probability of reward as a function of RT for each expected value condition: increasing (IEV), decreasing (DEV), constant (CEV), and constant–reversed (CEVR). (c) The magnitude of reward as a function of RT across EV conditions. (d) The expected value as a function of RT for condition.
Computational model
Individual subject performance on the task was fit using a previously developed mathematical model (Frank et al., 2009) that allows trial-by-trial estimates of several key components of exploratory and exploitative choices. In this model, different mechanisms advance these contradictory drives in an attempt to maximize total reward. In what follows, we will discuss the key components of the model relevant to the current fMRI study (full model details are discussed in the Supplemental Methods). We also conducted a number of simulations using simplified and alternative models in order to assess robustness of the effect of relative uncertainty in RLPFC and its sensitivity to the specific model instantiation. These alternate models are described fully in the Results and Supplement, though we will briefly refer to them here.
Both exploitation of the RTs producing the highest rewards, and exploration for even better rewards are driven by errors of prediction in tracking expected reward value V. Specifically, the expected reward value on trial t is:
| (1) |
where α is the rate at which new outcomes are integrated into the evaluation V, and δ is the reward prediction error (RPE; Reward(t−1) − V(t−1)) conveyed by midbrain dopamine neurons (Montague et al., 1996).
A strategic exploitation component tracks the reward structure associated with distinct response classes (categorized as “fast” or “slow” respectively). This component is intended to capture how participants track the reward structure for alternative actions, allowing them to continuously adjust RTs in proportion to their relative value differences. The motivation for this modeling choice was that participants were told at the outset that sometimes it will be better to respond faster and sometimes slower. Given that the reward functions are monotonic, all the learner needs to do is track the relative values of fast and slow responses and proportionately adjust RTs toward larger value. More specifically, the model assumes that participants track the probability of obtaining a better than average outcome (a positive RPE) following faster or slower responses, which are separately computed via Bayesian integration:
| (2) |
where θ represents the parameters of the probability distribution, and δ1 … δn are the prediction errors observed thus far (on trials 1 to n). Frank et al (2009) previously reported that the behavioral data were best fit with the simplifying assumption that subjects track the probability of positive RPEs, which can be accomplished by “counting phasic dopamine bursts”, rather than the specific expected reward values of the different responses. As such, θ consists of beta distributed, Beta(η,β), estimates of positive prediction errors expected for fast and slow responses (Figure 2). Parameters from alternative models in which expected reward magnitude is tracked are strongly correlated with those from this model that tracks the probability of RPE. But, model fits are superior for the RPE model, which also yields uncertainty estimates that are potentially more suitable for fMRI (see Supplement).
Figure 2.
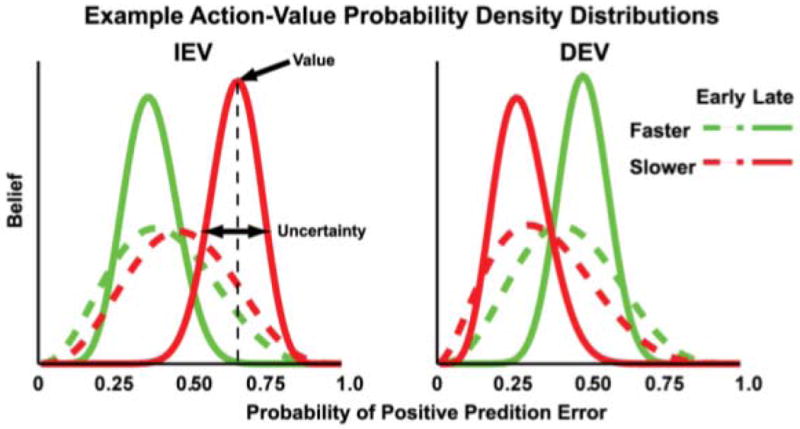
Illustration of changes in Beta distributions over the course of learning across different task conditions. The x-axis plots the probability that a particular action will yield a positive reward prediction error (RPE). Each curve plots the level of belief (y-axis) that a participant has about each probability for a given course of action, which in this task are operationalized as responding faster (green curves) or slower (red curves). The peak of each curve represents the subject’s strongest belief about the value of a particular option. Exploitative responses move in the direction of the highest perceived value. Hence, under IEV conditions (left plot) slower responses are more likely to yield a positive RPE, whereas in DEV conditions (right plot) faster responses have higher value. The standard deviation of the distribution reflects the participant’s uncertainty regarding the value of that option. Thus, early in learning (dashed line) the width is larger (and uncertainty greater) than later in learning (solid line). The difference in the standard deviations of these fast and slow distributions at any given trial is relative uncertainty.
Given the learned expected values, the difference of their means (μslow, μfast) contributes to response latency on trial t scaled by free parameter ρ:
| (3) |
It is important to clarify that though the reward statistics are tracked for different categorical actions (i.e., in terms of ‘fast’ vs ‘slow’), the predicted RTs are continuous as a function of these statistics. More specifically, RTs are predicted to continuously adjust in proportion to the difference in mean reward statistics, in that a larger difference in values for fast and slow leads to larger changes in RT.
Finally, the exploratory component of the model capitalizes on the uncertainty of the probability distributions to strategically explore those responses for which reward statistics are most uncertain. Specifically, the model assumes that subjects explore uncertain responses to reduce this uncertainty. This component is computed as:
| (4) |
where ε is a free parameter (ε ≥ 0) controlling the degree to which subjects make exploratory responses in proportion to relative uncertainty, and σslow and σfast are the standard deviations of the probability distributions tracked by the Bayesian learning rule (Figure 2).
In the primary model, we constrained ε to be greater than 0 to estimate the degree to which relative uncertainty guides exploration, and to prevent the model fits from leveraging this parameter to account for variance related to perseveration during exploitation. However, we also report a series of alternate models for which ε is unconstrained (i.e., it is also allowed to go negative to reflect “ambiguity aversion”; Payzan-LeNestour and Bossaerts, 2011).
These exploit and explore mechanisms, together with other components, afford quantitative fits of RT adjustments in this task, and the combined model is identical to that determined to provide the best fit in prior work. However, to ensure that relative uncertainty results do not depend on the use of this particular model, we also report results from several alternate models that are more transparently related to those used in the traditional reinforcement learning literature. In these models, we treat fast and slow responses categorically (as in a two-armed bandit task), and predict their probability of occurrence with a standard softmax choice function, with parameters optimized by maximum likelihood (as opposed to the standard model which minimizes squared error between predicted and actual RT). We consider models in which reward structure of these categorical responses is acquired via either Bayesian integration or reinforcement learning (Q-learning).
To summarize, then, model fits provide subject-specific, trial-by-trial estimates of reward prediction error (δ+, δ−), the mean expected values about the likelihood of a positive prediction error for fast and slow responses (μslow, μfast), and the uncertainties about these estimates (σslow, σfast). The model also provides estimates of individual participant’s reliance on relative uncertainty to explore (ε). We used these estimates to analyze our fMRI data and provide an explicit test of the hypothesis that RLPFC tracks relative uncertainty to strategically guide exploration (see Supplemental Analysis and Supp. Fig. 1 for the analysis of reward prediction error).
Results
Behavioral Results and Model Performance
Across conditions (Fig. 1), participants reliably adjusted RTs in the direction indicative of learning (Fig. 3a). RTs in the decreasing expected value (DEV) condition were significantly faster than in constant expected value (CEV; F(1,14) = 13.95, p < 0.005). RTs in the increasing expected value (IEV) condition were significantly slower than in CEV (F(1,14) = 5.6, p < 0.05) during the second half of each learning block. Within each condition, participants reliably sped up from the first to second half of trials in DEV (F(1,14) = 8.2, p < .05) and slowed down in IEV (F(1,14) = 5.1, p < .05). There were no reliable differences in RT from first to second half of trials in CEV or constant expected value–reversed conditions (CEVR; ps > 0.5).
Figure 3.

Plots of behavioral results and model fits to individual participant behavior. (a) Average RT across participants demonstrates that incremental adjustments in RT were consistent with learning. (b) Average of individual subject model fits captured incremental adjustments in RT across learning conditions. (c) A plot from one representative participant illustrates that changes in the Explore term (blue) partially captures trial-to-trial swings in RT (green). (d) Correlation between RT swings and relative uncertainty among explorers (left) and non-explorers. All trials in all participants are plotted in aggregate with color distinguishing individuals. The correlation between RT swings and relative uncertainty was significantly different from zero in explorers (mean r=0.36, p < 0.0001), but not in non-explorers (mean r = −0.02, p>0.5).
These incremental RT adaptations over the course of learning were well captured by the mathematical model (Fig. 3b). As in prior studies, these adaptations were observed in the average learning curve within and across individuals. In contrast, trial-by-trial changes in RT were not incremental but were characterized by large “RT swings” (Frank et al, 2009). The model captured some of the variance in these swings by assuming that they reflect exploratory RT adjustments in the direction of greater uncertainty about the reward statistics (Fig. 3c). Across subjects, the r-values reflecting the correlation between the direction of RT swing from one trial to the next and the model’s estimate of relative uncertainty were reliably greater than zero (t = 3.9; p < .05). The improvement in model fit by including the uncertainty-driven exploration component (and penalizing for the added model complexity; see Supplemental Materials) was correlated with the estimated ε parameter (r = 0.68, p = .005; this result held even when allowing ε to reach negative values, see below). Thus, individual differences in uncertainty-driven exploration were captured both by improvement in model fit and by the estimated ε parameter. Indeed, out of 15 participants, 8 of them had ε parameters greater than 0 (here-after, “explorers”). This fitted positive ε parameter captured the tendency for explorers’ RT swings to adjust in the direction of greater uncertainty. Indeed, the correlation between RT swings and relative uncertainty was significantly different from zero in explorers (mean r=0.36, p < 0.0001), but not in non-explorers (mean r = −0.02, p>0.5; Fig. 3d).
To further test whether the fitted ε parameter largely accounts for RT swings (rather than some overall tendency to direct RTs toward more or less certain actions), we constructed another model in which we explicitly modeled changes in RT (RT(t) − RT(t−1)) rather than overall RT, with ε unconstrained (i.e. ε could be positive or negative). In this analysis, the fitted ε correlated with that from the standard model (Spearman rho=.55, p=.03) and was significantly greater than zero (p<.0001). Notably, the improvement in model fit by including ε (as assessed by Aikake’s Information Criterion; AIC) was strongly correlated with the fitted ε value, such that individuals fit by larger (more positive) ε values were characterized by greater improvements in fit (r = 0.88, p<.0001). Comparing the original explorers vs. non-explorers, improvement in model fit to RT swings was significantly greater in explorers (mean ΔAIC =26, non-explorers mean ΔAIC =13; t[13] = −2.2, p =.046). Other alternative models, in which ε was unconstrained, fit to overall RT (reported below in conjunction with fMRI analysis; Supp. Table 1) led to similar results, showing that including the uncertainty-driven exploration term yielded robustly better fits to the data in explorers but not non-explorers.
Thus, having identified individual differences in exploration based on participants’ behavior, we sought to determine the neural correlates of relative uncertainty and whether these differ between explorers and non-explorers.
Relative uncertainty and Right Rostrolateral PFC
In the model, the standard deviations of the beta distributions for each response provide trial-by-trial estimates of uncertainty about the likelihood of obtaining a better outcome than average for each response option. Relative uncertainty – the difference in standard deviation of the beta distributions for slow and fast responses (|σslow − σfast|) – is hypothesized to drive exploratory responding (Fig. 4a).
Figure 4.

Whole brain analysis of trial-to-trial changes in relative uncertainty. (a) Example individual subject relative uncertainty regressor from one run of one participant. Convolution of parametric changes in relative uncertainty (|σslow(t) − σfast(t)|) on each trial (top plot) with a canonical hemodynamic response function (middle plot) produced individual participant relative uncertainty regressors (bottom plot). (b) The effect of relative uncertainty, controlling for mean uncertainty and restricted to explore participants (ε > 0), revealed activation in dorsal and ventral RLPFC regions (rendered at p < .05 FWE corrected [cluster level]). (c) Contrast of relative uncertainty effect, controlling for mean uncertainty, in explore (ε > 0) versus non-explore (ε = 0) participants revealed a group difference in RLPFC (rendered at p < .05 FWE corrected [cluster level]).
We initially assessed relative uncertainty as a parametric function associated with stimulus onset (Fig. 4a). This analysis yielded activation in RLPFC (XYZ = 36 56 −8; p < .001 [FWE cluster corrected]), along with a wide network of other neocortical regions (see Supp. Table 2), in association with relative uncertainty. Importantly, based on prior work (e.g., Frank et al., 2009), individual participants may rely to different degrees on relative uncertainty to make exploratory responses. Consistent with this observation, when the whole brain voxel-wise analysis of relative uncertainty was restricted to the “explorer” participants (ε > 0), reliable activation was evident in right RLPFC both in a ventral RLPFC cluster (XYZ = 40 60 −10; 30 52 −14; p < .001 [FWE cluster level]) and in a more dorsal RLPFC cluster (XYZ = 24 48 20; 30 52 16; 18 40 22; p < .001 [FWE cluster level]), along with a set of occipital and parietal regions (see Supp. Table 2). By contrast, the analysis of relative uncertainty in the non-explore group (ε = 0) did not locate reliable activation in right RLPFC. This group difference in RLPFC was confirmed in a direct group contrast, locating reliably greater activation for explore than non-explore participants in dorsal RLPFC (XYZ = 24 46 20; p < .005 [FWE cluster level]).
It is conceivable that effects of relative uncertainty in RLPFC are confounded by shared variance due to mean uncertainty. There are a number of ways that relative and mean uncertainty might share variance. For example, both mean and relative uncertainty can decline monotonically during the course of a block (i.e., to the extent that the participant samples reward outcomes from both fast and slow responses). Thus, to estimate relative uncertainty independent of its shared variance with mean uncertainty, we conducted a second whole brain analysis in which the parametric regressor for mean uncertainty (see below) was entered prior to that for relative uncertainty, and therefore any relative uncertainty effects are over and above the effects of mean uncertainty (this model was used for all subsequent relative uncertainty analyses). From this analysis, the voxel-wise analysis of the unique effects of relative uncertainty in “explorer” participants (ε > 0) again yielded reliable activation in right RLPFC (Fig. 4b) in ventral (XYZ = 30 52 −14; 36 56 −10; p < .001 [FWE cluster level]) and dorsal RLPFC (XYZ = 22 56 26; 26 52 16; 44 42 28; p < .001 [FWE cluster level]; Supp. Table 2). Changes in relative uncertainty in explore subjects also correlated with activation in the superior parietal lobule (SPL; −8 −62 66; −16 −70 62; −24 −68 68; p < .001 [FWE cluster level]). The non-explore group (ε = 0) did not locate reliable activation in right RLPFC, and again, uncertainty-related activation was greater for explore than non-explore participants in dorsal RLPFC (XYZ = 22 54 28; 28 48 14; 22 46 20; p < .005 [FWE cluster level]; Fig. 4c). A follow up demonstrated these effects even when analysis was restricted to only the first half of trials within a block, thereby ruling out confounds related to fatigue or other factors that could affect responding once learning has occurred (see Supplement).
ROI analysis, using an RLPFC ROI defined from a neutral task effects contrast in the full group (XYZ = 27 50 28; Fig. 5c), confirmed the results of the whole brain analysis. Specifically, the effect of relative uncertainty in right RLPFC was reliable for the explore participants (t(7)= 4.5, p < .005) but not the non-explore participants (t(6) = 1.2), and the direct comparison between groups was significant (t(13) > 4.4, p < .005). Further ROI analysis also demonstrated these effects using ROIs in RLPFC defined based on coordinates from prior studies of exploration (i.e., Daw et al., 2006 and Boorman et al., 2009; see Supplement).
Figure 5.

Whole brain and ROI analysis of mean and relative uncertainty. (a) Example individual subject mean uncertainty regressor from one run of one participant. Convolution of parametric changes in mean uncertainty ([σslow(t)+σfast(t)]/2) on each trial (top plot) with a canonical hemodynamic response function (middle plot) produced individual participant mean uncertainty regressors (bottom plot). (b) Mean uncertainty in the whole group, controlling for relative uncertainty, yielded activation in a large neocortical network including right DLPFC (rendered at p < .05 FWE corrected [cluster level]). (c) ROI analysis based on extracted beta estimates of relative uncertainty confirmed a group difference in relative uncertainty within RLPFC and showed a greater effect of relative uncertainty in RLPFC than DLPFC in explorers (* p < .05). (d) ROI analysis based on extracted beta estimates of mean uncertainty found no differences in mean uncertainty between groups.
Relative uncertainty in alternative models
The primary model of learning and decision making in this task was drawn directly from prior work (Frank et al., 2009) to permit consistency and comparability between studies. However, we next sought to establish that the effects of relative uncertainty observed in RLPFC were not wholly dependent on specific choices made in constructing the computational model itself. Thus, we constructed three alternative models that relied on the same relative uncertainty computation as the primary model, but differed in other details of their implementation that may affect which specific subjects are identified as explorers (see Supplement for modeling details).
First, we eased the constraint that ε be greater than or equal to 0. In the primary model, we added this constraint so that model fits could not leverage this parameter to account for variance related to perseveration, particularly on exploit trials. However, in certain task contexts some individuals may consistently avoid uncertain choices (i.e., uncertainty aversion; Payzan-LeNestour & Bossaerts, 2011; Strauss et al, 2011). It follows, then, that these individuals might track uncertainty in order to avoid it, perhaps reflected by a negative ε parameter. Alternatively, ε may attain negative values if participants simply exploit on the majority of trials, such that the exploitative option is selected most often and hence has the most certain reward statistics (assuming that value-based exploitation is not perfectly captured by the model). Thus a negative ε need not necessarily imply uncertainty aversion, and it could be that the smaller proportion of exploratory trials is still guided toward uncertainty. Thus, we conducted three simulations in which ε was unconstrained (see also earlier model of RT swings).
In an initial simulation, we categorized responses as exploratory or not, where exploration is defined by selecting responses with lower expected value (Sutton & Barto, 1998; Daw et al 2006). While we fit the remaining model parameters across all trials, we fixed ε=0 on all exploitation trials, and allowed it to vary only in trials defined as exploratory. The goal of this procedure was to determine whether exploratory trials were more often driven toward the most uncertain option, and to prevent the fitting procedure from penalizing the model fit in all of the exploitation trials in which the more certain action is generally selected.
In this analysis, seven participants (including six of the explorers identified by the primary model) were best fit with positive ε, and the remaining eight were fit with negative ε. Analysis of relative uncertainty in the explore subjects identified from this model yielded reliable effects in ventral RLPFC (XYZ = 30 56 −12; p < .05 [FWE cluster level]) and IPS (XYZ = 36 −46 56; p < .005 [FWE cluster level]). Participants with negative ε from this model did not yield positive or negative correlations of relative uncertainty with activation in RLPFC.
Another reason ε could attain negative values is due to participants’ tendencies to repeatedly select the same option as previous trials (independent from their values; Lau and Glimcher, 2005; Schonberg et al., 2007), where again this repeated option would have greater certainty. To factor out this perseveration or “sticky choice” component, we allowed not just the immediately preceding trial’s RT to influence the current trial, but to allow multiple previous trials to do so with exponential decay. This analysis allowed ε to be estimated as positive or negative across all trials. Here, six of the original eight explorers were best fit with positive ε, and the remaining participants had negative ε.
This model with unconstrained ε and sticky choice provided a reliably better fit than the model without either sticky choice or uncertainty, even penalizing for the additional model complexity (improvement in ΔAIC = 31.0 [9.2]), or compared to a model that does include sticky choice but no uncertainty (ΔAIC = 3.3 [1.8]). Furthermore, as in the RT swing model, the fitted ε parameter value correlated with this improvement in fit (r = 0.51, p = .05; and r = 0.53, p = .04 for the two model comparisons), suggesting that more positive uncertainty-driven exploration parameters are contributing to better fits rather than the negative ones. Analysis of the fMRI data restricted to the 6 subjects estimated to be explorers by this model still yielded reliable relative uncertainty effects in dorsal RLPFC (XYZ = 26 52 16; p < .001 [FWE cluster level]) along with SPL (XYZ = −6 −60 60; p < .001 [FWE cluster level]; Supp. Table 2). Participants estimated to have a negative ε again did not show positive or negative correlations of relative uncertainty with activation in RLPFC.
Finally, we constructed a model that fit categorical rather than continuous RT distributions. As already noted, a feature of the primary model is that it predicts continuous RT distributions consistent with the continuous nature of RT in this task. However, reward statistics are tracked based on two modes of responding, fast or slow. So, in a final set of simulations, we matched the response choice function to reward learning and only attempted to predict categorical action selection between fast and slow responses as if it were a two-armed bandit task, rather than predicting a continuous RT distribution (maximizing the likelihood of fast or slow responses). The core of this model is a softmax logistic function which only included: a parameter that estimates any overall bias to respond fast or slow, an (unconstrained) ε parameter for uncertainty bonus, a softmax gain parameter, and an estimate of the value of the two actions. The latter was simulated either as the mean of the beta distribution or a Q-value learned via reinforcement learning (RL) with an estimated learning rate. This categorical model identified a group of 8 explore participants (ε > 0) that largely overlapped with the primary model (two of 15 participants differed in assignment). Notably, the relative uncertainty effect in the 8 explore participants from this categorical model yielded activation in dorsal RLPFC (XYZ = 24 50 18; 34 52 16; 44 42 28; p < .001 [FWE cluster level]), ventral RLPFC (XYZ = 36 56 −10; p < .005 [FWE cluster level]), and SPL (XYZ = −8 −64 66; p < .001 [FWE cluster level]; Supp. Table 2). Again, there were no positive or negative correlations with relative uncertainty in RLPFC in the participants with negative ε.
Thus, the effects of relative uncertainty in RLPFC were robust to these variations of the model. Moreover, in these models without a positive ε constraint, we did not find evidence that RLPFC tracks relative uncertainty in support of uncertainty aversion (i.e., participants with negative ε). However, this leaves open how to interpret negative epsilon in the non-explore participants. As noted above, one possibility is that participants tend to repeatedly select the same option independent from their values. When controlling for sticky choice in the categorical model, the majority of participants were best characterized by positive ε (11 or 13 out of 15 participants for beta or Q learning variants respectively). A likelihood ratio test confirmed that including an uncertainty exploration bonus provided a significantly better fit (and including penalization of extra parameters) across the group of explorers (defined from those in the standard model; p < .00001), but only marginally so in non-explorers (p = .053; the test was significant across the whole group, p <.00001). In the Q version, the likelihood ratio test was again significant in the explorers, p = .00002, but not in the non-explorers (p=0.15; thus the slightly positive ε values did not contribute to model fit). This test was again significant across the entire group (p = .00005). As in prior models, the fitted ε parameter correlated with improvement in likelihood relative to a model without uncertainty driven exploration (r=0.71, p = .003). Thus in these simplified models predicting categorical choice, only explorers showed a robust improvement in fit by incorporating relative uncertainty into the model, and a fit of negative epsilon seems largely explained by the tendency to perseverate independently of value. This result also implies that the earlier findings are not solely due to a directional change in RT due to uncertainty (e.g. from a slow response to a slightly faster but still slow response), but are sufficient to induce a categorical shift.
Mean Uncertainty and right DLPFC
Relative uncertainty comparisons may require separately maintaining and updating working memory with the reward statistics for each option (including their variance). In light of the putative rostro-caudal organization of frontal cortex (Badre, 2008), we hypothesized that uncertainty about each option might be maintained by DLPFC regions caudal to RLPFC that do not necessarily track changes in relative uncertainty.
Results from the analysis of mean uncertainty were broadly consistent with this hypothesis. As a metric of the overall level of uncertainty associated with all options in the task, we computed a mean uncertainty regressor as the trial-by-trial average of σslow and σfast (Fig. 5a). As with relative uncertainty, we tested mean uncertainty in a model that entered relative uncertainty first, thereby permitting estimation of the effects of mean uncertainty over and above that shared with relative uncertainty. Mean uncertainty was associated with a widely distributed fronto-parietal network (Fig. 5b) that included right DLPFC (XYZ = 38 30 34; 30 26 20; 46 14 28; p < .001 [FWE cluster level]). In addition, this whole brain voxel-wise contrast revealed activation p < .001 [FWE cluster level] in regions of supplementary motor area (XYZ = 8 12 62), right dorsal premotor cortex (XYZ = 56 16 38), and a large bilateral cluster encompassing occipital and posterior parietal cortex. ROI analysis using neutrally defined ROIs in both right DLPFC (XYZ = 40 30 34) and the right RLPFC confirmed the effects of the whole brain analysis, locating significant effects of mean uncertainty in both regions (DLPFC: t(14) = 5.6, p < .0001; RLPFC: t(14) = 3.1, p < .01; Fig. 5d).
Unlike relative uncertainty, the effect of mean uncertainty did not differ as a function of individual differences in exploration (explore versus non-explore). Rather, ROI analysis confirmed that there were no group differences in mean uncertainty in DLPFC (t = .5) or in RLPFC (t = .14). Unlike relative uncertainty – which was greater in RLPFC than DLPFC (t = 2.1, p < .05) in the explorers and not in the non-explorers (t = 1.9; Group × Region: F(1,13) = 9.2, p < .01; Fig. 5c) – mean uncertainty did not differ reliably between groups or regions (Fig. 5d). This result suggests that the distinguishing trait of explore participants depends on computing the relative difference in uncertainties between options (supported by RLPFC more than DLPFC), an indicator of the potential value of information gained by exploring, rather than simply representing uncertainty or reward statistics.
Discussion
When deciding among different actions, we are often faced with tension between exploiting options that have previously yielded good outcomes and exploring new options that might be even better. One means of strategic exploration is to choose new options in proportion to their degree of uncertainty relative to the status quo. This strategy requires tracking not only the expected values of candidate options, but also the relative uncertainties about them. In the present study, we used subject-specific, trial-by-trial estimates of relative uncertainty derived from a computational model to show that RLPFC tracks relative uncertainty in those individuals who rely on this metric to explore. This result was robust across multiple variants of the model’s structure.
In models of reinforcement learning, the predominant approach to exploration is to stochastically sample choices that do not have the highest expected value (e.g., Boltzmann “softmax” choice function; Sutton and Barto, 1998). This stochasticity is flexible: it increases when expected values of available options are similar, thereby increasing exploration. Moreover, the degree of stochasticity (the temperature of the softmax function) is thought to be under dynamic neuromodulatory control by cortical norepinephrine, perhaps as a function of reinforcement history (Cohen et al., 2007; Frank et al., 2007). On the other hand, such regulatory mechanisms are only moderately strategic in that by effectively increasing noise, they are insensitive to the amount of information that could be gained by exploring one alternative action over another (indeed, a stochastic choice mechanism is equally likely to sample the exploited option). A more strategic approach is to direct exploration toward those options having the most uncertain reinforcement contingencies relative to the exploited option, so exploration optimizes the information gained.
Whether the brain supports such directed, uncertainty-driven exploration has been understudied. Though prior fMRI studies have associated RLPFC with exploratory decision making (Daw et al., 2006), these data were suggestive of a more stochastic (undirected) approach to exploration, with no evidence for an uncertainty bonus. However, as already noted, this may have been due to participants’ belief that contingencies were rapidly changing. In contrast, when contingencies were stationary within blocks of trials, Frank et al (2009) reported evidence for an influence of uncertainty on exploratory response adjustments, and that individual differences in uncertainty-driven exploration were predicted by genetic variants affecting PFC function. However, though consistent with our hypothesis, these data did not demonstrate that the PFC tracks relative uncertainty during exploratory decisions. The present results fill this important gap and show that quantitative trial-by-trial estimates of relative uncertainty are correlated with signal change in RLPFC.
Individual Differences in Relative Uncertainty
Notably, the relative uncertainty effect in RLPFC was strongest in those participants who were estimated to rely on relative uncertainty to drive exploration. This group difference was evident despite the fact that changes in relative uncertainty in each participant were independent of the model’s estimate of that participant’s ε. This finding suggests not only that RLPFC must track relative uncertainty for it to have an influence on behavior, but also that this signal is not tracked obligatorily by the brain in all individuals. Thus, a key question raised by the present result is why RLPFC apparently tracks relative uncertainty in some individuals and not others?
One possibility is that this difference reflects strategy, whether implicit or explicit. Some individuals may have previously acquired the strategy that computing relative uncertainty is adaptive for information gain in similar types of decision making situations. Thus, these individuals tend to track relative uncertainty and so RLPFC is recruited for this function. However, from this perspective, nothing precludes “non-explorers” from tracking relative uncertainty in RLPFC were they to also employ this strategy. Indeed, there was no indication that these participants were less likely to track the mean uncertainty in the DLPFC or RLPFC, putatively reflecting the computation of reward statistics. Hence, strategy training may be sufficient to induce them to consider the relative differences between the actions, as well.
Alternatively, a more basic difference in PFC function or capacity might underlie the individual differences in RLPFC relative uncertainty effects. For example, prior work has shown that non-explorers were found to be more likely to carry val alleles of a COMT gene polymorphism, which is associated with reduced prefrontal dopamine function (Frank et al., 2009). As the participants with low ε parameters in the present study were those who did not track relative uncertainty in RLPFC, this raises the intriguing possibility that the present findings reflect a phenotypic difference related to prefrontal catecholamine function. We verified that when fitting the models described here with unconstrained ε to the 2009 genetic sample, we replicated the significant gene-dose association reported there; notably the ‘val/val’ subjects were categorized as non-explorers (on average negative ε) whereas the ‘met/met’ subjects continued to have positive ε, with their RT swings correlated with relative uncertainty. The breakdown of val/val and met/met individuals in the population is roughly evenly distributed, as were the explorers and non-explorers reported here. However, genetic data were not collected in the current sample, and so future genetic imaging experiments with larger samples than those used here will be required to resolve this question.
Importantly, the failure to locate a relative uncertainty effect in the non-explore group (ε = 0) should not be taken as conclusive evidence that relative uncertainty is only tracked in those participants who explore. For example, it is possible that the assumptions of our model were better suited to capture behavioral strategies of the explorers, and that non-explorers track other metrics of relative uncertainty. However, model fits in Frank et al (2009) showed that non-explorers were better captured by a “reverse-momentum” model in which individuals progressively adjust RTs in one direction and then reverse, as though non-discriminately sweeping the response options rather than guiding exploration based on uncertainty.
Another possibility is that non-explorers are sensitive to uncertainty but are actually averse to it, as is typical in behavioral economic studies (e.g., ambiguity aversion; Ellsberg, 1961). Indeed, even explorers may be averse to uncertainty, but explore in order to reduce this uncertainty in the long run (i.e., they are more averse to the uncertainty of the value of their policy than to that of their local response). In several model variants in which ε was allowed to attain negative values, it did so primarily in the non-explorers, but remained positive in the explorers. Nevertheless, small changes in the make-up of explorer vs non-explorer groups did not change the conclusions about RLPFC. Indeed, whereas positive ε was consistently associated with relative uncertainty effects in RLPFC across the models, negative epsilon was not. Thus, though negative ε parameters in non-explorer participants could in principle relate to ambiguity aversion, we did not find evidence that these participants track relative uncertainty to avoid it.
Another possibility is that negative ε reflects the tendency to make the same choice repeatedly regardless of reward statistics (i.e., “sticky choice”/perseveration; Lau & Glimcher, 2005; Schonberg et al, 2007). Perhaps consistent with the alternative in the present task, when controlling for sticky choice, model fits did not improve by inclusion of ε in the non-explorers, whereas fits did improve, and ε was reliably positive, in the explorers across models. (See Supplement for further discussion of relative uncertainty compared with other forms of uncertainty).
Functional anatomy of uncertainty-based exploration
The general association of RLPFC with computations of relative uncertainty is consistent with the broader literature concerning the general function of this region. RLPFC has been widely associated with higher cognitive function (Gilbert et al., 2006; Ramnani and Owen, 2004; Tsujimoto et al., 2011; Wallis, 2010), including tasks requiring computations of higher order relations (Bunge and Wendelken, 2009; Christoff et al., 2001; Kroger et al., 2002; Koechlin et al. 1999). These tasks require a comparison to be made between the results of other subgoal processes or internally maintained representations, such as in analogical reasoning (Bunge et al., 2005; Krawczyk et al., 2011; Speed, 2010), higher-order perceptual relations (Christoff et al., 2003), or same-different recognition memory decisions (Han et al., 2009).
The present task extends this general relational function to include comparisons between the widths of probability distributions built on the basis of prediction error coding. This speaks, first, to the domain generality and abstractness of the putative relational representations coded in RLPFC (Bunge and Wendelken, 2009). Second, by way of extending previous studies reporting main effect changes in RLPFC activation under conditions requiring more relational processing, the present experiment demonstrates that the relational effect in RLPFC may vary parametrically with the magnitude of the relation being computed.
A question left open by this and prior work is the exact nature of the neural coding in RLPFC. In the present experiment, we used the absolute value of the difference in relative uncertainty. Thus, though the parametric effect indicates that the degree of relative uncertainty is encoded in RLPFC neurons, it does not indicate whether this neural representation encodes the link between uncertainty and specific actions. One possibility is that relative uncertainty is coded as an absolute difference signal computed over representations maintained elsewhere. From this perspective, a large difference in uncertainty – regardless of sign – is a signal to explore. Thus, relative uncertainty acts as a contextual signal independently of what specific choice constitutes exploration at a given moment. In terms of where the action choice is made, relative uncertainty signals from RLPFC might provide a contextual signal to neurons in other regions, perhaps in caudal frontal, striatal, and/or parietal cortex, that bias selection of an option in favor of that with the larger uncertainty rather than the anticipated outcome or other factors. This more abstract conception of relative uncertainty may fit more readily with a broader view of RLPFC function in which it generally computes relations among internally maintained contextual representations of which uncertainty is only one type.
However, even if the sign of the relative uncertainty is built into the RLPFC representation, it is not necessarily the case that it must be reflected directly in peak BOLD response, as in activating when it is positive and deactivating when it is negative. Positive and negative signs could be coded by different populations of active neurons (e.g., reflecting the degree to which uncertainty is greater for either fast or slow responses), both of which would result in an increase in synaptic metabolic activity and so a concomitant BOLD increase regardless of the specific sign being coded. Thus, demonstrating that RLPFC tracks the absolute value of the relative uncertainty signal does not rule out the possibility that the sign of the choice is nevertheless coded in RLPFC. Future work, such as using pattern classification, would be required to determine whether information about the uncertain choice is encoded in RLPFC.
It should be noted that though the effects of relative uncertainty were highly consistent in terms of their locus across a number of controls and models tested here, two separate subregions of RLPFC were implicated across contrasts. A dorsal RLPFC focus consistently tracked relative uncertainty in the explore participants and in the difference between the explore and non-explore participants. A ventral focus was evident in the explore participants and also across the entire group, but did not differ reliably between groups. The more ventral focus is closer in proximity to both the region of RLPFC associated with exploration by Daw et al. (2006) and the region associated with tracking reward value of the unchosen option by Boorman et al., (2009; though, see Supplement for an analysis of branching and the expected reward of the unchosen option in the current task). We did not obtain region by effect interactions and so are not proposing that a functional distinction exists between these dorsal and ventral subdivisions. Nevertheless, activation clusters in these two subregions were clearly spatially non-contiguous and were reliable under partially overlapping contrast conditions. Thus, future work should be careful regarding the precise locus of effects in RLPFC and their consistency across conditions.
Beyond RLPFC, we also consistently located activation in SPL in association with relative uncertainty in the explore group. Though, this region was not reliably different between explorers and non-explorers, the relative uncertainty effect was found to be reliable in SPL in explorers across the alternate models tested here. Previous studies have reported activation parietal cortex along with RLPFC during tasks requiring exploration (e.g., Daw et al., 2006). However, the locus of these effects has been in the intraparietal sulcus (IPS) rather than in SPL. Effects in IPS were less consistently observed in the current study, and ROI analysis of IPS defined from previous studies failed to locate reliable relative uncertainty effects in this region (see Supplement). This comes in contrast to the effects in RLPFC, which are highly convergent in terms of neural locus. The reason for the variability in parietal cortex cannot be inferred from the present data set. However, one hypothesis is that it derives from differences in attentional demands between the different tasks. For example, SPL has been previously associated with endogenous, transient shifts of spatial and object-oriented attention (Yantis et al., 2002; Yantis and Serences, 2003), perhaps as encouraged by the clock face design, and thus, the direct relationship between exploration and identification/attention to new target locations on the clock. However, such hypotheses would need to be tested directly in subsequent experiments.
Relationship to Prior Studies on Exploration and Uncertainty
Previous studies have not found an effect of uncertainty on exploration (Daw et al, 2006; Payzan-LeNestour and Bossaerts, 2011). What accounts for the different results between these studies? Of course, we report substantial individual differences, such that some participants have positive ε values across models, and it is only in these participants that RLPFC tracks relative uncertainty.
Other considerations are worth noting, however. Modeling exploration is not trivial, because it requires predicting that participants make a response that counters their general propensity to exploit the option with highest value, and therefore any model of exploration requires knowing when this will occur. Because exploited options are sampled more often, their outcome uncertainties are generally lower than those of the alternative options. Thus, when the subject exploits, they are selecting the least uncertain option, making it more difficult to estimate the positive influence of uncertainty on exploration. As noted above, this problem is exacerbated by “sticky choice” whereby participants’ choices in a given trial are often autocorrelated with those of previous trials independent of value. Finally, studies failing to report an effect of uncertainty on exploration have all used n-armed bandit tasks with dynamic reward contingencies across trials (Daw et al., 2006; Jepma et al., 2010; Payzan-LeNestour and Bossaerts, 2011), and participants responded as if only the very last trial was informative about value (Daw et al, 2006; Jepma et al., 2010). It may be more difficult to estimate uncertainty-driven exploration in this context, given that participants would be similarly uncertain about all alternative options that had not been selected in the most recent trial. In our behavioral paradigms and model fits, we have attempted to confront these issues allowing us to estimate uncertainty, its effects on exploration, and the neural correlates of this relationship.
First, it is helpful to note the ways that the current paradigm is atypical in comparison to more traditional n-armed bandit tasks. Initially, the task was not designed to study exploration, rather as a means of studying incremental learning in Parkinson’s patients and as a function of dopamine manipulation (Moustafa et al, 2008). However, in the Frank et al. (2009) large sample genetics study, it was observed that trial-by-trial RT swings appeared to occur strategically and attempts to model these swings found that they were correlated with relative uncertainty. Importantly, this is not just a recapitulation of the finding that the model fits better when relative uncertainty is incorporated (i.e., ε is non-zero); much of this improvement in fit was accounted for by directional changes in RT from one trial to the next (RT swings). This distinction is important: in principle a fitted non-zero ε could capture an overall tendency to respond to an action that is more or less certain, e.g., if a subject exploits most of the time, ε would be negative (assuming the exploitation part of the model is imperfect in capturing all exploitative choices).
Akin to the points above regarding sticky choice, this may be one reason that prior studies using bandit tasks have found negative ε in some subjects, because they attempt to predict choice on every trial assuming a factor that increases the likelihood of choosing more uncertain actions. But, a tendency to more often select a particular response would then lead to negative ε, even if subjects might, in the smaller proportion of exploratory trials, be more likely to explore uncertain actions. In contrast, the RT swing analysis permits examining the degree to which trial-to-trial variations are accounted for by the exploration term in the model as a function of relative uncertainty and fitted ε. The use of a continuous RT allows us to detect not only when RTs change toward the direction of greater uncertainty, but the degree of that change and its correlation with the degree of relative uncertainty. This analysis is consistent with our observation that explorers continued to be fit by positive ε even in the simulations based on categorical responses – meaning that when sufficiently uncertain they were more likely to shift qualitatively from a slow to a fast response or vice-versa, rather than only make small RT adjustments within a response class.
Second, as noted above, we used a task with static reward contingencies within a block, but changing contingencies between blocks, to estimate the effect of uncertainty given the history of action-outcome samples without the additional complication of participants’ perceptions and beliefs about how rapidly contingencies are changing within blocks.
Third, because it is difficult to integrate both frequency and magnitude for different RTs to compute expected value within a block, subjects cannot explicitly discover the programmed expected value functions (and hence behavior is suboptimal). Combining variation in both frequency and magnitude encourages subjects to sample the space of RTs to determine whether they might do better.
Methods
Participants
15 (8 female) right-handed adults (age 18–27, mean 20) with normal or corrected to normal vision, free of psychiatric and neurological conditions, contraindications for MRI, and medication affecting the central nervous system were recruited. Participants gave written informed consent and were compensated for participation according to guidelines established and approved by the Research Protections Office of Brown University. Participants were paid $15/hour for their time.
Logic and Design
In order to investigate explore/exploit decisions, we employed a task used previously (Frank et al., 2009; Moustafa et al., 2008) to study the influence of relative uncertainty on exploratory judgments. The task is a variant of the basic paradigm used to study exploration, in that multiple response options are available with different expected values that are known with different degrees of certainty based on previous sampling. The participant attempts to select responses that maximize their reward. Importantly, however, the present task separates learning into individual blocks within which the expected values of the different response options remain constant. As a consequence, participant’s uncertainty may be more readily estimated trial-to-trial without estimating their beliefs about how the values are changing.
Participants viewed a clock arm that made a clockwise revolution over 5 s and were instructed to stop the arm to win points by a button press response (Figure 1a). Responses stopped the clock and displayed the number of points won. Payoffs on each trial were determined by response time (RT) and the reward function of the current condition. The use of RT also provides a mechanism to detect exploratory responses in the direction of greater uncertainty, because they can involve a quantitative change in the direction expected without requiring participants to completely abandon the exploited option (e.g., in some trials the exploration component might predict a shift from fast to slower responses, and participants might indeed slow down but still select a response that is relatively fast).
As already noted, learning was divided into blocks within which the reward function was constant. However, the reward functions varied across blocks, and at the outset of each block participants were instructed that the reward function could change from the prior block. Across blocks, we used four reward functions in which the expected value (EV; probability × magnitude) increased (IEV), decreased (DEV), or remained constant (CEV, CEVR) as RT increased (Frank et al., 2009; Moustafa et al., 2008) (Figure 1b–d). Thus, in the IEV condition, reward is maximized by responding at the end of the clock rotation, while in DEV early responses produce better outcomes. In CEV, reward probability decreases and magnitude increases over time, retaining a constant EV over each trial that is nevertheless sensitive to subject preferences for reward frequency and magnitude. CEVR (i.e. CEV Reversed) is identical to CEV except probability and magnitude move in opposite directions over time.
Over the course of the experiment, participants completed 2 blocks of 50 trials for each reward function, with block order counterbalanced across participants. While not explicitly informed of the different conditions, the box around the clock changed its color at the start of each 50 trial run, signifying to the participant that the expected values had changed. Note that even though each reward function was repeated once, a different color was used for each presentation and participants were told at the beginning of a block that a new reward function was being used.
Within each block, trials were separated by jittered fixation-null events (0–8s). The duration and order of the null events were determined by optimizing the efficiency of the design matrix so as to permit estimation of event-related hemodynamic response (Dale, 1999).
There were eight runs and 50 trials within each run. Each run consisted of only one condition (e.g. CEV) so that participants could learn the reward structure. Each block was repeated twice during separate runs of the scan session to eliminate confounds arising from run to run variation (e.g. scanner drift).
Details regarding full computational model, the model fitting, and basic fMRI procedures and analysis are provided in the Supplemental Methods.
Supplementary Material
Acknowledgments
The present work was supported by a National Institute of Neurological Disease and Stroke R01 NS065046 awarded to DB and a National Institute of Mental Health R01 MH080066-01 awarded to MJF.
Footnotes
Publisher's Disclaimer: This is a PDF file of an unedited manuscript that has been accepted for publication. As a service to our customers we are providing this early version of the manuscript. The manuscript will undergo copyediting, typesetting, and review of the resulting proof before it is published in its final citable form. Please note that during the production process errors may be discovered which could affect the content, and all legal disclaimers that apply to the journal pertain.
References
- Aston-Jones G, Cohen JD. An integrative theory of locus coeruleus-norepinephrine function: adaptive gain and optimal performance. Annu Rev Neurosci. 2005;28:403–450. doi: 10.1146/annurev.neuro.28.061604.135709. [DOI] [PubMed] [Google Scholar]
- Badre D. Cognitive control, hierarchy, and the rostro-caudal organization of the frontal lobes. Trends Cogn Sci. 2008;12:193–200. doi: 10.1016/j.tics.2008.02.004. [DOI] [PubMed] [Google Scholar]
- Badre D, Frank MJ. Mechanisms of hierarchical reinforcement learning in cortico-striatal circuits 2: Evidence from fMRI. Cerebral Cortex. doi: 10.1093/cercor/bhr117. (In Press) [DOI] [PMC free article] [PubMed] [Google Scholar]
- Boorman ED, Behrens TE, Woolrich MW, Rushworth MF. How green is the grass on the other side? Frontopolar cortex and the evidence in favor of alternative courses of action. Neuron. 2009;62:733–743. doi: 10.1016/j.neuron.2009.05.014. [DOI] [PubMed] [Google Scholar]
- Braver TS, Bongiolatti SR. The role of frontopolar cortex in subgoal processing during working memory. Neuroimage. 2002;15:523–536. doi: 10.1006/nimg.2001.1019. [DOI] [PubMed] [Google Scholar]
- Bunge SA, Wendelken C. Comparing the bird in the hand with the ones in the bush. Neuron. 2009;62:609–611. doi: 10.1016/j.neuron.2009.05.020. [DOI] [PMC free article] [PubMed] [Google Scholar]
- Bunge SA, Wendelken C, Badre D, Wagner AD. Analogical reasoning and prefrontal cortex: evidence for separable retrieval and integration mechanisms. Cereb Cortex. 2005;15:239–249. doi: 10.1093/cercor/bhh126. [DOI] [PubMed] [Google Scholar]
- Christoff K, Prabhakaran V, Dorfman J, Zhao Z, Kroger JK, Holyoak KJ, Gabrieli JD. Rostrolateral prefrontal cortex involvement in relational integration during reasoning. Neuroimage. 2001;14:1136–1149. doi: 10.1006/nimg.2001.0922. [DOI] [PubMed] [Google Scholar]
- Christoff K, Ream JM, Geddes LPT, Gabrieli JDE. Evaluating self-generated information: Anterior prefrontal contributions to human cognition. Behavioral Neuroscience. 2003;117:1161–1168. doi: 10.1037/0735-7044.117.6.1161. [DOI] [PubMed] [Google Scholar]
- Cohen JD, McClure SM, Yu AJ. Should I stay or should I go? How the human brain manages the trade-off between exploitation and exploration. Philos Trans R Soc Lond B Biol Sci. 2007;362:933–942. doi: 10.1098/rstb.2007.2098. [DOI] [PMC free article] [PubMed] [Google Scholar]
- Dale AM. Optimal experimental design for event-related fMRI. Hum Brain Mapp. 1999;8:109–114. doi: 10.1002/(SICI)1097-0193(1999)8:2/3<109::AID-HBM7>3.0.CO;2-W. [DOI] [PMC free article] [PubMed] [Google Scholar]
- Daw ND, O’Doherty JP, Dayan P, Seymour B, Dolan RJ. Cortical substrates for exploratory decisions in humans. Nature. 2006;441:876–879. doi: 10.1038/nature04766. [DOI] [PMC free article] [PubMed] [Google Scholar]
- Dayan P, Sejnowski TJ. Exploration bonuses and dual control. Machine Learning. 1996;25:5–22. [Google Scholar]
- Doll BB, Frank MJ. The basal ganglia in reward and decision making: computational models and empirical studies. In: Dreher JC, Tremblay L, editors. Handbook of Reward and Decision Making. Oxford: Academic Press; 2009. pp. 399–425. [Google Scholar]
- Ellsberg D. Risk, ambiguity, and the savage axioms. Quarterly Journal of Economics. 1961;75:643–669. [Google Scholar]
- Frank MJ, Doll BB, Oas-Terpstra J, Moreno F. Prefrontal and striatal dopaminergic genes predict individual differences in exploration and exploitation. Nat Neurosci. 2009;12:1062–1068. doi: 10.1038/nn.2342. [DOI] [PMC free article] [PubMed] [Google Scholar]
- Frank MJ, Scheres A, Sherman SJ. Understanding decision-making deficits in neurological conditions: insights from models of natural action selection. Philos Trans R Soc Lond B Biol Sci. 2007;362:1641–1654. doi: 10.1098/rstb.2007.2058. [DOI] [PMC free article] [PubMed] [Google Scholar]
- Gershman SJ, Pesaran B, Daw ND. Human reinforcement learning subdivides structured action spaces by learning effector-specific values. J Neurosci. 2009;29:13524–13531. doi: 10.1523/JNEUROSCI.2469-09.2009. [DOI] [PMC free article] [PubMed] [Google Scholar]
- Gilbert SJ, Spengler S, Simons JS, Steele JD, Lawrie SM, Frith CD, Burgess PW. Functional specialization within rostral prefrontal cortex (area 10): a meta-analysis. J Cogn Neurosci. 2006;18:932–948. doi: 10.1162/jocn.2006.18.6.932. [DOI] [PubMed] [Google Scholar]
- Gittins JC, Jones DA. A dynamic allocation index for the sequential design of experiments. In: Gani J, Sarkadi K, Vincze I, editors. Progress in Statistics. Amsterdam: North Holland Publishing Company; 1974. pp. 241–266. [Google Scholar]
- Han S, Huettel SA, Dobbins IG. Rule-dependent prefrontal cortex activity across episodic and perceptual decisions: an fMRI investigation of the criterial classification account. J Cogn Neurosci. 2009;21:922–937. doi: 10.1162/jocn.2009.21060. [DOI] [PMC free article] [PubMed] [Google Scholar]
- Jepma M, Te Beek ET, Wagenmakers EJ, van Gerven JM, Nieuwenhuis S. The role of the noradrenergic system in the exploration-exploitation trade-off: a psychopharmacological study. Front Hum Neurosci. 2010;4:170. doi: 10.3389/fnhum.2010.00170. [DOI] [PMC free article] [PubMed] [Google Scholar]
- Koechlin E, Basso G, Pietrini P, Panzer S, Grafman J. The role of the anterior prefrontal cortex in human cognition. Nature. 1999;399:148–151. doi: 10.1038/20178. [DOI] [PubMed] [Google Scholar]
- Koechlin E, Ody C, Kouneiher F. The architecture of cognitive control in the human prefrontal cortex. Science. 2003;302:1181–1185. doi: 10.1126/science.1088545. [DOI] [PubMed] [Google Scholar]
- Koechlin E, Summerfield C. An information theoretical approach to prefrontal executive function. Trends Cogn Sci. 2007;11:229–235. doi: 10.1016/j.tics.2007.04.005. [DOI] [PubMed] [Google Scholar]
- Krawczyk DC, Michelle McClelland M, Donovan CM. A hierarchy for relational reasoning in the prefrontal cortex. Cortex. 2011;47:588–597. doi: 10.1016/j.cortex.2010.04.008. [DOI] [PubMed] [Google Scholar]
- Kroger JK, Sabb FW, Fales CL, Bookheimer SY, Cohen MS, Holyoak KJ. Recruitment of anterior dorsolateral prefrontal cortex in human reasoning: a parametric study of relational complexity. Cereb Cortex. 2002;12:477–485. doi: 10.1093/cercor/12.5.477. [DOI] [PubMed] [Google Scholar]
- Lau B, Glimcher PW. Dynamic response-by-response models of matching behavior in rhesus monkeys. J Exp Anal Behav. 2005;84:555–579. doi: 10.1901/jeab.2005.110-04. [DOI] [PMC free article] [PubMed] [Google Scholar]
- Maia TV. Reinforcement learning, conditioning, and the brain: Successes and challenges. Cogn Affect Behav Neurosci. 2009;9:343–364. doi: 10.3758/CABN.9.4.343. [DOI] [PubMed] [Google Scholar]
- McClure SM, Berns GS, Montague PR. Temporal prediction errors in a passive learning task activate human striatum. Neuron. 2003;38:339–346. doi: 10.1016/s0896-6273(03)00154-5. [DOI] [PubMed] [Google Scholar]
- Montague PR, Dayan P, Sejnowski TJ. A framework for mesencephalic dopamine systems based on predictive Hebbian learning. J Neurosci. 1996;16:1936–1947. doi: 10.1523/JNEUROSCI.16-05-01936.1996. [DOI] [PMC free article] [PubMed] [Google Scholar]
- Moustafa AA, Cohen MX, Sherman SJ, Frank MJ. A role for dopamine in temporal decision making and reward maximization in parkinsonism. J Neurosci. 2008;28:12294–12304. doi: 10.1523/JNEUROSCI.3116-08.2008. [DOI] [PMC free article] [PubMed] [Google Scholar]
- O’Doherty JP, Dayan P, Friston K, Critchley H, Dolan RJ. Temporal difference models and reward-related learning in the human brain. Neuron. 2003;38:329–337. doi: 10.1016/s0896-6273(03)00169-7. [DOI] [PubMed] [Google Scholar]
- Payzan-LeNestour E, Bossaerts P. Risk, unexpected uncertainty, and estimation uncertainty: Bayesian learning in unstable settings. PLoS Comput Biol. 2011;7:e1001048. doi: 10.1371/journal.pcbi.1001048. [DOI] [PMC free article] [PubMed] [Google Scholar]
- Ramnani N, Owen AM. Anterior prefrontal cortex: insights into function from anatomy and neuroimaging. Nat Rev Neurosci. 2004;5:184–194. doi: 10.1038/nrn1343. [DOI] [PubMed] [Google Scholar]
- Rutledge RB, Dean M, Caplin A, Glimcher PW. Testing the reward prediction error hypothesis with an axiomatic model. J Neurosci. 2010;30:13525–13536. doi: 10.1523/JNEUROSCI.1747-10.2010. [DOI] [PMC free article] [PubMed] [Google Scholar]
- Schonberg T, Daw ND, Joel D, O’Doherty JP. Reinforcement learning signals in the human striatum distinguish learners from nonlearners during reward-based decision making. J Neurosci. 2007;27:12860–12867. doi: 10.1523/JNEUROSCI.2496-07.2007. [DOI] [PMC free article] [PubMed] [Google Scholar]
- Speed A. Abstract relational categories, graded persistence, and prefrontal cortical representation. Cognitive Neuroscience. 2010;1:126–152. doi: 10.1080/17588921003660728. [DOI] [PubMed] [Google Scholar]
- Strauss GP, Frank MJ, Waltz JA, Kasanova Z, Herbener ES, Gold JM. Deficits in positive reinforcement learning and uncertainty-driven exploration are associated with distinct aspects of negative symptoms in schizophrenia. Biol Psychiatry. 2011;69:424–431. doi: 10.1016/j.biopsych.2010.10.015. [DOI] [PMC free article] [PubMed] [Google Scholar]
- Sutton RS, Barto AG. Reinforcement Learning: An Introduction. Cambridge, MA: MIT Press; 1998. [Google Scholar]
- Tsujimoto S, Genovesio A, Wise SP. Frontal pole cortex: encoding ends at the end of the endbrain. Trends Cogn Sci. 2011;15:169–176. doi: 10.1016/j.tics.2011.02.001. [DOI] [PubMed] [Google Scholar]
- Wallis JD. Polar exploration. Nat Neurosci. 2010;13:7–8. doi: 10.1038/nn0110-7. [DOI] [PubMed] [Google Scholar]
- Yantis S, Schwarzbach J, Serences JT, Carlson RL, Steinmetz MA, Pekar JJ, Courtney SM. Transient neural activity in human parietal cortex during spatial attention shifts. Nat Neurosci. 2002;5:995–1002. doi: 10.1038/nn921. [DOI] [PubMed] [Google Scholar]
- Yantis S, Serences JT. Cortical mechanisms of space-based and object-based attentional control. Curr Opin Neurobiol. 2003;13:187–193. doi: 10.1016/s0959-4388(03)00033-3. [DOI] [PubMed] [Google Scholar]
- Yoshida W, Ishii S. Resolution of uncertainty in prefrontal cortex. Neuron. 2006;50:781–789. doi: 10.1016/j.neuron.2006.05.006. [DOI] [PubMed] [Google Scholar]
Associated Data
This section collects any data citations, data availability statements, or supplementary materials included in this article.