

Significance
Human embryonic stem cells (hESC) exposed to the growth factor bone morphogenic protein 4 (BMP4) in the absence of FGF2 have been used to study the development of placental trophoblasts, but the soundness of this model has been challenged by others who concluded that the directional differentiation was primarily toward the mesoderm lineage rather than trophoblast. Here we identify key culture conditions necessary for BMP4 to convert hESC to an epithelium that expresses a full range of trophoblast markers, demonstrates invasive properties, and releases large quantities of placental hormones, with no evidence for mesoderm formation.
Abstract
Human ES cells (hESC) exposed to bone morphogenic protein 4 (BMP4) in the absence of FGF2 have become widely used for studying trophoblast development, but the soundness of this model has been challenged by others, who concluded that differentiation was primarily toward mesoderm rather than trophoblast. Here we confirm that hESC grown under the standard conditions on a medium conditioned by mouse embryonic fibroblasts in the presence of BMP4 and absence of FGF2 on a Matrigel substratum rapidly convert to an epithelium that is largely KRT7+ within 48 h, with minimal expression of mesoderm markers, including T (Brachyury). Instead, they begin to express a series of trophoblast markers, including HLA-G, demonstrate invasive properties that are independent of the continued presence of BMP4 in the medium, and, over time, produce extensive amounts of human chorionic gonadotropin, progesterone, placental growth factor, and placental lactogen. This process of differentiation is not dependent on conditioning of the medium by mouse embryonic fibroblasts and is accelerated in the presence of inhibitors of Activin and FGF2 signaling, which at day 2 provide colonies that are entirely KRT7+ and in which the majority of cells are transiently CDX2+. Colonies grown on two chemically defined media, including the one in which BMP4 was reported to drive mesoderm formation, also differentiate at least partially to trophoblast in response to BMP4. The experiments demonstrate that the in vitro BMP4/hESC model is valid for studying the emergence and differentiation of trophoblasts.
A popular model for examining the early commitment of cells to the trophoblast (TR) lineage is based on the initial observation of Xu et al. (1), who noted that a group of related factors in the TGF-β family, especially bone morphogenic protein 4 (BMP4), was capable of causing human ES cells (hESC) to differentiate efficiently to TRs. This differentiation occurred without extensive generation of mesoderm, endoderm, and ectoderm derivatives, as judged by microarray analysis of transcribed genes, although a low level of expression of genes characteristic of mesoderm and endoderm did occur. This model has become widely used (2–13) to study an aspect of early human development that is not easily addressed otherwise because of lack of access to human embryos. Over the course of these studies it was demonstrated that the key to obtaining differentiation primarily to TR rather than to other lineages when using BMP4 as the triggering agent was to exclude FGF2, a factor required for maintenance of hESC (14–17). When BMP4 is provided simultaneously with FGF2, the morphological transition of the cells is altered (10), and the colonies begin to form a range of mesoderm and endoderm derivatives in addition to TR (18). This effect is probably achieved by FGF2 signaling through the MEK/ERK pathway, thereby preserving NANOG expression (19, 20). This body of work suggests that optimal differentiation to TR can be achieved best by maximizing BMP4 signaling while simultaneously minimizing MEK/ERK signaling. Sudheer et al. (13), in particular, have emphasized the need to block the FGF2 pathway in order for BMP4 to direct differentiation toward syncytiotrophoblasts.
Considering the wealth of prior results, it was surprising that a recent publication (21) asserted that BMP4 drives hESC primarily to mesoderm rather than to TR and that this transition occurs whether or not FGF2 is supplemented in the medium. A characteristic feature of the differentiation program induced by BMP4 was the rapid induction of the gene encoding T (known previously as “Brachyury”) immediately before the expression of CDX2 and several mesoderm marker genes. Moreover, it was claimed that even in the complete absence of FGF2, only a minority (4–8%) of the cells in the colonies had a TR-like phenotype. It was further claimed that these cells differed in their properties from placental TR and were, in fact, “a subpopulation of mesodermal cells” (21, p. 153) that coexpressed the mesoderm markers FLK1, VCAM1, and TBX4. The colonies, as a whole, also lacked the HLA-G marker, which is considered characteristic of extravillous TR (22), and expressed only low levels of ELF5, a hallmark of mouse (23) and possibly human (24) TR stem cells. The implication was that the BMP4-induction model for TR created an artifact and could not yield valid information about “true” TR development but instead was useful for studying embryonic lineages and particularly the origin of mesoderm. The publication has raised serious questions about the soundness of the BMP4/hESC model for studying TR and the value of earlier publications that used the model, although some others have expressed reservations about this conclusion (13, 25).
There are some puzzling differences between these results and those previously published. First, in previous work, it was evident that in the presence of BMP4 and absence of FGF2 H1 hESC became progressively KRT7/KRT8-positive; the change occurred gradually from the periphery inwards over 5 d of treatment with BMP4 (10 ng/mL), although a central core of apparently undifferentiated cells usually persisted in the larger colonies. Second, relatively large areas of syncytium with strongly positive CGA/CGB/GATA2 immunostaining began to dominate the outer regions of the colonies after day 5 (10, 11). Finally, many of the cells in differentiating colonies became positive for HLA-G as judged by immunohistochemistry with a specific monoclonal antibody (26) that distinguishes HLA-G from related HLA antigens (10).
We hypothesize that contrasting results may have arisen from the manner in which the cells were cultured. Bernardo et al. (21) used a medium based on one used to generate so-called “epiblast-type” stem cells from mouse embryos (27), whereas the majority of prior investigators working with the BMP4/hESC model used the original formulation for growing hESC, which contained knockout serum replacement conditioned by mouse embryonic fibroblasts (MEFs) (1). The substratum on which the cells were grown also differed. Bernardo et al. (21) used pig-tail gelatin rather than Matrigel, which had been the choice of earlier investigators from the beginning (1); this consideration is important, because the nature of the matrix can influence the manner in which cells differentiate (28, 29).
The goals of the present paper have been (i) to demonstrate the utility of the BMP4/hESC model for studying human TR emergence and development; (ii) to optimize culture conditions for exclusive differentiation to TRs; and (iii) to determine why the results of Bernardo et al. differed so radically from those of previous studies in this system.
Results
Colony Morphologies.
H1 cells were maintained on the defined mTeSR1, a serum-free medium that contains high concentrations of FGF2 (100 ng/mL) (30), and then were subcultured onto Matrigel-coated six-well plates with MEF conditioned medium (MEF-CM) containing FGF2 (4 ng/mL) (1, 31). Under these conditions, H1 cells showed only minimal signs of overt morphological differentiation over 9 d (Fig. 1A). However, exposure to BMP4 (10 ng/mL) in the same medium but in absence of FGF2 provided the anticipated progression of differentiation noted in earlier papers, as was evident from the presence of cells with a cobblestone appearance emerging at the periphery and progressing inwards and central areas of smaller, possibly undifferentiated, cells persisting in the interior in some of the larger colonies (Fig. 1B). This phenomenon has been described earlier (1, 9–11). However, when inhibitors [A83-01 (A) and PD173074 (P)] that block the SMAD2/3 and MEK1/2 signaling pathways, respectively, were added simultaneously with BMP4 (BMP4/A/P), the ESC phenotype of the colonies was lost within 48 h. The transition to a flattened epithelium had progressed completely and quite uniformly throughout all colonies by this time point. Even so, the colonies continued to enlarge over subsequent days (Fig. 1C). On the other hand, H1 cells exposed to BMP4 and BMP4/A/P, although supported on the defined mTeSR1 medium lacking FGF2/ TGF-β, differentiated more slowly than those on the MEF-CM (Fig. S1A), so that an inner core of small, presumably less differentiated cells was clearly visible in the BMP4/A/P-treated colonies at day 2 and persisted in some colonies up to day 5. H1 cells on the chemically defined medium (CDM) but lacking the growth factors (FGF2 and Activin) required to maintain pluripotency also appeared to respond rapidly to the addition of BMP4 and BMP4/A/P (Fig. S1B Center and Right). However, the colony morphologies, even when on the basal medium designed to maintain pluripotency (Fig. S1B Left), were distinct from those observed on MEF-CM (Fig. 1A) and mTeSR1 (Fig. S1A).
Fig. 1.

Temporal changes in colony morphologies of H1 ESC in response to culture conditions. (A) Colonies cultured under standard conditions (MEF-CM) in the presence of 4 ng/mL FGF2 and in the absence of BMP4. (B) Colonies cultured under standard conditions (MEF-CM) in the presence of 10 ng/mL BMP4 and the absence of FGF2. (C) Colonies cultured under standard conditions (MEF-CM) in the presence of BMP4 and the inhibitors A83-01 and PD173074 (BMP4/A/P conditions; BAP). (C) An area of syncytium, which begins to appear around day 7 after BMP4 and BMP4/A/P treatment, is shown in the right side of the day 9 BAP panel. (Arrows delineate the boundary of the syncytium. (Scale bars: 500 μm for A–C and 200 μm in BAP day 9 Inset.)
In the BMP4-driven transition to cells with epithelium-like morphologies on the MEF-CM, there was an accompanying increase in cell size (Fig. S2 A–C). At day 5, the mean diameter of cells maintained on FGF2 was 7.0 µm; the cells were much bigger (mean diameters 14.8 and 18.3 µm, respectively) after treatment with either BMP4 or BMP4/A/P, although heterogeneity was evident, with some cells in the population having a diameter greater than 30 µm, particularly under the latter treatment (Fig. S2 A–C). The growth rate of the cells also was affected by BMP4 and BMP4/A/P treatment: Proliferation continued under both conditions but more slowly than observed in the undifferentiated control cells, which had an estimated doubling time of about 20 h (Fig. S2D). Respective population doubling times calculated over the 5 d of the experiment were 21.9 h for controls with FGF2, 23.5 h for BMP4 treatment, and 33.0 h for BMP4/A/P treatment.
Progression to Cells with a KRT7+ Phenotype.
Flow cytometric analysis showed that the H1 colonies maintained on MEF-CM with FGF2 supplement in the absence of BMP4 contained negligible numbers of cells positive for the TB marker KRT7 over 4 d (Fig. 2A). Such low expression also was evident in terms of KRT7 transcript levels, which remained very low in the control hESC (Fig. S3 A and B). In contrast, BMP4 treatment progressively led to the appearance of KRT+ cells so that by day 4 about 95% of the cells had converted to this phenotype (Fig. 2B). In the case of BMP4/A/P, more than 40% had converted within 24 h, and almost all cells were KRT7+ by 48 h (Fig. 2C). These changes were correlated with the progressive temporal rise of KRT7+ mRNA expression and the reciprocal down-regulation of NANOG in both H1 and H9 cells (Fig. S3).
Fig. 2.

Flow cytometry histograms for KRT7 expression in H1 hESC. Colonies were cultured in MEF-CM containing FGF2 (A), BMP4 (B), or BMP4/A/P (BAP) (C) for 1, 2, or 4 d. Cells were fully dispersed, fixed, and immunostained for either KRT7 or α-tubulin (TUBA) as positive control (PC). For the negative control (NC) cells were exposed only to second antibody without prior exposure to primary KRT7 and TUBA antibodies. (D) KRT7 immunostaining of H1 colonies cultured under control conditions (MEF-CM) with FGF2 (Left) and with BMP4/A/P (BAP) (Right) for 8 d. The nuclei were counterstained with DAPI (blue). (Scale bar: 50 µm.)
In contrast to the outcomes shown in Fig. 2, when we maintained ES cells on the CDM, i.e., the medium used by Bernardo et al. (21), H1 cells responded more slowly to BMP4. Even so almost half the cells were KRT7+ cells by day 5, and the combination (BMP4/A/P) treatment converted ∼70% of the cells to a KRT+ state by day 5 (Fig. S4). These values differ significantly from the 4–8% values reported by others who used this medium (21).
Expression of Gene Products Associated with Placental Syncytiotrophoblast After Exposure of ES Cells to BMP4.
The design of the experiments to test the production of placental hormones by hESC under different culture conditions is shown in Fig. 3D. The time course for the production of human chorionic gonadotropin (hCG), progesterone (P4), and placental growth factor (PGF) by H1 (Fig. 3A) and H9 cells (Fig. S5A) in response to BMP4 and BMP4/A/P was highly predictable provided that consistent passaging and culture conditions were used. Control H1 cells grown in the presence of FGF2 and the absence of BMP4 produced no detectable amounts of the three hormones over 13 d of continuous culture, by which time cultures were largely confluent. Treatment with BMP4 over the same period led to small, but measurable, amounts of hormone by day 5 and relatively large-scale production subsequent to that time (Fig. 3). In all experiments performed on H1 cells, production always declined after its zenith around day 9. BMP4/A/P treatment significantly enhanced total daily production of hCG but did not accelerate the onset of its first appearance at around day 5. Release of P4 and PGF in response to BMP4 and BMP4/A/P showed somewhat similar but not identical trends over time, with maxima around day 9 and subsequent declines thereafter. Production of placental lactogen (PL) was delayed relative to the other three hormones. It began around day 11 and peaked on day 13 (Fig. S6A) under both BMP4 and BMP4/A/P conditions. Treatment of H1 cells with the A/P inhibitors alone also induced production of all three hormones in a comparable time progression, albeit in significantly reduced amounts. H9 cells responded quite similarly (Fig. S5A), although hCG production tended to be higher than in H1 cells.
Fig. 3.

Daily accumulation and expression of placental hormones by H1 hESC under different culture conditions. (A) Changes in production of hCG, P4, and PGF from cells cultured in MEF-CM supplemented with FGF2 (values are too small to be shown), BMP4 (black bars), BMP4/A/P (BAP; white bars), and A/P (checkered bars). The medium in each culture dish was replaced daily and measured by ELISA. (B) Comparable measurements from cells cultured in CDM and on a gelatin-coated substratum. In the BMP4 (black bars) and BMP4/A/P (white bars) conditions, the medium lacked FGF2/Activin. (C) Comparable measurements from cells cultured in mTeSR1 medium. In the BMP4 (black bars) and BMP4/A/P (white bars) conditions, the medium lacked FGF2/TGF-β. *P < 0.05, **P < 0.01, ***P < 0.001. (D) Cartoon showing the experimental design used for all three culture media. (E) qRT-PCR for CGA, CGB, and PGF mRNA expression in H1 hESC at days 1, 2, 5, and 9 in cells cultured with MEF-CM supplemented with FGF2 (gray bars), BMP4, (black bars), BMP4/A/P (BAP; open bars). Relative mRNA abundances are shown on a log10 scale on the y axis. Selection of control values and the normalization procedures are described in SI Materials and Method. The threshold cycle (CT) and ΔCT values of CGA, CGB, and PGF are shown in Table S1. Increases for CGA, CGB, and PGF over time in the BMP4 and BMP4/A/P conditions were highly significant (P < 0.0001 for CGA and CGB; P = 0.0013 for PGF); changes in transcript concentrations for all three genes after culture on FGF2-supplemented medium did not change significantly over time. At days 5 and 9, CGA, CGB, and PGF transcript concentrations were higher (P < 0.0001) in BMP4/A/P (BAP) conditions than in BMP4 conditions.
In a subsequent, follow-up experiment, we compared the production of hCG in response to BMP4/A/P conditions by H1 cells maintained on MEF-CM with that of cells on medium that had not been conditioned previously by MEF (Fig. S6B). By day 9, the latter had released significantly more (P < 0.05) hCG into the medium than those on MEF-CM. Thus, products of MEF are unnecessary for H1 cells to produce hCG. Rather, they may be somewhat inhibitory.
H1 cells cultured under the conditions used by Bernardo et al. (21), i.e., in CDM and on a substratum of gelatin, produced only about 1% the amount of hCG in response to BMP4 and BMP4/A/P that they produced under the standard conditions (Fig. 3B). At day 9, cell numbers from the CDM and MEF-CM cultures were comparable in the presence of BMP4 alone (1.34 ± 0.22 × 10⁶ per well versus 1.24 ± 0.11 × 10⁶ per well, respectively) and of BMP4/A/P (0.98 ± 0.09 × 10⁶ per well versus 0.98 ± 0.13 × 10⁶ per well, respectively), so that differences in hormone production cannot be attributed to there being fewer cells on the culture plates. P4 and PGF production also was markedly lower on CDM (Fig. 3B). Significantly lower production of hCG, although much higher than with CDM, was evident when H1 cells were cultured on the second defined medium, namely mTeSR1 prepared without the normal addition of FGF2 and TGF-β (Fig. 3C).
Transcript levels of CGA and CGB (which encode the two subunits of hCG) and of PGF assessed by real-time PCR in H1 cells generally reflected the production of protein (Fig.3E and Tables S1 and S2). All of the threshold cycle (CT) and ΔCT values presented in this study are summarized in Tables S1–S4. The primers and CT values of the reference genes used for the real-time PCR are listed in Tables S5 and S6, respectively. Expression was either extremely low or below the limits of detection (37.5 cycles of PCR) at days 1 and 2 after beginning treatment. Even if detectable at these early days, expression of CGA and CGB rose several thousand-fold by day 5 in response to both BMP4 and BMP4/A/P while remaining extremely low in the control cells. The fold-increase for PGF expression in response to a 5-d treatment with BMP4 was more modest but still exceeded 100-fold. A similar pattern of hormone production and transcript regulation over time was confirmed in H9 cells (Fig. S5B).
Expression of HLA-G and Acquisition of Invasive Properties.
Real-time PCR assessment of HLA-G gene expression in H1 cells in response to BMP4 was performed with two probe sets. One set (HLA-G 330) (Table S5) was designed to measure transcript concentrations of transcribed mRNA for several soluble and membrane-associated forms (Fig. 4A). The second probe set (HLA-G108) (Table S5) amplified only transcripts for the membrane-bound forms of the protein. In a separate set of reactions performed under standard PCR conditions, the amplicons were isolated and sequenced and shown to correspond to the anticipated HLA-G gene sequences. Together, these data showed that HLA-G is expressed in H1 and H9 cells treated with BMP4 but not in its absence and that at day 5 mRNA levels were greater in cells under a low (4%) O2 than under a high (20%) O2 atmosphere (Fig. 4 B and C).
Fig. 4.

HLA-G gene expression in hESC under different culture conditions. (A) Cartoon representing the full-length HLA-G transcript with boundaries of exons 1–6. Its protein-coding region is shown as a thick bar, amd the region encoding the epitope for the monoclonal antibody (mAB) 4H84 and the region of the mRNA amplified by qRT-PCR in B and C are shown as arrows. (B and C) qRT-PCR of a region derived between exons 2 and 4 of the HLA-G transcript (HLA-G 330) (B) or the 3′ UTR HLA-G 108 (C) present in H1 (Left) and H9 (Right) hESC cultured under low (4%) or high (20%) O2 conditions in MEF-CM with FGF2 or in MEF-CM with BMP4 and without FGF2. Relative mRNA abundances are shown on a log10 y-axis scale (SI Materials and Method). Different letters indicate bars with significantly different values (P < 0.001). (D) HLA-G expression in H1 hESC before and after TR differentiation: HLA-G (∼40 kDa) was detected in lysates from BMP4/A/P-treated hESC (Right Lane) but not from undifferentiated cells (FGF2) (Left Lane) by Western blots incubated with 4H84 monoclonal antibody. The loading control was TUBA (50 kDa). (E) H1 hESC immunostained for HLA-G and DAPI (to stain nuclear material) after 48-h treatment with BMP4 (Right) or with FGF2 (Left) under high O2 conditions. Green fluorescence, mainly confined to the periphery of cells, indicates HLA-G. (Scale bar: 50 µm.)
Expression of protein as determined by Western blotting indicated HLA-G in detectable concentrations at day 4 and day 6 of treatment (Figs. 4D and 5A), although immunocytochemistry has demonstrated even earlier expression, with immunoreactivity present on the cell surface of some cells as early as 48 h after initiating treatment (Fig. 4E). Only a single band with an estimated Mr of ∼40 kDa was detected on the Western blots (Figs. 4D and 5A), suggesting that the predominant HLA-G protein expressed in BMP4-treated hESC is not derived from alternatively spliced forms of mRNA (Fig. 4A).
Fig. 5.
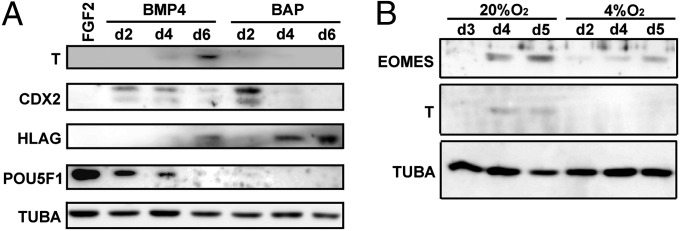
Western blot analysis of lysates from H1 hESC cultured in MEF-CM with BMP4 or BMP4/A/P under 20% or 4% O2 conditions. (A) Cells cultured with FGF2 (lane 1) or for various time periods with BMP4 and BMP4/A/P under 20% O2 conditions. The exposure times for image capturing were 1 min for HLA-G and TUBA, 5 min for CDX2 and POU5F1, and 10 min for T. (B) Cells cultured for various time periods with BMP4 under high (20%) or low (4%) O2 conditions. For both A and B, TUBA was used as a loading control. The exposure times were 2 min for EOMES, 15 s for T, and 1 s for TUBA.
When the ability of cells to migrate through a layer of Matrigel and an underlying membrane bearing 8-µm pores was assessed, cultures maintained under conditions designed to minimize differentiation (i.e., with FGF2 present and BMP4 absent) showed little or no invasiveness (Fig. 6A). However, significant migration through the pores of the membranes was observed in the cultures that had been treated with either BMP4 or BMP4/A/P. Because cell numbers always are higher in the undifferentiated colonies than in those driven to differentiation (Fig. 6B), the data indicate that by day 5 of treatment invasive potential had been raised ∼159-fold by BMP4/A/P and 64-fold by BMP4 alone. Immunohistochemical staining of the cells present on the underside of the membrane showed that the majority were positive for KRT7 (Fig. 6C) and that many also were positive for HLA-G (Fig. 6D).
Fig. 6.

Acquisition of invasive/motility properties by H1 hESC in response to BMP4 and BMP4/A/P. H1 hESC were plated on Matrigel-coated membranes with 8-µm pores inserted into invasion chambers arranged in a six-well format at a density of 5 × 10⁴ cells per chamber. (A) After 5-d culture in MEF-CM supplemented with FGF2, BMP4, or BMP4/A/P (A83, PD), cells that had migrated through the pores and attached to the undersurface of the membranes were counted. Three independent experiments, each in duplicate, were performed for each treatment. Values are means ± SEM. Pairwise comparisons were conducted between treatments (*P < 0.05, **P < 0.01). (B) Total cell numbers per well for H1 hESC cultured for 5 d under conditions identical to those used in A. (C and D) Cells that had been cultured under BMP4/A/P conditions and that had invaded the underside of the invasion chamber membrane were immunostained for KRT7 (C) and HLA-G (D) (Scale bar: 50 μm.)
To determine whether the continued presence of BMP4 is necessary for the invasion process to occur, at 24 h the BMP4/A/P medium was replaced with medium lacking BMP4. At day 5, cell numbers on the underside of the membrane did not differ in the two experimental conditions (Fig. S7).
Expression of Brachyury.
Real-time PCR analyses indicated that T transcripts were below the level of detection in both H1 and H9 cells treated with BMP4/A/P but that low expression could be observed occasionally in H9 cells at day 5 of treatment with BMP4 (see Fig. 8 G and H and Tables S3 and S4). Western blotting also suggested the presence of T protein in H1 cells following BMP4 treatment alone (Fig. 5A), but amounts were variable and sometimes so low as to be undetectable. Negligible expression was observed as assessed by Western blotting when the A/P inhibitors accompanied BMP4 in the culture medium (Fig. 5A). When H1 cells were maintained continuously on MEF-CM rather than on mTeSR1 before the addition of BMP4, T occasionally was detectable by Western blotting when the gas atmosphere had been air/5% CO2 (Fig. 5B). Expression was not detected when O2 was maintained at 4% (Fig. 5B). Attempts to detect T by immunohistochemistry in colonies grown under any of the culture conditions were unsuccessful, whereas nuclear staining of T was evident in F9 mouse embryonal carcinoma cells, which are recommended as positive controls by antibody suppliers (Fig. S8C).
Fig. 8.

qRT PCR for CDX2, EOMES, ELF5-2b, T, and TBX4 in hESC in response to the respective culture conditions. H1 (A, C, E, G, and I) and H9 (B, D, F, H, and J) hESC were cultured on MEF-CM in the presence of FGF2 (gray bars), BMP4 in the absence of FGF2 (black bars), or BMP4/A/P (white bars) for 1, 2, 5, and 9 d. Relative mRNA abundances are shown on a log10 scale on the y axis (SI Materials and Methods, Tables S3 and S4). In H1 cells, values for CDX2 expression in BMP4 and BMP4/A/P cells were significantly higher (P < 0.05) than in controls only on day 2 and day 9. Similar changes were seen for CDX2 values in H9 cells (day 2, P < 0.005) and (day 9, P < 0.05). In H1 cells EOMES expression was greater in BMP4 than in BMP4/A/P conditions on days 1, 2, and 9 (P < 0.05). In H9 cells EOMES expression in BMP4 conditions was higher than in BMP4/A/P and control (P < 0.05) on all days. For ELF5-2b, up-regulation occurred significantly earlier in BMP4/A/P conditions than in the other two treatments (P < 0.01) in both cell lines. Values for T were not above threshold values in H1 cells under any treatment but were modestly up-regulated by BMP4 in H9 cells at day 5 only. In both cell lines TBX4 expression was significantly above background only under BMP4 conditions at day 9. Complete statistical data are available upon request.
Expression of CDX2, ELF5, EOMES, and TBX4.
CDX2 transcripts were detectable in low amounts in undifferentiated H1 and H9 cells on all days (see Fig. 8 A and B and Tables S3 and S4). There was a modest up-regulation in response to BMP4 and BMP4/A/P at day 1 and day 2, but by day 5 mRNA levels were not significantly different from those in controls. They had risen again, however, by day 9. This pattern of mRNA expression as detected by quantitative RT-PCR (qRT-PCR) was quite similar in H1 and H9 cells. Western blotting confirmed CDX2 protein expression in BMP4- and BMP4/A/P-treated cells but not in the controls (Fig. 5A) and also was consistent with the qRT-PCR measurements (see Fig. 8 A and B), in that protein expression was high at day 2 and subsequently declined.
When examined immunohistochemically, control cultures were uniformly positive for POU5F1 and negative for CDX2 (Fig. 7 A–C). In the presence of BMP4, with inhibitors absent, the colonies at day 2 remained POU5F1+, but cells with nuclear staining for CDX2 were present on the periphery (Fig. 7 D–F). By day 4, they were more common toward the interior (Fig. 7 G–I), and POU5F1 expression was undetectable. At day 2, POU5F1+ cells were absent in BMP4/A/P-exposed colonies (Fig. 7K), but nuclear CDX2 staining was present in the majority of the cells (Fig. 7J). By day 4 this pattern had changed, and CDX2 was localized mainly in patches of cells in peripheral areas (Fig. 7 M–O). This peripherally localized expression was confined to a few large patches at day 6 (Fig. 7 P–R) that need to be defined further but may correspond to the groups of cytotrophoblasts that initiate invasion into maternal deciduas in the human (24).
Fig. 7.

Time course for expression of CDX2 and POU5F1 in H1 hESC cultured on MEF-CM supplemented with FGF2, BMP4, or BMP4/A/P. H1 cells were cultured on MEF-CM supplemented with FGF2 (A–C), BMP4 (D–I), or BMP4/A/P (J–R) and were fixed on day 2, day 4, or day 6. (Top Row) Colonies immunostained for CDX2 (red). (Middle Row) Colonies stained for POU5F1 (green). (Bottom Row) The same colonies stained by DAPI and the merged fluorescent images from the two panels above. (Scale bar: 200 μm.)
ELF5 (ELF5-2b) (24) gene expression was low or undetectable in control H1 and H9 cells but had increased at day 2 in response to BMP4/A/P and at day 5 in both treatment groups (Fig. 8 E and F and Tables S3 and S4). Thereafter, expression declined. EOMES, in contrast, was up-regulated early in BMP4-treated cells (Fig. 8 C and D and Tables S3 and S4), and its protein also was detectable by Western blot, especially under 20% O2 conditions (Fig. 5B). However, no increase in EOMES transcript levels was noted in cells treated with BMP4/A/P (Fig. 8 C and D). Instead, expression declined to almost undetectable levels after day 1 in both H1 and H9 cells.
Earlier microarray studies (Gene Expression Omnibus accession no. GSE10469) had indicated that most mesoderm marker genes (e.g., TBX4, HAND2, KDR, and VAMEF-CM1) in H1 cells had only a very minor expression and regulatory response to BMP4 (17). Here the data for TBX4 were confirmed by qRT-PCR (Fig. 8 I and J and Tables S3 and S4). Transcript concentrations were uniformly low except in day 9 colonies that had been exposed to BMP4. This response was greater in H9 than in H1 cells but was evident in both. Expression was completely absent under BMP4/A/P conditions in both H1 and H9 cells. Along with the results presented for T, these data indicate that under the culture conditions used, BMP4 has little ability to drive up-regulation of mesoderm marker genes in human ES cells unless culture is prolonged.
Discussion
Bernardo et al. (21) recently concluded that the apparent ability of human ES cells to differentiate to TR in response to BMP and in the absence of FGF2 is an artifact, despite the many reports that such cells produce placental hormones, express a wide range of TR-associated genes (1, 3, 4, 11, 19, 32), and form extensive areas of syncytium that are strongly positive for the TR marker proteins CGA and CGB (1, 10, 11) when the cultures are maintained on a MEF-CM. In contrast, on the particular medium and substratum used by Bernardo et al. (21), hESC were reported to be driven predominantly toward a mesoderm fate by BMP4 in presence of FGF2 and inhibitors of Activin/NODAL signaling and toward endoderm when Activin/NODAL signaling is unimpeded. These observations led to the conclusion that hESC “do not have the capacity to generate TR simply by addition of BMP to their growth medium, in either the presence or the absence of FGF2, or with Activin/NODAL inhibition” (21, p. 153). Such a claim, if correct, invalidates a considerable body of past work and raises doubts about any future use of the BMP4/hESC model to study human TR lineage emergence and differentiation.
A primary motivation for the present paper, therefore, was to determine whether the BMP4/hESC model for directed differentiation of TR had been invalidated. We endeavored to identify and control variables, including the source of BMP4 and Matrigel, the initial hESC colony size, and variability in the MEF-CM related to MEF cell density and passage number, that can cause inconsistencies in the speed at which colonies differentiate. We also chose to perform the majority of our experiments under a gas atmosphere of air and 5% CO2 to mirror the conditions used by almost all investigators, including Bernardo et al. (21), who have studied the BMP4/hESC model. [It should be emphasized that these conditions are not physiological, and O2 tensions profoundly affect how quickly hESC differentiate in response to BMP4 (10, 11), as well as the expression of a number of key marker genes (17).] Once such conditions had been achieved, it became possible to replicate experiments performed months apart with comparative ease. Such experiments confirmed that BMP4 drives epithelial formation in MEF-CM from the periphery toward the center of the colony and that BMP4/A/P accelerates this process so that it is completed within 48 h (Fig. 1). Differentiation was relatively slower on the defined mTeSR1 medium but appeared to progress quite rapidly on CDM (Fig. S1), although colony patterning seemed rather disorganized.
On MEF-CM, BMP4 and BMP4/A/P induced the production of large amounts of the placental hormones chorionic gonadotropin, P4, and PGF, beginning at about day 5 of BMP4 exposure and peaking about 4 d later, whereas cultures maintained under the conditions described by Bernardo et al. (21) produced hormone very poorly (Fig. 3) and provided only a small fraction of the product achieved on the classical MEF-CM. In addition, BMP4 and BMP4/A/P induction of hCG production was quite low on mTeSR1 medium lacking FGF2. Initially, we inferred that factors present in the MEF-CM, but not in the two defined media, might act in concert with BMP4 to enhance TR differentiation, but this was not the case: H1 cells were able to respond to BMP4/A/P even when the medium had not been conditioned by MEF (Fig. S6). Therefore, we believe that the low production achieved on mTeSR1 and the CDM used by Bernardo et al. reflects the slower rate of colony differentiation to TR observed with these media (Fig. S1). It is unclear why the addition of the inhibitors of Activin and FGF2 signaling generally enhanced hormone production in response to BMP4 but had little effect on the timing of hCG, PGF, and P4 up-regulation (Fig. 3). It also is uncertain why production of hormones peaks at around day 9 and then declines, although we suspect that the phenomenon is an outcome of detachment of peripheral regions of the colonies coupled with unfavorable culture conditions as the cultures reach confluence.
In addition to hormone production, there were other lines of evidence for the TR phenotype of BMP4-treated hESC. The acquisition of a KRT7+ epithelium (Fig. 2) and loss of POU5F1 (Figs. 5A and 7) proceeded quickly and reproducibly on MEF-CM but were markedly accelerated under BMP4/A/P conditions (Figs. 2, 5A, and 7). The conversion was significantly slowed on the CDM (Fig. S4), although the progression appeared more efficient in our hands (∼70% in 5 d) than as described by Bernardo et al. (21), in which only 4–8% of the cells became KRT7+ after a comparable time of exposure to BMP4 in a medium lacking the basal amount of FGF2 (12 ng/mL) and Activin (10 ng/mL). The International Stem Cell Initiative Consortium has tested the CDM used by Bernardo et al. (21) and demonstrated that it performed poorly in independent tests carried out by five independent laboratories (33). In each comparison, the majority of hESC lines showed either considerable cell death or spontaneous differentiations within three passages when cultured on the CDM used by Bernardo et al.; only MEF-CM, mTeSR1, and a third medium, STEMPRO, successfully maintained all lines in a pluripotent state for at least 10 passages. We have encountered similar problems in maintaining hESC for multiple passages with the CDM and speculate that the H9 cells used by Bernardo et al. may have become adapted to that medium and already have a cryptic commitment to mesoendoderm, possibly through epigenetic changes acquired over passages. Whatever the explanation for the discrepancies in outcomes, our data indicate that, in response to BMP4 and in the absence of FGF2, hESC on MEF-CM are converted largely, if not completely, to cells with a TR phenotype.
Both BMP4 and BMP4/A/P treatments led to up-regulation of HLA-G gene and protein expression in hESC cultured on MEF-CM (Figs. 4–6), again as is consistent with the generation of TR and in marked contrast to the lack of HLA-G expression observed in the CDM used by Bernardo et al. (21). The results also contrast with those of Sudheer at al (13), who also used BMP4 in the presence of FGF2 and Activin signaling inhibitors but failed to observe HLA-G expression despite reporting definitive formation of syncytiotrophoblasts. The difference may be an outcome of timing. In our hands, HLA-G transcripts and HLA-G protein became detectable before the production of placental hormones. Moreover, a population of cells capable of migrating successively through a layer of Matrigel and then through the 8-µm-diameter pores of an underlying membrane became evident by day 5 (Fig. 6) and was largely KRT7/HLA-G–positive, but how closely such cells correspond to the invasive extravillous TR component of the human placenta remains to be determined. HLA-G in human TR exists in many forms, including at least three that are soluble and four that are membrane spanning (34). The qPCR procedures used here (Fig. 4) were designed to detect transcripts for both kinds, but the predominant ∼40 kDa protein band observed by Western blotting (Figs. 4D and 5A) most likely represents the full-length, membrane-bound isoform of the protein. It is also true that questions have arisen about the specificities of antibodies raised against HLA-G (35–38). The 4H84 monoclonal antibody used here was raised against a linear peptide sequence unique to human HLA-G (26) and has been used widely for immunocytochemistry. Its specificity has been confirmed, provided the tissue is fixed under acidic, denaturing conditions (35) such as we used. Moreover, 4H84 clearly recognizes a protein of a size corresponding to HLA-G and not to other HLA types (Fig.4D). The combined data leave little doubt that the BMP4-exposed hESC progress from a HLA-G–negative to a HLA-G–positive state.
Brachyury (T), whose up-regulation has been linked to the FGF2/ERK1/2 signaling pathway (39) and to the controlling influence of NANOG (19, 40), is an early marker of mesoderm induction in mouse embryos (41) and plays a clear role in the induction of mesoderm by BMP4 under CDM conditions (21). T expression in response to BMP4 in hESC on MEF-CM, whether assessed through protein or transcript level (Figs. 5 and 8 G and H), was low. When present (and its presence was variable), the appearance of T protein was relatively late in onset and was dependent upon high O2 conditions. Under BMP4/A/P induction conditions, T never was detectable. Consistent with these data, early downstream markers of mesoderm induction, such as TBX4, were expressed weakly under BMP4 but not under BMP4/A/P conditions (Fig. 8 I and J). Two other transcription factors whose role has been linked closely to that of T, namely EOMES and CDX2, were regulated in response to BMP4 (Fig. 8 A–D). Because both are expressed in mouse TR stem cells (23, 42, 43) but also play roles in mesoendoderm patterning (21, 44–47), their diagnostic value in distinguishing TR from mesoderm is questionable. Of particular interest to us, however, was the expression of CDX2 under BMP4/A/P reflected on both Western blots (Fig. 5A) and immunostained colonies (Fig. 7J) at day 2. Conceivably, it is at this stage of differentiation that cells most clearly resembling TR stem cells transiently populate the colonies. ELF5-2b, whose ortholog is critical for the maintenance of mouse TR stem cells (23), also was up-regulated relatively soon after BMP4/A/P addition (Fig. 8 E and F). Its temporal pattern was somewhat similar to that of CDX2 and implies that the optimal stage to examine the methylation status of the ELF5-2b promoter and to attempt to isolate TR stem cells may be at day 2 of the BMP4/A/P protocol rather than later, when more advanced TR lineages begin to appear.
What appears to have raised initial theoretical doubts about the soundness of the BMP4/hESC model is the conviction by mouse embryologists that hESC could not give rise to TR because they are of the “epiblast” or “primed” type, originating from cells that, at least in the mouse embryo, are thought incapable of giving rise to trophectoderm (48). Although this concern is understandable, there seems no reason to suppose that hESC have an inflexible phenotype that can resist reprogramming to TR under all culture conditions. A further reason cited for skepticism of the BMP4/hESC model is that BMP4 is a key driver of mesoderm emergence and an inducer of T in epiblast-type stem cells (3, 19, 49–51). On the other hand, simple removal of FGF2 and/or its signaling pathway is sufficient under some culture conditions to block mesoderm emergence in hESC even when BMP4 is present (13, 19). As discussed previously (17), a final objection raised against the BMP4/hESC model is that mouse embryos lacking the capacity to express BMP4 generally have normal placental development but exhibit defects in mesoderm (52). On the other hand, a significant fraction of such mutant embryos survive to term as fully formed fetuses, presumably with functioning mesoderm as well as a placenta. The most likely reason for conceptus survival of BMP4 knockouts is local provision of BMPs by the maternal endometrium (17). Thus, this knockout model probably does not provide an unequivocal example of TR development in the complete absence of BMP4. In contrast, mutant mouse conceptuses lacking the BMP type II receptor present a more severe phenotype than BMP4 knockouts (53). No egg cylinder elongation is observed, and mesoderm fails to form in any embryo. However, extraembryonic tissue and the ectoplacental cone appear completely disorganized even before the gastrulation stage, suggesting that TR formation also is affected by the mutation. Conceivably, BMP4 is not required for emergence and differentiation of trophectoderm and the initial events of implantation but is needed later for trophectoderm derivatives to expand and differentiate.
In summary, the experiments here confirm the ability of BMP4 to generate TR, including cell types resembling syncytiotrophoblast and extravillous TR, from hESC. Even though there probably is not a strict definition of TR that all could agree on, and no molecular marker on its own can be sufficiently diagnostic to define that cell lineage, the combined weight of the evidence presented here demonstrates conclusively that the predominant cell arising during differentiation in response to BMP4 is TR. The addition of inhibitors of FGF2 and Activin/Nodal signaling is not necessary for TR formation to occur efficiently but can accelerate the process and may minimize even a minor diversion to other lineages. The conditions (medium, substratum, and the presence of FBS in the gelatin matrix) used by Bernardo et al. (21) to study the effects of BMP4 did not resemble those used by other investigators seeking to study TR in the BMP4/hESC system and may explain the different outcomes.
Materials and Methods
Only cell-culture procedures are described here. Sources of reagents and more general methods are provided in SI Materials and Methods. Antibodies and conditions used for immunocytochemistry are summarized in Table S7.
Human H1 (WA01) and H9 (WA09) ESC were obtained from WiCell Research Institute and were cultured in six-well culture plates (Nunc) coated with with Matrigel (BD Bioscience). In initial experiments, cells were cultured as described below on knockout serum replacement MEF-CM. More recently, the cells were cultured on the defined mTeSR1 medium (STEMCELL Technologies) containing 100 ng FGF2/mL and 0.6 ng TGF-β/mL (30), which prevents spontaneous differentiation under 20% O2 conditions better than MEF-CM (54). The medium in all wells was changed daily. Cells were routinely passaged at a 1:6 ratio every 5–6 d. Briefly, colonies were exposed to dispase (1 mg/mL) (STEMCELL Technologies) for 3 min at 37 °C and then were broken into small clumps of relatively uniform size with the Stempro EZpassage (Invitrogen) cutting tool according to the manufacturer’s instructions. For most experiments reported here, colonies from a culture well were split at a ratio of 1:12 to provide a transfer of ∼1.2 × 10⁴ cells/cm2. The following day, the culture medium was changed from the defined mTeSR1 medium to the standard medium for hESC (16, 54), which had been conditioned by a monolayer of γ-irradiated (8,000 cGy) MEF feeder cells (1, 10, 31) and which contained recombinant FGF2 (4 ng/mL) (55) prepared in our laboratory. After a further 24 h, the medium was changed again to one lacking FGF2 but containing BMP4 (10 ng/mL), the ALK4/5/7 inhibitor A83-01 (1 μM), and the FGF2-signaling inhibitor PD173074 (0.1 µM) in various combinations (Fig. 3D). Control cultures continued to be grown in the presence of FGF2 and the absence of BMP4 and the inhibitors. The medium above each culture was collected and replenished daily until the experiment was terminated (usually day 9). Collected media samples were stored at −20 °C until assayed for hormones and other factors.
To compare the effects MEF-CM with two chemically defined media, namely CDM (21, 27, 56) and mTeSR1 (30), the cells were seeded at a density of 4.8 × 10⁴/cm2 and 1.8 × 10⁴/cm2, respectively, to compensate for the differences in growth rate of the hESC on the two media relative to MEF-CM. The composition of the CDM used by Bernardo et al. (21) is described in SI Materials and Methods. The medium is supplemented with 10 ng/mL Activin and 12 ng/mL FGF2 to maintain hESC pluripotency. To study differentiation, the plastic culture wells were coated with 0.1% porcine gelatin [prepared by dissolving gelatin (G1890; Sigma) in sterile water (W1503; Sigma)] for 30 min. The gelatin then was soaked with MEF medium containing 10% (vol/vol) FBS for a minimum of 12 h. Before the cells in suspension were added, the MEF medium was removed, and the plates rinsed with Dulbecco’s PBS (Gibco). After 24 h, differentiation was induced on CDM prepared without FGF2 and Activin but containing BMP4 (10 ng/mL) and polyvinyl alcohol (1 mg/mL) (21) as a substitute for serum albumin (Table S8). For experiments following BMP4-driven differentiation performed on mTeSR1 medium, the culture dishes always were coated with Matrigel (19). After routine culture on mTeSR1 containing the usual 100 ng/mL FGF2 and 0.6 ng/mL TGF-β, the cells were adapted to medium containing only 20 ng FGF2/mL for 24 h before that medium was replaced with mTeSR1 lacking FGF2 and TGF-β but containing BMP4 (10 ng/mL) and/or inhibitors. A summary of the experimental design for comparing the three media is shown in Fig. 3D.
Supplementary Material
Acknowledgments
We thank Dr. Bhanu Prakash Telugu for critical input, Mr. Dennis Reith for editorial assistance, and Drs. Tiago Faial and Roger Pedersen for providing information on the preparation of the chemically defined medium. This research was supported by National Institutes of Health Grant 1R01HD067759.
Footnotes
The authors declare no conflict of interest.
Data deposition: The microarray data reported in this paper have been deposited in the Gene Expression Omnibus (GEO) database, www.ncbi.nlm.nih.gov/geo (accession no. GSE10469).
This article contains supporting information online at www.pnas.org/lookup/suppl/doi:10.1073/pnas.1303094110/-/DCSupplemental.
References
- 1.Xu RH, et al. BMP4 initiates human embryonic stem cell differentiation to trophoblast. Nat Biotechnol. 2002;20(12):1261–1264. doi: 10.1038/nbt761. [DOI] [PubMed] [Google Scholar]
- 2.Golos TG, Pollastrini LM, Gerami-Naini B. Human embryonic stem cells as a model for trophoblast differentiation. Semin Reprod Med. 2006;24(5):314–321. doi: 10.1055/s-2006-952154. [DOI] [PubMed] [Google Scholar]
- 3.Zhang P, et al. Short-term BMP-4 treatment initiates mesoderm induction in human embryonic stem cells. Blood. 2008;111(4):1933–1941. doi: 10.1182/blood-2007-02-074120. [DOI] [PubMed] [Google Scholar]
- 4.Wu Z, et al. Combinatorial signals of activin/nodal and bone morphogenic protein regulate the early lineage segregation of human embryonic stem cells. J Biol Chem. 2008;283(36):24991–25002. doi: 10.1074/jbc.M803893200. [DOI] [PMC free article] [PubMed] [Google Scholar]
- 5.Douglas GC, VandeVoort CA, Kumar P, Chang TC, Golos TG. Trophoblast stem cells: Models for investigating trophectoderm differentiation and placental development. Endocr Rev. 2009;30(3):228–240. doi: 10.1210/er.2009-0001. [DOI] [PMC free article] [PubMed] [Google Scholar]
- 6.Gerami-Naini B, et al. Trophoblast differentiation in embryoid bodies derived from human embryonic stem cells. Endocrinology. 2004;145(4):1517–1524. doi: 10.1210/en.2003-1241. [DOI] [PubMed] [Google Scholar]
- 7.Marchand M, et al. Transcriptomic signature of trophoblast differentiation in a human embryonic stem cell model. Biol Reprod. 2011;84(6):1258–1271. doi: 10.1095/biolreprod.110.086413. [DOI] [PubMed] [Google Scholar]
- 8.Besser D. Expression of nodal, lefty-a, and lefty-B in undifferentiated human embryonic stem cells requires activation of Smad2/3. J Biol Chem. 2004;279(43):45076–45084. doi: 10.1074/jbc.M404979200. [DOI] [PubMed] [Google Scholar]
- 9.Erb TM, et al. Paracrine and epigenetic control of trophectoderm differentiation from human embryonic stem cells: The role of bone morphogenic protein 4 and histone deacetylases. Stem Cells Dev. 2011;20(9):1601–1614. doi: 10.1089/scd.2010.0281. [DOI] [PMC free article] [PubMed] [Google Scholar]
- 10.Das P, et al. Effects of fgf2 and oxygen in the bmp4-driven differentiation of trophoblast from human embryonic stem cells. Stem Cell Res (Amst) 2007;1(1):61–74. doi: 10.1016/j.scr.2007.09.004. [DOI] [PMC free article] [PubMed] [Google Scholar]
- 11.Schulz LC, et al. Human embryonic stem cells as models for trophoblast differentiation. Placenta. 2008;29(Suppl A):S10–S16. doi: 10.1016/j.placenta.2007.10.009. [DOI] [PMC free article] [PubMed] [Google Scholar]
- 12.Chen G, et al. Trophoblast differentiation defect in human embryonic stem cells lacking PIG-A and GPI-anchored cell-surface proteins. Cell Stem Cell. 2008;2(4):345–355. doi: 10.1016/j.stem.2008.02.004. [DOI] [PMC free article] [PubMed] [Google Scholar]
- 13.Sudheer S, et al. FGF inhibition directs BMP4-mediated differentiation of human embryonic stem cells to syncytiotrophoblast. Stem Cells Dev. 2012;21(6):2987–3000. doi: 10.1089/scd.2012.0099. [DOI] [PMC free article] [PubMed] [Google Scholar]
- 14.Vallier L, Alexander M, Pedersen RA. Activin/Nodal and FGF pathways cooperate to maintain pluripotency of human embryonic stem cells. J Cell Sci. 2005;118(Pt 19):4495–4509. doi: 10.1242/jcs.02553. [DOI] [PubMed] [Google Scholar]
- 15.Xu RH, et al. Basic FGF and suppression of BMP signaling sustain undifferentiated proliferation of human ES cells. Nat Methods. 2005;2(3):185–190. doi: 10.1038/nmeth744. [DOI] [PubMed] [Google Scholar]
- 16.Amit M, et al. Clonally derived human embryonic stem cell lines maintain pluripotency and proliferative potential for prolonged periods of culture. Dev Biol. 2000;227(2):271–278. doi: 10.1006/dbio.2000.9912. [DOI] [PubMed] [Google Scholar]
- 17.Ezashi T, Telugu BP, Roberts RM. Model systems for studying trophoblast differentiation from human pluripotent stem cells. Cell Tissue Res. 2012;349(3):809–824. doi: 10.1007/s00441-012-1371-2. [DOI] [PMC free article] [PubMed] [Google Scholar]
- 18.Drukker M, et al. Isolation of primitive endoderm, mesoderm, vascular endothelial and trophoblast progenitors from human pluripotent stem cells. Nat Biotechnol. 2012;30(6):531–542. doi: 10.1038/nbt.2239. [DOI] [PMC free article] [PubMed] [Google Scholar]
- 19.Yu P, Pan G, Yu J, Thomson JA. FGF2 sustains NANOG and switches the outcome of BMP4-induced human embryonic stem cell differentiation. Cell Stem Cell. 2011;8(3):326–334. doi: 10.1016/j.stem.2011.01.001. [DOI] [PMC free article] [PubMed] [Google Scholar]
- 20.Greber B, et al. Conserved and divergent roles of FGF signaling in mouse epiblast stem cells and human embryonic stem cells. Cell Stem Cell. 2010;6(3):215–226. doi: 10.1016/j.stem.2010.01.003. [DOI] [PubMed] [Google Scholar]
- 21.Bernardo AS, et al. BRACHYURY and CDX2 mediate BMP-induced differentiation of human and mouse pluripotent stem cells into embryonic and extraembryonic lineages. Cell Stem Cell. 2011;9(2):144–155. doi: 10.1016/j.stem.2011.06.015. [DOI] [PMC free article] [PubMed] [Google Scholar]
- 22.King A, Burrows T, Verma S, Hiby S, Loke YW. Human uterine lymphocytes. Hum Reprod Update. 1998;4(5):480–485. doi: 10.1093/humupd/4.5.480. [DOI] [PubMed] [Google Scholar]
- 23.Ng RK, et al. Epigenetic restriction of embryonic cell lineage fate by methylation of Elf5. Nat Cell Biol. 2008;10(11):1280–1290. doi: 10.1038/ncb1786. [DOI] [PMC free article] [PubMed] [Google Scholar]
- 24.Hemberger M, Udayashankar R, Tesar P, Moore H, Burton GJ. ELF5-enforced transcriptional networks define an epigenetically regulated trophoblast stem cell compartment in the human placenta. Hum Mol Genet. 2010;19(12):2456–2467. doi: 10.1093/hmg/ddq128. [DOI] [PubMed] [Google Scholar]
- 25.Greber B. When BMP meets FGF. Cell Stem Cell. 2011;9(2):91–92. doi: 10.1016/j.stem.2011.07.004. [DOI] [PubMed] [Google Scholar]
- 26.McMaster MT, et al. Human placental HLA-G expression is restricted to differentiated cytotrophoblasts. J Immunol. 1995;154(8):3771–3778. [PubMed] [Google Scholar]
- 27.Brons IG, et al. Derivation of pluripotent epiblast stem cells from mammalian embryos. Nature. 2007;448(7150):191–195. doi: 10.1038/nature05950. [DOI] [PubMed] [Google Scholar]
- 28.Bendall SC, Stewart MH, Bhatia M. Human embryonic stem cells: Lessons from stem cell niches in vivo. Regen Med. 2008;3(3):365–376. doi: 10.2217/17460751.3.3.365. [DOI] [PubMed] [Google Scholar]
- 29.Arnaoutova I, George J, Kleinman HK, Benton G. Basement membrane matrix (BME) has multiple uses with stem cells. Stem Cell Rev. 2012;8(1):163–169. doi: 10.1007/s12015-011-9278-y. [DOI] [PubMed] [Google Scholar]
- 30.Ludwig TE, et al. Feeder-independent culture of human embryonic stem cells. Nat Methods. 2006;3(8):637–646. doi: 10.1038/nmeth902. [DOI] [PubMed] [Google Scholar]
- 31.Xu C, et al. Feeder-free growth of undifferentiated human embryonic stem cells. Nat Biotechnol. 2001;19(10):971–974. doi: 10.1038/nbt1001-971. [DOI] [PubMed] [Google Scholar]
- 32.Vallier L, et al. Activin/Nodal signalling maintains pluripotency by controlling Nanog expression. Development. 2009;136(8):1339–1349. doi: 10.1242/dev.033951. [DOI] [PMC free article] [PubMed] [Google Scholar]
- 33.Akopian V, et al. International Stem Cell Initiative Consortium Comparison of defined culture systems for feeder cell free propagation of human embryonic stem cells. In Vitro Cell Dev Biol Anim. 2010;46(3-4):247–258. doi: 10.1007/s11626-010-9297-z. [DOI] [PMC free article] [PubMed] [Google Scholar]
- 34.Donadi EA, et al. Implications of the polymorphism of HLA-G on its function, regulation, evolution and disease association. Cell Mol Life Sci. 2011;68(3):369–395. doi: 10.1007/s00018-010-0580-7. [DOI] [PMC free article] [PubMed] [Google Scholar]
- 35.Zhao L, Teklemariam T, Hantash BM. Reassessment of HLA-G isoform specificity of MEM-G/9 and 4H84 monoclonal antibodies. Tissue Antigens. 2012;80(3):231–238. doi: 10.1111/j.1399-0039.2012.01922.x. [DOI] [PubMed] [Google Scholar]
- 36.Apps R, Gardner L, Moffett A. A critical look at HLA-G. Trends Immunol. 2008;29(7):313–321. doi: 10.1016/j.it.2008.02.012. [DOI] [PubMed] [Google Scholar]
- 37.Poláková K, et al. Mild acid treatment induces cross-reactivity of 4H84 monoclonal antibody specific to nonclassical HLA-G antigen with classical HLA class I molecules. Hum Immunol. 2003;64(2):256–264. doi: 10.1016/s0198-8859(02)00777-2. [DOI] [PubMed] [Google Scholar]
- 38.Poláková K, Kuba D, Russ G. The 4H84 monoclonal antibody detecting beta2m free nonclassical HLA-G molecules also binds to free heavy chains of classical HLA class I antigens present on activated lymphocytes. Hum Immunol. 2004;65(2):157–162. doi: 10.1016/j.humimm.2003.10.005. [DOI] [PubMed] [Google Scholar]
- 39.Na J, Furue MK, Andrews PW. Inhibition of ERK1/2 prevents neural and mesendodermal differentiation and promotes human embryonic stem cell self-renewal. Stem Cell Res (Amst) 2010;5(2):157–169. doi: 10.1016/j.scr.2010.06.002. [DOI] [PubMed] [Google Scholar]
- 40.Hyslop L, et al. Downregulation of NANOG induces differentiation of human embryonic stem cells to extraembryonic lineages. Stem Cells. 2005;23(8):1035–1043. doi: 10.1634/stemcells.2005-0080. [DOI] [PubMed] [Google Scholar]
- 41.Rivera-Pérez JA, Magnuson T. Primitive streak formation in mice is preceded by localized activation of Brachyury and Wnt3. Dev Biol. 2005;288(2):363–371. doi: 10.1016/j.ydbio.2005.09.012. [DOI] [PubMed] [Google Scholar]
- 42.Roberts RM, Fisher SJ. Trophoblast stem cells. Biol Reprod. 2011;84(3):412–421. doi: 10.1095/biolreprod.110.088724. [DOI] [PMC free article] [PubMed] [Google Scholar]
- 43.Kidder BL, Palmer S. Examination of transcriptional networks reveals an important role for TCFAP2C, SMARCA4, and EOMES in trophoblast stem cell maintenance. Genome Res. 2010;20(4):458–472. doi: 10.1101/gr.101469.109. [DOI] [PMC free article] [PubMed] [Google Scholar]
- 44.Slagle CE, Aoki T, Burdine RD. Nodal-dependent mesendoderm specification requires the combinatorial activities of FoxH1 and Eomesodermin. PLoS Genet. 2011;7(5):e1002072. doi: 10.1371/journal.pgen.1002072. [DOI] [PMC free article] [PubMed] [Google Scholar]
- 45.Costello I, et al. The T-box transcription factor Eomesodermin acts upstream of Mesp1 to specify cardiac mesoderm during mouse gastrulation. Nat Cell Biol. 2011;13(9):1084–1091. doi: 10.1038/ncb2304. [DOI] [PMC free article] [PubMed] [Google Scholar]
- 46.Arnold SJ, Hofmann UK, Bikoff EK, Robertson EJ. Pivotal roles for eomesodermin during axis formation, epithelium-to-mesenchyme transition and endoderm specification in the mouse. Development. 2008;135(3):501–511. doi: 10.1242/dev.014357. [DOI] [PMC free article] [PubMed] [Google Scholar]
- 47.Chawengsaksophak K, de Graaff W, Rossant J, Deschamps J, Beck F. Cdx2 is essential for axial elongation in mouse development. Proc Natl Acad Sci USA. 2004;101(20):7641–7645. doi: 10.1073/pnas.0401654101. [DOI] [PMC free article] [PubMed] [Google Scholar]
- 48.Tarkowski AK, Suwińska A, Czołowska R, Ożdżeński W. Individual blastomeres of 16- and 32-cell mouse embryos are able to develop into foetuses and mice. Dev Biol. 2010;348(2):190–198. doi: 10.1016/j.ydbio.2010.09.022. [DOI] [PubMed] [Google Scholar]
- 49.Yang L, et al. Human cardiovascular progenitor cells develop from a KDR+ embryonic-stem-cell-derived population. Nature. 2008;453(7194):524–528. doi: 10.1038/nature06894. [DOI] [PubMed] [Google Scholar]
- 50.Schneider MD, Gaussin V, Lyons KM. Tempting fate: BMP signals for cardiac morphogenesis. Cytokine Growth Factor Rev. 2003;14(1):1–4. doi: 10.1016/s1359-6101(02)00053-9. [DOI] [PubMed] [Google Scholar]
- 51.Izumi N, Era T, Akimaru H, Yasunaga M, Nishikawa S. Dissecting the molecular hierarchy for mesendoderm differentiation through a combination of embryonic stem cell culture and RNA interference. Stem Cells. 2007;25(7):1664–1674. doi: 10.1634/stemcells.2006-0681. [DOI] [PubMed] [Google Scholar]
- 52.Winnier G, Blessing M, Labosky PA, Hogan BL. Bone morphogenetic protein-4 is required for mesoderm formation and patterning in the mouse. Genes Dev. 1995;9(17):2105–2116. doi: 10.1101/gad.9.17.2105. [DOI] [PubMed] [Google Scholar]
- 53.Beppu H, et al. BMP type II receptor is required for gastrulation and early development of mouse embryos. Dev Biol. 2000;221(1):249–258. doi: 10.1006/dbio.2000.9670. [DOI] [PubMed] [Google Scholar]
- 54.Ezashi T, Das P, Roberts RM. Low O2 tensions and the prevention of differentiation of hES cells. Proc Natl Acad Sci USA. 2005;102(13):4783–4788. doi: 10.1073/pnas.0501283102. [DOI] [PMC free article] [PubMed] [Google Scholar]
- 55.Rapraeger AC, Guimond S, Krufka A, Olwin BB. Regulation by heparan sulfate in fibroblast growth factor signaling. Methods Enzymol. 1994;245:219–240. doi: 10.1016/0076-6879(94)45013-7. [DOI] [PubMed] [Google Scholar]
- 56.Wiles MV, Johansson BM. Embryonic stem cell development in a chemically defined medium. Exp Cell Res. 1999;247(1):241–248. doi: 10.1006/excr.1998.4353. [DOI] [PubMed] [Google Scholar]
Associated Data
This section collects any data citations, data availability statements, or supplementary materials included in this article.