

Abstract
The purpose of this paper was to examine and compare available data on incidence, mortality and survival for countries in the Asia-Pacific region. Incidence data were obtained from GLOBOCAN 2008, other online data sources and individual cancer registries. Country-specific mortality statistics by individual year were sourced from the World Health Organization Statistical Information System Mortality Database. All incidence and mortality rates were directly age-standardised to the Segi World Standard population and joinpoint models were used to assess trends. Data on survival were obtained from country-specific published reports where available. Approximately 14% (122,000) of all prostate cancers diagnosed worldwide in 2008 were within the Asia-Pacific region (10 per 100,000 population), with three out of every four of these prostate cancer cases diagnosed in either Japan (32%), China (28%) or Australia (15%). There were also about 42,000 deaths due to prostate cancer in the Asia-Pacific region (3 per 100,000). For the nine countries with incidence trend data available, eight showed recent significant increases in prostate cancer incidence. In contrast, recent decreases in prostate cancer mortality have been reported for Australia, Japan and New Zealand, but mortality has increased in several other countries. The lack of population-based data across most of the countries in this region limits the ability of researchers to understand and report on the patterns and distribution of this important cancer. Governments and health planners typically require quantitative evidence as a motivation for change. Unless there is a widespread commitment to improve the collection and reporting of data on prostate cancer it is likely that the burden of prostate cancer will continue to increase. Enhancing knowledge transfer between countries where there are differentials in capacity, policy and experience may provide the necessary impetus and opportunity to overcome at least some of the existing barriers.
Keywords: Prostate neoplasms, Asia-Pacific, Incidence, Mortality, Prostate specific antigen
INTRODUCTION
Previous international reviews of prostate cancer epidemiology have reported high incidence in Western countries, with lower but typically increasing incidence in less developed countries [1–3]. These varying patterns have been partly attributed to the availability of screening using prostate-specific antigen (PSA) to detect asymptomatic tumours, and are also linked to a range of other issues such as diet, genetic, lifestyle and environmental factors [1,2]. There is much uncertainty about the diagnosis and treatment of prostate cancer, with disputed interpretations of the benefits of PSA [4,5]. Furthermore, unlike most other types of cancer, there is no definitive recommendation about the optimum management of this disease once it is diagnosed [6].
The purpose of this study was to examine and compare data on incidence, mortality and survival for countries in the Asia-Pacific region, based on the subregions of Eastern Asia, South-Eastern Asia and Oceania as defined by the World Health Organization [7]. This area comprises about 32% of the world’s male population [8] and includes many nations whose populations are increasing rapidly. With its very heterogeneous mix of cultures, populations and economies, from powerhouses such as Japan, China and Singapore to poorer economies typified by those of Laos and Cambodia, the Asia-Pacific region provides an ideal opportunity to explore these variations together with changing patterns, trends and influences on prostate cancer epidemiology across the different environments.
DATA SOURCES
GLOBOCAN is a database constructed by the World Health Organization (WHO) which contains country-specific estimates of cancer incidence in 2008 for different types of cancer. Data quality within GLOBOCAN varies greatly, from accurate national information obtained from population-based cancer registries to estimates obtained by applying age-specific rates from neighbouring countries. We extracted incidence and mortality estimates for the countries listed in Table 1, in addition to totals for the WHO subregions of Eastern Asia, South-Eastern Asia and Oceania.
Table 1.
Estimated prostate cancer incidence and mortality by country, Asia-Paci c region, 2008
| Region/country | Incidence | Mortality | MR:IR | Male population | Income level | Male life expectancy at birth | Male population 65+ (%) | Incidence data source | ||
|---|---|---|---|---|---|---|---|---|---|---|
|
|
|
|||||||||
| Case | ASRa) | Case | ASRa) | |||||||
| World | 899,102 | 32.8 | 257,887 | 7.4 | 0.23 | 3,399,066 | 67 | 6.5 | ||
| Asia-Pacific | 121,797 | 9.9 | 41,996 | 3.3 | 0.33 | 1,109,648 | 71 | 7.3 | ||
| Eastern Asia | 82,691 | 8.2 | 26,751 | 2.5 | 0.30 | 803,286 | 8.2 | |||
| Oceania | 21,428 | 94.5 | 4,294 | 15.3 | 0.16 | 17,679 | 9.4 | |||
| South-Eastern Asia | 17,678 | 8.3 | 10,951 | 5.1 | 0.61 | 288,683 | 4.8 | |||
| Australia | 17,835 | 105.0 | 3,408 | 15.4 | 0.15 | 10,704 | High | 79 | 12.0 | National incidence data |
| New Zealand | 3,152 | 99.7 | 621 | 15.1 | 0.15 | 2,098 | High | 78 | 11.5 | National incidence data |
| New Caledonia | 78 | 65.7 | 54 | 45.1 | 0.69 | 122 | High | 72 | 7.0 | Local incidence data. No mortality data |
| Brunei | 40 | 39.0 | 6 | 6.1 | 0.16 | 195 | High | 75 | 3.3 | Frequency data |
| Japan | 38,619 | 22.7 | 9,989 | 5.0 | 0.22 | 61,708 | High | 79 | 18.7 | Local incidence data and national mortality data |
| South Korea | 6,382 | 22.4 | 1,204 | 4.1 | 0.18 | 23,794 | High | 77 | 8.4 | National incidence data |
| Singapore | 616 | 20.0 | 125 | 3.9 | 0.20 | 2,406 | High | 78 | 7.9 | National incidence data |
| Malaysia | 821 | 9.2 | 508 | 5.8 | 0.63 | 13,964 | Upper middle | 71 | 4.4 | Local incidence data. No mortality data |
| Thailand | 2,134 | 6.5 | 683 | 2.0 | 0.31 | 33,572 | Upper middle | 70 | 7.7 | Local incidence data. No mortality data |
| China | 33,802 | 4.3 | 14,297 | 1.8 | 0.42 | 689,397 | Upper middle | 71 | 7.3 | Local incidence data and national mortality data |
| Micronesia | 48 | 28.2 | 20 | 11.2 | 0.40 | 266 | Lower middle | 4.3 | National incidence data (Guam) | |
| Fiji | 41 | 17.0 | 32 | 13.7 | 0.81 | 431 | Lower middle | 66 | 4.2 | National incidence data |
| Papua New Guinea | 145 | 11.7 | 114 | 9.7 | 0.83 | 3,340 | Lower middle | 60 | 2.3 | No data (estimated from surrounding countries) |
| Indonesia | 9,033 | 10.6 | 6,841 | 8.0 | 0.75 | 117,235 | Lower middle | 67 | 4.8 | No data (estimated from surrounding countries) |
| Philippines | 2,491 | 10.1 | 1,290 | 5.3 | 0.52 | 45,275 | Lower middle | 65 | 3.0 | Local incidence data and national mortality data |
| Solomon Islands | 10 | 8.8 | 9 | 7.8 | 0.89 | 264 | Lower middle | 65 | 2.9 | No data (estimated from surrounding countries) |
| East Timor | 17 | 7.9 | 14 | 6.6 | 0.84 | 551 | Lower middle | 60 | 2.7 | No data (estimated from surrounding countries) |
| Vanuatu | 3 | 5.1 | 2 | 3.4 | 0.67 | 116 | Lower middle | 68 | 3.4 | National incidence data |
| Laos | 65 | 4.4 | 37 | 2.5 | 0.57 | 3,000 | Lower middle | 65 | 3.4 | No data (estimated from surrounding countries) |
| Viet Nam | 1,208 | 3.2 | 716 | 1.9 | 0.59 | 42,429 | Lower middle | 72 | 5.0 | No data (estimated from surrounding countries) |
| Mongolia | 16 | 2.4 | 10 | 1.5 | 0.63 | 1,317 | Lower middle | 64 | 3.5 | National incidence data |
| Cambodia | 163 | 5.8 | 95 | 3.6 | 0.62 | 6,756 | Low | 60 | 2.6 | Frequency data |
| Myanmar | 1,091 | 5.8 | 636 | 3.2 | 0.55 | 23,302 | Low | 62 | 4.6 | No data (estimated from surrounding countries) |
| North Korea | 237 | 2.3 | 136 | 1.4 | 0.61 | 11,833 | Low | 65 | 6.4 | No data (estimated from surrounding countries) |
| Polynesia | 116 | 48.1 | 34 | 14.1 | 0.29 | 338 | Unknown | 5.1 | National incidence data (Samoa, French Polynesia) | |
| Chinese Taipei | 3,635 | 20.8 | 1,116 | 5.2 | 0.25 | Unknown | National incidence data | |||
Data from GLOBOCAN [7], United Nations Population Division [8], World DataBank [48], World Bank (income level from: http://data.worldbank.org/income-level/NOC). MR:IR, mortality rate:incidence rate ratio; ASR, age standardised rate.
ASR, age standardised rate per 100,000 population, based on the Segi World Standard Population [19].
Annual incidence data used in trend calculations were obtained from either online sources (Country/Cancer Registry statistics or reports [9–12], Cancer Incidence in Five Continents plus [13]), or through contacting individual cancer registries and data custodians (Ministry of Health, New Zealand [14]; Central Cancer Registry, South Korea [15]). Data were obtained by year of diagnosis as either age-standardised incidence rates, or age-specific incidence counts and populations.
Country-specific mortality statistics by individual year are reported by the WHO in the Statistical Information System Mortality Database [16]. Since this database contains only actual data provided by countries, rather than estimated data, there was a smaller list of countries for which mortality trend data was available compared to GLOBOCAN. Furthermore, to enable meaningful analysis, Asia-Pacific countries were only included in our analysis if they had a minimum of 10 years data available and at least 100 prostate cancer deaths each year (averaged over the most recent 5 year period). Under these criteria, Brunei, Malaysia and Fiji were excluded. Mortality data for China could not be included as there was no category for prostate cancer.
Data on survival were obtained from country-specific published reports where available. When presenting this information we acknowledge the limitations associated with comparing survival statistics across varying time periods, data quality, methodologies and clinical characteristics of the patients [17]. For this reason we have focussed more on the broad variation in survival across the Asian-Pacific countries rather than differences in the individual estimates [18]. These statistics were supplemented with the mortality:incidence rate ratio (MR:IR) to provide approximate estimates of survival for each country and to validate the general patterns. Low MR:IR (closer to zero) values indicate high survival, while high MR:IR (closer to one) values correspond to poor survival.
STATISTICAL METHODS
All incidence and mortality rates were directly age-standardised to the Segi World Standard population [19]. Rates are presented for males of all ages, as well as men aged 50 to 79 years, where possible, for consistency with previous studies [20,21]. Trends in prostate cancer incidence and mortality were assessed using a statistical method called Joinpoint analysis [22], which evaluates changing linear trends over successive segments of time. This methodology has been used in several previous studies that assessed changes in population-based trends in prostate cancer incidence or mortality [1,3,21,23–25]. A joinpoint can be considered as the point at which the linear trend changes significantly in terms of either direction or magnitude. To reduce the chance of reporting trends that were due to random fluctuations, we set a minimum of six years between a joinpoint and either end of the data series, with at least four years of data between joinpoints and a maximum of three joinpoints allowed.
PROSTATE CANCER INCIDENCE
Worldwide, nearly 900,000 men (33 per 100,000 population) were estimated to have been diagnosed with prostate cancer during 2008 (Table 1). About 14% (122,000) were diagnosed within the Asia-Pacific region (10 per 100,000), with three out of every four of these prostate cancer cases diagnosed in either Japan (32%), China (28%) or Australia (15%). Incidence rates varied by almost 50-fold across the region, ranging from estimates of between 2 to 3 per 100,000 in North Korea and Mongolia up to 100 per 100,000 in New Zealand and 105 per 100,000 in Australia.
Prostate cancer incidence rates increased with age. In Australia and New Zealand, incidence rates rose sharply after 50 years of age, while in some Asian countries (Japan, Hong Kong, and South Korea) the increase was more pronounced after 60 years of age (Fig. 1).
Fig. 1.
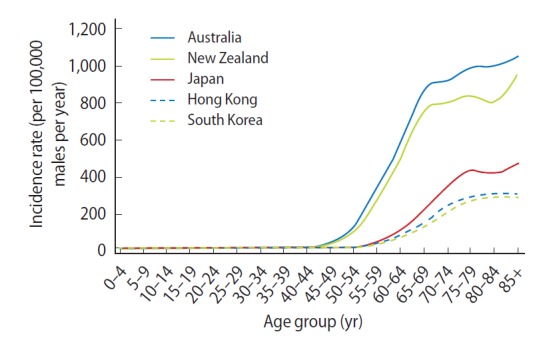
Age-specific incidence rates for prostate cancer, selected countries, 2003–2007. Data from: Australia, Australian Institute of Health and Welfare [9]; Hong Kong, Hong Kong Cancer Registry [10]; Japan, Center for Cancer Control and Information Services [11]; New Zealand, Ministry of Health [14]; South Korea, Korea Central Cancer Registry [15].
Prostate cancer was the sixth most frequently diagnosed cancer among males during 2008 in the Asia-Pacific region, behind cancers of the lung, stomach, liver, colorectum and oesophagus [7]. This pattern was mainly driven by Eastern Asia, and in particular China, which represents about 62% of the region’s male population [8]. However, prostate cancer was the most common male cancer in many parts of Oceania, including Australia, Fiji, New Caledonia and New Zealand, while it ranked second in Brunei, Micronesia, Polynesia and the Solomon Islands [7].
Incidence trends for several countries are shown in Fig. 2 and Table 2. The most recent trend for each of these countries was a significant increase, apart from New Zealand where incidence rates have remained stable since 1995. Of the current trends, the largest rise was in South Korea, where incidence increased by 13% per year for males of all ages during 1999 to 2009, closely followed by Shanghai, with an annual increase of 12% between 1988 to 2002: Australia, Hong Kong, Japan and Singapore (Chinese population only) all recorded recent annual increases of around 6%. Smaller, but still significant, increases in prostate cancer incidence rates were found for males of all ages in the Philippines and Thailand (3% per year increase between 1983–2002 and 1983–2009, respectively). Similar patterns to the overall trends were observed for those countries where annual incidence rates were available for men in the 50–79 age group (Table 2).
Fig. 2.
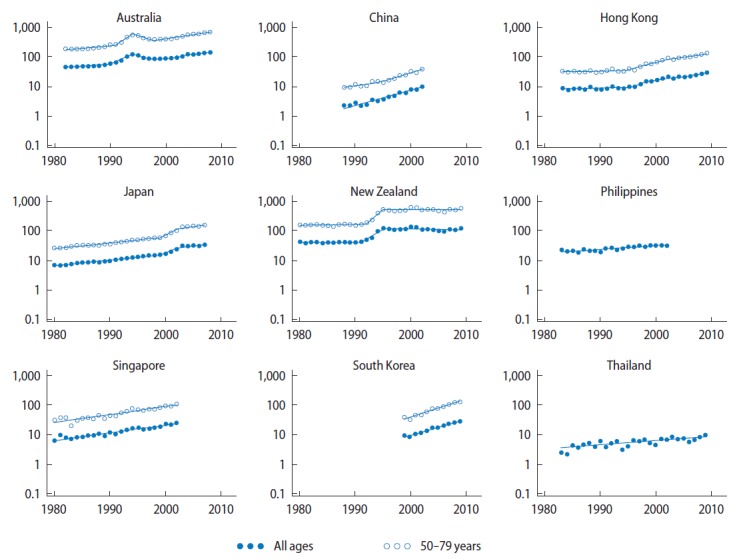
Prostate cancer incidence rate trends for selected Asian-Pacific countries, 1980–2009. Y-axis is shown on a log scale. Rates were age-standardised to the Segi World Standard Population [19], and expressed per 100,000 males. Singapore data was only available for residents of Chinese ethnicity (who comprise the majority of the population but have slightly higher rates of prostate cancer than Malay or Indian residents). Data from: Australia, Australian Institute of Health and Welfare [9]; China, Shanghai Cancer Registry [13]; Hong Kong, Hong Kong Cancer Registry [10]; Japan, Center for Cancer Control and Information Services [11]; New Zealand, Ministry of Health [14]; Philippines, Manila Cancer Registry [13]; Singapore, National Cancer Centre Singapore [13]; South Korea, Korea Central Cancer Registry [15]; Thailand, Chaing Mai Cancer Registry [12,13].
Table 2.
| Country (registry area) | Trend 1
|
Trend 2
|
Trend 3
|
Trend 4
|
||||
|---|---|---|---|---|---|---|---|---|
| Year | APC (95% CI) | Year | APC (95% CI) | Year | APC (95% CI) | Year | APC (95% CI) | |
| All ages | ||||||||
| Australia | 1982–1990 | +2.8e) (+0.7, +4.9) | 1990–1994 | +21.7e) (+13.8, +30.0) | 1994–1998 | −10.0e) (−15.1, −4.6) | 1998–2008 | +6.1e) (+5.2, +6.9) |
| China (Shanghai) | 1988–2002 | +12.2e) (+10.5, +13.8) | ||||||
| Hong Kong | 1983–1995 | +0.8 (−1.1, +2.7) | 1995–1998 | +17.4 (−6.3, +47.2) | 1998–2009 | +5.8e) (+4.8, +6.8) | ||
| Japan | 1980–1999 | +4.4e) (+4.0, +4.8) | 1999–2002 | +19.8e) (+10.3, +30.0) | 2002–2007 | +5.6e) (+4.3, +7.0) | ||
| New Zealand | 1980–1991 | −0.1 (−3.1, +3.0) | 1991–1995 | +30.9e) (+11.7, +53.3) | 1995–2009 | −0.6 (−1.6, +0.5) | ||
| Philippines | 1983–2002 | +2.8e) (+2.0, +3.5) | ||||||
| Singapore (Chinese only)d) | 1980–2002 | +5.9e) (+5.2, +6.6) | ||||||
| South Korea | 1999–2009 | +13.1e) (+11.6, +14.6) | ||||||
| Thailand | 1983–2009 | +3.3e) (+2.2, +4.4) | ||||||
| Ages 50–79 yrc) | ||||||||
| Australia | 1982–1991 | +4.3e) (+2.3, +6.4) | 1991–1994 | +30.7e) (+12.7, +51.5) | 1994–1998 | −10.8e) (−16.6, −4.7) | 1998–2008 | +6.8e) (+5.9, +7.8) |
| China (Shanghai) | 1988–1995 | +6.9e) (+2.2, +11.9) | 1995–2002 | +13.9e) (+10.5, +17.5) | ||||
| Hong Kong | 1983–1994 | +0.8 (−1.5, +3.0) | 1994–2001 | +12.2e) (+8.1, +16.4) | 2001–2009 | +6.5e) (+5.0, +8.1) | ||
| Japan | 1980–1999 | +4.5e) (+4.0, +5.0) | 1999–2002 | +24.8e) (+13.6, +37.0) | 2002–2007 | +6.7e) (+5.2, +8.3) | ||
| New Zealand | 1980–1992 | +1.2 (−1.7, +4.3) | 1992–1995 | +44.4e) (+3.0, +102.4) | 1995–2009 | −0.0 (−1.1, +1.1) | ||
| Singapore (Chinese only)d) | 1980–2002 | +6.3e) (+5.4, +7.2) | ||||||
| South Korea | 1999–2009 | +14.5e) (+12.8, +16.2) | ||||||
Data from: Australia, Australian Institute of Health and Welfare [9]; China, Shanghai Cancer Registry [13]; Hong Kong, Hong Kong Cancer Registry [10]; Japan, Center for Cancer Control and Information Services [11]; New Zealand, Ministry of Health [14]; Philippines, Manila Cancer Registry [13]; Singapore, National Cancer Centre Singapore [13]; South Korea, Korea Central Cancer Registry [15]; Thailand, Chaing Mai Cancer Registry [12,13].
APC, annual percentage change; CI, confidence interval.
Calculated using JoinPoint regression.
Rates were directly age-standardised to the Segi World Standard Population [19].
Data for ages 50–79 years were unavailable for the Philippines and Thailand.
Singapore data was only available for residents of Chinese ethnicity (who comprise the majority of the population but have slightly higher rates of prostate cancer than Malay or Indian residents).
The APC is statistically significant from zero.
PROSTATE CANCER MORTALITY
More than a quarter of a million men (7 per 100,000) were estimated to have died from prostate cancer globally during 2008, including approximately 42,000 deaths (16%) in the Asia-Pacific region at a rate of 3 per 100,000 (Table 1). China accounted for 34% of prostate cancer deaths within the region, followed by Japan (24%) and Indonesia (16%). There was considerable variation in the age-standardised mortality rate for prostate cancer, with mortality in the Oceania subregion 6 times greater than in Eastern Asia, and 3 times greater than in South-Eastern Asia. New Caledonia had the highest country-specific mortality rate in the Asia-Pacific region of 45 deaths per 100,000, however absolute numbers were relatively low.
Prostate cancer accounted for about 2% of all cancer-related deaths in the Asia-Pacific region, ranking eighth compared to deaths due to other types of cancer [7]. However, it was the most common cause of cancer-related deaths in New Caledonia (26%) and the second most common in Australia (15%), New Zealand (14%), Fiji (12%), and Polynesia (10%) [7].
There were recent, significant decreases in prostate cancer mortality of about 2% per year for males of all ages in Australia (1998 to 2006), Japan (2004 to 2010) and New Zealand (1995 to 2008) (Fig. 3, Table 3). In contrast, mortality rates have increased in other countries, by about 1% per year in Singapore (1980–2009) and South Korea (2002–2010), 2% per year in Hong Kong (1980–2009), to larger increases of 7% per year in the Philippines (1992–2008) and 17% per year in Thailand (1994–2006). Similar prostate cancer mortality patterns by country were found for men aged 50 to 79 years (Table 3).
Fig. 3.

Prostate cancer mortality rate trends by age for selected Asian-Pacific countries, 1980–2010. Y-axis is shown on a log scale and expressed per 100,000 males. Rates were age-standardised to the Segi World Standard Population [19]. Data from World Health Organization Mortality Database [16]. Population data for the Philippines and Thailand was obtained from the United Nations [8].
Table 3.
| Country | Trend 1
|
Trend 2
|
Trend 3
|
Trend 4
|
||||
|---|---|---|---|---|---|---|---|---|
| Year | APC (95% CI) | Year | APC (95% CI) | Year | APC (95% CI) | Year | APC (95% CI) | |
| All ages | ||||||||
| Australia | 1980–1994 | +2.1c) (+1.7, +2.4) | 1994–1998 | −4.3c) (−7.3, −1.3) | 1998–2006 | −1.6c) (−2.3, −0.9) | ||
| Hong Kong | 1980–2009 | +2.3c) (+1.7, +2.8) | ||||||
| Japan | 1980–1993 | +3.1c) (+2.6, +3.6) | 1993–1996 | +7.8c) (+1.3, +14.8) | 1996–2004 | +0.4 (−0.3, +1.1) | 2004–2010 | −1.6c) (−2.3, −0.9) |
| New Zealand | 1980–1995 | +1.4c) (+0.6, +2.1) | 1995–2008 | −2.0c) (−2.7, −1.2) | ||||
| Philippines | 1992–2008 | +7.3c) (+6.6, +8.0) | ||||||
| Singapore | 1980–2009 | +1.4c) (+0.3, +2.4) | ||||||
| South Korea | 1985–2002 | +13.8c) (+12.5, +15.1) | 2002–2010 | +1.3c) (+0.0, +2.6) | ||||
| Thailand | 1980–1994 | +2.7 (−4.4, +10.4) | 1994–2006 | +16.6c) (+12.5, +20.8) | ||||
| Ages 50–79 yr | ||||||||
| Australia | 1980–1994 | +1.9c) (+1.5, +2.3) | 1994–1997 | −5.9 (−12.6, +1.4) | 1997–2006 | −2.3c) (−3.0, −1.5) | ||
| Hong Kong | 1980–2009 | +1.6c) (+1.0, +2.2) | ||||||
| Japan | 1980–1993 | +2.6c) (+2.1, +3.0) | 1993–1996 | +5.4 (−1.7, +13.0) | 1996–2005 | +0.2 (−0.4, +0.9) | 2005–2010 | −3.2c) (−4.3, −2.0) |
| New Zealand | 1980–1994 | +0.9 (−0.2, +2.0) | 1994–2008 | −2.1c) (−3.0, −1.1) | ||||
| Philippines | 1992–2008 | +7.0c) (+6.2, +7.8) | ||||||
| Singapore | 1980–2009 | +1.1c) (+0.2, +2.1) | ||||||
| South Korea | 1985–2001 | +11.9c) (+10.0, +13.8) | 2001–2010 | +1.2 (−0.4, +2.8) | ||||
| Thailand | 1980–1997 | +3.1 (−0.2, +6.5) | 1997–2000 | +39.6 (−19.4, +141.9) | 2000–2006 | +11.0c) (+4.3, +18.2) | ||
Data from World Health Organization mortality database [16]. Population data for the Philippines and Thailand obtained from the United Nations [8].
APC, annual percentage change; CI, confidence interval.
Calculated using JoinPoint regression.
Rates were directly age-standardised to the Segi World Standard Population [19].
The APC is statistically significant from zero.
PROSTATE CANCER SURVIVAL
There was a large disparity in the survival prospects of men with prostate cancer throughout the Asia-Pacific region (Table 4). Five-year relative survival estimates of 85% and above were reported in New Zealand, Australia, Japan, Singapore and South Korea. This contrasts with estimated 5-year survival rates of between 30% to 40% in parts of China and Thailand.
Table 4.
Estimates of 5-year relative survival for prostate cancer for selected countries in the Asia-Pacific region
| Country (registry) | Year | Method | Age | Survival categoryb |
|---|---|---|---|---|
| Australia | 2006–2010 | Period | All | High |
| Japan | 2000–2002 | Cohort | 0–99 | High |
| New Zealand | 2008–2009 | Period | 15–99 | High |
| Singaporea) | 2003–2007 | Period | All | High |
| South Korea | 2005–2009 | Period | All | High |
| China (Hong Kong) | 1996–2001 | Cohort | All | Medium |
| China (Shanghai) | 1992–1995 | Cohort | All | Medium |
| China (Tianjin) | 1991–1999 | Cohort | All | Medium |
| Thailand (Lampang) | 1990–2000 | Cohort | All | Medium |
| China (Qidong) | 1992–2000 | Cohort | All | Low |
| Thailand (Chang Mai) | 1993–1997 | Cohort | All | Low |
| Thailand (Songkhla) | 1990–1999 | Cohort | All | Low |
Dara from: Australia, Australian Institute of Health and Welfare [49]; China, Hong Kong, Qidong, Shanghai and Tianjin Cancer Registries [50]; Japan, Center for Cancer Control and Information Services [11]; New Zealand, Ministry of Health [51]; Singapore, Singapore Cancer Registry [52]; South Korea, Ministry of Health and Welfare [53]; Thailand, Chaing Mai, Lampang and Songkhla Cancer Registries [50].
Survival estimate has been age-standardised to the Segi World Standard Population [19].
5-year relative survival estimates were categorised to avoid over-interpretation of differences between country estimates, and defined as follows based on rounded estimates: High, ≥85%; medium, 50% to 84%; low, <50%.
Further evidence supporting these differences in survival is gained from the MR:IR ratio, as shown in Fig. 4. The population-averaged MR:IR ratio was 0.16 in Oceania, 0.30 in Eastern Asia and 0.61 in South-Eastern Asia. The MR:IR values in specific countries ranged from 0.15 in both Australia and New Zealand to over 0.80 in Fiji, Papua New Guinea, East Timor and the Solomon Islands.
Fig. 4.

Prostate cancer incidence, mortality and mortality rate:incidence rate ratio (MR:IR) for Asian-Pacific countries, 2008. Rates were age-standardised to the Segi World Standard Population and expressed per 100,000 males [19]. MR:IR ratio categories were defined based on quintiles. Incidence categories were approximate quintiles, while mortality matched the incidence categories to enable comparison. Data from GLOBOCAN [7].
One of the main prognostic factors for prostate cancer is the stage (or extent and spread) of the disease at diagnosis, with survival outcomes much higher for men diagnosed with localised disease compared with advanced disease. For example in Japan, 5-year relative survival varied from close to 100% for localised disease to 87% for regional disease (cancer that had grown beyond the original tumour to nearby lymph nodes or organs and tissues) and 40% in cases where the cancer had spread to distant lymph nodes or organs [11]. This compares with corresponding 5-year survival estimates from Singapore of 83%, 43% and 23% for localised, regional and distant prostate cancer, respectively [26]. For prostate cancers diagnosed in New South Wales (Australia) between 1999 and 2007, the 5-year survival ranged from 94% for localised cancers, 86% for regional cancers and 17% for distant cancers (personal communication, Dr XQ Yu, Cancer Council NSW).
VARIATION IN PROSTATE CANCER INCIDENCE BETWEEN COUNTRIES
A recent review of the burden of cancer in South East Asian nations [27] did not rank prostate cancer within the seven most important cancers. In contrast, prostate cancer was the most common invasive cancer in Australia and New Zealand [7]. The much lower incidence of prostate cancer in many countries in the Asia-Pacific region compared with more Westernised countries such as Australia and New Zealand may reflect differences in the prevalence of risk factors, such as genetic predisposition, diet, lifestyle or environment, and/or it may be as a result of differing utilisation of screening through PSA testing. Of note is that the higher rates in Australia compared with New Zealand differ from those recently reported by Center and colleagues for 2000–2004 [3] reflecting the differing recent trends in these two countries.
It is unclear whether genetics has a major role, with studies showing that Asians living in the United States have higher incidence rates of prostate cancer than the average rates of Asians living in their native countries, however incidence rates among Asian Americans are still much lower than non-Hispanic White Americans [28]. These and other migrant studies [29,30] that show consistently higher risks of prostate cancer among immigrants and their descendants suggest that the Western lifestyle, particularly in relation to diet, plays an important role in the aetiology of prostate cancer [25].
Another contributing cause of international variation is likely to be the differing prevalence of PSA testing, where the aim is to detect prostate cancer. The increased use of PSA testing can artificially inflate the observed prostate cancer incidence rate because it detects latent, slow growing cancers that may not have become symptomatic otherwise. Therefore it is highly possible that, with lower rates of PSA testing in many Asian countries compared with Australia and New Zealand, much of the observed differential in prostate cancer incidence rates throughout the Asia-Pacific region may be due to differences in PSA testing [2]. Ironically, this contrasts completely in relation to the impact of the implementation of screening for cervical cancer through Pap smear testing, where the intention is to detect precancerous lesions, thus reducing the cancer incidence rate. Cervical cancer is the second most diagnosed cancer in South East Asia, and the third most common cause of cancer deaths, which has been linked in part to a lack of screening [27].
Unfortunately there are only limited data on the prevalence of PSA testing or screening across these countries. In Queensland (Australia) in 2004, 52% of men aged 50 to 75 years reported to have ever had a PSA test [31], while the annual rate of PSA testing in Australia in 2008/09 was between 21,000 and 25,000 tests per 100,000 men (21–25%) aged 50 to 79 years [23]. New Zealand had similar proportions, with 49% of men aged 40 to 74 years reporting having ever had a PSA test, and 22% within the previous 5 years [32]. In Japan the percentage of men over 50 years of age who received PSA screening was estimated to be less than 20% [33]. In South Korea only 15% of men aged over 50 in 2004 reported having been screened during the previous 2 years [34].
However, much of the evidence for limited PSA testing is anecdotal, and based on the stage at which prostate cancers are diagnosed. Since PSA testing aims to detect asymptomatic cancers, it follows that countries with high proportions of prostate cancers that are localised would be more likely have higher rates of PSA testing. There have been calls for increases to PSA testing in several Asia Pacific countries because most of the prostate cancers detected are well advanced with poor prognoses [2,35,36]. Prostate cancer in Malaysia and rural China is typically a disease diagnosed at a more advanced stage at diagnosis [35,36]. In Malaysia, for example, one institutional study found over half of prostate cancers were already at Stage 4 [36] compared with less than 20% in Japan [11]. This was also evidenced in the data we have presented, with higher rates of 5-year survival and much lower values for MR:IR in Australia, New Zealand, and Japan compared to many other countries in the Asia-Pacific region.
INCREASING PROSTATE CANCER INCIDENCE
In addition to the wide variations in incidence rates across countries, the epidemiology of prostate cancer in the Asia-Pacific region is characterised by a generally increasing incidence burden, something also seen in many northern and western European countries [3]. There are several potential explanations for this trend in the Asia-Pacific region.
While the exact causes of prostate cancer are unclear, as already mentioned there is suggestive evidence for an impact of Western lifestyle. Many countries in the Asia-Pacific have experienced a shift from traditional high fibre and carbohydrate diets based on vegetable foods to a westernised diet that centres around red or processed meat with high total and saturated fat content [25,37,38]. This shift has been typically motivated by strong economic growth and the resulting increases in average family incomes. Unfortunately this changing diet with its increased energy intake has been accompanied by lower levels of physical activity, leading to an increased prevalence of persons who are overweight or obese [25]. The World Cancer Research Fund and American Institute for Cancer Research estimated that 16% of prostate cancers could be prevented worldwide if the exposures of poor nutrition and diet, physical inactivity and obesity were eliminated, while leaving other risk factors unchanged [39].
As our results demonstrate, the majority of prostate cancer cases are diagnosed between 50–79 years of age. The age distribution of a population therefore has a major influence on the absolute numbers of men diagnosed with prostate cancer. Given that life expectancy is expected to increase markedly in many parts of Asia over coming years [27,40,41], the burden of prostate cancer in this region is likely to be a high priority in the future [42].
PSA testing is also likely to have an important influence on the increasing incidence of prostate cancer. As prostate cancer becomes more common it leads to greater public awareness, which in turn prompts asymptomatic men to request PSA testing while also stimulating general practitioners to utilise it as a screening tool [41]. Indeed, the increasing incidence of prostate cancer in Singapore has been suggested to be due to more widespread, although still ad hoc, use of PSA testing [40].
At the same time, it is increasingly recognised that testing of asymptomatic men with the PSA test is resulting in over diagnosis of the disease due to the detection of cancers that are not clinically significant [43], prompting one commentator to note that “limiting the extent of PSA testing would be one of the means to reduce the prevalence of prostate cancer” [44]. While this may hold some truth, mortality rates are also increasing in several countries in the Asia-Pacific along with increasing incidence rates, which suggests that at least some of the increasing incidence is related to tumours that have the capacity to progress.
VARIATION IN PROSTATE CANCER MORTALITY TRENDS BETWEEN COUNTRIES
Stark differences in prostate cancer mortality trends in the Asia-Pacific region were found between more developed countries (Australia, New Zealand, and Japan), where mortality has begun to significantly decrease, as opposed to less developed countries such as the Philippines and Thailand where large increases in mortality over recent years have been observed.
The reasons for this variation are likely to be multifaceted. Refinements to treatment and management of early stage prostate cancers [45] and easier access to these treatments in more developed countries would be one of the main drivers. PSA testing may also be involved in terms of increasing the proportion of cases where the disease is treatable [46], although opinion remains divided on the ability of screening to reduce mortality [4,5]. The fact that incidence rates are generally continuing to increase in those countries where mortality rates are decreasing suggests against a change in the prevalence of risk factors for prostate cancer being a contributing element [47].
CONCLUSION
Prostate cancer in the Asia-Pacific region is characterised by wide variations in incidence and mortality, combined with evidence of an increasing burden of incidence in many areas. The lack of population-based data across most of the countries in this region limits the ability of researchers to understand and report on the patterns and distribution of this important cancer. Potential solutions will require a long-term commitment, and involve the implementation of registration and reporting mechanisms that currently may not be feasible. However governments and health planners typically require quantitative evidence as a motivation for change. Unless there is a widespread commitment to improve the collection and reporting of data on prostate cancer, including the provision of international assistance, it is likely that the burden of prostate cancer will continue to increase. Enhancing knowledge transfer from country to country where there are differentials in capacity, policy and experience may provide the necessary impetus and opportunity to overcome at least some of the existing barriers.
Acknowledgments
Peter Baade is supported by an NHMRC Career Development Fellowship (1005334).
Footnotes
CONFLICT OF INTEREST
No potential conflict of interest relevant to this article was reported.
REFERENCES
- 1.Baade PD, Youlden DR, Krnjacki LJ. International epidemiology of prostate cancer: geographical distribution and secular trends. Mol Nutr Food Res. 2009;53:171–84. doi: 10.1002/mnfr.200700511. [DOI] [PubMed] [Google Scholar]
- 2.Zhang L, Yang BX, Zhang HT, Wang JG, Wang HL, Zhao XJ. Prostate cancer: an emerging threat to the health of aging men in Asia. Asian J Androl. 2011;13:574–8. doi: 10.1038/aja.2010.126. [DOI] [PMC free article] [PubMed] [Google Scholar]
- 3.Center MM, Jemal A, Lortet-Tieulent J, Ward E, Ferlay J, Brawley O, et al. International variation in prostate cancer incidence and mortality rates. Eur Urol. 2012;61:1079–92. doi: 10.1016/j.eururo.2012.02.054. [DOI] [PubMed] [Google Scholar]
- 4.Ilic D, O’Connor D, Green S, Wilt TJ. Screening for prostate cancer: an updated Cochrane systematic review. BJU Int. 2011;107:882–91. doi: 10.1111/j.1464-410X.2010.10032.x. [DOI] [PubMed] [Google Scholar]
- 5.Loeb S, Catalona WJ. Prostate-specific antigen screening: pro. Curr Opin Urol. 2010;20:185–8. doi: 10.1097/MOU.0b013e3283384047. [DOI] [PMC free article] [PubMed] [Google Scholar]
- 6.Wilt TJ, MacDonald R, Rutks I, Shamliyan TA, Taylor BC, Kane RL. Systematic review: comparative effectiveness and harms of treatments for clinically localized prostate cancer. Ann Intern Med. 2008;148:435–48. doi: 10.7326/0003-4819-148-6-200803180-00209. [DOI] [PubMed] [Google Scholar]
- 7.International Agency for Research on Cancer (IARC) Ferlay J, Shin HR, Bray F, Forman D, Mathers C, Parkin DM. GLOBOCAN 2008 ver. 2.0. Cancer incidence and mortality worldwide: IARC CancerBase No. 10 [Internet] Lyon: IARC; c2010. [cited 2012 Jul 12]. Available from: http://globocan.iarc.fr. [Google Scholar]
- 8.United Nations Department of Economic and Social Affairs, Population Division . World population prospects: the 2010 revision [CD-ROM] New York: United Nations; 2011. [Google Scholar]
- 9.Australian Institute of Health and Welfare (AIHW) Australian Cancer Incidence and Mortality (ACIM) books [Internet] Canberra: AIHW; c2013. [cited 2012 Jul 11]. Available from: http://www.aihw.gov.au/acim-books/. [Google Scholar]
- 10.Hospital Authority . Hong Kong Cancer Registry [Internet] Hong Kong: Hong Kong Cancer Registry; [cited 2012 Jul 12]. Available from: http://www3.ha.org.hk/cancereg/statistics.html. [Google Scholar]
- 11.Center for Cancer Control and Information Services . Cancer statistics in Japan [Internet] [Tokyo]: Center for Cancer Control and Information Services; c2010. [2012 Jul 11]. Available from: http://ganjoho.jp/pro/statistics/en/table_download.html. [Google Scholar]
- 12.Chiang Mai Cancer Registry . Chiang Mai Cancer Registry annual reports [Internet] Chiang Mai: Chiang Mai Cancer Registry; [cited 2012 Jul 11]. Available from: http://www.med.cmu.ac.th/hospital/tumor/report.html. [Google Scholar]
- 13.International Agency for Research on Cancer (IARC) Ferlay J, Parkin DM, Curado MP, Bray F, Edwards B, Shin HR, et al. Cancer incidence in five continents, volumes I to IX: IARC CancerBase No. 9 [Internet] Lyon: International Agency for Research on Cancer; c2010. [cited 2012 Jul 9]. Available from: http://ci5.iarc.fr. [Google Scholar]
- 14.Ministry of Health . Prostate cancer in New Zealand custom tabulation, 1948–2009. Wellington: Ministry of Health; 2012. [Google Scholar]
- 15.National Cancer Control Institute . Prostate cancer incidence in South Korea custom tabulation, 1999–2009. Goyang: National Cancer Control Institute; 2012. [Google Scholar]
- 16.World Health Organization (WHO) WHO mortality data and statistics (released 9 July 2012) [Internet] Geneva: WHO; c2010. [cited 2012 Oct 17]. Available from: http://www.who.int/healthinfo/statistics/mortality/en/index.html. [Google Scholar]
- 17.Autier P, Boniol M, Hery C, Masuyer E, Ferlay J. Cancer survival statistics should be viewed with caution. Lancet Oncol. 2007;8:1050–2. doi: 10.1016/S1470-2045(07)70354-6. [DOI] [PubMed] [Google Scholar]
- 18.Parkin DM, Bray F, Ferlay J, Pisani P. Global cancer statistics, 2002. CA Cancer J Clin. 2005;55:74–108. doi: 10.3322/canjclin.55.2.74. [DOI] [PubMed] [Google Scholar]
- 19.Segi M. Cancer mortality for selected sites in 24 countries (1950–57) Sendai: Department of Public Health, Tohoku University of Medicine; 1960. [Google Scholar]
- 20.Oliver SE, May MT, Gunnell D. International trends in prostate-cancer mortality in the “PSA ERA”. Int J Cancer. 2001;92:893–8. doi: 10.1002/ijc.1260. [DOI] [PubMed] [Google Scholar]
- 21.Baade PD, Coory MD, Aitken JF. International trends in prostate-cancer mortality: the decrease is continuing and spreading. Cancer Causes Control. 2004;15:237–41. doi: 10.1023/B:CACO.0000024212.66334.26. [DOI] [PubMed] [Google Scholar]
- 22.National Cancer Institute . Joinpoint regression program, version 3.0 [Internet] Bethesda: National Cancer Institute; c2013. [cited 2012 Jul 11]; Available from: http://surveillance.cancer.gov/joinpoint/. [Google Scholar]
- 23.Baade PD, Youlden DR, Coory MD, Gardiner RA, Chambers SK. Urban-rural differences in prostate cancer outcomes in Australia: what has changed? Med J Aust. 2011;194:293–6. doi: 10.5694/j.1326-5377.2011.tb02977.x. [DOI] [PubMed] [Google Scholar]
- 24.Coory M, Baade P. Mortality from prostate cancer is decreasing. Med J Aust. 2002;176:354–5. doi: 10.5694/j.1326-5377.2002.tb04446.x. [DOI] [PubMed] [Google Scholar]
- 25.Zhang J, Dhakal IB, Zhao Z, Li L. Trends in mortality from cancers of the breast, colon, prostate, esophagus, and stomach in East Asia: role of nutrition transition. Eur J Cancer Prev. 2012;21:480–9. doi: 10.1097/CEJ.0b013e328351c732. [DOI] [PubMed] [Google Scholar]
- 26.Wong CS, Chow KY, Lim GH, Bhalla V, Lee HP, Chia KS. Cancer survival in Singapore, 1968–2002. Singapore: Singapore Cancer Registry; 2009. [PubMed] [Google Scholar]
- 27.Kimman M, Norman R, Jan S, Kingston D, Woodward M. The burden of cancer in member countries of the Association of Southeast Asian Nations (ASEAN) Asian Pac J Cancer Prev. 2012;13:411–20. doi: 10.7314/apjcp.2012.13.2.411. [DOI] [PubMed] [Google Scholar]
- 28.McCracken M, Olsen M, Chen MS, Jr, Jemal A, Thun M, Cokkinides V, et al. Cancer incidence, mortality, and associated risk factors among Asian Americans of Chinese, Filipino, Vietnamese, Korean, and Japanese ethnicities. CA Cancer J Clin. 2007;57:190–205. doi: 10.3322/canjclin.57.4.190. [DOI] [PubMed] [Google Scholar]
- 29.Tominaga S. Cancer incidence in Japanese in Japan, Hawaii, and western United States. Natl Cancer Inst Monogr. 1985;69:83–92. [PubMed] [Google Scholar]
- 30.Yu H, Harris RE, Gao YT, Gao R, Wynder EL. Comparative epidemiology of cancers of the colon, rectum, prostate and breast in Shanghai, China versus the United States. Int J Epidemiol. 1991;20:76–81. doi: 10.1093/ije/20.1.76. [DOI] [PubMed] [Google Scholar]
- 31.Carriere P, Baade P, Newman B, Aitken J, Janda M. Cancer screening in Queensland men. Med J Aust. 2007;186:404–7. doi: 10.5694/j.1326-5377.2007.tb00973.x. [DOI] [PubMed] [Google Scholar]
- 32.National Screening Advisory Committee and Ministry of Health . Prevalence of opportunistic prostate cancer screening in New Zealand: a report for the National Screening Advisory Committee. Wellington: Ministry of Health; 2010. [Google Scholar]
- 33.Namiki M, Akaza H, Lee SE, Song JM, Umbas R, Zhou L, et al. Prostate Cancer Working Group report. Jpn J Clin Oncol. 2010;40(Suppl 1):i70–5. doi: 10.1093/jjco/hyq130. [DOI] [PubMed] [Google Scholar]
- 34.Park SK, Sakoda LC, Kang D, Chokkalingam AP, Lee E, Shin HR, et al. Rising prostate cancer rates in South Korea. Prostate. 2006;66:1285–91. doi: 10.1002/pros.20419. [DOI] [PubMed] [Google Scholar]
- 35.Shao Q, Ouyang J, Fan Y, Xie J, Zhou J, Wu J, et al. Prostate cancer in the senior men from rural areas in east district of China: contemporary management and 5-year outcomes at multi-institutional collaboration. Cancer Lett. 2012;315:170–7. doi: 10.1016/j.canlet.2011.09.035. [DOI] [PubMed] [Google Scholar]
- 36.Hong GE, Kong CH, Singam P, Cheok LB, Zainuddin ZM, Azrif M. Seven-year review of prostate carcinomas diagnosed by TRUS biopsy in a single Malaysian institution. Asian Pac J Cancer Prev. 2010;11:1351–3. [PubMed] [Google Scholar]
- 37.Jung KW, Shin HR, Kong HJ, Park S, Won YJ, Choi KS, et al. Long-term trends in cancer mortality in Korea (1983–2007): a joinpoint regression analysis. Asian Pac J Cancer Prev. 2010;11:1451–7. [PubMed] [Google Scholar]
- 38.Astrup A, Dyerberg J, Selleck M, Stender S. Nutrition transition and its relationship to the development of obesity and related chronic diseases. Obes Rev. 2008;9(Suppl 1):48–52. doi: 10.1111/j.1467-789X.2007.00438.x. [DOI] [PubMed] [Google Scholar]
- 39.World Cancer Research Fund and American Institute for Cancer Research . Food, nutrition, physical activity, and the prevention of cancer: a global perspective. Washington DC: AICR; 2007. [Google Scholar]
- 40.Lim GH, Chow KY, Lee HP. Singapore cancer trends in the last decade. Singapore Med J. 2012;53:3–9. [PubMed] [Google Scholar]
- 41.Byun SS, Lee S, Lee SE, Lee E, Seo SI, Lee HM, et al. Recent changes in the clinicopathologic features of Korean men with prostate cancer: a comparison with Western populations. Yonsei Med J. 2012;53:543–9. doi: 10.3349/ymj.2012.53.3.543. [DOI] [PMC free article] [PubMed] [Google Scholar]
- 42.Extermann M. Geriatric oncology: an overview of progresses and challenges. Cancer Res Treat. 2010;42:61–8. doi: 10.4143/crt.2010.42.2.61. [DOI] [PMC free article] [PubMed] [Google Scholar]
- 43.Klotz L. Cancer overdiagnosis and overtreatment. Curr Opin Urol. 2012;22:203–9. doi: 10.1097/MOU.0b013e32835259aa. [DOI] [PubMed] [Google Scholar]
- 44.Bray F, Ren JS, Masuyer E, Ferlay J. Global estimates of cancer prevalence for 27 sites in the adult population in 2008. Int J Cancer. 2013;132:1133–45. doi: 10.1002/ijc.27711. [DOI] [PubMed] [Google Scholar]
- 45.Jani AB, Hellman S. Early prostate cancer: clinical decision-making. Lancet. 2003;361:1045–53. doi: 10.1016/S0140-6736(03)12833-4. [DOI] [PubMed] [Google Scholar]
- 46.Paquette EL, Sun L, Paquette LR, Connelly R, Mcleod DG, Moul JW. Improved prostate cancer-specific survival and other disease parameters: impact of prostate-specific antigen testing. Urology. 2002;60:756–9. doi: 10.1016/s0090-4295(02)01960-x. [DOI] [PubMed] [Google Scholar]
- 47.Damber JE. Decreasing mortality rates for prostate cancer: possible role of hormonal therapy? BJU Int. 2004;93:695–701. doi: 10.1111/j.1464-410X.2003.04713.x. [DOI] [PubMed] [Google Scholar]
- 48.World databank . World development indicators. Washington, DC: World Bank; 2012. [Google Scholar]
- 49.Australian Institute of Health and Welfare . Cancer survival and prevalence in Australia: period estimates from 1982 to 2010, in Cancer Series no. 69. Cat. no. CAN 65. Canberra: AIHW; 2012. [DOI] [PubMed] [Google Scholar]
- 50.International Agency for Research on Cancer (IARC) Sankaranarayanan R, Lucas E, Swaminathan R. Cancer survival in Africa, Asia, Caribbean and Central America: database and attributes [Internet] Lyon: IARC; c2013. [2012 Jul 13]. Available from: http://survcan.iarc.fr/survivalchap4.php. [PubMed] [Google Scholar]
- 51.Ministry of Health . Cancer patient survival change over time update: covering the period 1994 to 2009. Wellington: Ministry of Health; 2012. [Google Scholar]
- 52.Singapore Cancer Registry . Cancer survival in Singapore 1968–2007. Singapore: Cancer Registry; 2011. [Google Scholar]
- 53.Ministry of Health and Welfare . Annual report of cancer statistics in Korea in 2009. Seoul: Ministry of Health and Welfare; 2011. [Google Scholar]