

Abstract
Interest in neuromyelitis optica (NMO) has increased substantially over the last few years, but it is not known whether NMO has the same geographic and temporal variations in disease risk as multiple sclerosis (MS). We aimed to evaluate the worldwide incidence and prevalence of NMO through a systematic review of published peer-reviewed studies. We performed a search of the English-language literature using MEDLINE and EMBASE from January 1985 to March 2012. Search terms included “neuromyelitis optica,” “Devic's,” “opticospinal,” “incidence,” “prevalence,” and “epidemiology.” We assessed study quality using a standardized instrument. A total of five studies met the inclusion criteria. Three of the studies were from North America, and all studies were published between 2005 and 2012. All studies were of good quality, but only one study reported standardized rates, and subgroup-specific estimates were rarely reported. The incidence of NMO per 100,000 population ranged from 0.053 to 0.40, while the prevalence per 100,000 population ranged from 0.52 to 4.4. Heterogeneity was high among the incidence (I2 = 68.0%) and prevalence studies (I2 = 94.0%). This review highlights the limited knowledge regarding the epidemiology of NMO and the importance of obtaining estimates standardized to common populations to enhance comparability of studies from different jurisdictions. Future studies would also benefit from reporting age-, sex-, and race- or ethnicity-specific estimates.
Like multiple sclerosis (MS), neuromyelitis optica (NMO) is a demyelinating disease of the central nervous system, but it differs from MS in important ways. NMO is a monophasic or relapsing-remitting disorder predominantly characterized by optic neuritis and transverse myelitis.1 Although it may be misdiagnosed as MS because of its overlapping clinical symptoms of optic neuritis and transverse myelitis, it can usually be distinguished from MS on the basis of several features, including transverse myelitis presenting with longitudinally extensive spinal cord lesions; a tendency to spare the brain, but when the brain is affected, the presence of magnetic resonance imaging (MRI) lesions atypical for MS2; and frequent association with seropositivity for NMO IgG (IgG antibody to aqua-porin-4).3 It appears to overlap with the “opticospinal MS” described in Asia, which is also characterized by predominant involvement of the optic nerves and spinal cord, although whether they represent the same entity is somewhat controversial.3,4
In clinic-based studies, a relative excess of nonwhites has been consistently recognized among patients with NMO compared with MS,5,6 suggesting that the geographic distribution of NMO as measured by incidence and prevalence may differ from that of MS. Despite rapidly growing interest, the epidemiology of NMO remains poorly characterized. We aimed to evaluate the worldwide incidence and prevalence of NMO through a systematic review.
Methods
Identification of Studies
The search strategy for identifying studies of the prevalence and incidence of NMO was developed by the senior author (RAM), who has expertise in neurology and clinical epidemiology. On March 19, 2012, the medical literature was searched for the period between January 1985 and the third week of March 2012 using MEDLINE and the broad subject headings “neuromyelitis optica” or “opticospinal” or “Devic's,” and studies of incidence or prevalence or epidemiology. Using the same strategy, we also searched EMBASE, because searches of one database may provide incomplete results. Finally, we searched the reference lists of all relevant articles and of all review articles to identify additional potentially relevant studies. We included studies that reported the incidence or prevalence of NMO or both anywhere in the world, published in English, from January 1, 1985, to March 19, 2012. This time limit was chosen in part because the introduction of MRI in or around 1985 substantially influenced the diagnosis of demyelinating disorders and reliability of cases included in prevalence and incidence studies. We repeated the search on August 1, 2012, and identified one additional study.
Inclusion and Exclusion Criteria
To be eligible for this review, studies had to report incidence or prevalence data, be population-based, and include original data. We excluded data presented only in posters, abstracts, or presentations, and genetic epidemiological studies evaluating the prevalence of NMO in family members of affected persons. Two reviewers (RAM, CG) independently screened each title and abstract for relevance based on the inclusion criteria. If relevance could not be confirmed on the basis of the title and abstract, the reviewers screened the full text of the article. Any articles identified by hand searches of relevant articles or review articles were subjected to the same inclusion and exclusion criteria and the same screening process.
Data Extraction
One reviewer (CG) abstracted data using standardized fields, including study location, prevalence day, sources used for case ascertainment, diagnostic criteria used (including whether NMO IgG antibody status was reported), how diagnostic criteria were assessed, and the ethnic group for which data were collected. For incidence and prevalence we recorded the crude and standardized values (if available) for the population overall and by sex (if available). We also recorded incidence or prevalence reported in ethnic subgroups. The data extraction was verified by the second reviewer (RAM).
Quality Assessment
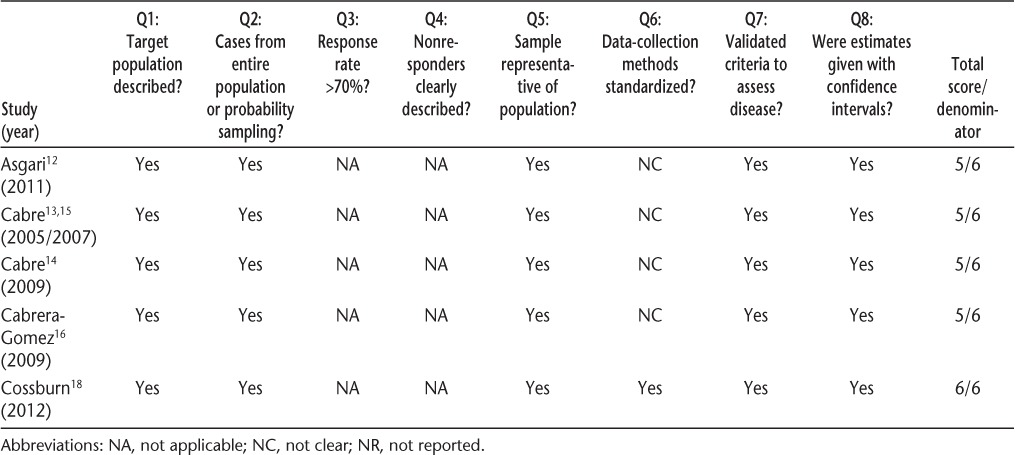
Both reviewers independently completed a quality review for each study that met the study eligibility criteria. Quality of included studies was evaluated using a quality assessment tool adapted from another systematic review of incidence and prevalence.7 Each study was given a quality score of up to 8 points, with 1 point allocated for each affirmative answer to the following questions8: 1) Was the target population clearly described? 2) Were cases ascertained either by survey of the entire population or by probability sampling? 3) Was the response rate above 70%? 4) Were the nonresponders clearly described? 5) Was the sample representative of the population? 6) Were data-collection methods standardized? 7) Were validated criteria used to assess the presence/absence of disease? 8) Were the estimates of prevalence or incidence given with confidence intervals? For studies based solely on health administrative (health) data, reviewers were asked to mark “yes” for questions 3, 4, 5, and 6; for studies that used multiple sources of ascertainment, reviewers were asked to mark “not applicable” for questions 3 and 4, and quality was thus scored out of 6.7
Using a Microsoft Excel spreadsheet (Microsoft, Redmond, WA),9 we tested heterogeneity across studies using the I2 statistic, a statistic describing the proportion of variation in point estimates due to heterogeneity between studies rather than to sampling error. An I2 of less than 25% indicates low heterogeneity, while values of 25% to 50% indicate moderate heterogeneity and values of greater than 50% indicate high heterogeneity.10,11
Results
The initial search resulted in 133 unique citations, and 3 additional potentially relevant studies were identified by hand searches of the reference lists of relevant papers and reviews (Figure 1). Four studies met the inclusion criteria, of which three were from North America.12–16 Data from one of the studies were reported in two articles, which were treated as a single study.13,15 Some of the cases reported in those two articles had already been reported in an earlier study, which was not reviewed separately either.17 One additional study was identified by repeating the search on August 1, 2012,18 for a final total of five studies. Studies were published between 2005 and 2012 (Table 1).
Figure 1.
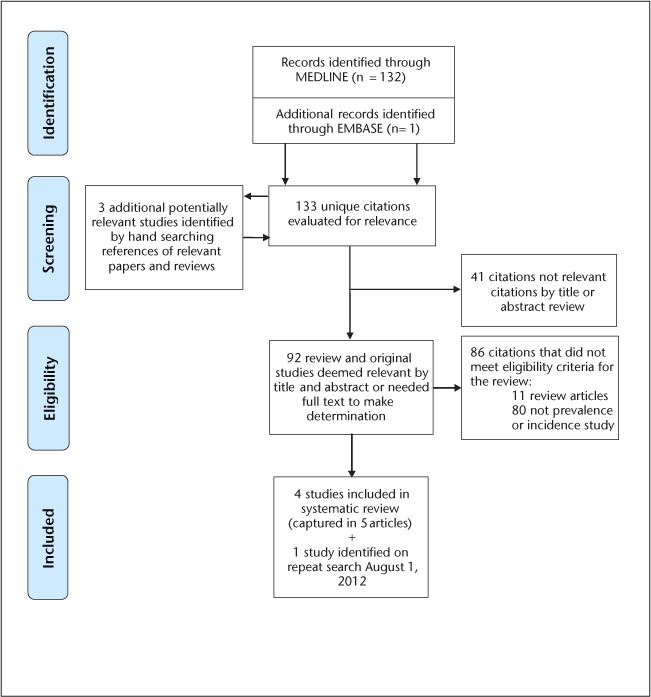
Systematic review of incidence and prevalence of neuromyelitis optica, January 1, 1985–March 19, 2012
Table 1.
Prevalence and incidence studies of neuromyelitis optica
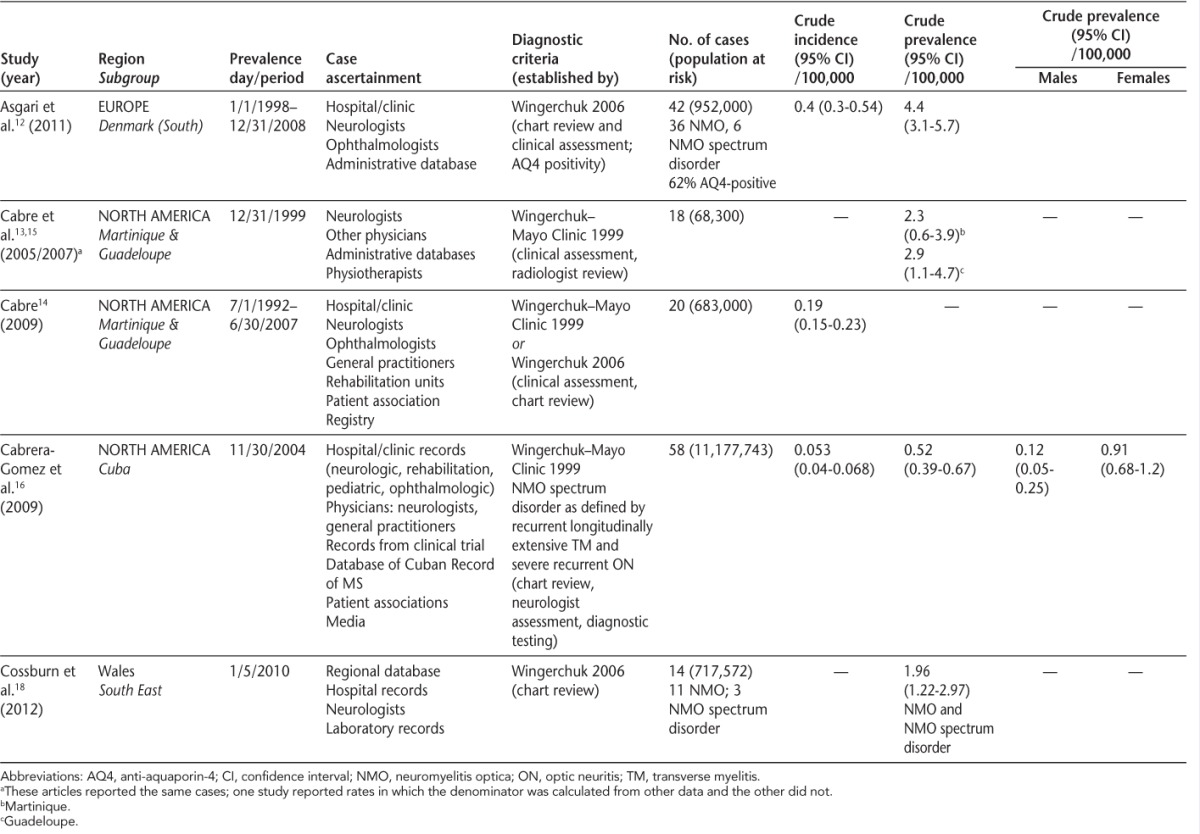
The ascertainment of cases of NMO was similar in all studies, generally using multiple data sources (Table 1). The criteria used to verify the diagnosis of NMO changed over time. The first two studies used those proposed by Wingerchuk in 1999,19 while the most recent study used the 2006 Wingerchuk criteria,1 and the fourth study used both. The diagnosis was confirmed based on chart review (n = 2), or chart review and clinical assessment (n = 3). The two most recent studies considered the presence of antibodies to aquaporin-4 as part of the diagnostic evaluation, consistent with the relatively recent availability of this serologic test.3
Quality of the studies was similar (Table 2). Only the most recent study was explicit as to whether the assessments of potential cases were standardized, although it is likely that some of the assessments were standardized in other studies. Only one study reported incidence or prevalence estimates that were standardized to a reference population.14 Further, only one study formally reported age-, sex-, or ethnicity-specific prevalence estimates.16
Table 2.
Quality assessment scores of neuromyelitis optica incidence and prevalence studies
Incidence
Three studies reported the unadjusted incidence of NMO12,14,16; per 100,000 population it was highest in Denmark at 0.40 and lowest in Cuba at 0.053. In Denmark the population was predominantly white (>99%).12 In Cuba, the population included whites of predominantly Spanish origin, blacks, and people of mixed ancestry. Incidence was similar across ethnic groups, being 0.044 (0.030–0.062) among whites, 0.799 (0.366–1.516) among blacks, and 0.075 (0.044–0.118) among those of mixed ancestry. Within Cuba the incidence varied from 0.12 (0.0–0.4) in the province of Granma to 1.76 (0.5–3.1) in Havana.16 No consistent geographic pattern was observed with respect to the variation in incidence. In the French West Indies, in the only study that reported incidence rates over more than one time period, the age- and sex-standardized incidence did not change from the period 1992–1997 (0.22; 0.06–0.38) to 1997–2002 (0.18; 0.04–0.32) to 2002–2007 (0.20; 0.05–0.35). Heterogeneity among the studies (I2) was high at 68.0%; thus a meta-analysis was not performed.
Prevalence
Four studies reported the prevalence of NMO (per 100,000 population).12,13,16,18 Similarly to the incidence studies, the prevalence was lowest in Cuba at 0.52 (0.39–0.67) and highest in south Denmark at 4.4 (3.1–5.7). In Cuba, the female:male prevalence ratio was 7.5:1,16 while in Wales it was 6:1 and in Denmark it was 2.8:1.12 An earlier publication from the French West Indies,17 which included some of the cases later reported in 2005 and 2007, indicated that all NMO cases were in women. In Wales, all individuals with NMO were white; the female:male ratio was 4.5:1 for NMO cases only and 6:1 for NMO and NMO spectrum disorder cases.18 In Cuba, the only region where age-specific prevalence estimates were reported, the peak prevalence was among people aged 40–49 years (1.22; 0.72–1.92).16 Heterogeneity among the studies (I2) was high at 94.0%; thus a meta-analysis was not performed.
Discussion
The term neuromyelitis optica was first used in 1894 by Devic, although the first reported cases were described in 1870.20 After this initial description, the number of articles published on this disease remained relatively small, with fewer than 10 per year until 2000. In 2004, the first report of an antibody (NMO IgG) that distinguished NMO from MS was published.3 Following this, there was a sharp rise in the number of publications related to NMO, with 203 identified using a simple key word search for the first 8 months of 2012. Despite this rising interest, the epidemiology of NMO remains poorly characterized.6 Between October 1972 and October 1973, a national survey of demyelinating disorders was conducted in Japan, which estimated the prevalence of NMO to be 0.32 per 100,000 population.21 However, that study used a more limited definition of NMO than the studies in this review, and some cases of NMO may have been misclassified as opticospinal MS. We uncovered only five subsequent population-based studies that reported the incidence or prevalence or both of NMO, covering only four geographic areas. These studies suggest that the incidence of NMO is very low, consistent with series suggesting that NMO represents less than 1.5% of individuals with demyelinating disorders.22,23 Even in southern Denmark, with the highest reported incidence, only 4 new cases would be diagnosed per 1,000,000 people per year.12
The geographic variations in the incidence and prevalence of MS have been intensively studied, both between regions and within small regions.24 In the absence of estimates that used the same diagnostic criteria and that were standardized to a common reference population, such as the world population, or of age- and sex-specific estimates, we cannot draw valid conclusions regarding geographic variations in the incidence or prevalence of NMO between regions. In Cuba, however, evidence existed of variations in disease risk over small distances. This is consistent with findings for MS in several regions, including Italy, Sweden, and Ireland.25–27
Evidence supports an increased risk of MS in certain racial (white) and ethnic (Scandinavian and Scottish) groups, and resistance among others, including African Americans, Asians, and Maori.5,28,29 Clinic-based series have suggested that the risk of NMO is higher among nonwhites than whites.5 In Cuba, there was no difference in incidence of NMO by racial group. Further population-based study is needed to firmly establish whether race is associated with the risk of developing NMO, with the caveat that populations classified according to race remain heterogeneous; ethnic and socioeconomic factors relevant to the risk of NMO may covary with race as well.30
All of the prevalence studies evaluated found that women were affected more often than men, although only one study reported sex-specific prevalence estimates. This is consistent with observations from clinic-based series that have reported female:male ratios ranging from 1.2:1 to 8:1.22,31–33 Systematic reviews of the incidence of MS suggest that the female:male ratio is rising over time,34 but data are inadequate to assess whether such changes are occurring in NMO. Development of surveillance systems to evaluate such changes in NMO would be valuable, because if present, they potentially highlight changing environmental exposures, and are of particular interest if they generate testable hypotheses.
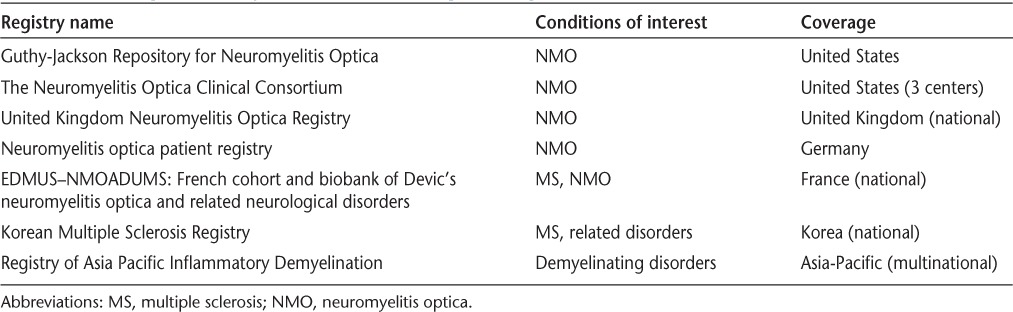
Although the number of studies included was small, this review highlights some important issues related to NMO. Population-based epidemiological data are limited but are critical for health-system management, to identify temporal trends in disease risk, and for generating testable etiologic hypotheses. Such studies will face challenges. The diagnostic criteria for NMO continue to change, and variant NMO spectrum disorders are increasingly being identified.22 In the absence of specific criteria for these variant disorders, they are unlikely to be captured in incidence and prevalence studies and the total burden of NMO spectrum disorders may be underestimated. Further, when new criteria are developed, the inclusion of these new cases will make it difficult to distinguish true temporal trends in disease incidence from changes in ascertainment. Future studies should clearly report the criteria used and distinguish between NMO variants to enhance comparability of estimates when criteria change. Future studies should report results standardized to the world population and provide subgroup-specific estimates. In jurisdictions where health care is universal and publicly funded, administrative (health claims) data may offer the opportunity to conduct such population-based studies on an ongoing basis at relatively low cost as has been done in other chronic diseases, including MS.35 In jurisdictions where such data do not exist, rare-disease registries may be an option (see Table 3 for examples),6 although complete ascertainment will be a challenge.
Table 3.
Examples of registries for neuromyelitis optica
PracticePoints.
The incidence and prevalence of neuromyelitis optica are poorly studied worldwide.
Future studies should ensure that estimates of incidence and prevalence are standardized to common populations.
Future studies would also benefit from reporting age-, sex-, and race- or ethnicity-specific estimates.
Footnotes
Financial Disclosures: Dr. Marrie has received research funding from the Canadian Institutes of Health Research, Public Health Agency of Canada, Manitoba Health Research Council, Health Sciences Centre Foundation, Multiple Sclerosis Society of Canada, Multiple Sclerosis Scientific Foundation, and Rx & D Health Research Foundation, and has conducted clinical trials funded by Sanofi-Aventis. Ms. Gryba has no conflicts of interest to disclose.
Funding/Support: This study was funded (in part) by a Don Paty Career Development Award from the Multiple Sclerosis Society of Canada (to RAM).
References
- 1.Wingerchuk DM, Lennon VA, Pittock SJ, Lucchinetti CF, Weinshenker BG. Revised diagnostic criteria for neuromyelitis optica. Neurology. 2006;66:1485–1489. doi: 10.1212/01.wnl.0000216139.44259.74. [DOI] [PubMed] [Google Scholar]
- 2.Pittock SJ, Lennon VA, Krecke K, Wingerchuk DM, Lucchinetti CF, Weinshenker BG. Brain abnormalities in neuromyelitis optica. Arch Neurol. 2006;63:390–396. doi: 10.1001/archneur.63.3.390. [DOI] [PubMed] [Google Scholar]
- 3.Lennon VA, Wingerchuk DM, Kryzer TJ. A serum autoantibody marker of neuromyelitis optica: distinction from multiple sclerosis. Lancet. 2004;364:2106–2112. doi: 10.1016/S0140-6736(04)17551-X. et al. [DOI] [PubMed] [Google Scholar]
- 4.Kira J. Neuromyelitis optica and Asian phenotype of multiple sclerosis. Ann N Y Acad Sci. 2008;1142:58–71. doi: 10.1196/annals.1444.002. [DOI] [PubMed] [Google Scholar]
- 5.Cree BA, Khan O, Bourdette D. Clinical characteristics of African Americans vs Caucasian Americans with multiple sclerosis. Neurology. 2004;63:2039–2045. doi: 10.1212/01.wnl.0000145762.60562.5d. et al. [DOI] [PubMed] [Google Scholar]
- 6.Mealy MA, Wingerchuk DM, Greenberg BM, Levy M. Epidemiology of neuromyelitis optica in the United States: a multicenter analysis. Arch Neurol. 2012;69:1176–1180. doi: 10.1001/archneurol.2012.314. [DOI] [PubMed] [Google Scholar]
- 7.Evans C, Beland S, Kulaga S. Incidence and prevalence of multiple sclerosis in the Americas: a systematic review. Neuroepidemiology. 2013;40:195–210. doi: 10.1159/000342779. et al. [DOI] [PubMed] [Google Scholar]
- 8.Boyle MH. Guidelines for evaluating prevalence studies. Evidence Based Mental Health. 1998;1:37–39. [Google Scholar]
- 9.Neyeloff J, Fuchs S, Moreira L. Meta-analyses and Forest plots using a Microsoft Excel spreadsheet: step-by-step guide focusing on descriptive data analysis. BMC Res Notes. 2012;5:52. doi: 10.1186/1756-0500-5-52. [DOI] [PMC free article] [PubMed] [Google Scholar]
- 10.Higgins JPT, Thompson SG, Deeks JJ, Altman DG. Measuring inconsistency in meta-analyses. BMJ. 2003;327:557–560. doi: 10.1136/bmj.327.7414.557. [DOI] [PMC free article] [PubMed] [Google Scholar]
- 11.Poppe AY, Wolfson C, Zhu B. Prevalence of multiple sclerosis in Canada: a systematic review. Can J Neurol Sci. 2008;35:593–601. doi: 10.1017/s0317167100009380. [DOI] [PubMed] [Google Scholar]
- 12.Asgari N, Lillevang ST, Skejoe HP, Falah M, Stenager E, Kyvik KO. A population-based study of neuromyelitis optica in Caucasians. Neurology. 2011;76:1589–1595. doi: 10.1212/WNL.0b013e3182190f74. [DOI] [PMC free article] [PubMed] [Google Scholar]
- 13.Cabre P. Migration and multiple sclerosis: the French West Indies experience. J Neurol Sci. 2007;262:117–121. doi: 10.1016/j.jns.2007.06.044. [DOI] [PubMed] [Google Scholar]
- 14.Cabre P. Environmental changes and epidemiology of multiple sclerosis in the French West Indies. J Neurol Sci. 2009;286:58–61. doi: 10.1016/j.jns.2009.04.039. [DOI] [PubMed] [Google Scholar]
- 15.Cabre P, Signate A, Olindo S. Role of return migration in the emergence of multiple sclerosis in the French West Indies. Brain. 2005;128:2899–2910. doi: 10.1093/brain/awh624. et al. [DOI] [PubMed] [Google Scholar]
- 16.Cabrera-Gomez JA, Kurtzke JF, Gonzalez-Quevedo A, Lara-Rodriguez R. An epidemiological study of neuromyelitis optica in Cuba. J Neurol. 2009;256:35–44. doi: 10.1007/s00415-009-0009-0. [DOI] [PubMed] [Google Scholar]
- 17.Cabre P, Heinzlef O, Merle H. MS and neuromyelitis optica in Martinique (French West Indies) Neurology. 2001;56:507–514. doi: 10.1212/wnl.56.4.507. et al. [DOI] [PubMed] [Google Scholar]
- 18.Cossburn M, Tackley G, Baker K. The prevalence of neuromyelitis optica in South East Wales. Eur J Neurol. 2012;19:655–659. doi: 10.1111/j.1468-1331.2011.03529.x. et al. [DOI] [PubMed] [Google Scholar]
- 19.Wingerchuk DM, Hogancamp WF, O'Brien PC, Weinshenker BG. The clinical course of neuromyelitis optica (Devic's syndrome) Neurology. 1999;53:1107. doi: 10.1212/wnl.53.5.1107. [DOI] [PubMed] [Google Scholar]
- 20.McKee S, McNaughton F. Neuromyelitis optica: a report of two cases. Trans Am Ophthalmol Soc. 1937;35:125–135. [PMC free article] [PubMed] [Google Scholar]
- 21.Kuroiwa Y, Igata A, Itahara K. Nationwide survey of multiple sclerosis in Japan: clinical analysis of 1,084 cases. Neurology. 1975;25:845. doi: 10.1212/wnl.25.9.845. et al. [DOI] [PubMed] [Google Scholar]
- 22.Bizzoco E, Lolli F, Repice AM. Prevalence of neuromyelitis optica spectrum disorder and phenotype distribution. J Neurol. 2009;256:1891–1898. doi: 10.1007/s00415-009-5171-x. et al. [DOI] [PubMed] [Google Scholar]
- 23.Rivera J, Kurtzke J, Booth V, Corona T. Characteristics of Devic's disease (neuromyelitis optica) in Mexico. J Neurol. 2008;255:710–715. doi: 10.1007/s00415-008-0781-2. [DOI] [PubMed] [Google Scholar]
- 24.Pugliatti M, Sotgiu S, Rosati G. The worldwide prevalence of multiple sclerosis. Clin Neurol Neurosurg. 2002;104:182–191. doi: 10.1016/s0303-8467(02)00036-7. [DOI] [PubMed] [Google Scholar]
- 25.Cocco E, Sardu C, Massa R. Epidemiology of multiple sclerosis in south-western Sardinia. Mult Scler J. 2011;17:1282–1289. doi: 10.1177/1352458511408754. et al. [DOI] [PubMed] [Google Scholar]
- 26.McGuigan C, McCarthy A, Quigley C, Bannan L, Hawkins SA, Hutchinson M. Latitudinal variation in the prevalence of multiple sclerosis in Ireland, an effect of genetic diversity. J Neurol Neurosurg Psychiatry. 2003;75:572–576. doi: 10.1136/jnnp.2003.012666. [DOI] [PMC free article] [PubMed] [Google Scholar]
- 27.Bergamaschi R, Montomoli C, Candeloro E. Bayesian mapping of multiple sclerosis prevalence in the province of Pavia, northern Italy. J Neurol Sci. 2006;244:127–131. doi: 10.1016/j.jns.2006.01.013. et al. [DOI] [PubMed] [Google Scholar]
- 28.Modi G, Mochan A, Modi M, Saffer D. Demyelinating disorder of the central nervous system occurring in black South Africans. J Neurol Neurosurg Psychiatry. 2001;70:500–505. doi: 10.1136/jnnp.70.4.500. [DOI] [PMC free article] [PubMed] [Google Scholar]
- 29.Mirsattari SM, Johnston JB, McKenna R. Aboriginals with multiple sclerosis: HLA types and predominance of neuromyelitis optica. Neurology. 2001;56:317–323. doi: 10.1212/wnl.56.3.317. et al. [DOI] [PubMed] [Google Scholar]
- 30.Bamshad M. Genetic influences on health: does race matter? JAMA. 2005;294:937–946. doi: 10.1001/jama.294.8.937. [DOI] [PubMed] [Google Scholar]
- 31.Collongues N, Marignier R, Zephir H. Neuromyelitis optica in France: a multicenter study of 125 patients. Neurology. 2010;74:736–742. doi: 10.1212/WNL.0b013e3181d31e35. et al. [DOI] [PubMed] [Google Scholar]
- 32.Ghezzi A, Bergamaschi R, Martinelli V. Clinical characteristics, course and prognosis of relapsing Devic's neuromyelitis optica. J Neurol. 2004;251:47–52. doi: 10.1007/s00415-004-0271-0. et al. [DOI] [PubMed] [Google Scholar]
- 33.Wingerchuk DM. Neuromyelitis optica: effect of gender. J Neurol Sci. 2009;286:18–23. doi: 10.1016/j.jns.2009.08.045. [DOI] [PubMed] [Google Scholar]
- 34.Alonso A, Hernan MA. Temporal trends in the incidence of multiple sclerosis: a systematic review. Neurology. 2008;71:129–135. doi: 10.1212/01.wnl.0000316802.35974.34. [DOI] [PMC free article] [PubMed] [Google Scholar]
- 35.Marrie RA, Yu N, Blanchard JF, Leung S, Elliott L. The rising prevalence and changing age distribution of multiple sclerosis in Manitoba. Neurology. 2010;74:465–471. doi: 10.1212/WNL.0b013e3181cf6ec0. [DOI] [PubMed] [Google Scholar]