

Abstract
Given the increases in drug-resistant tuberculosis, laboratory capacities for drug susceptibility testing are being scaled up worldwide. A laboratory must decide among several endorsed methodologies. We evaluated 87 Mycobacterium tuberculosis isolates for concordance of susceptibility results across six methods: the L-J proportion method, MGIT 960 SIRE AST, Gene/Xpert MTB/RIF, GenoType MTBDRplus line probe assay, MycoTB MIC plate, and a laboratory-developed mycobacteriophage quantitative PCR (qPCR)-based method. Most (80%) isolates were multidrug resistant. Of the culture-based methods, the mycobacteriophage qPCR method was fastest, the L-J proportion method was the slowest, and the MGIT method required the most repeat testing (P < 0.05). For isoniazid (INH), 82% of isolates were susceptible by all methods or resistant by all methods, whereas for rifampin (RIF), ethambutol (EMB), and streptomycin (STR), such complete concordance was observed in 77%, 50%, and 51% of isolates, respectively (P < 0.05 for INH or RIF versus EMB or STR). The discrepancies of EMB and STR stemmed largely from diminished concordance of the MGIT EMB results (kappa coefficient range, 0.26 to 0.30) and the L-J STR result (kappa range, 0.35 to 0.45) versus other methods. Phage qPCR and the MycoTB MIC plate were the only methods that yielded second-line susceptibilities and revealed significant quantitative correlations for all drugs except cycloserine, as well as moderate to excellent kappa coefficients for all drugs except for para-aminosalicylic acid. In summary, the performance of M. tuberculosis susceptibility testing differs by platform and by drug. Laboratories should carefully consider these factors before choosing one methodology, particularly in settings where EMB and STR results are clinically important.
INTRODUCTION
Given the increasing rates of multidrug-resistant tuberculosis (MDR-TB) isolates worldwide and the emergence of extensively drug-resistant TB, the development of rapid and accurate methods for drug susceptibility testing (DST) of Mycobacterium tuberculosis isolates is a global priority. The culture-based proportion method that employs Löwenstein-Jensen medium is a World Health Organization (WHO)-recommended method that has been in wide use for over 50 years (1, 2). Such solid medium-based DST methods are slow, requiring readings at 4 to 6 weeks, which delays the detection of drug resistance and risks inappropriate treatment and spread of drug-resistant strains. This deficiency has led to the development of newer DST methodologies, including liquid culture systems and molecular line probe assays, which have also received recommendations from WHO (3, 4).
As a consequence, laboratories have seen an accumulation of methods from which they must choose, and a given specimen or isolate may be tested across a variety of methods. A natural consequence is that discrepancies between methods may be encountered. Such discrepancies may be of little consequence in certain scenarios, such as streptomycin (STR) resistance in settings that use primarily isoniazid (INH), rifampin (RIF), pyrazinamide (PZA), and ethambutol (EMB), but they may have critical implications for treating MDR-TB in areas where the arsenal of drugs is limited in number and potency. Discordance is becoming a vexing aspect for TB clinicians and will likely increase in frequency as new methodologies are adopted, yet its extent has received little attention. Most diagnostic evaluations examine one new method against one gold standard reference method, not several methods against each other. Additionally, most diagnostic evaluations are performed on predominantly drug-susceptible isolates, often highly susceptible clinical isolates or reference strains, and thus discrepancies between methods would be expected to be rare.
For this reason, we prospectively examined 87 mostly MDR isolates across six DST methods: the L-J proportion method, MGIT 960 SIRE AST, Xpert MTB/RIF assay, GenoType MTBDRplus line probe assay, MycoTB MIC plate, and a laboratory-developed rapid mycobacteriophage quantitative PCR (qPCR)-based method. We quantified concordance between methods and against the consensus gold standard for the isolate, agnostically defined as the result of the majority of DST methodologies.
MATERIALS AND METHODS
Specimens.
Sputum was collected from individuals with suspicion for drug-resistant TB as part of a surveillance project conducted in 17 hospitals covering all seven geographic divisions of Bangladesh. Both newly registered smear-positive pulmonary TB cases and known or suspected MDR-TB patients (defined as not responding to first-line treatment, treatment failures, relapse cases, or active disease with documented MDR-TB contact) were enrolled. Sputum samples were decontaminated and processed following Petroff's NaOH method (5) and cultured on Lowenstein Jensen (L-J) slants and on an automated Bactec MGIT 960 system (Becton, Dickinson, Franklin Lakes, NJ). Two loops of processed sputum were inoculated onto 2 L-J slants and 500 μl in an MGIT 960 7H9 tube with BD PANTA supplement. Cultures were incubated at 37°C for up to 8 weeks on L-J and for 42 days in the MGIT 960. L-J cultures were checked weekly, and Bactec MGIT 960 cultures were monitored continuously through the automated system. All work was approved by the ICDDR, B Ethical Review Committee, and the University of Virginia Human Subjects Research Institutional Review Board.
Drug susceptibility testing.
The Xpert MTB/RIF assay and GenoType MTBDRplus line probe assay were performed on sputum or sputum sediment. Isolates cultured from sputum underwent susceptibility testing using the L-J proportion method, Bactec MGIT 960 SIRE AST (BD, Sparks, MD), Sensititre MycoTB plate (Trek Diagnostics, Cleveland, OH), and a laboratory-developed rapid mycobacteriophage qPCR-based method (6) (Table 1). In total, 103 isolates were obtained; however, if a method did not yield a result due to poor control growth, then it was repeated once after subculture on 7H11 medium, so that ultimately we obtained 87 isolates with results for most methods. Criteria for susceptibility and resistance are provided in Table 1.
TABLE 1.
M. tuberculosis DST methods and criteria for resistance
| Method | Status | Drug(s) tested | Criterion for resistance |
|---|---|---|---|
| L-J indirect proportion method | WHO endorsed (3) | INH | >1% colonies at 0.2 μg/ml at 42 days |
| Rifampin | >1% colonies at 40 μg/ml at 42 days | ||
| Ethambutol | >1% colonies at 2.0 μg/ml at 42 days | ||
| Streptomycin | >1% colonies at 4.0 μg/ml at 42 days | ||
| MGIT 960 | WHO endorsed (3), U.S. FDA approved | INH | Growth at 0.1 μg/ml |
| Rifampin | Growth at 1.0 μg/ml | ||
| Ethambutol | Growth at 5.0 μg/ml | ||
| Streptomycin | Growth at 1.0 μg/ml | ||
| GeneXpert | WHO endorsed (4); U.S. FDA approved | Rifampin | Delayed or absent hybridization to any of 5 wild-type rpoB probes by real-time PCR |
| Hain MTBDRplus line probe assay | WHO endorsed (4); CE-IVD certified | Isoniazid, rifampin | No hybridization to any wild-type probes or hybridization to any mutant probes for rpoB, katG, or inhA after PCR |
| Trek Sensititre MycoTB | Research use only | Visible growth after 10–21 days at concn of: | |
| INH | >0.25 μg/ml | ||
| Rifampin | >1.0 μg/ml | ||
| Ethambutol | >4.0 μg/ml | ||
| Streptomycin | >2.0 μg/ml | ||
| Kanamycin | >5.0 μg/ml | ||
| Amikacin | >4.0 μg/ml | ||
| Ofloxacin | >2.0 μg/ml | ||
| Moxifloxacin | >1.0 μg/ml | ||
| Ethionamide | >5.0 μg/ml | ||
| PAS | >1.0 μg/ml | ||
| Cycloserine | >32.0 μg/ml | ||
| Mycobacteriophage-based qPCR | Laboratory developed | Increased mycobacteriophage DNA by real-time PCR Cq at drug concn (ΔCq ratio)a of: | |
| INH | 0.1 μg/ml (≥0.06) | ||
| Rifampin | 1.0 μg/ml (≥0.21) | ||
| Ethambutol | 5.0 μg/ml (≥0.28) | ||
| Streptomycin | 1.0 μg/ml (≥0.51) | ||
| Kanamycin | 1.0 μg/ml (*) | ||
| Amikacin | 1.0 μg/ml (*) | ||
| Ofloxacin | 2.0 μg/ml (≥0.25) | ||
| Moxifloxacin | 0.25 μg/ml (≥0.08) | ||
| Ethionamide | 5.0 μg/ml (≥0.80) | ||
| PAS | 2.0 μg/ml (≥0.10) | ||
| Cycloserine | 30 μg/ml (*) |
The ΔCq ratio was calculated as follows: (ΔCq for phage − Cq for drug)/(ΔCq for phage − Cq for control). *, there were only 1 to 3 resistant isolates, and therefore we could not ascribe a Cq breakpoint for the drug by this testing method.
L-J proportion method.
The standard L-J proportion method for susceptibility testing of M. tuberculosis isolates was performed according to the procedure described previously (2) using STR at 4 μg/ml, INH at 0.2 μg/ml, RIF at 40 μg/ml, and EMB at 2 μg/ml. Stock solutions of drugs were prepared from reference powders, and all media were prepared in-house and tested for sterility and performance. Briefly, a 1.0 McFarland standard isolate suspension was serially diluted 10-fold, from 10−1 to 10−4, in sterile distilled water, inoculated onto L-J slants with and without drugs, and incubated at 37°C. Results were read at 28 days and up to 42 days, depending on control growth. An isolate was considered resistant to a given drug when growth of 1% or more above the control was observed in drug-containing medium. A susceptible strain, H37Rv, and our laboratory-determined resistant strain, SB256 (resistant to STR, INH, RIF, and EMB), were used for quality control.
Bactec MGIT 960 SIRE AST.
The MGIT 960 DST method was performed according to the manufacturer's instructions with the SIRE drug kit, which contains STR at 1.0 μg/ml, INH at 0.1 μg/ml, RIF at 1.0 μg/ml, and EMB at 5.0 μg/ml (7). Briefly, a standard inoculum was prepared either from the positive culture in MGIT medium detected by the Bactec MGIT 960 instrument or from a solid culture grown on L-J medium. MGIT 960 SIRE supplement (0.8 ml) was added to each 7-ml MGIT tube, followed by 0.1 ml of the drug solution and 0.5 ml of the test inoculum. For each isolate, a growth control tube with SIRE supplement without drug was included. The relative growth ratio between the drug-containing tube and drug-free growth control tube was determined by the system's software algorithm, and susceptibility results were reported automatically. For quality control, both strains H37Rv and SB256 were used.
Xpert MTB/RIF assay.
The Xpert MTB/RIF test (Cepheid, Sunnyvale, CA) was performed on unprocessed sputum samples according to the manufacturer's instructions. Briefly, 2 ml of Xpert MTB/RIF sample reagent was added to a 15-ml Falcon tube containing 1 ml of unprocessed sputum sample in a 2:1 ratio. The tube was manually agitated twice during a 15-min incubation at room temperature. Two milliliters of liquefied sample was transferred to an Xpert MTB/RIF cartridge and loaded into a module of the GeneXpert machine. The instrument reports whether or not M. tuberculosis is detected and whether RIF resistance is detected.
GenoType MTBDRplus assay.
The MTBDRplus assay (Hain Lifescience, Nehren, Germany) is a line probe strip assay with DNA probes that detect M. tuberculosis complex and resistance to RIF and INH. The assay was performed on decontaminated sputum samples according to the manufacturer's instructions for DNA extraction and amplification, with hybridization performed by using a TwinCubator instrument (Hain Lifescience, Nehren, Germany). The assay has built-in controls whereby a valid result is indicated by the appearance of 5 control zones on each strip: a conjugate control zone (CC), an amplification control zone (AC), and three locus control zones (rpoB for RIF and katG and inhA for INH). In the case of heteroresistant line probe results (where both mutation probes and the corresponding wild-type probe stain positive), we categorized such samples as “resistant.”
MycoTB MIC DST.
The Sensititre MycoTB plate test (Trek Diagnostic Systems, Cleveland, OH) was used to determine the MICs. This method entails a 96-well microtiter plate in which one isolate is tested per plate against 12 first- and second-line drugs, each over a range of 7 or 8 concentrations. Briefly, isolate suspensions were prepared from solid culture and adjusted to 0.5 McFarland standard, and 100 μl of suspension was transferred into a tube containing 11 ml 7H9 broth supplemented with oleic acid-albumin-dextrose-catalase (OADC), to yield 1 × 10⁵ CFU/ml. A 100-μl aliquot of the final inoculum was transferred into each well, and the plate was covered with an adhesive seal and incubated at 37°C. Growth was evaluated visually with a manual viewer at 10 to 21 days by two independent technicians. The MIC was recorded as the lowest antibiotic concentration that reduced visible growth. The majority of our results were read after 21 days of incubation. H37Rv was used for quality control.
D29 mycobacteriophage qPCR assay.
The D29 mycobacteriophage DST assay was performed using isolates grown on solid media according to the procedure described previously, with a few modifications (6), namely, the inclusion of a TaqMan probe and conversion to a 96-well plate format with 1.2-ml-deep wells, allowing 7 isolates to be tested against 12 first- and second-line drugs on a single plate. Each of the 12 drugs is tested at a single concentration with this method. Since this is a liquid-based system, we used MGIT 960 critical concentrations (e.g., INH at 0.1 μg/ml, RIF at 1.0 μg/ml, EMB at 5.0 μg/ml, and STR at 1.0 μg/ml). For second-line drugs, we followed CLSI recommendations for most drugs (e.g., ofloxacin [OFX] at 2.0 μg/ml, amikacin [AMK] at 1.0 μg/ml, ethionamide [ETH] at 5.0 μg/ml, and moxifloxacin [MXF] at 0.25 μg/ml) and used 1.0 μg/ml for kanamycin (KAN) because its serum drug concentrations are similar to those of AMK. Cycloserine has no liquid recommendation; we chose 30 μg/ml, since the peak drug level in serum is 20 to 40 μg/ml. The inoculum of mycobacteriophage was standardized to 104 PFU/ml, correlating to a quantification cycle (Cq) of 30 to 32. Drugs were prepared from reference powder stock and then diluted to the assay working concentrations by using M7H9 with 10% OADC and 1 mM CaCl2. To summarize, 450 μl of each drug was transferred to a deep-well plate. Aliquots (50 μl) of prepared inoculum (an M. tuberculosis suspension of 0.5 McFarland standard diluted 1:10 in M7H9 with 10% OADC and 1 mM CaCl2, to yield 1 × 10⁶ CFU/ml) were added into each well and incubated for 48 h at 37°C. Thereafter, 50 μl of D29 phage (1.5 × 10⁴ PFU/ml) was added to each well, and the plate was incubated again at 37°C for 48 h. After the second incubation, the plate containing D29 phage-infected cells was heated in a bead bath containing beads (Lab Armor, Cornelius, OR) at 80°C for 1 h, and then the well contents were centrifuged at 2,500 rpm for 10 min. The supernatant was used as the DNA template for qPCR. The forward primer (5′-CCACCAGGAGCCACGAACT-3′) and reverse primer (5′-AGTGGCGTAGATCACCTTGACA-3′) and TaqMan probe (6-carboxyfluorescein–5′–TATACCCCCGGAATCG–3′–minor groove binder) were designed to amplify a 100-bp untranslated region within the D29 phage genome. PCR was performed in a reaction volume of 25 μl consisting of 12.5 μl of 2× QuantiTect probe (Qiagen) from the PCR kit, 0.25 μl of 50 μM forward and reverse primers, 0.05 μl of 50 μl TaqMan probe, 6.95 μl nuclease-free water, and 5 μl DNA template. Cycling conditions consisted of initial denaturation at 95°C for 10 min, followed by 40 cycles of denaturation at 95°C for 15 s and combined annealing/extension at 65°C for 60 s. PCR amplification, detection, and data analysis were performed with the CFX96 Touch real-time PCR detection system (Bio-Rad, Hercules, CA). Each run included nuclease-free water for a negative control. Strain H37Rv was used for quality control.
Statistics.
Means were compared using the t test or Mann-Whitney test, depending on whether the data fit a Gaussian distribution. Data are reported as means ± standard deviations. For each isolate's susceptibility profile to a drug, we defined the gold standard as the consensus result of the majority of methods. For example, if 5 methods were used on an isolate for a given drug, the gold standard result would be “susceptible” if the methods yielded 5 susceptible/0 resistant, 4 susceptible/1 resistant, or 3 susceptible/2 resistant; the results was “resistant” if the methods yielded 2 susceptible/3 resistant, 1 susceptible/4 resistant, or 0 susceptible/5 resistant. Ties of 3 resistant/3 susceptible or 2 resistant/2 susceptible were uncommon (see Fig. 2, below) and considered indeterminate; therefore, such results could be included in the gold standard comparisons. Cohen's kappa value was calculated using GraphPad software (La Jolla, CA) to compare the methods against each other. For quantitative methods, (MIC and mycobacteriophage qPCR), we further identified the MIC or Cq breakpoint values that yielded an optimal sensitivity/specificity versus the gold standard by receiver operating characteristic (ROC) analysis, by using SPSS version 20 (IBM Corp., Armonk, NY). Correlations between Cq values and MICs were calculated based on a Pearson correlation. All P values were for two-tailed comparisons.
FIG 2.
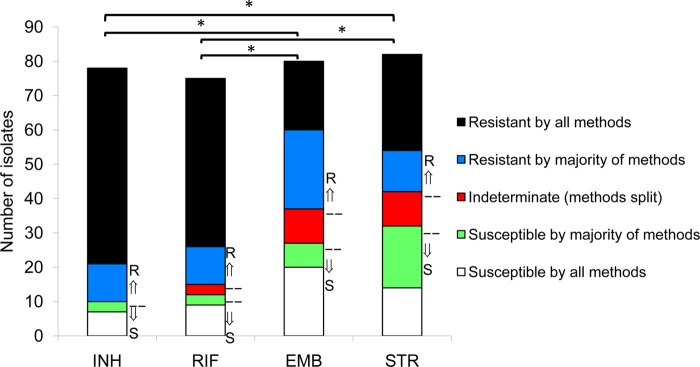
Discordance of methods of DST for drug-resistant M. tuberculosis isolates. Isolates of M. tuberculosis were tested for drug susceptibility using the L-J proportion method, MGIT 960, GeneXpert, Hain MTBDRplus, MIC plate (Trek Sensititre MycoTB), and a laboratory-developed rapid mycobacteriophage qPCR-based method. In total, we used 5 methods for evaluation of INH resistance or susceptibility, 6 for RIF, 4 for EMB, and 4 for STR. Isolates were categorized as resistant by all methods, resistant by the majority of methods, susceptible by all methods, susceptible by the majority of methods, or indeterminate (if results with the different methods were split (e.g., 3 resistant/3 susceptible for RIF, or 2 resistant/2 susceptible for EMB or STR). The gold standard result for an isolate was defined as the result that the majority of methods yielded (arrows pointing up or down). Blue, red, and green portions indicate isolates for which discrepant results occurred. *, P < 0.05 for rate of complete concordance (percent resistant by all methods + percent susceptible by all methods divided by total number of isolates) for INH and RIF versus EMB and STR.
RESULTS
Isolate characteristics.
We obtained 87 isolates for which there were results with most methods, and of these 87 isolates, 69 (80%) were MDR-TB according to L-J susceptibility results, 2 (2%) were RIF monoresistant/INH susceptible, 4 (5%) were RIF susceptible/INH monoresistant, and 11 (13%) were RIF susceptible/INH susceptible. Of the 69 MDR isolates, 45 were from known MDR patients and 24 were from suspect cases. L-J susceptibility results indicated 74% resistance to STR and 67% resistance to EMB. Second-line susceptibility results were available from the Sensititre MycoTB plate and the mycobacteriophage qPCR methods. By using the MIC breakpoints for resistance that have been previously described (8), AMK or KAN resistance was rare but OFX or MXF resistance was common (1%, 2%, 25%, and 16%, respectively). Of the 21 OFX-resistant isolates, 7 were MXF susceptible. One isolate (1%) was resistant to OFX, MXF, AMI, and KAN, as well as ETH and para-aminosalicylic acid (PAS), and thus was classified extensively drug resistant. These data are epidemiologically important, as they are the first second-line drug susceptibility results reported for Bangladesh.
Turnaround time.
After isolate growth in culture, the average turnaround time to DST result ranged from 33.6 to 5.0 days, in the following order from slowest to fastest: L-J proportion method, Trek MycoTB plate, MGIT 960 SIRE, mycobacteriophage qPCR (Fig. 1) (P < 0.05 for all comparisons). The GenoType MTBDRplus and Xpert MTB/RIF assays were performed directly on sputum within 8 and 2.6 h, respectively (P < 0.05). The number of specimens or isolates that failed due to contamination or insufficient growth and therefore required repeat testing was lowest for the GeneXpert system and highest for the MGIT 960 system (P < 0.05) (Fig. 1).
FIG 1.
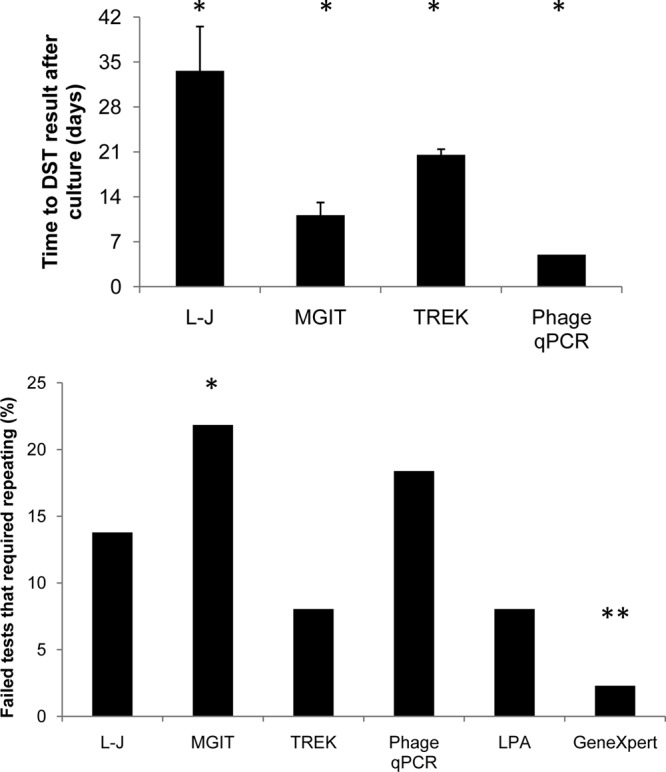
Turnaround times and repeat testing results of DST methods. A total of 87 isolates were tested across several DST methodologies for the first-line drugs INH, RIF, EMB, and STR. (Top) The time from culture to DST result was measured for each methodology (L-J, MGIT 960, Trek MycoTB, and phage qPCR). *, P < 0.05 for each comparison. (Bottom) Percentages of specimens or isolates that failed due to contamination or insufficient growth and that required repeat testing, enumerated by platform. *, P < 0.05 (for MGIT, significantly higher than Trek MycoTB, LPA, or GeneXpert); **, P < 0.05 (for GeneXpert, significantly lower than MGIT, L-J, or phage qPCR).
Determination of MIC and phage qPCR breakpoints.
The MycoTB MIC plate and phage qPCR methods are the only two quantitative methods, and thus we first needed to examine the corresponding breakpoints (see Fig. S1 in the supplemental material). For the MIC results, we used the breakpoints described by Hall, which utilize the breakpoint nearest to the 7H10 agar proportion critical concentration (8). We noted few differences whether we used the MIC breakpoints described by Hall or the empirical MIC breakpoint that optimized the Youden indices for INH, RIF, EMB, and STR (see Fig. S1A). For the laboratory-developed mycobacteriophage qPCR method, in our earlier report we defined breakpoints based on the formula for ΔCq: (Cq for control − Cq for drug) (6). In this study, we evaluated an alternative calculation method that normalized growth in drug versus the total amount of growth over the incubation period, similar to a proportion method, and we elected to utilize the following metric: (ΔCq for phage − Cq for drug)/(ΔCq for phage − Cq for control). Again, there was little difference whether we used the original formula or the latter. Therefore, we proceeded with the MIC breakpoints of Hall and the optimal breakpoints as determined using the latter breakpoint equation described here.
Discordance.
We then examined discordance across all the methods. Most isolates yielded completely concordant results across the methods; however, there were unique differences, depending on the individual drug (Fig. 2). For INH, 82% of isolates were susceptible by all methods or resistant by all methods, whereas for RIF, EMB, and STR, such complete concordance was observed for only 77%, 50%, and 51% of isolates, respectively (P < 0.05 for INH or RIF versus EMB or STR). That is to say, some discrepancies were observed in the other 18%, 23%, 50%, and 49% of isolates for INH, RIF, EMB, and STR resistance, respectively. The diminished concordance for EMB resistance was attributable largely to MGIT discrepancies (of 30 EMB discrepancies, 20 were MGIT, 4 were phage qPCR, 3 were L-J, and 3 were Trek MycoTB; P < 0.05 for MGIT versus the other methods). To describe this finding another way, discrepancy rates for EMB were 29% for MGIT 960, versus 4 to 5% for the other methods (P < 0.05) (Fig. 3). In contrast, the STR discrepancies were distributed across the methods. Discrepant results can of course be either resistant with the gold standard indicating susceptible, or susceptible with the gold standard indicating resistant. In general the latter was more common (96 versus 76 results), and the breakdown by drug is shown in Fig. 3. This analysis revealed that most MGIT 960 EMB discrepancies were discrepantly susceptible (indeed, 24/49 of MGIT 960 EMB susceptible results from these isolates were discrepantly susceptible and could thus be categorized as “false susceptible”), and all of the L-J STR discrepancies were resistant (10/51 of the L-J STR resistant results could thus be categorized as “false resistant”). The kappa coefficients for each platform and drug are shown in Table 2, and these data reiterate that the only “fair” concordance was found with MGIT EMB (kappa, 0.26 to 0.30) and L-J STR (kappa, 0.35 to 0.45) versus the other 3 platforms. All other method comparisons for the 4 first-line drugs exhibited kappa coefficients that were moderate (0.41 to 0.60), substantial (0.61 to 0.80), or excellent (0.81 to 1.0).
FIG 3.
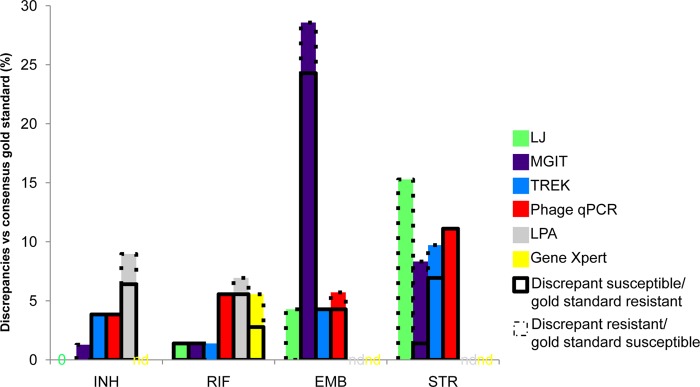
Drug susceptibility testing discrepancies by drug and methodology. Discrepancies versus the consensus gold standard were enumerated for INH, RIF, EMB, and STR by methodology. Discrepancy rates for EMB were higher for MGIT 960 than with other methods (29%, versus 4 to 5% for other methods; P < 0.05). Discrepancies were further delineated as susceptible (boxed outline indicating the majority were susceptible) or resistant (dashed outline indicating the majority were resistant). There were 0 discrepancies for INH by L-J. nd, not done (GeneXpert only evaluates RIF and the Hain MTBDRplus method only evaluates INH and RIF).
TABLE 2.
Kappa coefficients across methodologiesa
| Drug | Method | Kappa coefficient for comparison with: |
||||
|---|---|---|---|---|---|---|
| L-J | MGIT 960 | Trek MycoTB | Phage qPCR | LPA | ||
| INH | MGIT 960 | 0.94 | ||||
| Trek MycoTB | 0.85 | 0.79 | ||||
| Phage qPCR | 0.85 | 0.79 | 0.72 | |||
| LPA | 0.64 | 0.58 | 0.54 | 0.54 | ||
| RIF | MGIT 960 | 0.79 | ||||
| Trek MycoTB | 0.76 | 0.65 | ||||
| Phage qPCR | 0.65 | 0.78 | 0.53 | |||
| LPA | 0.74 | 0.63 | 0.77 | 0.52 | ||
| Xpert MTB/RIF | 0.77 | 0.92 | 0.72 | 0.77 | 0.62 | |
| EMB | MGIT 960 | 0.26 | ||||
| Trek MycoTB | 0.94 | 0.30 | ||||
| Phage qPCR | 0.66 | 0.29 | 0.59 | |||
| STR | MGIT 960 | 0.45 | ||||
| Trek MycoTB | 0.35 | 0.52 | ||||
| Phage qPCR | 0.39 | 0.51 | 0.63 | |||
| AMI | Phage qPCR | 1.0 | ||||
| KAN | Phage qPCR | 0.49 | ||||
| OFX | Phage qPCR | 0.8 | ||||
| MXF | Phage qPCR | 0.41b | ||||
| ETH | Phage qPCR | 0.71 | ||||
| PAS | Phage qPCR | 0.28b | ||||
Kappa coefficients are shown with various typefaces assigned according to interpretive criteria, as follows: 0.21 to 0.4 (fair; lightface); 0.41 to 0.60 (moderate; underlined); 0.61 to 0.80 (substantial; italics); 0.81 to 1.0 (excellent; boldface). LPA, MTBDRplus line probe assay.
This calculation was based on MXF and PAS MIC breakpoints for susceptibility at 1.0 rather than 2.0 μg/ml.
Second-line drug tests.
The phage qPCR and Trek MycoTB methods were the only methods that yielded second-line DST information for AMK, KAN, OFX, MXF, ETH, PAS, and cycloserine. Again, we first examined the MIC breakpoints reported by Hall (8) and the original qPCR cutoffs (6). All kappa coefficients were similar when we utilized the formula (ΔCq for phage − Cq for drug)/(ΔCq for phage − Cq for control), and therefore this metric was again used. The Pearson correlation test revealed a statistically significant trend between MIC and qPCR Cq values (Fig. 4) for all first- and second-line drugs except for cycloserine. Kappa coefficients were moderate for MXF and KAN, substantial for ETH and OFX, and excellent for AMK (Table 2). However, the numbers of resistant isolates for KAN and AMK were minimal (n = 1 to 3), and therefore the cutoffs for these drugs are less certain. The MXF and PAS kappa coefficients were highest when we utilized a MIC breakpoint for susceptibility of 1.0 μg/ml (where 1.0 μg/ml is susceptible and 2.0 μg/ml is resistant) instead of 2.0 μg/ml. For cycloserine, there was only 1 resistant isolate according to the MycoTB plate method (with an MIC of >256 but a susceptible qPCR value); thus, this drug could not be evaluated.
FIG 4.

Correlations between mycobacteriophage qPCR Cq and MIC results. Eighty-four M. tuberculosis isolates were tested with both the Sensititre MycoTB and mycobacteriophage qPCR methods for second-line drugs. The correlation of MIC values with Cq value is shown for the indicated drugs. Dashed lines indicate the concentration breakpoints used for determining susceptibility and resistance. Means + standard deviations of Cq values are shown for each MIC. The best-fit lines and Pearson regression R2 values are shown. All drugs exhibited a statistically significant correlation, except for cycloserine.
DISCUSSION
In this work, we evaluated several DST methodologies on 87 largely drug-resistant isolates in a single laboratory in a real-world setting. We found substantial discordance. The main finding was that discrepancies were less common for INH and RIF than for EMB and STR and that the latter discrepancies were driven by MGIT 960 results for EMB and the L-J proportion method results for STR.
Our findings carry obvious implications for the laboratory, clinician, and patient. First, DST remains expensive and technically challenging, and so a laboratory usually will only have one validated method available for use. Thus, a high discrepancy rate of one's chosen method will have direct clinical consequences. If our Bangladesh laboratory in this high MDR-TB setting were to use only the MGIT 960 SIRE method, up to 49% of all EMB-susceptible findings might be false. The possibility of false susceptibility to EMB with the MGIT 960 method has been reported since the scale-up of the platform (9) and has been postulated to be a function of isolates with MICs at or just above the critical concentration, or to be due to heteroresistance, where growth rates of resistant mutants are slowed in liquid medium but can be improved by late growth on solid agar. The latter explanation is possible, but the former seems insufficient, as we did not note any statistical difference in the MICs (among the MGIT “false” susceptible isolates versus the MGIT resistant isolates; 9 ± 3 versus 11 ± 7 μg/ml; P = not susceptible). While false susceptibility to EMB is of little consequence in settings of susceptible M. tuberculosis isolates (since EMB is used only to cover the possibility of INH or RIF resistance and is dropped upon documentation of INH and RIF susceptibility [10]), it is a major concern with MDR-TB. The clinician would likely prescribe or continue EMB in such a patient, and this is a strategy widely endorsed in standardized MDR-TB treatment regimens. Retesting EMB-susceptible MDR isolates is an option; however, this is not practical for resource-limited settings. Therefore, for our setting we conclude that another methodology should be used for EMB. In contrast, regarding the L-J “false-resistant” discrepancies for STR, while this issue is concerning, it does not have as much clinical consequence, since even if the results were falsely resistant, it would only lead to withholding STR and inclusion of KAN or AMK (which we found to be highly susceptible and concordant) in the treatment regimen.
While it is therefore easy to envision how a single DST methodology with a high rate of discrepant results could, if utilized in isolation by a laboratory, lead to significantly different MDR-TB regimens, it remains harder to prove that such a regimen would lead to a worse outcome. TB is a special scenario, in that it is treated with multiple drugs for several months; thus, ascribing a single-drug DST to a clinical outcome is inherently complex, not to mention the fact that numerous host factors besides the DST contribute to a good or bad outcome. That said, the value of using DST for MDR-TB patients has been measured and is substantial, with an odds of treatment success that is 2 to 3 times higher when more than 3 to 4 active drugs are used (11). Of course, these pooled data have defined active drugs through a diversity of DST methods, mostly those using solid medium. Yet the findings provide proof of principle that DST results (with current culture-based methods) are clinically important, and as such, the quality of these DST results should be clinically important; therefore, a method with a high rate of discrepancies will ultimately prove deleterious (e.g., if it leads to prescribing only 2 active drugs instead of 3). More study is needed in this area.
Since this is the first published study of M. tuberculosis drug susceptibilities in suspected MDR-TB cases from Bangladesh, these data have important programmatic implications. MDR treatment in Bangladesh follows the WHO recommendations for an empirical regimen when second-line susceptibilities are not known, i.e., at least 20-month treatment duration with five drugs, including a second-line injectable agent administered for at least 8 months (capreomycin, KAN, or AMK), a fluoroquinolone (OFX or levofloxacin), ETH or prothionamide, PZA, or cycloserine or PAS (12). Thus, our data suggest that the inclusion of KAN and cycloserine are sound, since resistance to either of these agents was rare. We would, however, contemplate fluoroquinolone modifications to the standardized regimen to include MXF or perhaps high-dose levofloxacin over OFX, since there were no MXF-resistant/OFX-susceptible strains but there were MXF-susceptible/OFX-resistant strains in our sampling. The use of MXF or high-dose levofloxacin may prove useful for strains at the border of OFX susceptibility, for example, the 17 (20%) isolates in our study with a MIC of 2.0 μg/ml. Recent pharmacokinetic studies have demonstrated that the majority of subjects on the standard dose of ofloxacin do not achieve target serum drug concentrations (the ratio of the area under the concentration-time curve versus the MIC) (13, 14). Additionally, we would support the use of 1.0 μg/ml as the breakpoint for MXF susceptibility for the Trek MycoTB plate method. We did note that DST was more concordant for ETH than PAS (kappa coefficients, 0.71 versus 0.28), but whether any clinical benefit exists between ETH and PAS and whether ETH or PAS susceptibility results predict such a benefit remain unclear.
We think it is both intuitive and logical to use a quantitative susceptibility method for MDR-TB detection, such as the Trek MycoTB plate or the phage qPCR method. The clinician may seek to maximize dosing for an isolate with a MIC or quantitative result indicating a borderline susceptible range, as discussed for the fluoroquinolone, or even continue a medication if the MIC or quantitative result is at the lower end of the resistance range in the setting of extensively drug-resistant TB or within a limited formulary. Both of these methods were readily established in the laboratory, provided information for a broad range of drugs, were relatively rapid, and could be useful for DST surveillance or individualization of multidrug regimens. Of course, interpretation of a quantitative range is new territory for the TB field, but so are the issues of complex drug resistance that we are now facing.
Some operational aspects of the methods should be mentioned. MTBDRplus and the Xpert MTB/RIF can of course be performed on sputum samples (preferably smear positive) as a direct DST, which saves time over methods requiring culture. The Xpert MTB/RIF method was the fastest (2 h 40 min) and required the fewest repeats, but it is limited to RIF susceptibility testing. The MTBDRplus line probe assay additionally yields INH susceptibility information, but it required more repeats due to missing control bands. All other methods (L-J proportion, MGIT 960, MycoTB, and phage qPCR), being culture based, required time to obtain an adequate isolate. With the MGIT 960 SIRE AST method, when a valid result could be obtained using a seed tube from the primary MGIT culture, the turnaround time was good; however this method required the most repeat testing due to contamination. The MycoTB MIC plate method required the least specialized equipment of all the methods: an incubator and a multichannel pipette. When this test was valid on the first try, the turnaround time was 21 days when we used growth from solid medium. However, contamination or no growth may not be apparent for 21 days with this method; thus, when repeat testing is required, the turnaround time doubles to 42 days. For the D29 phage method, contamination was less problematic, due to the short incubation times and specificity of the D29 phage, and this is the easiest method to customize for laboratory-specific drug panels. We found that this and other culture-based methods performed best when our slow-growing MDR and extremely drug-resistant isolates were subcultured on 7H11 agar.
In summary, TB laboratory personnel and clinicians should be aware of the selected methodology they use for DST and be mindful of possible discrepancies with other methods. As we enter an era of complex drug resistance and the proliferation of new phenotypic and genotypic DST methods, the importance of this issue will only increase.
Supplementary Material
ACKNOWLEDGMENTS
This work was supported by National Institutes of Health grant R01 AI093358 (to E.R.H.) and by USAID through the Centers for Disease Control and Prevention (CDC). S.K.H. was supported by National Institutes of Health grant K23 AI099019.
Footnotes
Published ahead of print 30 October 2013
Supplemental material for this article may be found at http://dx.doi.org/10.1128/JCM.02378-13.
REFERENCES
- 1.WHO 1998. Guidelines for surveillance of drug resistance in tuberculosis. WHO and the International Union Against Tuberculosis and Lung Disease. Int. J. Tuberc. Lung Dis. 2:72–89 [PubMed] [Google Scholar]
- 2.Canetti G, Fox W, Khomenko A, Mahler HT, Menon NK, Mitchison DA, Rist N, Smelev NA. 1969. Advances in techniques of testing mycobacterial drug sensitivity, and the use of sensitivity tests in tuberculosis control programmes. Bull. World Health Organ. 41:21–43 [PMC free article] [PubMed] [Google Scholar]
- 3.WHO 2008. Molecular line probe assays for rapid screening of patients at risk of multidrug-resistant tuberculosis (MDR-TB): policy statement. WHO, Geneva, Switzerland [Google Scholar]
- 4.WHO 2007. Use of liquid TB culture and drug susceptibility testing (DST) in low and medium income settings. Summary report of the Expert Group Meeting on the Use of Liquid Culture Media. WHO, Geneva, Switzerland [Google Scholar]
- 5.Petroff SA. 1915. A new and rapid method for the isolation and cultivation of tubercle bacilli directly from the sputum and feces. J. Exp. Med. 21:38–42 [DOI] [PMC free article] [PubMed] [Google Scholar]
- 6.Pholwat S, Ehdaie B, Foongladda S, Kelly K, Houpt E. 2012. Real-time PCR using mycobacteriophage DNA for rapid phenotypic drug susceptibility results for Mycobacterium tuberculosis. J. Clin. Microbiol. 50:754–761. 10.1128/JCM.01315-11 [DOI] [PMC free article] [PubMed] [Google Scholar]
- 7.Ardito F, Posteraro B, Sanguinetti M, Zanetti S, Fadda G. 2001. Evaluation of BACTEC Mycobacteria Growth Indicator Tube (MGIT 960) automated system for drug susceptibility testing of Mycobacterium tuberculosis. J. Clin. Microbiol. 39:4440–4444. 10.1128/JCM.39.12.4440-4444.2001 [DOI] [PMC free article] [PubMed] [Google Scholar]
- 8.Hall L, Jude KP, Clark SL, Dionne K, Merson R, Boyer A, Parrish NM, Wengenack NL. 2012. Evaluation of the Sensititre MycoTB plate for susceptibility testing of the Mycobacterium tuberculosis complex against first- and second-line agents. J. Clin. Microbiol. 50:3732–3734. 10.1128/JCM.02048-12 [DOI] [PMC free article] [PubMed] [Google Scholar]
- 9.Kruuner A, Yates MD, Drobniewski FA. 2006. Evaluation of MGIT 960-based antimicrobial testing and determination of critical concentrations of first- and second-line antimicrobial drugs with drug-resistant clinical strains of Mycobacterium tuberculosis. J. Clin. Microbiol. 44:811–818. 10.1128/JCM.44.3.811-818.2006 [DOI] [PMC free article] [PubMed] [Google Scholar]
- 10.American Thoracic Society, CDC, Infectious Diseases Society of America 2003. Treatment of tuberculosis. MMWR Recomm. Rep. 52(RR-11):1–77 http://www.cdc.gov/mmwr/pdf/rr/rr5211.pdf [PubMed] [Google Scholar]
- 11.Ahuja SD, Ashkin D, Avendano M, Banerjee R, Bauer M, Bayona JN, Becerra MC, Benedetti A, Burgos M, Centis R, Chan ED, Chiang CY, Cox H, D'Ambrosio L, DeRiemer K, Dung NH, Enarson D, Falzon D, Flanagan K, Flood J, Garcia-Garcia ML, Gandhi N, Granich RM, Hollm-Delgado MG, Holtz TH, Iseman MD, Jarlsberg LG, Keshavjee S, Kim HR, Koh WJ, Lancaster J, Lange C, de Lange WC, Leimane V, Leung CC, Li J, Menzies D, Migliori GB, Mishustin SP, Mitnick CD, Narita M, O'Riordan P, Pai M, Palmero D, Park SK, Pasvol G, Pena J, Perez-Guzman C, Quelapio MI, Ponce-de-Leon A, Riekstina V, Robert J, Royce S, Schaaf HS, Seung KJ, Shah L, Shim TS, Shin SS, Shiraishi Y, Sifuentes-Osornio J, Sotgiu G, Strand MJ, Tabarsi P, Tupasi TE, van Altena R, Van der Walt M, Van der Werf TS, Vargas MH, Viiklepp P, Westenhouse J, Yew WW, Yim JJ. 2012. Multidrug resistant pulmonary tuberculosis treatment regimens and patient outcomes: an individual patient data meta-analysis of 9,153 patients. PLoS Med. 9(8):e1001300. 10.1371/journal.pmed.1001300 [DOI] [PMC free article] [PubMed] [Google Scholar]
- 12.WHO 2011. Guidelines for the programmatic management of drug-resistant tuberculosis: 2011 update. WHO, Geneva, Switzerland [Google Scholar]
- 13.Chigutsa E, Meredith S, Wiesner L, Padayatchi N, Harding J, Moodley P, Mac Kenzie WR, Weiner M, McIlleron H, Kirkpatrick CM. 2012. Population pharmacokinetics and pharmacodynamics of ofloxacin in South African patients with multidrug-resistant tuberculosis. Antimicrob. Agents Chemother. 56:3857–3863. 10.1128/AAC.00048-12 [DOI] [PMC free article] [PubMed] [Google Scholar]
- 14.Peloquin CA, Hadad DJ, Molino LP, Palaci M, Boom WH, Dietze R, Johnson JL. 2008. Population pharmacokinetics of levofloxacin, gatifloxacin, and moxifloxacin in adults with pulmonary tuberculosis. Antimicrob. Agents Chemother. 52:852–857. 10.1128/AAC.01036-07 [DOI] [PMC free article] [PubMed] [Google Scholar]
Associated Data
This section collects any data citations, data availability statements, or supplementary materials included in this article.