

Background: Podocyte injury can be caused by cytosolic cathepsin L activity, leading to foot process effacement and proteinuria.
Results: Glutamine blunts the damaging activity of induced cytosolic cathepsin L in podocytes by modulating intracellular pH.
Conclusion: Podocyte pH modulation is a novel way to tackle proteinuric kidney disease.
Significance: The optimization of amino acid metabolism fluxes and associated pHi of podocytes may form a basis for novel therapeutic approaches.
Keywords: Cell pH, Glutamine, Lipopolysaccharide (LPS), Metabolism, Podocyte
Abstract
Podocytes are highly differentiated cells and critical elements for the filtration barrier of the kidney. Loss of their foot process (FP) architecture (FP effacement) results in urinary protein loss. Here we show a novel role for the neutral amino acid glutamine in structural and functional regulation of the kidney filtration barrier. Metabolic flux analysis of cultured podocytes using genetic, toxic, and immunologic injury models identified increased glutamine utilization pathways. We show that glutamine uptake is increased in diseased podocytes to couple nutrient support to increased demand during the disease state of FP effacement. This feature can be utilized to transport increased amounts of glutamine into damaged podocytes. The availability of glutamine determines the regulation of podocyte intracellular pH (pHi). Podocyte alkalinization reduces cytosolic cathepsin L protease activity and protects the podocyte cytoskeleton. Podocyte glutamine supplementation reduces proteinuria in LPS-treated mice, whereas acidification increases glomerular injury. In summary, our data provide a metabolic opportunity to combat urinary protein loss through modulation of podocyte amino acid utilization and pHi.
Introduction
The central metabolism of a cell can determine its short and long term structure and function. When a disease state arises, the metabolism of cells, the overall substrate utilization, and production are altered in a way that cells can survive or adapt under the disease state physiology. Although the response of cells to injury is being studied thoroughly in various model systems, the knowledge regarding the cellular metabolism during disease in specialized eukaryotic cells is still quite obscure. Recent advances in analytical methods and mathematical tools have led to novel approaches to better define disease pathophysiology utilizing computational biology, which relies on the integration of experimentation, data processing, and modeling. The formulation of current knowledge in mathematical terms has led to the development of several mathematical modeling tools (i.e. metabolic flux analysis, metabolic control analysis, etc.) that helps to understand an entire biological system from basic structure to dynamic interactions. We have used metabolic flux analysis (MFA)2 to study the amino acid metabolism of kidney podocytes under normal and disease conditions with the purpose of finding critical metabolic pathways that can be utilized for therapeutic considerations.
Podocytes are specialized cells within the glomerulus that are essential for ultrafiltration. Glomerular diseases that originate from podocyte dysfunction represent a global health problem and affect some 100 million people worldwide (1). Podocytes form foot processes (FPs), highly dynamic small cellular compartments that are connected by specialized cell-cell junctions or slit diaphragms (2). The slit diaphragm contains numerous proteins important for size and charge selectivity of the kidney filter as well as for signaling events (3). Together with the glomerular basement membrane (GBM) and the glomerular endothelial cells, podocytes form a key component of the kidney permeability barrier (4). Most forms of proteinuria are characterized by a reduction of podocyte membrane extensions and transformation of podocyte FPs into a band of cytoplasm (referred to as FP effacement). The molecular framework and biochemical signals underlying normal podocyte function has been studied with great success elucidating critical podocyte proteins and pathways. In addition to genetic mutations that perturb podocyte function (5), acquired or secondary forms of podocyte damage are more commonly prevalent and can entail the induction of a cytosolic variant of the cysteine protease cathepsin L (cCatL) that in turn cleaves the large GTPase dynamin (6), synaptopodin (7), as well as CD2AP (8). These substrates regulate the normal cytoarchitecture and transcriptional control of podocytes that in turn allows for proper kidney filter function (6–9). What remains unclear is the metabolism of podocytes during the maintenance and degradation of the healthy podocyte structure and also how the podocyte metabolism is possibly related to their cytoskeletal regulations, which in turn influences the function of the kidney filtration barrier.
In this report, we describe the results from a de novo metabolic flux model for podocytes. Amino acid measurements obtained from in vitro models for podocyte injury were used as model inputs. We found that glutamine utilization and ammonia production pathways were critically enhanced in diseased podocytes. We manipulated glutamine uptake to titrate the podocyte pH and thus utilized metabolic means to regulate the activity of cCatL. Reduced cCatL activity protected podocytes and alkalinized podocytes displayed less cytoskeletal derangement. Mice loaded with glutamine have alkalinized glomeruli and develop less FP effacement and proteinuria in the LPS injury model.
EXPERIMENTAL PROCEDURES
Cells, Antibodies, and Standard Techniques
Mouse wild type (10), CD2AP−/− (11), α3−/−, and CatL−/− (12) podocytes and HEK 293 cells (6) were cultured as described previously. NIH 3T3 cells were cultured in Dulbecco's modified Eagle's minimal essential medium (Invitrogen) supplemented with 10% fetal calf serum (Invitrogen) and incubated in a humidified atmosphere of 95% air and 5% CO2 at 37 °C. Cells were treated with either 50 μg/ml puromycin aminonucleoside (PAN; Sigma-Aldrich) for 48 h or 50 μg/ml purified LPS from Escherichia coli O111:B4 strain (InvivoGen, San Diego, CA) for 24 h to study podocyte injury. Antibodies used for immunostaining are synaptopodin (7), Alexa Fluor 594 phalloidin (Molecular Probes, Eugene, OR), and DAPI (Molecular Probes). For Western blotting, rabbit polyclonal anti-synaptopodin antibody (7) was used at 1:500, rabbit polyclonal anti-cytosolic CatL antibody (8) was used at 1:2500, mouse monoclonal anti-actin antibody (clone AC-40; Sigma-Aldrich) was used at 1:1000, and anti-GAPDH antibody (clone 6C5; Abcam, Cambridge, MA) was used at 1:10,000. Signal intensities were measured by densitometry using ImageJ, a public domain image processing and analysis program developed by the National Institutes of Health. Preparation of whole cell extracts, subcellular fractionation, and Western blotting were performed as described previously (6).
Generating Stably Transfected Podocyte Clones
Proliferating mouse podocytes were transfected with mouse system N/A amino acid transporter 3 (SNAT3) construct and vector control cDNA (pcDNA3.1; Stratagene, La Jolla, CA) using FuGENE 6 transfection reagent (Roche Applied Science) according to the manufacturer's instructions. Forty-eight hours after transfection, stably transfected cells were selected in serial passages using Geneticin selective antibiotic (G418 sulfate; Invitrogen) at 500 μg/ml (100% lethal to untransfected podocytes). Clonal populations of stably transfected colonies were isolated by limiting dilution. Then the stably transfected clones were induced to differentiate as described above, except in the presence of a reduced concentration (200 μg/ml) of G418, and were characterized by Western blotting for SNAT3 expression.
Biochemical Measurements
Amino acid analysis was carried out by ion exchange chromatography using a Beckman 6300 amino acid analyzer (Beckman Coulter, Brea, CA). The concentrations of glucose, lactate, and urea in the culture medium were measured by using a glucose assay kit (Sigma-Aldrich), a d-lactate assay kit (Megazyme, Wicklow, Ireland), and a urea assay kit (BioAssay Systems, Hayward, CA), respectively, according to the corresponding manufacturer's instructions.
Immunofluorescence
Cultured cells were fixed in ice-cold 4% paraformaldehyde in PBS buffer for 10 min, permeabilized in PBS containing 0.3% Triton X-100 for 10 min, blocked (2% FBS, 2% BSA, and 0.2% fish-gelatin), and stained with appropriate primary and secondary antibodies. Specimens were analyzed using a LSM 5 PASCAL laser scanning microscope (Zeiss, Thornwood, NY) and a 40× objective.
Electron Microscopy
Ultrathin sections of the kidneys were examined with a Philips CM10 electron microscope. The number of podocytic FPs was counted in at least 10 different areas of representative glomeruli. In each area, the number of FPs was calculated within a distance of 1 μm on the GBM (13).
Semiquantitative RT-PCR
Cultured murine podocytes and mouse (C57BL/6) whole brain, kidney, and isolated glomeruli were treated with TRIzol reagent (Invitrogen) to allow complete cell lysis, followed by RNA extraction using the RNeasy kit (Qiagen). The quality of RNA samples was ascertained by measuring optical density (260/280) absorption ratio of ∼1.8 (range, 1.6–2.1) using a NanoDrop Spectrophotometer (Thermo Scientific, Waltham, MA). RNA was quantitated, and cDNA synthesis was performed using the Protoscript first strand cDNA synthesis kit (New England Biolabs, Ipswich, MA). For competitive PCR, the diluted cDNA was added to a reaction mixture consisting of specific primers for B7-1 and SNAT1 to SNAT6 (supplemental Table S1) in a Hybaid PCR Sprint thermal cycler (Thermo Scientific). Normalization of the PCRs was performed with the primers for the constitutive enzyme GAPDH. Gel electrophoresis analysis of the PCR products is performed in 1.5% (w/v) agarose gel with Quick-Load 100-bp DNA ladder (New England Biolabs).
Measurement of Inner Mitochondrial Membrane Potential (ΔΨm)
Podocytes were trypsinized and incubated in PBS containing 25 nm tetramethylrhodamine ethyl ester (TMRE) at 37 °C for 30 min. TMRE accumulates in cells in response to inner mitochondrial membrane potential (14). Then the cells were washed to remove excess TMRE, and the mitochondrial membrane potential (ΔΨm) was analyzed by FACSCalibur flow cytometry system and associated CellQuest software (Becton Dickinson).
Measurement of Total CatL Activity by Fluorogenic Assay
CatL activities in the presence and absence of glutamine in cultured mouse podocytes were measured using CV-CatL detection kit (Biomol, Farmingdale, NY). Briefly, untreated and LPS- and PAN-treated podocytes cultured in regular medium for 14 days and in regular medium for 7 days, and then glutamine-free (GF) media in the following 7 days at 37 °C were stained with Hoecsht stain (Biomol) in culture conditions for 5–10 min. Then the medium was removed, and cells were washed with PBS to avoid phenol red prior to the incubation with extraction buffer (25 μg/ml digitonin, 250 mm sucrose, 20 mm HEPES, 10 mm KCl, 1.5 mm MgCl2, 1 mm EDTA, 1 mm EGTA, 1 mm Pefabloc, pH 7.5) on ice for 10 min. Following the extraction, the assay buffer (Hanks' buffered saline solution, pH 7.0, containing 100 μm cathepsin fluorogenic substrate) were added in the presence of cathepsin B-specific inhibitor CA074 (Enzo Life Sciences, Farmingdale, NY) and 0.1% Triton X-100. Fluorescence was recorded every 10 min for 1 h with a 540–560-nm excitation filter and a 610-nm emission filter using Spectramax M5 multiwell plate reader (Molecular Devices, Sunnyvale, CA). Cathepsin L activity in living cells was visualizing with cresyl violet as a substrate as described previously (15).
Measurement of CatL Activity in Subcellular Fractions
Prior to enzyme assays, lysosomal and cytosolic fractions containing CatL were isolated by subcellular fractionation as described (6). Activity assays were performed using the CatL fluorescent substrate Z-Phe-Arg-7-amido-4-methylcoumarin hydrochloride (Sigma-Aldrich) at different pHi as described previously (8).
Measurement of pHi by a Fluorescent Probe
Podocytes were differentiated at 37 °C for 14 days (10) and harvested with trypsin. Intracellular pH was measured as described previously (16) with minor modifications. Briefly, the pelleted podocytes were rinsed twice with bicarbonate-free Krebs-HEPES buffer (130 mm NaCl, 4.7 mm KCl, 1.2 mm MgSO4, 1.2 mm KH2PO4, 11.7 mm d-glucose, 1.3 mm CaCl2, 10 mm HEPES, pH 7.4) and then were loaded with 2.5 μm green CMFDA (Molecular Probes) in the same buffer and incubated for 30 min at 37 °C. After dye loading, the cells were rinsed twice with the buffer, resuspended in fresh medium, and allowed to recover at 37 °C for 30 min. Then the cells were rinsed three times with the buffer and distributed evenly (∼40,000 cells/well) into an opaque clear-bottomed 96-well plate. Buffer alone was also loaded for baseline reading, and the fluorescence intensity was recorded at 1-min intervals for 15 min. A Spectramax M5 multiwell plate reader (Molecular Devices) was used to measure fluorescence. The wells were alternately excited at 485 and 440 nm, and emission was collected through a 538-nm filter. The ratios were then converted to absolute pHi values using the calibration procedure with nigericin, a K+/H+ exchanger ionophore (15). It was used to relate the fluorescence to pH value by setting [K+]out = [K+]in and pHout = pHin by exposing the cells to a depolarizing high phosphate buffer (140 mm KCl, 1.2 mm MgSO4, 1.2 mm KH2PO4, 11.7 mm d-glucose, 1.3 mm CaCl2, 10 mm HEPES) with different pH (6.0–8.0) in the presence of 20 μm nigericin.
Microarray Analysis
Total RNA was isolated from immortalized mouse podocytes using an RNeasy kit (Qiagen). A biotinylated cRNA target was generated and hybridized to an Affymetrix Mouse Genome 2.0 GeneChip arrays (Mouse 430 v2; Affymetrix, Santa Clara, CA). Microarray data were analyzed by using dChip 2005 software (17).
Animals and Treatments
All animal protocols and procedures were reviewed for ethical and humane standards and approved by Animal Care and Use Committee of the University of Miami. C57BL/6 mice were obtained from the Jackson Laboratory (Bar Harbor, ME). The mouse model LPS-induced proteinuria was utilized as previously described (6). Glutamine is injected intraperitoneally (0.75 mg/g of mouse) 10 min after LPS (10 μg/g of mouse) injection. Urine microalbumin was assessed by densitometric analysis of Bis-Tris gels (Invitrogen) loaded by standard BSA (Bio-Rad) and urine samples. The urine creatinine measurement was carried out using a colorimetric end point assay with a commercial kit (Cayman Chemical, Ann Arbor, MI).
In Vivo Gene Delivery
Myc-SNAT3 plasmids were introduced into C57BL6 mice using the TransIT in vivo gene delivery system (Mirus Bio, Madison, WI). In brief, 15 μg of plasmid DNA was mixed with 15 μl of Mirus polymer solution and 170 μl of endotoxin-free H2O. It then was topped with 1.8 ml of Mirus delivery solution before injection through tail vein. Proteinuria was assessed 24 h after gene delivery.
Isolation and Processing of Glomeruli
Glomeruli were isolated from kidneys of 8–12-week-old LPS-treated and SNAT3-injected mice using a sequential sieve technique with mesh sizes of 180, 100, and 71 μm. The fraction collected from the 71-μm sieve was homogenized in CHAPS buffer containing 20 mm Tris (pH 7.5), 500 mm NaCl, 0.5% (w/v) CHAPS, and Complete Mini protease inhibitors (Roche Applied Science) using Dounce homogenizer (Kimble Chase, Vineland, NJ). Subsequently, the extract was centrifuged for 10 min at 15,000 × g.
Solving the Metabolic Network by MFA
MFA starts with setting up a stoichiometric matrix for a network of reactions occurring in the cell. Considering the thousands of reactions taking place in the cell, it is obvious that not all of these can be included in the model. A total of 42 biochemical reactions and 26 metabolites were considered (see Fig. 1A). Then the mass balance constraints around intracellular metabolites were specified. These constraints identified a series of linear equations of individual reaction fluxes that must be fulfilled to enable steady state criterion. The reaction network and the mass balance constraints were summarized in the following matrix notation,
 |
where S is the mxn stoichiometry matrix, m is the number of metabolites, and n is the number of reactions. The vector, r, represents all the individual fluxes of intracellular and extracellular compounds. In this equation, S11 denotes the stoichiometric coefficient of the first metabolite in the first reaction, whereas S12 denotes for the stoichiometric coefficient of the first metabolite in the second reaction, etc. The right hand side of this equation is made equal to zero, assuming the cultured podocytes are in metabolic steady state where the intracellular levels of metabolites are constant (18).
FIGURE 1.

Increased amino acid metabolism in injured podocytes. A, the metabolic network model for podocyte cultures. Arrows indicate the direction of reaction and numbers refer to reaction numbers. Reactions and abbreviations of the metabolites are listed in supplemental Table S3. B and C, the uptake rates of glutamine (measured) and glucogenic amino acids (calculated by MFA) for the control (WT) and disease (LPS, PAN, and α3 integrin-KO) models, respectively. *, p < 0.05; **, p < 0.01 for the comparison of diseased podocytes with the WT cells. D, ammonia production rates calculated by MFA. Each bar represents the average from three separate experiments (B–D).
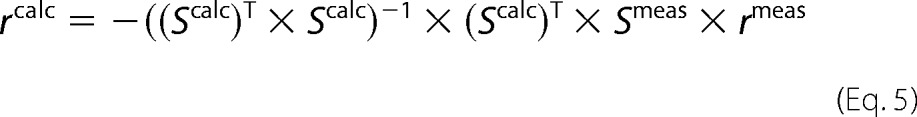
By separating r into measured and unknown components, rmeas and rcalc, respectively, and partitioning matrix S into Smeas and Scalc, where they contain the stoichiometric coefficients of measured and unknown reactions (i.e. internal and transport fluxes), respectively, we obtained
and
Because Scalc is not a square matrix, i.e. the number of rows is greater than the number of columns, Equation 3 cannot be solved by simple inversion. One approach was to use the Moore-Penrose pseudo-inverse method (18), in which each side of Equation 3 is multiplied by the transpose of Scalc.
The matrix multiplier of rcalc (i.e. (Scalc)T × Scalc) is now invertible, and Equation 4 is easily solved.
 |
Because the system of linear equations is overdetermined (more equations than unknown fluxes), fluxes are determined by linear regression (18, 19). The vector rcalc represents the best global fit to the linear system given by Equation 4, but individual vector elements may not exactly satisfy local constraints, i.e. a flux balance around a particular metabolite may not close completely, similar to the way individual points may not lie on the linearly regressed line found by minimizing the sum of the least square distances between all of the points and the line (19). All the matrix operations were performed by using MATLAB (Mathworks Inc., Natick, MA) and routinely took a few minutes for each measurement set on a DELL Inspiron laptop computer with an Intel Pentium M processor. The fluxes obtained were reported as μm × liter−1 × h−1 × (million cells)−1.
Statistical Analysis
The data are reported as means ± S.E. of at least three independent experiments. Differences between experimental groups were evaluated by Student's t test or one-way analysis of variance. The asterisks indicate a significant effect of the treatment when compared with the control, i.e. p < 0.05 (*), p < 0.01 (**), and p < 0.001 (***).
RESULTS
Construction of Podocyte Metabolic Network Model
To study the amino acid metabolism in podocytes, we constructed a metabolic network (Fig. 1A). This moderately detailed model was used as a basis for quantification of the fluxes for cultured podocyte cells. It is based on podocyte mitochondrial proteome expression analysis (20) and podocyte mRNA expression profiles (supplemental Table S2). This information was combined with a metabolic network information previously employed for hybridomas (21–24), CHO cells (25), HEK 293 cells (26, 27), and hepatocytes (28) because all eukaryotic cells share considerable similarities in their respective operative metabolic enzyme compositions.
In the derived podocyte model, there are 26 intracellular fluxes (supplemental Table S3). Intracellular fluxes are overall biochemical reactions representing major metabolic pathways: glycolysis (fluxes 1–5), reduction of pyruvate to lactate (flux 6), Krebs cycle (fluxes 7–14), amino acid metabolism (fluxes 15–23), pentose phosphate pathway (fluxes 24), and oxygen uptake and electron transport (fluxes 25 and 26) (supplemental Table S3). Glycolysis and glutaminolysis are mutually exclusive based on the experimental observations. Although the gluconeogenetic enzyme activities are higher than the activities of the glycolytic enzymes at the cortical segments of the nephron at which podocytes are located, the patterns of enzyme activities indicate that metabolic functions are unevenly distributed along the nephron (29). The demand for ribose-5-phosphate for nucleotide synthesis is negligible. We consider only the NADPH-generating oxidative branch of the pentose phosphate pathway, which is represented in a lumped fashion as reaction 24 in supplemental Table S3. This is justified because podocyte cells no longer proliferate in culture once they are differentiated. Energy requiring pathways for the biosynthesis of amino acids are negligible. The metabolic flow through most of the pathways involved in the biosynthesis of amino acids is much smaller than for carbohydrates and fats (28). Protein synthesis and protein degradation as an endogenous source of amino acids was neglected. We assumed that protein synthesis accounted for a small portion of the nitrogen metabolism in the cell. Glycogen metabolism is not considered in the model; we did not measure glycogen-derived metabolites. All pathways were verified as feasible for Mus musculus using bioinformatics databases (30–32).
To estimate the intracellular fluxes, MFA employs only measurements of uptake and production rates (i.e. influxes into and outfluxes from cells) that are stoichiometrically balanced (18). Twelve fluxes for transport rates and biosynthesis rates (8 amino acids, glucose, lactate, ornithine, and urea, as listed in supplemental Table S4) are measured. The transport fluxes are formally defined for each measured metabolite, and each rate is defined with a positive sign for production. However, the mechanism of transport is not included because of the difficulty of assessing the amounts of material entering via passive and active processes (33). Each extracellular metabolite is linked to its intracellular counterpart metabolite pool and 42 metabolites (supplemental Table S4) constitute the nodes for mass balances. This purely stoichiometric approach has some limitations, but most of them can be overcome with simple extensions: The information embedded in the metabolic network was used under the pseudo steady state assumption, thus not requiring the knowledge of kinetic parameters, which are still rarely known (34, 35). We also assumed that there is a single pool of intracellular metabolites; thus intracellular rates represent an average for the whole cell. This assumption is based on the fact that several metabolites are able to cross the mitochondrial membrane, either directly or via effective shuttle systems (i.e. malate-aspartate shuttle to transport NADH) and thus equilibrate between the cytoplasmic and mitochondrial spaces (24).
MFA Emphasizes Glutamine Utilization Pathways for Podocyte Function
We utilized cultured normal mouse podocytes (control) (10) and three in vitro models for podocyte damage: (i) podocytes with α3 integrin deletion (α3−/−, genetic model) (12); (ii) podocytes treated with lipopolysaccharides (LPS, immunological model) (36); and (iii) podocytes treated with PAN (toxic model) (37). We studied the metabolism of these podocyte models using the podocyte network (Fig. 1A) and simulated the podocyte amino acid and glucose utilization. The flux analysis uncovered that the amino acid metabolism of podocytes is changed in disease. We found that podocyte glutamine uptake rate is 1.6–2.1 times higher in disease models than the rate in the control cultures (Fig. 1B). Glutamine is involved in a wide variety of metabolic pathways and plays key roles in many physiological processes in various organs (38, 39). Glutamine is the most abundant plasma amino acid (40, 41), as well as the most plentiful amino acid, in routine podocyte culture medium used for cell culture. Of note, α3−/− cells displayed the highest rate of glutamine uptake (Fig. 1B). We also analyzed glutamine uptake in other mammalian cells (HEK 293 and NIH 3T3). However, these cells did only respond to PAN but not to LPS in increasing glutamine uptake rate (supplemental Fig. S1), lending some degree of specificity to podocyte-noxious stimuli in increasing podocyte glutamine uptake.
This glutamine-avid behavior of injured podocytes is similar to glucose uptake, which is 1.5–2.1 times higher in disease models than the control podocytes (supplemental Fig. S2A), indicating a higher need of substrates under disease conditions. The majority of glucose is converted into pyruvate through the glycolytic pathway. Pyruvate produced from glucose can then be converted into end products, such as lactate, to regenerate NAD+ needed for glycolysis (supplemental Table S3) and acetyl CoA, a reaction catalyzed by the mitochondrial pyruvate dehydrogenase enzymatic complex (supplemental Table S2). Acetyl-CoA is a high energy intermediate that can be further oxidized by the Krebs cycle or used for fatty acid synthesis. The Krebs cycle is initiated by the condensation of oxaloacetic acid with acetyl-CoA, forming citrate (Fig. 1A). In reactions involving decarboxylation and oxidation, CO2 is produced, and NADH (nicotinamide adenine dinucleotide) and FADH (flavin adenine dinucleotide) are produced for use in the mitochondrial respiratory chain (supplemental Table S3). Lactate is, on the other hand, a metabolic cul de sac, which is connected to the metabolic network only through pyruvate by the redox enzyme lactate dehydrogenase. Every organ is able to release lactate because all cells contain the set of enzymes allowing the conversion of glucose into lactate (42). The lactate production rates for the control, genetic, immunological, and toxic models were 14.0 ± 1.2, 15.5 ± 5.1, 20.0 ± 2.4, and 19.8 ± 4.1 μm × liter−1 × h−1 × (million cells)−1, respectively (supplemental Fig. S2B). Higher lactate production rates in disease models are the results of higher use of glucose than the control model based on the assumption that lactate generated by cultured cells was only derived from glucose. Our assumption was largely supported by NMR experiments with hybridoma cells (43, 44). The amount of lactate derived from glutamine was not determined in our studies. The conversion of glycolytic metabolites into Krebs cycle intermediates is low in all models (data not shown). Also, the pentose phosphate pathway (flux 24) is not very active; only 1–2% of the glucose carbons flow through pentose cycle to generate NADPH in all models. The low level of podocyte mRNA signal for glucose-6-phosphate dehydrogenase (supplemental Table S2), which is the first enzyme in this pathway, confirms this finding. Of note, the pentose phosphate pathway is important in generating ribose-5 phosphate, which is a precursor for nucleotide synthesis in proliferating cells.
Glutaminolysis, Ammonia Production, and Uptake Rates of Glucogenic Amino Acids Are Increased in All Podocyte Disease Models
Glutaminolysis is related to the glucogenic amino acid uptake (i.e. the uptake rate of all amino acids except leucine and lysine). Therefore, we analyzed glucogenic amino acid uptake rates of all models. In Fig. 1C, the sum of the uptake rates of all glucogenic amino acids except glutamine were analyzed for control (WT) and disease models. We observed a similar pattern of increased nutrient utilization highlighting the relevance of glutamine uptake and glutaminolysis.
Another indirect measure of glutaminolysis is ammonia production in the mitochondria. Considering that a glutamine molecule consists of two nitrogen atoms and that each of glutamate, alanine, and aspartate molecules contain one nitrogen atom, the nitrogen balance was calculated as the difference between twice the glutamine removed and the sum of glutamate, alanine, and aspartate accumulated. These calculations revealed that the amount of nitrogen incorporated by podocytes (mainly from glutamine uptake) exceeded the amount of nitrogen removed as glutamate, alanine, and aspartate by 3.4 ± 0.9, 6.4 ± 0.4, 6.8 ± 1.6, and 8.1 ± 1.0 μmol × liter−1 × h−1 × (million cells)−1 in control, immunological, toxic, and genetic models, respectively. This suggests that a considerable part of nitrogen was released in the form of ammonia (calculated and simulated) (Fig. 1D).
In sum, mitochondrial glutamine utilization and metabolism are increased in the analyzed podocyte disease models. Glutamine metabolism of podocytes in all disease models favor deamination (i.e. removal of an amine group as in flux 18; supplemental Table S3) rather than transamination pathways (i.e. the transfer of an amine group from one molecule to another as in flux 20) that are controlled by glutamate dehydrogenase and alanine aminotransferase activities (supplemental Table S2), respectively. Eventually, the ammonia buildup reached higher levels in disease cultures (Fig. 1D).
Podocytes Induce Expression of SNATs during Injury
Amino acid transporters are a group of membrane proteins transporting various amino acids across the membrane and providing substrates for many essential cellular functions (45). Having identified increased glutamine uptake and utilization as a signature for diseased podocytes that varies from other nondifferentiated eukaryotic cells (supplemental Fig. S1), we studied the expression of system A (SNAT1, 2, and 4) and system N (SNAT3, 5, and 6) family members of sodium-coupled neutral amino acid transporters in cultured podocytes (Fig. 2A). Glutamine is known to be a favored substrate throughout the family, except for SNAT4 (46). We also studied these transporters in isolated mouse glomeruli (Fig. 2B). All SNATs were expressed other than SNAT3 and 5; SNAT 4 were only found at low levels. Interestingly, mice stimulated with LPS increased markedly the expression of SNAT3. SNAT3, formerly known as SN1 (Slc38a3), is known as an antiporter that functions in the presence of Na+ and takes up glutamine for the exchange of H+. It is highly expressed on the mRNA and protein level in the kidney during metabolic acidosis and involved in the regulation of acid-base homeostasis (47–49). In cultured podocytes, we also found a prominent induction of SNAT3 after LPS but not SNAT4 and 5 (Fig. 2A). The induction of SNAT3 mRNA was paralleled by a strong protein induction of SNAT3 in cultured podocytes stimulated with PAN (Fig. 2C). The primers were performance-tested in a control PCR using cDNAs from the kidney and brain of control (C57BL/6) mice (Fig. 2D).
FIGURE 2.

Glutamine transporter profiles in mouse glomeruli and cultured mouse podocytes. A and B, the increased mRNA expression of glutamine transporters, SNATs, in cultured wild type (CTL) and α3 integrin KO (α3−/−) mouse podocytes (A) and mouse glomeruli (B). SNAT3, B7-1, and GAPDH mRNA expression levels were assessed by standard RT-PCR. B7-1 expression was up-regulated with LPS and included as a control for LPS treatment (50 μg/ml for 24 h) and injection (10 μg/g of mouse). GAPDH served as a loading control. C, Western blot analysis showing the increased levels of the SNAT3 protein expression after PAN treatment (50 μg/ml for 48 h) of the cultured wild type (CTL) mouse podocytes (top). The band intensities are normalized to that of GAPDH and expressed as fold change (bottom). *, p < 0.05 for the comparison of PAN-treated podocytes with the untreated cells. D, control PCR experiments were performed using cDNAs from whole kidney and brain of control (C57BL/6) mice. E, IF staining for SNAT3 (green) and nuclei (blue) showing enhanced binding of SNAT3 antibody along the capillary walls (the right panel shows higher magnification) of the PAN-treated rat glomeruli (early stage). F, immunogold EM study of kidney sections, cut perpendicular to GBM. Immunogold labeling for SNAT3 in rat kidney glomeruli was restricted to the mitochondria of the podocytes. Even more gold particles were present in the mitochondria of the PAN-treated rat kidney glomeruli (right). G, mitochondrial membrane potential (ΔΨm) for wild type podocytes (WT), podocytes treated with PAN, and podocytes overexpressing SNAT3 (SNAT3OE) were quantified using a mitochondria-specific dye (TMRE) and represented as fold changes in cell counts. *, p < 0.05; **, p < 0.01 for the comparison of PAN-treated and SNATOE podocytes with the WT cells, respectively. Each bar represents the average from three separate experiments (C and G).
SNAT3 Protein Is Localized in Podocyte Mitochondria
To analyze the expression of SNAT3 in glomeruli, we carried out immunogold EM. Next, we performed immunohistochemical analysis of SNAT3 in normal and PAN-treated rats. We observed SNAT3 expression along the capillary wall consistent with podocyte expression in the early phase of the PAN-treated rat glomeruli (Fig. 2E). It was expressed in podocyte mitochondria as revealed by immunogold localization (Fig. 2F). Higher magnification showed expression of SNAT3 at the mitochondrial membrane (Fig. 2F). Immunogold particles for SNAT3 are most numerous in the mitochondria of the PAN-treated rats (day 4) (Fig. 2F). We also tested the mitochondrial membrane potential (ΔΨm, a charge or electrical gradient) in cultured podocytes before and after PAN and in podocytes that have stable overexpression of SNAT3 (SNAT3OE). The ΔΨym regulates reactive oxygen species production and a central regulator of cell health (50). The PAN-treated podocytes had higher mitochondrial membrane potential (1.20 ± 0.18-fold versus CTL), and it was further increased in SNAT3OE podocytes (1.84 ± 0.08-fold versus CTL), suggesting that the mitochondrial performance is partly regulated by SNAT3 (Fig. 2G).
Acidification of Cytosol during Podocyte Injury Increases CCatL Activity
Having observed mitochondrial dysfunction in cultured podocytes in response to SNAT3 overexpression (Fig. 2G), as well as increased LPS-mediated proteinuria that is largely CatL dependent (6), we wondered whether the antiport of glutamine and H+ mediated by mitochondrial SNAT3 (as seen after LPS, PAN, for α3−/− and SNAT3OE) is linked to cCatL, possibly through cytosolic pH modulation. Thus, we used the fluorescent dye CMFDA that captures changes in intracellular pH (pHi) by alterations in fluorescence (51). Fluorescent ratios were generated and then converted to absolute phi values using standard calibration nigericin (16), a K+/H+ exchanger ionophore (Fig. 3A). We found that control podocytes had a more alkaline cytosol (with a pHi of 7.34 ± 0.04) when compared with podocytes treated with LPS (7.21 ± 0.06), PAN (6.96 ± 0.09), after genetic deletion of α3 integrin (7.17 ± 0.03) or after overexpression of SNAT3 (7.13 ± 0.04) (Fig. 3B). Next, we analyzed subcellular fractions of CD2AP−/− podocytes known to express high levels of cCatL (8). When comparing the pHi versus activity profiles of lysosomal and cytosolic CatL containing fractions, we found that cCatL activity has its pHi optimum at 7.00, whereas lysosomal CatL has maximum activity at pHi 5.50 (Fig. 3C). Moreover, all examined glomerular disease-causing stimuli/conditions were associated with a downshift of the podocyte pH. We repeated the activity assays for the cytosolic fractions of wild type podocytes and found out a similar trend of increasing CatL activities at the pH values measured for the diseased podocytes, the only exception being the pHi optimum, which is at 6.80 (supplemental Fig. S3).
FIGURE 3.

SNAT3 overexpression acidifies podocytes and provides a favorable pHi milieu for cCatL activity. A, the pH standard curve with the green CMFDA, measured at 485 and 440 nm, yielded a linear range from pH 6.0 to pH 8.0 (R2 = 0.98). B, bar graph showing the pHi in control podocytes (WT), disease models (LPS, PAN, and α3 Integrin KO), and podocytes overexpressing SNAT3 (SNAT3 OE). C, the isolated soluble fractions harvested from podocytes that lack CD2AP expression had the maximum levels of lysosomal and cCatL activities at pHi 5.5 and 7.0, respectively. The projections of the podocyte pH for different models were also shown on the cCatL curve (right). D, Western blot showing high level of SNAT3 expression in mice injected with Myc-tagged SNAT3 DNA (n = 5). E, mice injected with Myc-SNAT3 and LPS together had even higher proteinuria levels when compared with the mice injected with only LPS. The delivery of Myc-SNAT3 does not cause any significant increase in protein/creatinine levels. *, p < 0.05 for the comparison of mice injected with Myc-SNAT3 and LPS together with the LPS-injected mice. F, electron microscope analysis of the LPS-treated (n = 5), Myc-SNAT3-injected (n = 5), and both LPS-treated and Myc-SNAT3-injected (n = 5) kidneys (arrows show the sites of foot process effacement). The mean number of podocyte FPs along the GBM was evaluated within a distance of 1 μm (right). ***, p < 0.001 for the comparison of SNAT3-injected mice with both LPS-injected mice and mice injected with Myc-SNAT3 and LPS together, respectively. Each bar represents the average from three separate experiments (B, C, E, and F). Lyso, lysosomal; Cyto, cytosolic.
Mice with SNAT3 Overexpression Develop More Severe Proteinuria under Injury Conditions
We next tested the effect of SNAT3 overexpression on glomerular barrier function in mice. A Myc-SNAT3 plasmid was delivered via tail vein injection as described before (6). In other sets of experiments, mice were injected with LPS 10 min earlier than gene delivery of the control plasmid pcDNA3.1(−) and Myc-SNAT3, respectively. We collected the urine and sacrificed mice 24 h after the gene delivery. SNAT3 was expressed well in glomeruli isolated from mice (Fig. 3D). Although the overexpression of SNAT3 in wild type mice did not cause any proteinuria per se, the concomitant administration of LPS led to a significantly increased proteinuria when compared with the LPS-treated wild type mice that expressed a control plasmid alone (Fig. 3E). We next compared the FP morphology of wild type mice before and after administration of LPS, SNAT3, and LPS and SNAT3 together (Fig. 3F). Gene delivery of SNAT3 does not change the ultrastructure of podocyte FPs in wild type C57BL/6 mice (Fig. 3F, middle EM panel). However, concomitant LPS treatment leads to FP effacement (Fig. 3F, left and right EM panels).
Glutamine Alkalinizes Podocytes
Given the observation that podocyte pH modulation affects CatL activity in the cytosol, we wondered whether the avidity of podocytes toward glutamine as revealed by MFA could be utilized for increasing podocyte cytosolic pH. We utilized both wild type and α3 integrin-deficient podocytes and cultured those cells in regular medium for 7 days and glutamine-free medium during the following 7 days (GF in Fig. 4). Comparing the results with the cells cultured in the regular media for 14 days (REG in Fig. 4), there was no decrease in cell numbers in both healthy and disease cells, and the differentiated cells had morphological characteristics similar to the ones cultured in regular medium (data not shown). In both cell lines, the CMFDA signal was weaker (supplemental Fig. S4), and pHi was lower when glutamine was absent (Fig. 4A). We measured 0.20 ± 0.11 and 0.26 ± 0.09 unit drops in pHi values for WT and α3−/− podocytes, respectively. The more acidified cytosol with the absence of glutamine was also reflected as an increase in total cellular CatL activity in podocytes during LPS- or PAN-mediated injury when the CatL activity was measured by in vitro fluorogenic assay with the intact cells (Fig. 4B).
FIGURE 4.

Glutamine modifies pHi and CatL activity in podocytes. A, the cCatL activity of wild type podocytes cultured in regular medium for 14 days (REG) and regular medium for 7 days and glutamine-free medium in the following 7 days (GF) over the time of fluorogenic reaction. B, Western blot shows the levels of cCatL and GAPDH in cytosolic extracts of podocytes cultured in REG and GF media, respectively. UNT, untreated; LPS, LPS-treated; PAN, PAN-treated. *, p < 0.05 for the comparison of CatL activities measured in LPS- and PAN-treated podocytes cultured in the absence (GF) and presence of glutamine (REG), respectively. C, the cCatL activities are calculated as rates, i.e. per time (A), and then normalized by cCatL and GAPDH protein expressions (B), which were quantified by using ImageJ software. D, the increased fluorescence indicates a more alkaline environment. E, CatL activities in podocytes cultured in regular medium for 14 days and in regular medium for 7 days and then in glutamine-free medium (GF) in the following 7 days at 37 °C. When the cells are deprived of glutamine, CatL activities are significantly higher in LPS- and PAN-treated cells compared with the ones cultured in the presence of glutamine. *, p < 0.05 for the comparison of cCatL activities measured in LPS- and PAN-treated podocytes cultured in the absence (GF) and presence of glutamine (REG), respectively. F, presence of glutamine in cell culture medium improves F-actin presence in cultured WT podocytes after LPS treatment when compared with WT podocytes grown in the absence of glutamine (upper panel), as determined by phalloidin staining. The absence of CatL protects from LPS-mediated loss of F-actin (lower panel, left). Quantification of stress fibers shows the loss of stress fibers in the absence of glutamine (lower panel, right) (n = 10 for each bar). *, p < 0.05 for the comparison of the number of stress fibers counted in CTL podocytes with both LPS-treated podocytes and podocytes cultured in the absence of glutamine (GF), respectively. *, p < 0.01 for the comparison of the number of stress fibers counted in the untreated podocytes with LPS-treated podocytes cultured in the absence of glutamine (GF). G, synaptopodin staining of WT and α3−/− podocytes when the cells are grown in regular medium for 14 days and in regular medium for 7 days and glutamine-free medium in the following 7 days at 37 °C (left panel). Western blot shows lower levels of synaptopodin expression in WT and α3−/− podocytes when the cells are grown in regular medium for 7 days and in glutamine-free medium in the following 7 days at 37 °C (right panel). Comparable densities were obtained in all lanes when the blot membranes were probed with actin-specific antibody served as the loading control. Synpo, Synaptopodin. Each bar represents the average from three separate experiments (A, B, and E).
We also studied whether the activity of CatL in the isolated cytosolic fractions is changed in untreated, LPS- and PAN-treated podocytes cultured in the absence (GF) or presence of glutamine (REG). We performed the activity assay using the CatL fluorescent substrate Z-Phe-Arg-7-amido-4-methylcoumarin hydrochloride at the pHi reflecting the in vitro conditions (see Figs. 3B and 4A) and observed an increased yield of fluorescence for PAN- and LPS-treated cells when compared with the untreated cells (Fig. 4C). To quantify the relative abundance of cCatL in the reaction volume of each set, we ran a Western blot using those extracts and incubated the membranes with cCatL and GAPDH antibodies (Fig. 4D). The bar graph shows cCatL activity rates normalized with the protein expression and show the significant increases of cCatL activities in LPS- and PAN-treated fractions obtained from podocytes cultured in the absence of glutamine (GF) when compared with the activities in LPS- and PAN-treated fractions obtained from podocytes cultured in the regular media (REG), respectively (Fig. 4E).
According to the known role of cCatL in podocytes during glomerular disease (6–8), there is a prominent induction of cCatL expression and activity and a strong effect on the podocyte actin cytoskeleton through cleaving the GTPase dynamin (6), the actin-associated protein synaptopodin (7), and slit diaphragm-associated CD2AP (8). These cleavage events lead to a reduction of the F-actin cytoskeleton in podocytes (6, 7) and lower the survival threshold (8). In keeping with these reports, F-actin stress fibers are usually running in parallel bundles from one edge to the other in crossing the center of the cell but showed a strong reduction in podocytes when glutamine was absent (Fig. 4F, upper IF panel, bar graph). In addition, the LPS treatment caused more severe injury when glutamine was absent, because there were lots of broken actin fibers with many barbed ends in the middle (Fig. 4F, upper IF panel, bar graph). The glutamine-dependent changes in F-actin structures are not present in podocytes that lack CatL again linking the action of glutamine to the activity of CatL in podocytes (Fig. 4F, lower IF panel, bar graph). Because cCatL is present at low levels in podocytes, we compared the localization and expression of synaptopodin, a major substrate for cCatL, under the presence or absence of glutamine. The cellular distribution, as well as the expression of synaptopodin, was altered in both wild type and α3−/− podocytes shown by immunostaining (Fig. 4G, left panel) and Western blotting (Fig. 4G, right panel). Together, these data suggest that glutamine can affect the activity of cCatL by modulating podocyte pH.
Treatment of Mice with Glutamine Increases Podocyte pH and Protects from LPS-induced Proteinuria
To translate our in vitro findings of podocyte protection into a kidney disease relevant model, we utilized the LPS model in mice known to cause podocyte FP effacement and proteinuria driven by induction of cCatL (6). To this end, mice were either injected with only LPS or treated with high dose (0.75 mg/g) glutamine injection 10 min after LPS administration. We analyzed the relative alkalinity of glomeruli using isolated glomeruli that were incubated with green CMFDA. Similar to our in vitro findings in cultured podocytes, isolated glomeruli showed increased alkalinity in the group of mice that received LPS and high dose glutamine load (Fig. 5A). We also tested renal function and measured proteinuria in these mice. We found significantly lower amounts of urinary protein/creatinine ratio in LPS-treated mice that were glutamine-loaded when compared with LPS-treated animals without glutamine supplementation (Fig. 5B). These effects were also visible on an ultrastructural level (Fig. 5C). We semiquantitated the morphology of podocyte FPs and found decreased FP effacement in mice that received a combination of LPS and glutamine compared with mice that received just LPS (Fig. 5C).
FIGURE 5.

Glutamine excess protects glomerular function and structure. A, mice injected with PBS (CTL), LPS, and LPS + glutamine (LPS+GLN). Glutamine injections are associated with increase in CMFDA fluorescence after LPS stimulation in mice, showing an increase in glomerular pH (n = 10). **, p < 0.01 for the comparison of LPS + glutamine-injected mice with both CTL and LPS-injected mice. B, proteinuria was assessed 24 h after injections. A statistically significant increase in proteinuria was observed in mice injected with LPS when compared with the values measured for mice injected with LPS + glutamine after 24 h (n = 10). **, p < 0.01 for the comparison of LPS-injected mice with both CTL and LPS + glutamine-injected mice. C, representative EM images from the LPS and LPS + glutamine-injected mice were used for morphometric analysis of podocyte FP effacement (left panel). The mean number of podocyte FPs along the GBM was evaluated within a distance of 1 μm (right panel). *, p < 0.05 for the comparison of LPS + glutamine-injected mice with the LPS-injected mice. Each bar represents the average from three separate experiments (A–C).
DISCUSSION
The kidney has long been the subject of metabolic studies (52–56). It has the capacity to metabolize a large variety of substrates (e.g. glucose, lactate, glutamine, free fatty acids, ketone bodies, citrate, and glycerol) depending on their availability in the circulating blood. With increasing knowledge of metabolic pathways of carbohydrate, lipid, and amino acid metabolism, most metabolic steps were found to be active in the kidney (57). Because of the variability in structural and functional integrity of intrarenal structures, information about proteins for individual structures is necessary. The data that are obtained from proteomic analysis of whole kidney do not provide any information regarding localization. Therefore, proteomic analyses for individual intrarenal proteomes are needed to better understand the renal physiology. At the glomerular level, a recent study by He et al. identified glomerular transcriptional profiles and protein-protein interaction network (58). Ransom et al. (59) attempted to construct a proteome map for podocyte cells for the first time. They examined a differential analysis of changes in protein expression in cultured murine podocytes in response to glucocortioids. A total of 106 proteins representing 88 unique proteins were identified in their podocyte proteome map. Together, these findings pointed to a complex intrarenal organization of metabolic pathways.
The understanding of the central podocyte metabolism during FP effacement is in its infancy and might harbor important possibilities that can be exploited to help podocyte cells adapt under disease conditions and to improve their structure and viability. One way for characterizing the intracellular metabolism of cultured podocytes under normal and disease conditions is the identification of the flux distributions by MFA because it offers the advantage of simplicity, i.e. it solely relies on the known stoichiometry of a given biochemical reaction network. We used MFA of cultured podocytes that mimic podocytes during glomerular kidney disease and characterized their amino acid metabolism. It is a moderately detailed model, adapted in part from other eukaryotic cells that we use as a basis for quantification of the fluxes for the cultured podocyte cells (20). We studied three podocyte in vitro disease models: (i) podocytes with α3 integrin deletion (genetic model) (12), (ii) podocytes treated with LPS (immunological model) (36), and (iii) podocytes treated with PAN (toxic model) (37). The common denominator of all these cell models is the rearrangement of the actin cytoskeleton.
Glutamine is the most highly concentrated free amino acid in our podocyte medium because it is in the blood of humans and numerous animal species. Although it is considered to be a nonessential amino acid, several studies (60) demonstrated that glutamine has immunomodulating properties during catabolic stress in which its levels in cells and plasma decline rapidly. It is an important fuel source for diverse cell types, especially epithelial (61) and immune cells (62). We found podocytes to be very glutamine-avid, which provides an unexpected opportunity for this amino acid in capitalizing on its effects in the podocyte cytosol. Providing large amounts of glutamine to injured podocytes is resulting in stabilizing podocyte cell function, in particular through modification of podocyte pH and associated effects on cCatL. This opportunity stems from the metabolic pathway regulation in diseased podocytes that is represented by glutamine uptake, nitrogen turnover, and ammonia production. Most likely, these metabolic adjustments can be seen as part of stress-related pathways activated in podocytes under damaging conditions.
Because our model revealed glutamine metabolism as a common signature in diseased podocytes, we next focused on the glutamine transporters in podocytes. Six isoforms of the SNATs were expressed in podocytes and up-regulated in disease. Our findings in podocytes are consistent with a glutamine-avid state that can be utilized to transport large amounts of glutamine into the cell by Na+/H+ exchange activity, where it performs important functions including regulation of pHi and cell volume (63). The effects of supplemented glutamine are the rise in podocyte pH that in turn reduces the activity of CatL known to play a major pathogenic role in podocytes after LPS or PAN (6), as well as in the absence of α3 integrin (12) (Fig. 6).
FIGURE 6.

pH modulation in podocytes. Schematic outlining the buffering of induced cCatL activity during podocyte disease by adjusting the podocyte pH via glutamine. Cytosolic CatL activity is induced when the pHi is downshifted aggravating podocyte injury. Buffering the pHi in podocytes with pharmacological amounts of l-glutamine ameliorates cCatL activity and protects from podocyte injury.
Probably the most surprising finding of the study is the protection of podocytes in mice that were loaded with glutamine. Even though glutamine is the most abundant amino acid in the blood, supplementation by injection is maximizing the effect on renoprotection. Interestingly, recent papers have provided evidence that alkalinization of blood in chronic kidney disease patients is associated with improved survival and reduction of proteinuria (64). It is possible that this benefit is at least in part from podocyte protection. In support of this hypothesis, there is protection from F-actin rearrangement, reduced FP effacement, and proteinuria in alkalinized podocytes. Although it can be envisioned that glutamine might not be the only candidate in alkalinizing podocytes during glomerular disease, our data provide proof of concept that alkalinization of podocytes with amino acids like glutamine is a novel mode of therapeutic area that will require intensified attention. Additional studies will be necessary to further accelerate alternative modes of podocyte pH regulation and to facilitate the discovery of new therapeutic targets, biomarkers, and ultimately refined strategies to prevent and treat glomerular kidney disease.
Supplementary Material
Acknowledgments
We thank Kutlu O. Ulgen (Bogazici University, Istanbul, Turkey), Tunahan Cakir (Gebze Institute of Technology, Kocaeli, Turkey), and Kazim Y. Arga (Marmara University, Istanbul, Turkey) for helpful discussions during metabolic network construction; Dr. Vivian Shih and Victor Nikiforov (Massachusetts General Hospital, Boston, MA) for help in performing the amino acid analyses; Mary Montgomery (University of Miami) and Isabel C. Fernandez (Rush University) for assistance with the animal experimentation; and Mary McKee (Massachusetts General Hospital) and Margaret Bates (University of Miami) for skilled preparation of serial sections and electron microscopy.
This work was supported, in whole or in part, by National Institutes of Health Grant DK073495 (to J. R.). This work was also supported by funds from the Ajinomoto Amino Acid Research Program (to J. R.) and Welch Foundation Grant AQ-1507 (to J. X. J.). D. Reiser is an inventor of issued and pending patents related to proteinuric kidney disease diagnostic and treatment, and he stands to gain royalties from future commercializations.

This article contains supplemental Tables S1–S4 and Figs. S1–S4.
- MFA
- metabolic flux analysis
- FP
- foot process
- cCatL
- cytosolic cathepsin L
- GBM
- glomerular basement membrane
- PAN
- puromycin aminonucleoside
- TMRE
- tetramethylrhodamine ethyl ester
- GF
- glutamine-free
- CMFDA
- 5-chloromethylfluorescein diacetate
- CTL
- control
- SNAT
- system N/A amino acid transporter.
REFERENCES
- 1. United States Renal Data System (2013) USRDS 2013 Annual Data Report, USRDS Database, Minneapolis, MN, Chapter 12, pp. 333–343 [Google Scholar]
- 2. Reiser J., Kriz W., Kretzler M., Mundel P. (2000) The glomerular slit diaphragm is a modified adherens junction. J. Am. Soc. Nephrol. 11, 1–8 [DOI] [PubMed] [Google Scholar]
- 3. Benzing T. (2004) Signaling at the slit diaphragm. J. Am. Soc. Nephrol. 15, 1382–1391 [DOI] [PubMed] [Google Scholar]
- 4. Mundel P., Kriz W. (1995) Structure and function of podocytes: an update. Anat. Embryol. 192, 385–397 [DOI] [PubMed] [Google Scholar]
- 5. Tryggvason K., Patrakka J., Wartiovaara J. (2006) Hereditary proteinuria syndromes and mechanisms of proteinuria. N. Engl. J. Med. 354, 1387–1401 [DOI] [PubMed] [Google Scholar]
- 6. Sever S., Altintas M. M., Nankoe S. R., Möller C. C., Ko D., Wei C., Henderson J., del Re E. C., Hsing L., Erickson A., Cohen C. D., Kretzler M., Kerjaschki D., Rudensky A., Nikolic B., Reiser J. (2007) Proteolytic processing of dynamin by cytoplasmic cathepsin L is a mechanism for proteinuric kidney disease. J. Clin. Invest. 117, 2095–2104 [DOI] [PMC free article] [PubMed] [Google Scholar]
- 7. Faul C., Donnelly M., Merscher-Gomez S., Chang Y. H., Franz S., Delfgaauw J., Chang J. M., Choi H. Y., Campbell K. N., Kim K., Reiser J., Mundel P. (2008) The actin cytoskeleton of kidney podocytes is a direct target of the antiproteinuric effect of cyclosporine A. Nat. Med. 14, 931–938 [DOI] [PMC free article] [PubMed] [Google Scholar]
- 8. Yaddanapudi S., Altintas M. M., Kistler A. D., Fernandez I., Möller C. C., Wei C., Peev V., Flesche J. B., Forst A. L., Li J., Patrakka J., Xiao Z., Grahammer F., Schiffer M., Lohmüller T., Reinheckel T., Gu C., Huber T. B., Ju W., Bitzer M., Rastaldi M. P., Ruiz P., Tryggvason K., Shaw A. S., Faul C., Sever S., Reiser J. (2011) CD2AP in mouse and human podocytes controls a proteolytic program that regulates cytoskeletal structure and cellular survival. J. Clin. Invest. 121, 3965–3980 [DOI] [PMC free article] [PubMed] [Google Scholar]
- 9. Asanuma K., Yanagida-Asanuma E., Faul C., Tomino Y., Kim K., Mundel P. (2006) Synaptopodin orchestrates actin organization and cell motility via regulation of RhoA signalling. Nat. Cell Biol. 8, 485–491 [DOI] [PubMed] [Google Scholar]
- 10. Mundel P., Reiser J., Zúñiga Mejía Borja A., Pavenstädt H., Davidson G. R., Kriz W., Zeller R. (1997) Rearrangements of the cytoskeleton and cell contacts induce process formation during differentiation of conditionally immortalized mouse podocyte cell lines. Exp. Cell Res. 236, 248–258 [DOI] [PubMed] [Google Scholar]
- 11. Schiffer M., Mundel P., Shaw A. S., Böttinger E. P. (2004) A novel role for the adaptor molecule CD2-associated protein in transforming growth factor-β-induced apoptosis. J. Biol. Chem. 279, 37004–37012 [DOI] [PubMed] [Google Scholar]
- 12. Reiser J., Oh J., Shirato I., Asanuma K., Hug A., Mundel T. M., Honey K., Ishidoh K., Kominami E., Kreidberg J. A., Tomino Y., Mundel P. (2004) Podocyte migration during nephrotic syndrome requires a coordinated interplay between cathepsin L and α3 integrin. J. Biol. Chem. 279, 34827–34832 [DOI] [PubMed] [Google Scholar]
- 13. Lindskog A., Ebefors K., Johansson M. E., Stefánsson B., Granqvist A., Arnadottir M., Berg A. L., Nyström J., Haraldsson B. (2010) Melanocortin 1 receptor agonists reduce proteinuria. J. Am. Soc. Nephrol. 21, 1290–1298 [DOI] [PMC free article] [PubMed] [Google Scholar]
- 14. Scaduto R. C., Jr., Grotyohann L. W. (1999) Measurement of mitochondrial membrane potential using fluorescent rhodamine derivatives. Biophys. J. 76, 469–477 [DOI] [PMC free article] [PubMed] [Google Scholar]
- 15. Van Noorden C. J., Jonges T. G., Van Marle J., Bissell E. R., Griffini P., Jans M., Snel J., Smith R. E. (1998) Heterogeneous suppression of experimentally induced colon cancer metastasis in rat liver lobes by inhibition of extracellular cathepsin B. Clin. Exp. Metastasis 16, 159–167 [DOI] [PubMed] [Google Scholar]
- 16. Grant R. L., Acosta D. (1997) Ratiometric measurement of intracellular pH of cultured cells with BCECF in a fluorescence multi-well plate reader. In Vitro Cell Dev. Biol. Anim. 33, 256–260 [DOI] [PubMed] [Google Scholar]
- 17. Li C., Wong W. H. (2001) Model-based analysis of oligonucleotide arrays: expression index computation and outlier detection. Proc. Natl. Acad. Sci. U.S.A. 98, 31–36 [DOI] [PMC free article] [PubMed] [Google Scholar]
- 18. Stephanopoulos G., Aristidou A. A., Nielsen J. (1998) Metabolic Engineering, Principles and Methodologies, pp. 309–459, Academic Press, San Diego, CA [Google Scholar]
- 19. Arai K., Lee K., Berthiaume F., Tompkins R. G., Yarmush M. L. (2001) Intrahepatic amino acid and glucose metabolism in a d-galactosamine-induced rat liver failure model. Hepatology 34, 360–371 [DOI] [PubMed] [Google Scholar]
- 20. Altintas M. M., Ulgen K. O., Palmer-Toy D., Shih V. E., Kompala D. S., Reiser J. (2008) Emerging roles for metabolic engineering: understanding primitive and complex metabolic models and their relevance to healthy and diseased kidney podocytes. Curr. Chem. Biol. 2, 68–82 [Google Scholar]
- 21. Bonarius H. P., Hatzimanikatis V., Meesters K. P., de Gooijer C. D., Schmid G., Tramper J. (1996) Metabolic flux analysis of hybridoma cells in different culture media using mass balances. Biotechnol. Bioeng. 50, 299–318 [DOI] [PubMed] [Google Scholar]
- 22. Xie L., Wang D. I. (1996) Material balance studies on animal cell metabolism using a stoichiometrically based reaction network. Biotechnol. Bioeng. 52, 579–590 [DOI] [PubMed] [Google Scholar]
- 23. Follstad B. D., Balcarcel R. R., Stephanopoulos G., andWang D. I. (1999) Metabolic flux analysis of hybridoma continuous culture steady-state multiplicity. Biotechnol. Bioeng. 63, 675–683 [DOI] [PubMed] [Google Scholar]
- 24. Balcarcel R. R., Clark L. M. (2003) Metabolic screening of mammalian cell cultures using well-plates. Biotechnol. Prog. 19, 98–108 [DOI] [PubMed] [Google Scholar]
- 25. Nyberg G. B., Balcarcel R. R., Follstad B. D., Stephanopoulos G., Wang D. I. (1999) Metabolism of peptide amino acids by chinese hamster ovary cells grown in a complex medium. Biotechnol. Bioeng. 62, 324–335 [PubMed] [Google Scholar]
- 26. Nadeau I., Sabatié J., Koehl M., Perrier M., Kamen A. (2000) Human 293 cell metabolism in low glutamine-supplied culture: interpretation of metabolic changes through metabolic flux analysis. Metab. Eng. 2, 277–292 [DOI] [PubMed] [Google Scholar]
- 27. Nadeau I., Jacob D., Perrier M., Kamen A. (2000) 293SF metabolic flux analysis during cell growth and infection with an adenoviral vector. Biotechnol. Prog. 16, 872–884 [DOI] [PubMed] [Google Scholar]
- 28. Chan C., Berthiaume F., Lee K., Yarmush M. L. (2003) Metabolic flux analysis of cultured hepatocytes exposed to plasma. Biotechnol. Bioeng. 81, 33–49 [DOI] [PubMed] [Google Scholar]
- 29. Guder W. G., Ross B. D. (1984) Enzyme distribution along the nephron. Kidney Int. 26, 101–111 [DOI] [PubMed] [Google Scholar]
- 30. Karp P. D., Riley M., Saier M., Paulsen I. T., Paley S. M., Pellegrini-Toole A. (2000) The EcoCyc and MetaCyc databases. Nucleic Acids Res. 28, 56–59 [DOI] [PMC free article] [PubMed] [Google Scholar]
- 31. Kanehisa M., Goto S., Kawashima S., Okuno Y., Hattori M. (2004) The KEGG resource for deciphering the genome. Nucleic Acids Res. 32, D277–D280 [DOI] [PMC free article] [PubMed] [Google Scholar]
- 32. Krieger C. J., Zhang P., Mueller L. A., Wang A., Paley S., Arnaud M., Pick J., Rhee S. Y., Karp P. D. (2004) MetaCyc: a multiorganism database of metabolic pathways and enzymes. Nucleic Acids Res. 32, D438–D442 [DOI] [PMC free article] [PubMed] [Google Scholar]
- 33. Gloy J., Reitinger S., Fischer K. G., Schreiber R., Boucherot A., Kunzelmann K., Mundel P., Pavenstädt H. (2000) Amino acid transport in podocytes. Am. J. Physiol. Renal. Physiol. 278, F999–F1005 [DOI] [PubMed] [Google Scholar]
- 34. Palsson B. (2006) Systems Biology: Properties of Reconstructed Networks, pp. 309–459, Cambridge University Press, New York [Google Scholar]
- 35. Llaneras F., Picó J. (2008) Stoichiometric modelling of cell metabolism. J. Biosci. Bioeng. 105, 1–11 [DOI] [PubMed] [Google Scholar]
- 36. Reiser J., von Gersdorff G., Loos M., Oh J., Asanuma K., Giardino L., Rastaldi M. P., Calvaresi N., Watanabe H., Schwarz K., Faul C., Kretzler M., Davidson A., Sugimoto H., Kalluri R., Sharpe A. H., Kreidberg J. A., Mundel P. (2004) Induction of B7-1 in podocytes is associated with nephrotic syndrome. J. Clin. Invest. 113, 1390–1397 [DOI] [PMC free article] [PubMed] [Google Scholar]
- 37. Reiser J., Pixley F. J., Hug A., Kriz W., Smoyer W. E., Stanley E. R., Mundel P. (2000) Regulation of mouse podocyte process dynamics by protein tyrosine phosphatases. Kidney Int. 57, 2035–2042 [DOI] [PubMed] [Google Scholar]
- 38. Stumvoll M., Perriello G., Meyer C., Gerich J. (1999) Role of glutamine in human carbohydrate metabolism in kidney and other tissues. Kidney Int. 55, 778–792 [DOI] [PubMed] [Google Scholar]
- 39. Welbourne T., Routh R., Yudkoff M., Nissim I. (2001) The glutamine/glutamate couplet and cellular function. News Physiol. Sci. 16, 157–160 [DOI] [PubMed] [Google Scholar]
- 40. Déchelotte P., Darmaun D., Rongier M., Hecketsweiler B., Rigal O., Desjeux J. F. (1991) Absorption and metabolic effects of enterally-administered glutamine in humans. Am. J. Physiol. 260, G677–G682 [DOI] [PubMed] [Google Scholar]
- 41. Mittendorfer B., Volpi E., Wolfe R. R. (2001) Whole body and skeletal muscle glutamine metabolism in healthy subjects. Am. J. Physiol. Endocrinol. Metab. 280, E323–E333 [DOI] [PMC free article] [PubMed] [Google Scholar]
- 42. Leverve X. M., Mustafa I. (2002) Lactate: a key metabolite in the intercellular metabolic interplay. Crit. Care 6, 284–285 [DOI] [PMC free article] [PubMed] [Google Scholar]
- 43. Mancuso A., Sharfstein S. T., Tucker S. N., Clark D. S., Blanch H. W. (1994) Examination of primary metabolic pathways in a murine hybridoma with C-13 nuclear magnetic resonance spectroscopy. Biotechnol. Bioeng. 44, 563–585 [DOI] [PubMed] [Google Scholar]
- 44. Sharfstein S. T., Tucker S. N., Mancuso A., Blanch H. W., Clark D. S. (1994) Quantitative in vivo nuclear magnetic resonance studies of hybridoma metabolism. Biotechnol. Bioeng. 43, 1059–1074 [DOI] [PubMed] [Google Scholar]
- 45. Christensen H. N. (1990) Role of amino acid transport and countertransport in nutrition and metabolism. Physiol. Rev. 70, 43–77 [DOI] [PubMed] [Google Scholar]
- 46. Mackenzie B., Erickson J. D. (2004) Sodium-coupled neutral amino acid (System N/A) transporters of the SLC38 gene family. Pflugers Arch. 447, 784–795 [DOI] [PubMed] [Google Scholar]
- 47. Karinch A. M., Lin C. M., Meng Q., Pan M., Souba W. W. (2007) Glucocorticoids have a role in renal cortical expression of the SNAT3 glutamine transporter during chronic metabolic acidosis. Am. J. Physiol. Renal Physiol. 292, F448–F455 [DOI] [PubMed] [Google Scholar]
- 48. Moret C., Dave M. H., Schulz N., Jiang J. X., Verrey F., Wagner C. A. (2007) Regulation of renal amino acid transporters during metabolic acidosis. Am. J. Physiol. Renal Physiol. 292, F555–F566 [DOI] [PubMed] [Google Scholar]
- 49. Nowik M., Lecca M. R., Velic A., Rehrauer H., Brändli A. W., Wagner C. A. (2008) Genome-wide gene expression profiling reveals renal genes regulated during metabolic acidosis. Physiol. Genomics 32, 322–334 [DOI] [PubMed] [Google Scholar]
- 50. Szabadkai G., Duchen M. R. (2008) Mitochondria: the hub of cellular Ca2+ signaling. Physiology 23, 84–94 [DOI] [PubMed] [Google Scholar]
- 51. Salvi A., Quillan J. M., Sadée W. (2002) Monitoring intracellular pH changes in response to osmotic stress and membrane transport activity using 5-chloromethylfluorescein. AAPS PharmSci. 4, E21. [DOI] [PMC free article] [PubMed] [Google Scholar]
- 52. Wirthensohn G., Guder W. G. (1986) Renal substrate metabolism. Physiol. Rev. 66, 469–497 [DOI] [PubMed] [Google Scholar]
- 53. Baverel G., Ferrier B., Martin M. (1995) Fuel selection by the kidney: adaptation to starvation. Proc. Nutr. Soc. 54, 197–212 [DOI] [PubMed] [Google Scholar]
- 54. Stumvoll M., Meyer C., Mitrakou A., Gerich J. E. (1999) Important role of the kidney in human carbohydrate metabolism. Med. Hypotheses 52, 363–366 [DOI] [PubMed] [Google Scholar]
- 55. Gerich J. E., Meyer C., Woerle H. J., Stumvoll M. (2001) Renal gluconeogenesis: its importance in human glucose homeostasis. Diabetes Care 24, 382–391 [DOI] [PubMed] [Google Scholar]
- 56. Baverel G., Conjard A., Chauvin M. F., Vercoutere B., Vittorelli A., Dubourg L., Gauthier C., Michoudet C., Durozard D., Martin G. (2003) Carbon 13 NMR spectroscopy: a powerful tool for studying renal metabolism. Biochimie 85, 863–871 [DOI] [PubMed] [Google Scholar]
- 57. Arthur J. M., Thongboonkerd V., Scherzer J. A., Cai J., Pierce W. M., Klein J. B. (2002) Differential expression of proteins in renal cortex and medulla: a proteomic approach. Kidney Int. 62, 1314–1321 [DOI] [PubMed] [Google Scholar]
- 58. He L., Sun Y., Takemoto M., Norlin J., Tryggvason K., Samuelsson T., Betsholtz C. (2008) The glomerular transcriptome and a predicted protein-protein interaction network. J. Am. Soc. Nephrol. 19, 260–268 [DOI] [PMC free article] [PubMed] [Google Scholar]
- 59. Ransom R. F., Vega-Warner V., Smoyer W. E., Klein J. (2005) Differential proteomic analysis of proteins induced by glucocorticoids in cultured murine podocytes. Kidney Int. 67, 1275–1285 [DOI] [PubMed] [Google Scholar]
- 60. Wischmeyer P. E. (2007) Glutamine: mode of action in critical illness. Crit. Care Med. 35, S541–S544 [DOI] [PubMed] [Google Scholar]
- 61. Fleming S. E., Fitch M. D., DeVries S., Liu M. L., Kight C. (1991) Nutrient utilization by cells isolated from rat jejunum, cecum and colon. J. Nutr. 121, 869–878 [DOI] [PubMed] [Google Scholar]
- 62. Andrews F. J., Griffiths R. D. (2002) Glutamine: essential for immune nutrition in the critically ill. Br. J. Nutr. 87, S3–S8 [DOI] [PubMed] [Google Scholar]
- 63. Yun C. H., Tse C. M., Nath S. K., Levine S. A., Brant S. R., Donowitz M. (1995) Mammalian Na+/H+ exchanger gene family: structure and function studies. Am. J. Physiol. 269, G1–G11 [DOI] [PubMed] [Google Scholar]
- 64. Kovesdy C. P., Kalantar-Zadeh K. (2010) Oral bicarbonate: renoprotective in CKD? Nat. Rev. Nephrol. 6, 15–17 [DOI] [PubMed] [Google Scholar]
Associated Data
This section collects any data citations, data availability statements, or supplementary materials included in this article.