

Abstract
Muscle diseases commonly have clinical presentations of inflammation, fat infiltration, fibrosis, and atrophy. However, the results of existing laboratory tests and clinical presentations are not well correlated. Advanced quantitative MRI techniques may allow the assessment of myo-pathological changes in a sensitive and objective manner. To progress towards this goal, an array of quantitative MRI protocols was implemented for human thigh muscles, their reproducibility was assessed, and the statistical relationships among parameters were determined. These quantitative methods included fat/water imaging, multiple spin-echo T2 imaging (with and without fat signal suppression, FS), selective inversion recovery for T1 and quantitative magnetization transfer (qMT) imaging (with and without FS), and diffusion tensor imaging. Data were acquired at 3.0 T from nine healthy subjects. To assess the repeatability of each method, the subjects were re-imaged on an average of 35 days later. Pre-testing lifestyle restrictions were applied to standardize physiological conditions across scans. Strong between-day intra-class correlations were observed in all quantitative indices except for the macromolecular-to-free water pool size ratio (PSR) with FS, a metric derived from qMT data. Two-way analysis of variance revealed no significant between-day differences in the mean values for any parameter estimate. The repeatability was further assessed with Bland-Altman plots, and low repeatability coefficients were obtained for all parameters. Among-muscle differences in the quantitative MRI indices and inter-class correlations among the parameters were identified. There were inverse relationships between fractional anisotropy (FA) and the 2nd eigenvalue, the 3rd eigenvalue, and the standard deviation of first eigenvector. The FA was positively related to the PSR, while the other diffusion indices were inversely related to the PSR. These findings support the use of these T1, T2, fat/water, and DTI protocols for characterizing skeletal muscle using MRI. Moreover, the data support the existence of a common biophysical mechanism, water content, as a source of variation in these parameters.
Keywords: Reproducibility, reliability, skeletal muscle, relaxometry, quantitative magnetization transfer, diffusion tensor imaging, three-point Dixon imaging
Introduction
Muscle diseases are commonly characterized by inflammation, fat infiltration, fibrosis, and atrophy. Magnetic resonance imaging (MRI) has emerged as a powerful technique for non-invasively characterizing these pathophysiological changes. Contrast-based imaging methods, including longitudinal (T1) and transverse (T2) relaxation time constant-weighted sequences (1), short-tau-inversion-recovery imaging (2,3), magnetization transfer (MT) contrast imaging (4), and diffusion-weighted imaging (5), have all been used to identify muscle abnormalities. Although the contrast patterns in these images are sensitive to pathology, they are also sensitive to differences in hardware and image acquisition parameters, such as repetition time (TR) and echo time (TE); radiofrequency (RF) irradiation power and frequency offset (for MT imaging); and diffusion weighting (b-) values (for diffusion imaging). Consequently, the specificity and sensitivity of these methods to pathological changes are reduced.
The development of quantitative MRI methods, such as T1 and T2, MT, diffusion, and fat/water content measurements, may characterize tissue properties more objectively. T1 and T2 measurements have been widely used to study muscle diseases and injury (6-11). It is typically found that T1 values are elevated in inflamed regions of muscle and decreased in fat-infiltrated regions (6-8), whereas T2 values are elevated in both inflamed and fat-infiltrated regions (12). QMT has been developed and applied in healthy muscles (13,14), and a recent preliminary report appeared describing its implementation in muscle disease (15). Another quantitative MRI approach, diffusion tensor (DT) MRI, has been widely applied to assay the anisotropic diffusion behavior of water molecules in tissues with ordered, elongated structures. The indices derived from the diffusion tensor provide information about tissue structure and orientation at a microscopic level. The diffusion properties of muscle, especially the third eigenvalue of the diffusion tensor and degree of diffusion anisotropy, reflect muscle damage due to experimental injury (16), strain injury (17), and disease (5,18). Lastly, macroscopic fat infiltration is a common pathological component of muscle diseases. Fat and water signals can be most readily separated and quantified by exploiting the different resonance frequencies of fat and water protons (19-21).
These quantitative techniques therefore offer great potential for characterizing muscle damage by disease or injury at the microscopic and macroscopic levels at a greater specificity and sensitivity than qualitative, contrast-based methods. Because muscle diseases exhibit heterogeneous pathology, with respect to both the spatial presentation of the disease and the presence or absence of individual pathological components, a multi-parametric MRI approach may be required. Multi-parametric MRI may improve the ability to resolve individual pathological components; improve the understanding of the biophysical basis for the variations in single MRI parameters; and allow better data interpretation by accounting for potential confounding variables.
It is particularly interesting to implement quantitative MRI methods specifically for thigh muscle imaging, because the proximal muscles are early sites of muscle involvement in many muscle disorders. However, quantitative MRI studies in muscles are challenged by short T2 values and static (B0) and RF (B1+) field inhomogeneities. For these methods to be appropriately applied in longitudinal studies of therapeutic response and disease progression, it is important to develop means for overcoming these issues, measure the normal values for different muscles, establish the repeatability of the fitted parameters, and understand how the parameters relate to each other under conditions of healthy muscle. We have implemented a multiple spin-echo sequence for T2 measurement, a selective inversion recovery (SIR) sequence for T1 and qMT imaging (22), a three-point Dixon imaging sequence for fat/water imaging (21), and a DT-MRI sequence for in vivo healthy human thigh muscles. Using these sequences, we determined quantitative MRI indices at 3.0 T, compared the indices among the major thigh muscles, characterized and interpreted the relationships among the parameters, and assessed the repeatability of these methods.
Materials and Methods
Subjects
The study was approved by the local Institutional Review Board. Nine subjects (five female) with no known history of cardiovascular, metabolic, neurological, orthopedic, and muscle disorders participated in this study. None of the subjects engaged in a regular exercise program, as defined in Ref. (23). Their average age (mean and standard deviation, SD) was 26 ± 6 yr, with height 173 ± 13 cm and mass 69 ± 20 kg (BMI 22.6 ± 3.7). Written informed consent was obtained from each subject. To test the repeatability, the subjects were imaged on two occasions (on average, 35 days apart). Before each scan, the subjects adhered to 24-hour restrictions against moderate and heavy exercise, alcohol and drug use, and over-the-counter medications. They also refrained from caffeine use for at least 6 hours before each MRI scan. The subjects were instructed not to perform moderate or heavy exercise between the two MRI scans. To ensure consistent subject position in the two scans, the positioning details were recorded at the first scan and repeated in the second scan.
MRI Data Acquisition
MRI data were obtained on a 3.0-T Philips Achieva MR imager/spectrometer (Philips Medical System, Best, The Netherlands). A two-channel body coil was used for signal excitation and a six-channel sensitivity encoding (SENSE) cardiac coil array was used for signal reception. All images had a field of view (FOV) of 256 × 256 mm2 and slice thickness of 7 mm. Four bovine serum albumin (BSA) (Sigma-Aldrich, St Louis, MO, USA) samples with weight percentages of 5%, 10%, 15%, and 20% served as standard references. The samples were fully cross-linked with 1% glutaraldehyde (Sigma-Aldrich). The samples were attached to the lateral side of the imaged thigh while imaging, as illustrated in Figure 1.
Figure 1.

T1-weighted images from Scan 1 (a) and Scan 2 (b) of a representative subject. All of the representative data presented in the following figures are from this subject. Quantitative indices were analyzed in the eight muscles indicated in panel (a), including those of the quadriceps muscle group (rectus femoris (RF); vastus lateralis (VL); vastus intermedialis (VI); vastus medialis (VM)), those of the hamstring muscle group (biceps femoris (BF) semitendinosus (ST); semimembranosus (SM)), and the adductor magnus (AD). The four BSA standards are also present on the right of the thigh.
Anatomical Images
High-resolution anatomical images were acquired using a T1-weighted sequence with a turbo-spin-echo (TSE) readout, with sequence parameters TR/TE = 530/6.2 ms, matrix size = 340 × 340 with 512 × 512 reconstruction, excitation flip angle (α) = 90°, refocusing pulse flip angle = 110°, SENSE factor = 1.4, TSE factor = 6, 11 slices, and number of excitations (NEX) = 1. The acquisition time was ∼2 minutes.
B1+ mapping
B1+ field maps were acquired using an actual flip angle method (24), with α = 60°, delays of TR1/TR2 = 30/130 ms, TE = 2.2 ms, 11 slices, and matrix size of 64 × 64 with 128 × 128 reconstruction. The acquisition time was ∼1 minute.
Fat/water Imaging
The fat/water imaging data were acquired with a 3D three-echo gradient-echo sequence with TR = 75 ms, TE = 1.34 ms, echo spacing (ΔTE) = 1.53 ms, matrix = 128 ×128 with 256 × 256 reconstruction, SENSE factor = 1.3, α = 22°, 11 slices, and NEX = 1. The acquisition time was ∼9 seconds.
Multiple spin-echo T2 imaging
Multiple spin-echo data were acquired with a single-slice sequence and 90(x)-180(y)-90(x) composite refocusing pulses (25). The imaging parameters were TR = 3000 ms, TE =10, 20, 30…320 ms, ΔTE = 10 ms, matrix = 128 × 128, SENSE factor = 1.3, and NEX = 2. A crusher gradient scheme proposed by Poon and Henkelman (26) was used to destroy stimulated echoes from imperfect refocusing pulses. Multi-echo data with fat suppression (FS) were acquired using a spectrally selective adiabatic inversion recovery pulse, applied to the ∼3.5 ppm lipid resonance with an inversion recovery time (TI) of 202 ms, and an additional saturation pulse (90°, 18ms, 100Hz offset, Gaussian shape, bandwidth = 45 Hz ) on the olefinic proton resonance (∼0.75 ppm). The other instrumental settings (receiver gain, transmitter attenuation, etc.) and sequence parameters (timing, geometry, etc.) were identical to the non-FS image. The acquisition time for each scan was ∼11 minutes.
SIR for T1 and qMT imaging
The SIR data were acquired with a 1-ms 180° block inversion pulse, TSE readout with 16 inversion recovery time (TI) values (15 logarithmically spaced between 10 ms and 2 s and one at 10 s) (27), pre-delay (TD) = 2.5 s, matrix 128 × 128, SENSE factor = 2, TSE factor = 12, ΔTE = 5.9 ms (and thus effective TE = 38 ms), 1 slice, and NEX = 2. Twenty-four additional refocusing pulses were added to the end of the TSE pulse train to ensure full saturation of both pools (22). SIR-qMT data with FS using the gradient-reversal off-resonance suppression technique (28) were acquired with identical instrumental, contrast, and geometric settings. The acquisition time for each scan was ∼7 minutes.
DT-MR imaging
The DT-MRI data were acquired with TR/TE = 4000/48 ms, matrix = 128 × 64, with 128 × 128 reconstruction, SENSE factor = 1.5, 11 slices, b-value = 450 s·mm-2 in 15 diffusion-weighted directions (and one b = 0 image), single-shot spin-echo echo-planar-imaging (EPI) readout, and NEX = 6. Fat signal suppression used, in part, a gradient-reversal off-resonance suppression technique that suppressed signals from spins >138 Hz off-resonance from the water proton peak. Also, we used a saturation pulse on the olefinic proton resonance as described above. To reduce TE and geometric distortion during the EPI readout, partial k-space sampling along the phase encoding direction was adopted with k-space coverage of 80%. The acquisition time was approximately 7 minutes.
The total acquisition time of this protocol was ∼75 minutes. This included ∼46 minutes for quantitative imaging, plus additional time for subject positioning, scout images, slice prescription, and preparation steps for each sequence.
MRI Data Analysis
Parameter Fitting
All analyses were performed in Matlab 2011a (The MathWorks Inc, Natick MA) using scripts written in-house. All data were processed on a pixel-wise basis and the quantitative indices were determined by calculating the mean and SD within each specified region-of-interest (ROI).
Fat/water imaging data
The three-point Dixon imaging data were processed with the algorithm described in (21), assuming a nine-peak model with fixed ratios among the peaks (29). The analytical solutions of water and fat signals were obtained for each voxel. Then the true solution was identified by a multiseed three-dimensional region-growing scheme with a dynamic path. Confident regions were solved before unconfident regions. With ΔTE of 1.53 ms, phase unwrapping was not required. T1-weighting effects were corrected by assuming T1 values of 1.4 s and 0.3s for water and fat, respectively. The calculated fat fractions (ffat) are presented.
Multiple spin-echo data
Preliminary analyses using non-negative least squares methods (12) did not reveal multi-exponential transverse relaxation behavior under these experimental conditions. Therefore, the data were fitted to a mono-exponential decay model with a noise baseline to determine T2 and T2(FS).
SIR data
To determine T1 and T1(FS), the SIR data were fitted to a mono-exponential model with reduced TD (30). To determine qMT parameters, the SIR data were fitted to a bi-exponential model, as described in (30). Five parameters were determined: the longitudinal relaxation rate of the free water pool (R1f), PSR, fast exchange rate (kmf), inversion ratio of the free water pool (Sf), and the equilibrium magnetization (M0), where “f” and “m” denote the free water and macromolecular proton pools, respectively. SIR data with FS were processed with the same model. Only R1, R1(FS), PSR and PSR(FS) are presented and discussed in detail; kmf and kmf(FS) are not presented due to the high SNR required for accurate parameter characterization and the insensitivity of this parameter to pathophysiological changes (31).
DT-MRI data
All diffusion-weighted images were first registered to the b = 0 image using an affine transformation algorithm written by local image analysis core. Then the data were fitted to a tensor model (32) using multivariate linear regression. The diffusion tensor was diagonalized to determine the eigenvalues (λ1, λ2, λ3) and corresponding eigenvectors. The mean diffusivity (ADC) and FA were then calculated (32). Of the diffusion indices, λ3, ADC, and FA are of greatest interest because of their correlation to muscle damage (16); thus λ1 and λ2 are not discussed in detail. To characterize the normal variability in the estimated fiber orientation within each muscle, the standard deviation of the first eigenvectors were calculated. Firstly, the mean signal within each ROI was fitted to the tensor model and the first eigenvector was used as a reference vector. Then for each voxel, the angle between its first eigenvector and the reference vector was calculated. Finally, the standard deviation of all angle values within the ROI was determined, noted as SD(v1).
ROI definition
Eight muscles were studied, including the quadriceps (rectus femoris (RF), vastus lateralis (VL), vastus intermedius (VI), vastus medialis (VM)), hamstrings (biceps femoris (BF), semitendinosus (ST), semimembranosus (SM)), and adductor magnus/longus (AD). The sartorius, gracilis, and adductor brevis muscles were also identified in the images, but were not analyzed because of their relatively smaller dimensions and/or their location outside of the region of highest image quality. ROIs were initially drawn on the anatomical images. The ROIs were then applied to the quantitative model parameter maps. As necessary, the alignment of ROIs was adjusted to avoid muscle boundaries. Each ROI was visually examined and pixels were removed to avoid partial volume artifacts, non-contractile tissue, and flow artifacts.
Statistical Analyses
Repeatability and reliability analyses
Repeatability was assessed using the intra-class correlation coefficient (ICC); Bland-Altman analysis including determination of the repeatability coefficient (RC) (33); and comparison of between-day mean values (see the statistical comparisons below). An ICC of 1.0 indicates a perfect correlation between the two measurements. The RC was defined as RC = 1.96·SDdiff, where SDdiff is the standard deviation of the differences between the two scans, and represents the maximum difference between scans that is likely due to measurement error. Therefore, a low RC is desirable.
Statistical comparisons
Statistical comparisons were made for each variable using a two-factor analysis of variance (ANOVA), with main effects for Muscle and Day and considering p < 0.05 to be statistically significant. When significant main effects were observed, multiple comparisons were made with Tukey's honestly significant difference (HSD) test.
Relationships among quantitative MRI parameters
For each MRI parameter, the mean value for scans 1 and 2 was calculated. Then, the strengths of the relationships among selected parameters were determined by calculating the Pearson correlation. For this analysis, relaxation behavior was expressed as relaxation rate constants (RN ≡ 1/TN) rather than time constants, in order to characterize more appropriately the expected linear behavior of certain parameters with relaxation rate constants, but not with time constants.
Results
Supplementary Table 1 lists the relaxation, qMT, and diffusion parameters for the BSA samples obtained during a phantom-only experiment. As shown in Supplementary Table 2, R1f, R2, and PSR were strongly positively correlated with weight percentage and each other (minimum r2, 0.899), while the ADC was strongly negatively correlated with weight percentage and the other parameters (minimum r2, 0.947). No significant between-scan differences were observed in mean values for these indices (details not shown).
Representative T1-weighted images from two scans of a female subject are shown in Figure 1a and b. No noticeable between-day differences in the positioning of any subject occurred. The mean, SD, RC, and ICC of the quantitative indices of the eight muscles analyzed in this work are summarized in Table 1 and Table 2.
Table 1.
Descriptive and reproducibility data for ffat, T2, T2(FS), T1, T1(FS), PSR, and PSR(FS) in eight human thigh muscles. For each variable, the mean and SD are given in the top row; significant differences are indicated in the middle row; and the absolute and relative RC values are given in the bottom row. The units of T2 and T2(FS) are ms and the units of T1 and T1(FS) are s. A hyphen (-) indicates lack of significance. For ffat, n = 4.
| RF | VL | VI | VM | BF | ST | SM | AD | ||
|---|---|---|---|---|---|---|---|---|---|
| ffat | Mean (SD) | 0.028 (0.003) | 0.050 (0.014) | 0.032 (0.014) | 0.022 (0.006) | 0.043 (0.004) | 0.037 (0.009) | 0.033 (0.007) | 0.031 (0.006) |
| Significance: | <VL, BF | >RF, VI, VM, SM, AD | <VL, BF | <VL, BF, ST | >RF, VI, VM, SM, AD | >VM | <VL | <VL, BF | |
| RC (% of Mean) | 0.003 (10.7%) | 0.013 (26.0%) | 0.020 (62.5%) | 0.009 (40.9%) | 0.016 (37.2%) | 0.011 (29.7%) | 0.025 (75.8%) | 0.005 (16.1%) | |
| T2 | Mean (SD) | 30.1 (0.7) | 31.7 (1.0) | 31.4 (1.1) | 31.5 (1.1) | 32.3 (1.2) | 31.5 (1.4) | 31.9 (1.3) | 31.8 (1.0) |
| RC (% of Mean) | 1.2 (4.0%) | 1.1 (3.5%) | 1.6 (5.1%) | 1.2 (3.8%) | 1.2 (3.7%) | 1.2 (3.8%) | 1.4 (4.4%) | 1.0 (3.2%) | |
| Significance: | <VL, VM, BF, ST, SM, AD | >RF | - | >RF | >RF | >RF | >RF | >RF | |
| T2 (FS) | Mean (SD) | 29.8 (0.8) | 30.9 (1.0) | 30.8 (1.0) | 30.8 (1.1) | 30.6 (1.1) | 29.9 (1.2) | 30.9 (1.4) | 30.7 (1.3) |
| Significance: | <VL | >RF | - | - | - | - | - | - | |
| RC (% of Mean) | 0.7 (2.3%) | 1.1 (3.6%) | 1.1 (3.6%) | 1.4 (4.6%) | 1.2 (3.9%) | 1.1 (3.7%) | 1.6 (5.2%) | 1.2 (3.9%) | |
| T1 | Mean (SD) | 1.36 (0.03) | 1.33 (0.02) | 1.36 (0.02) | 1.36 (0.04) | 1.32 (0.03) | 1.33 (0.03) | 1.33 (0.05) | 1.34 (0.03) |
| Significance: | >BF | - | >BF | >BF | <RF, VI, VM | - | - | - | |
| RC (% of Mean) | 0.06 (4.4%) | 0.06 (4.5%) | 0.05 (3.7%) | 0.05 (3.7%) | 0.07 (5.3%) | 0.04 (3.0%) | 0.04 (3.0%) | 0.04 (3.0%) | |
| T1 (FS) | Mean (SD) | 1.37 (0.03) | 1.35 (0.02) | 1.38 (0.02) | 1.37 (0.04) | 1.34 (0.03) | 1.36 (0.03) | 1.35 (0.04) | 1.36 (0.03) |
| Significance: | - | - | - | - | - | - | - | - | |
| RC (% of Mean) | 0.07 (5.1%) | 0.06 (4.4%) | 0.04 (2.9%) | 0.06 (4.3%) | 0.04 (2.9%) | 0.03 (2.2%) | 0.09 (6.6%) | 0.03 (2.2%) | |
| PSR | Mean (SD) | 0.094 (0.01) | 0.094 (0.007) | 0.091 (0.008) | 0.101 (0.020) | 0.103 (0.010) | 0.116 (0.027) | 0.094 (0.007) | 0.109 (0.028) |
| Significance: | <ST, SM | <ST, SM | - | >VI, VM | >VI, VM | - | |||
| RC (% of Mean) | 0.024 (27.3%) | 0.012 (13.6%) | 0.008 (9.3%) | 0.024 (27.9%) | 0.027 (29.0%) | 0.026 (27.7%) | 0.038 (40.4%) | 0.017 (18.5%) | |
| PSR (FS) | Mean (SD) | 0.094 (0.005) | 0.092 (0.004) | 0.091 (0.006) | 0.092 (0.007) | 0.094 (0.004) | 0.101 (0.006) | 0.100 (0.008) | 0.109 (0.025) |
| Significance: | <SM | <SM | <SM | - | - | - | >RF, VL, VI | - | |
| RC (% of Mean) | 0.021 (23.1%) | 0.032 (34.4%) | 0.02 (22.7%) | 0.014 (15.9%) | 0.02 (22.2%) | 0.021 (22.3%) | 0.048 (48.0%) | 0.02 (21.3%) |
Table 2.
Descriptive and reproducibility data for DTI data in eight human thigh muscles. For each variable, the mean and SD are given in the top row; significant differences are indicated in the middle row; and the absolute and relative RC values are given in the bottom row. The units of the diffusivities are 10-3 mm2/s and the units of SD(v1) are degrees. A hyphen (-) indicates lack of significance.
| RF | VL | VI | VM | BF | ST | SM | AD | ||
|---|---|---|---|---|---|---|---|---|---|
| λ1 | Mean (SD) | 2.11 (0.08) | 2.18 (0.10) | 2.21 (0.09) | 2.08 (0.07) | 2.10 (0.06) | 2.15 (0.07) | 2.11 (0.06) | 2.07 (0.06) |
| Significance: | - | >VM, BF, AD | >VM, BF, AD | <VL, VI | <VL, VI | >AD | >AD | <VL, VI, ST, SM | |
| RC (% of Mean) | 0.17 (8.1%) | 0.24 (11%) | 0.2 (9.3%) | 0.18 (8.8%) | 0.19 (9.2%) | 0.14 (6.6%) | 0.21 (10%) | 0.11 (5.5%) | |
| λ2 | Mean (SD) | 1.67 (0.08) | 1.90 (0.14) | 1.83 (0.12) | 1.73 (0.09) | 1.57 (0.07) | 1.55 (0.08) | 1.64 (0.09) | 1.69 (0.07) |
| Significance: | >BF, ST<VL, VI | >RF, VM, BF, ST, SM, AD | >RF, BF, ST, SM, AD | >BF, ST, SM | >AD; <RF, VL, VI, VM | <RF, VL, VI, VM, AD; >SM | <VL, VI, VM; <ST | >ST; <VL, VI, BF | |
| RC (% of Mean) | 0.13 (7.8%) | 0.42 (22.1%) | 0.2 (11.2%) | 0.13 (7.7%) | 0.16 (10.3%) | 0.16 (10.5%) | 0.18 (11.1%) | 0.08 (4.9%) | |
| λ3 | Mean (SD) | 1.51 (0.05) | 1.64 (0.08) | 1.64 (0.09) | 1.56 (0.06) | 1.42 (0.07) | 1.40 (0.07) | 1.48 (0.06) | 1.54 (0.06) |
| Significance: | >BF, ST<VL, VI | >RF, VM, BF, ST, SM, AD | >RF, BF, ST, SM, AD | >BF, ST | <RF, VL, VI, VM | <RF, VL, VI, VM, AD | <VL, VI | >ST<VL, VI | |
| RC (% of Mean) | 0.11 (7.3%) | 0.22 (13.3%) | 0.14 (8.8%) | 0.08 (5.2%) | 0.15 (10.6%) | 0.16 (11.6%) | 0.13 (8.8%) | 0.10 (6.7%) | |
| ADC | Mean (SD) | 1.76 (0.07) | 1.91 (0.10) | 1.89 (0.10) | 1.79 (0.07) | 1.70 (0.07) | 1.70 (0.06) | 1.75 (0.07) | 1.77 (0.06) |
| Significance: | >ST<VL, VI | >RF, VM, BF, ST, SM, AD | >RF, VM, BF, ST, SM, AD | >BF, ST, SM; <VI | >AD; <VL, VI, VM | <RF, VL, VI, VM; >SM | <VL, VI, VM; <ST | <VL, VI, BF | |
| RC (% of Mean) | 0.13 (7.4%) | 0.28 (14.7%) | 0.17 (9.2%) | 0.12 (6.8%) | 0.14 (8.4%) | 0.14 (8.3%) | 0.16 (9.2%) | 0.08 (4.7%) | |
| FA | Mean (SD) | 0.18 (0.01) | 0.14 (0.02) | 0.16 (0.02) | 0.15 (0.01) | 0.21 (0.02) | 0.23 (0.02) | 0.19 (0.01) | 0.16 (0.01) |
| Significance: | >VL, VI, VM, AD; <BF, ST | <RF, BF, ST, SM | <RF | <RF, BF, ST, SM | >RF, VL, VM, AD; <ST | >RF, VL, VM, BF, SM, AD | >VL, VM, AD; <ST | <RF, BF, SM; <ST | |
| RC (% of Mean) | 0.03 (16.7%) | 0.04 (28.6%) | 0.03 (18.8%) | 0.03 (20.0%) | 0.06 (30.0%) | 0.05 (21.7%) | 0.02 (10.5%) | 0.03 (18.8%) | |
| SD(v1) | Mean (SD) | 8.1 (2.0) | 14.9 (5.2) | 10.2 (4.0) | 9.2 (2.9) | 4.7 (1.8) | 3.5 (0.1) | 5.4 (2.9) | 9.5 (3.5) |
| RC (% of Mean) | 10.8 (133%) | 17.1 (114%) | 6.1 (59.8%) | 9.2 (100%) | 2.7 (57.5%) | 2.1 (60.0%) | 3.7 (68.5%) | 11.3 (119%) |
Fat/water Imaging Data
Example data and repeatability characteristics
After completing scans of five subjects, two changes were made to the fat/water imaging and analysis protocol to achieve consistent quality. The changes included (a) use of monopolar readout of the multiple gradient echoes and (b) preservation of the original image domain phase information without any undesired post-processing by the MR scanner's reconstruction software. The final four subjects were scanned with the finalized fat/water imaging protocol, and fat/water analysis results are presented for only those four subjects. Figure 2a shows a representative ffat map. The ICC for ffat was 0.814; the Bland-Altman plot is shown in Figure 2b. The descriptive statistics and RC values for each muscle are listed in Tables 1 and 2. The mean values did not differ between days (p = 0.24).
Figure 2.

Results of fat/water imaging studies. (a) Representative fat fraction (ffat) map from scans 1. (b) The Bland-Altman plot of ffat values. The RC of less than 0.02 indicates a good repeatability of the three-point Dixon sequence, and the ICC of 0.886 indicates good reliability of the two scans across these subjects.
Among-muscle differences
There was a significant Muscle main effect (p < 0.001), but the Muscle × Day interaction was not significant (p = 0.96). There were significantly different ffat values among several of the muscle pairs; details are given in Table 1.
Multiple Spin-echo T2 Data
Example data and repeatability characteristics
Example multi-echo data fitting curves of a pixel in the VL muscle are shown in Figure 3a. Figure 3b shows a representative B1+ map from the same subject, with areas of low B1+ noted in the lateral region of the VL (∼75% of the nominal flip angle) and SM, AD, and gracilis (as low as ∼65% of the nominal flip angle). Figure 3c shows a representative T2 map from this subject. The T2(FS) maps (not shown) were spatially more uniform than the T2 maps. Bland-Altman plots are shown in Figure 3d; the ICC's for T2 and T2(FS) were ICC = 0.860 and 0.854, respectively. The descriptive statistics and RC values for each muscle are listed in Table 1. Neither the T2 nor the T2(FS) Day main effects were significant (p = 0.14 and 0.34, respectively).
Figure 3.

Results of multiple spin-echo studies. (a) Example multiple spin-echo data and curve-fitting results of a single pixel in the VL muscle. FS data are indicated with red points and non-FS data are indicated with black points. (b) Example B1+ map from this subject, with the colorbar indicating the percentage of the nominal flip angle. (c) Representative T2 parameter map from scan 1; the T2(FS) maps are not shown. The units of T2 and T2(FS) are ms. (d) The Bland-Altman plot of T2 and T2(FS) values. The low RC values indicate good repeatability of the multi-echo sequence in healthy subjects. The ICC values were 0.860 for T2 and 0.854 for T2(FS), indicating good inter-scan reliability.
Among-muscle differences
Table 1 presents the descriptive statistics for T2 and T2(FS). For T2 and T2(FS), there were significant Muscle main effects, with Tukey's HSD results also given in Table 1. For neither T2 nor T2(FS) was the Muscle × Day interaction significant (p = 1.00).
SIR T1 and qMT data
Example data and repeatability characteristics
As revealed by position shifts of the thigh or ringing artifacts, the SIR data in four subjects were severely confounded by motion. The following discussion pertains only to those five datasets in which such artifacts were not observed. Example SIR data-fitting curves of a pixel in the VL muscle are shown in Figure 4a. Figure 4b shows a representative T1 map; Figure 4c shows an example PSR map. The corresponding FS data had similar patterns and are not shown. The Bland-Altman plots for T1 and T1(FS) values are shown in Figure 4d. The corresponding data for PSR and PSR(FS) are shown in Figure 4e. The descriptive statistics and RC values for these data are listed in Table 1. The main effects for Day were not significant for T1, T1(FS), PSR, and PSR(FS) (minimum p value = 0.157).
Figure 4.
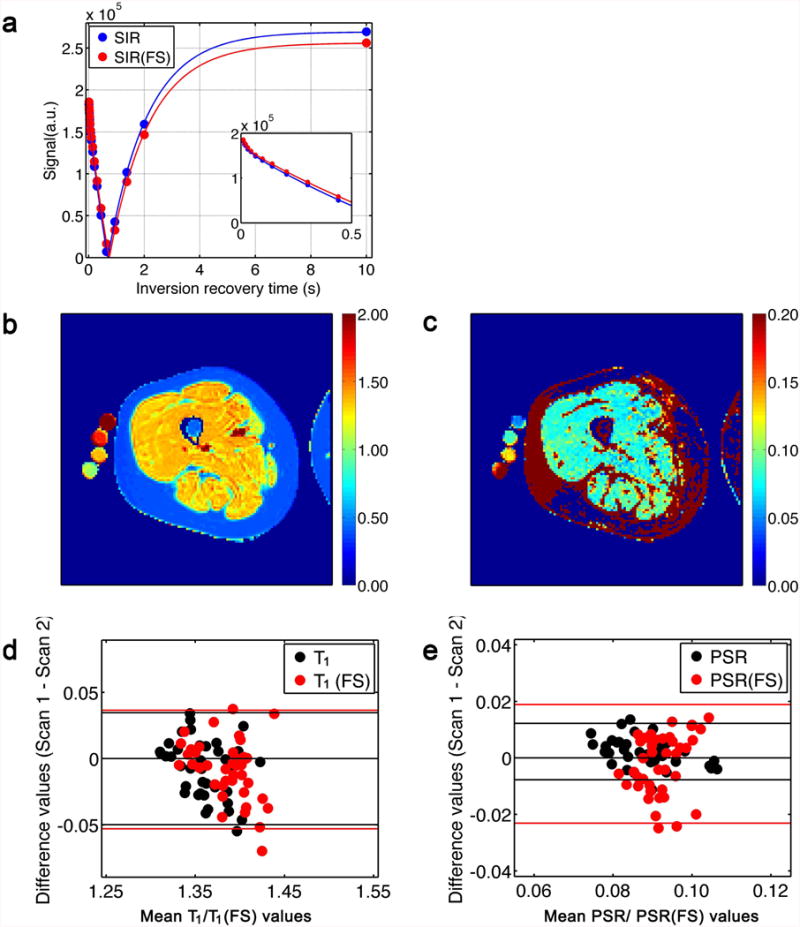
Results of SIR experiments. (a) Example data and fitting curves of SIR data from a pixel in the VL muscle. The bi-exponential behavior is observed from the sub-panel. (b, c) Representative T1 and PSR maps from scan 1; the T1(FS) and PSR(FS) maps are not shown. The units of T1 and T1(FS) are s. (d) The Bland-Altman plot of T1 and T1(FS) values (black and red points, respectively). The low RC values indicate good repeatability of the SIR method for T1 estimation. The ICC values were 0.739 (T1) and 0.696 (T1(FS). (e) The Bland-Altman plots of PSR and PSR(FS). A high RC value, relative to the mean, was observed. The ICC values were 0.820 (PSR) and 0.001 (PSR(FS)).
Among-muscle differences
For T1, there was a significant main effect for Muscle (p = 0.005; see Table 1 for Tukey's HSD results); however, for T1(FS), the main effect for Muscle was not significant (p = 0.605). For PSR and PSR(FS), there were significant main effects for Muscle (p < 0.001 in both cases). None of the Muscle × Day interactions were significant (minimum p-value, 0.970).
DT-MRI Data
Example data and repeatability characteristics
Figures 5a, 5b, and 5c show representative λ3, ADC, and FA maps; the corresponding Bland-Altman plots are shown in Figures 5d, 5e, and 5f. Regarding the repeatability, there was no significant main effect for Day for λ3 (p = 0.89, ICC = 0.786), ADC (p = 0.61, ICC = 0.870), and FA (p = 0.23, ICC = 0.866). The RC values are given in Table 2. The SD(v1) values of individual muscles and their RC values are listed in Table 2.
Figure 5.
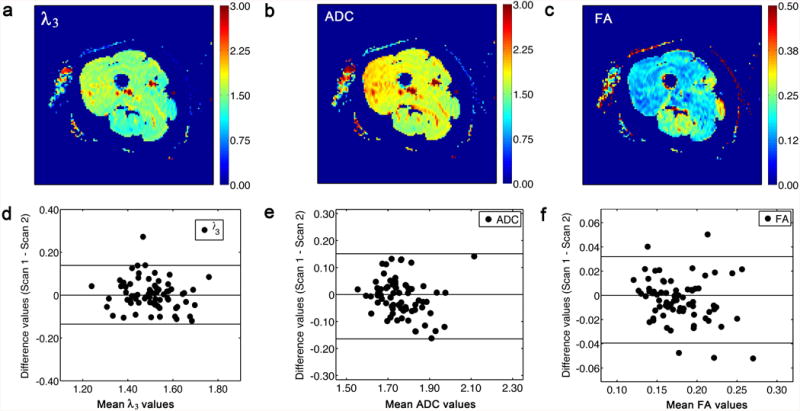
Results of diffusion imaging studies. (a) Representative λ3 map from scans 1. Note that the FS pulses were similarly effective in all regions of subcutaneous fat. The unit of λ3 is 10-3 mm2s-1. (b) Representative ADC map from scan 1. The unit of ADC is 10-3 mm2s-1. (c) Representative FA map from scans 1. (d) The Bland-Altman plot of λ3 values, indicating good repeatability; the ICC value was 0.786, indicating good reliability between the two scans across all subjects. (e) The Bland-Altman plot of ADC values, indicating good repeatability; the ICC was 0.713, indicating good reliability between the two scans across all subjects. (f) The Bland-Altman plot of FA values, indicating good repeatability; the ICC value was 0.860, indicating good reliability between the two scans across all subjects.
Among-muscle differences
For λ3, ADC, and FA, there was a significant main effect for Muscle (p < 0.001). The post hoc test results for the Muscle main effects are listed in Table 2. The Muscle × Day interactions were not significant for any of these variables (p ≥ 0.98). In general, lower mean values of λ3 and ADC, and higher mean values for FA, were observed in the hamstring muscles than in other muscles.
Relationships among Parameters
Table 3 shows the correlation coefficients among all measured parameters. Predictably, there were significant correlations among most of the relaxation parameters and between the PSR and relaxation rates. In addition, there were correlations among several of the indices of the diffusion tensor. While FA and λ1 were not significantly related (Figure 6a), there were inverse relationships between FA and λ2 (Figure 6b); λ3 (Figure 6c); and SD(v1) (Figure 6d). All of these indices were inversely related to the PSR (Figure 7). In general, the diffusion coefficients were inversely related to the relaxation rates (illustrative examples in Figure 8).
Table 3.
Inter-correlations among all measured parameters. Correlations were calculated for 40 data points, calculated from the between-day means for all eight muscles in the five subjects for whom there were suitable qMT data. Correlations in bold text are statistically significant (p < 0.05). Data are not presented for ffat because the range of values encountered was very small.
| R2 | R2 (FS) | R1f | R1 | PSR | kmf | R1f (FS) | R1 (FS) | PSR (FS) | kmf (FS) | FA | ADC | λ1 | λ2 | λ3 | SD(v1) | |
|---|---|---|---|---|---|---|---|---|---|---|---|---|---|---|---|---|
| R2 | 1.000 | 0.900 | 0.491 | 0.520 | 0.269 | 0.474 | 0.581 | 0.592 | 0.214 | 0.402 | 0.070 | -0.304 | -0.309 | -0.329 | -0.191 | -0.273 |
| R2(FS) | 1.000 | 0.655 | 0.686 | 0.329 | 0.292 | 0.690 | 0.716 | 0.371 | 0.261 | 0.244 | -0.395 | -0.304 | -0.431 | -0.325 | -0.367 | |
| R1f | 1.000 | 0.985 | 0.160 | 0.219 | 0.913 | 0.912 | 0.194 | -0.211 | -0.049 | -0.285 | -0.442 | -0.216 | -0.188 | -0.069 | ||
| R1 | 1.000 | 0.329 | 0.199 | 0.913 | 0.924 | 0.299 | -0.137 | 0.040 | -0.349 | -0.453 | -0.290 | -0.264 | -0.155 | |||
| PSR | 1.000 | -0.069 | 0.216 | 0.285 | 0.644 | 0.348 | 0.508 | -0.436 | -0.172 | -0.477 | -0.491 | -0.506 | ||||
| kmf | 1.000 | 0.461 | 0.429 | -0.175 | 0.276 | -0.386 | -0.151 | -0.475 | -0.082 | 0.053 | 0.110 | |||||
| R1f(FS) | 1.000 | 0.993 | 0.164 | -0.003 | -0.126 | -0.328 | -0.542 | -0.255 | -0.179 | -0.081 | ||||||
| R1(FS) | 1.000 | 0.275 | 0.025 | -0.081 | -0.344 | -0.526 | -0.279 | -0.206 | -0.128 | |||||||
| PSR(FS) | 1.000 | 0.234 | 0.361 | -0.216 | 0.013 | -0.270 | -0.277 | -0.424 | ||||||||
| kmf(FS) | 1.000 | -0.105 | 0.100 | 0.105 | 0.034 | 0.166 | -0.101 | |||||||||
| FA | 1.000 | -0.652 | -0.096 | -0.735 | -0.836 | -0.639 | ||||||||||
| ADC | 1.000 | 0.809 | 0.978 | 0.951 | 0.759 | |||||||||||
| λ1 | 1.000 | 0.694 | 0.623 | 0.433 | ||||||||||||
| λ2 | 1.000 | 0.948 | 0.838 | |||||||||||||
| λ3 | 1.000 | 0.732 | ||||||||||||||
| SD(v1) | 1.000 |
Figure 6.
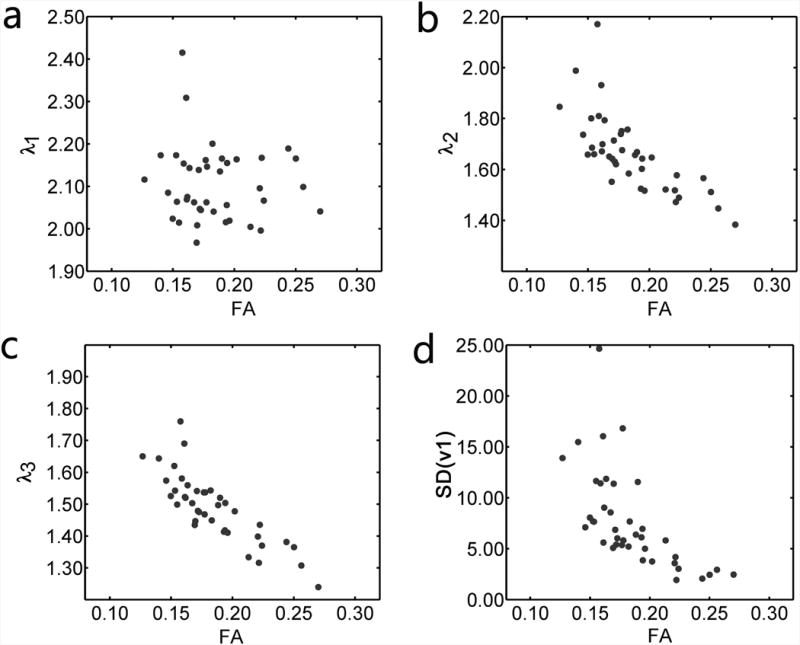
Inter-relationships among the diffusion tensor indices in five subjects. (a) There was not a significant correlation between FA and λ1 (p > 0.05). (b, c, d) Negative correlations were observed between FA and λ2 (r= -0.72, p < 0.05), FA and λ3 (r = -0.85, p < 0.05), and FA and SD(v1) (r = -0.64, p < 0.05). The unit of λ1-3 is 10-3 mm2s-1. The unit of SD(v1) is degrees.
Figure 7.

Inter-relationships among the PSR and diffusion tensor indices in five subjects. Low-to-moderate, negative correlations existed between PSR and λ1 (panel a; r = −0.170, p > 0.05), λ2 (panel b; r = −0.477, p < 0.05), λ3 (panel c; r = −0.491, p < 0.05), and the SD of the first eigenvector (panel d; r = −0.510, p < 0.05). The unit of λ1-3 is 10-3 mm2s-1.
Figure 8.

Inter-relationships among the ADC and relaxation indices in five subjects. Negative correlations existed between ADC and R2 (panel a; r = −0.304, p < 0.05), ADC and R2(FS) (panel b; r = −0.395, p < 0.05), ADC and R1obs (panel c; r = −0.344, p < 0.05), and ADC and R1obs(FS) (panel d; r = −0.34, p < 0.05). The unit of R2, R2(FS), R1, and R1(FS) is Hz. The unit of ADC is 10-3 mm2s-1.
Discussion
We have implemented a quantitative, multi-parametric MRI protocol for thigh muscle imaging at 3.0 T. Quantitative indices, including T2, T2(FS), T1, T1(FS), PSR, PSR(FS), ffat, λ1-3, ADC, and FA, were determined in eight thigh muscles. The analyses indicate that for most of these indices, a high repeatability exists. The data also reveal differences in some of the quantitative indices among thigh muscles, as well as the relationships among these indices. These inter-muscle differences can be used to suggest that a common biophysical mechanism, water content, causes these parameters to vary among healthy skeletal muscles. We note that these conclusions are drawn from a sample that was healthy and relatively restricted in age and muscle fat content, and so merit further examination in other populations.
Reproducibility and Inter-muscle Variability of the Parameters
Fat/Water Imaging
Considerable evidence supports using ffat as a biomarker. Fat replacement of necrotic muscle fibers is a typical pathological component of muscle diseases. There is a higher correlation between lower extremity functional scores and the proportion of fat within various thigh muscles than between functional scores and manual or dynamometric measures of lower extremity strength (34). Close correlations have been reported between MRI-observed fibro-adipose replacement and histologic abnormalities (35) and between fibro-adipose tissue replacement and performance on functional measures (36,37). Muscle fat content predicts the loss of ambulation in patients with Duchenne muscular dystrophy (38).
Because this aspect of the disease process is often framed in terms of fat replacement, rather than muscle loss, we presented the fat/water imaging data as fat fractions. The ffat data reported here ranged between 2-6% (Figure 2 and Table 1). Despite this low dynamic range of values, the ffat data had high ICC and low absolute RC values. Because the mean ffat values were low, the relative RC values were quite high (up to ∼76%). But when expressed relative to the water signal fractions, the relative RC values were ∼2%, which are similar to values previously reported for muscle (39) and subcutaneous adipose tissue (40). Because complete muscle replacement by fat can occur, the dynamic range of values for ffat that can be encountered is nearly 20-fold. Collectively, these data indicate that the fat/water imaging protocol implemented here can repeatably measure ffat in this range of values. The reported increases in the proton T1 of the methylene peak with increasing fat fractions (41) and the existence of B1 inhomogeneity indicate that under conditions of high fat content, a longer TR and/or incorporating a flip angle map and measured T1 values into the data analysis may reduce T1 bias.
There were few inter-muscle variations in ffat, with just the VL and hamstring muscles having higher fat contents than other muscles. The limited number of inter-muscle variations in this parameter, and the spatial pattern of the variations that did exist, can be used to inform the interpretation of the inter-muscle variations in the other parameters.
T2 Measurements
T2 is frequently used for MRI characterization of muscle function and disease. The T2 values determined in this work generally agree well with reported values for 3.0T (42,43) but are lower than others (44). For T2 and T2(FS), the RC values ranged from 2.7-5.2% of the corresponding mean values (Table 1) and high ICC values were observed. The high reproducibility observed is consistent with other reports (45). From these data, and considering the 50-100% elevation of T2 in muscle diseases (6) and the up to ∼30% increase in T2 that occurs during and following exercise (46), we conclude that T2 can serve as a biomarker with high sensitivity to pathophysiological changes and excellent measurement properties.
However, close attention should be paid to B1+ and B0 inhomogeneities when there is a significant fat component. The bandwidth of the composite pulse used in this work was not wide enough to refocus completely the fat component (which has a ∼ 450 Hz chemical shift from water at 3.0T); this is seen in the subcutaneous fat region of Figure 3. The B1+ field varied between 130% and 70% (Figure 3b), and B0 varied by ± 20 Hz (not shown). Collectively, these data indicate that the composite pulse used here is robust to B1+ field inhomogeneities; but, as illustrated by the absence of smoothness to the non-FS signal decay data in Figure 3a, the data are susceptible to the additional fat component. Therefore, for fat-infiltrated muscles, the presence of the increased fat component may require that a strategy such as a broader-bandwidth refocusing pulse, RF shimming using multiple transmit coils, dielectric padding, or an advanced data analysis model (such as the extended phase graph algorithm (47,48)) be used.
T1 and qMT Imaging Using SIR
Because the T1 of inflamed muscle is elevated and the T1 of fat is as much as 3-fold lower than healthy muscle, T1 measurements or T1-based contrast can distinguish among healthy, inflamed, and fat-infiltrated muscles. Across the eight thigh muscles studied, T1 ranged from 1.33 and 1.37 s; these values are slightly lower than (43) or similar to (44) previously reported values. With fat suppression, T1(FS) values were slightly longer than T1 values. Both the T1 and T1(FS) data had high ICC's (Figure 4) and RC values much smaller than the expected differences due to disease (Table 1). Note that in this work, the TR was reduced with a short TD, as presented in (22,30). Alternatively, if only T1 is of interest, a smaller number of TI values and varied TD may be used (30). There were only a small number of inter-muscle differences in T1, which were eliminated by using FS.
The PSR values across all muscles generally agree with previously reported values obtained using a pulsed saturation method (14). For the full cohort of subjects, a relatively poor repeatability was obtained in PSR and PSR(FS) values. However, when the data displaying significant motion artifacts were eliminated, the repeatability substantially improved. This improvement, along with the high quality of the phantom data, suggests that motion artifacts were a major complication for this method. The normal motion sensitivity of MRI data was probably exacerbated in this case by using a multi-shot TSE readout and large number of separate inversion time images. An alternative approach may be to replace the TSE readout with a turbo-field-echo (TFE) readout (49), which is also feasible for 3D imaging. Unexpectedly, the repeatability of PSR(FS) did not improve when the motion-corrupted data were excluded. Although a definitive explanation for these data is lacking, it may be that the subject's motion altered the B0 distribution, reducing the efficacy of the fat suppression routines.
Other potential errors include SNR limitations, the effect of the (albeit small) fat component, and B1+ inhomogeneities. The effective TE of 38 ms is longer than the T2 of muscle. To increase signal, the linear k-space sampling order used here could, in principle, have been replaced by a centric or asymmetric ordering; but we found these orderings of the k-space data introduced unacceptable blurring artifacts. Another potential error is from the fat component in the muscles. Previous work indicated that for PSR values present in muscle, a fat component greater than ∼8-10% introduces bias and variability in qMT parameter estimations. These effects were likely very small in the present study of healthy, young people with low ffat values; but this could become problematic in patient studies. Regarding B1+ inhomogeneity, the parameter Sf accounts for inversion flip angles of <180°; and for the B1+ inhomogeneity levels we observed, we did not see systematic PSR variations. However, in the pilot studies for this project, we did observe PSR variations in areas where the B1+ fell to ∼50% of the nominal value. A similar dependence of the MTR on B1 was reported by Morrow et al. (44).
The PSR values varied among muscles, with the SM and ST muscles tending to have higher values. A possible explanation for these findings is that the hamstring muscles tend to have high Type I fiber contents (50). Compared to Type II fibers, Type I fibers are smaller in diameter and have higher relative proportions of hydroxyproline (51), an amino acid that almost uniquely exists in collagen. Either or both of these properties could increase the proportion of spins in the solid-like proton pool. For example, the smaller fiber diameter would lead to a greater spatial frequency of membranes and therefore of the exchangeable protons in the head groups of the membrane lipids. Also, because hydroxyl groups are an effective conduit for spin exchange (52), the higher content of hydroxyproline in predominantly Type I muscles could also increase the PSR. Data from Sobol et al. (53) suggest that lipid-water exchange is a relatively unimportant mechanism in the relaxation behavior of muscle water; thus the hydroxyproline explanation is favored. We caution that this statement is speculative.
DT-MRI data
In muscle diseases and injuries, the diffusion tensor eigenvalues can increase by up to 20% (5,16,17,54,55). In addition, DT-MRI muscle fiber tracking has been used for the quantitative assessment of muscle architecture (56-59). The SNR of the b = 0 images was ∼60, which is high enough to achieve confident estimates of DT-MRI indices (60,61). The ADC was linearly related to BSA percentage (Table S-2). As shown by low RC and high ICC values (Table 2), there was excellent repeatability for the DT-MRI data. The relative RC's were higher for FA, the most likely explanation for which is error propagation through the use of the λ1, λ2, λ3, and ADC estimates in the calculation of FA. These data reflect improvements over our previous study of a single muscle group (62), and are comparable to those of Froehling et al. (63) and Sinha (64). Collectively, these data suggest that the DT-MRI eigenvalues and ADC have sufficient repeatability to detect the variations that are expected due to damage or disease.
We also observed a large number of among-muscle differences in diffusion parameters, especially λ2, λ3, and FA (Figure 5 and Table 2). For several reasons, we argue that these differences are not the result of image artifacts or noise. First, they are consistent with previous reports in the literature: Budzik et al. (65) and Kermarrec et al. (66) also observed higher FA values in the hamstring muscle group than in other thigh muscles. Second, the among-muscle differences that we observed in λ1, λ2, λ3, and FA were not spatially correlated to the B1+ inhomogeneities or spatial patterns in ffat, T1, and T2. Finally, bias in DT-MRI parameters can be caused by spatially varying noise levels. If so, then one would anticipate a positive correlation between SD(v1) and FA (which both tend to increase with noise; (60,61)); however, a negative correlation was observed (Table 3). Thus, we consider it to be most likely that the DT-MRI parameter variations are related to some aspect of these muscle groups' microstructure. Recent work by Scheel et al. suggests that higher FA and lower λ2 and λ3 values result from a smaller fiber diameter (67), as would be expected in the more oxidative hamstring muscles (50,68). Although the collagen content also varies between Type I and Type II fibers, we consider that fiber diameter variations are the more likely explanation for this effect. This is because the collagen of the extracellular matrix is more randomly than longitudinally oriented at resting muscle lengths (69). As noted by Karampinos et al. (70), it would thus not contribute strongly to diffusion anisotropy.
Inter-class Correlations
We observed a large number of statistically significant correlations among the quantitative parameters. These correlations existed despite the very low dynamic ranges of values that we encountered for most of the variables, attesting to the data quality. The range of ffat values was well below that expected to influence diffusion measurements (71); thus, we have not reported these correlations. Also, we do not discuss the correlations among the relaxation rates further, because they either constitute inherent intra-class correlations (for instance, between R1f and R1obs) or are predictable from proton relaxation theory (such as those between R1 and R2).
Correlations were noted among several of the diffusion parameters, including FA, λ2, λ3, and SD(v1). Although the diffusion parameters are estimated from the same set of measurements and the same analysis procedure, they are not necessarily related to each other, as revealed by the absence of correlation between FA and λ1. Because of this and the arguments made already, we conclude that these relationships did not result from image artifacts or noise. The data in Table 3 and Figure 6 indicate that in healthy skeletal muscle, the variations in FA result from variations in λ2 and λ3 only. Also, we note that FA and SD(v1) were inversely related. While data from pathological cardiac muscle suggest that the relationship between FA and SD(v1) could have arisen from within-voxel variations in muscle fiber orientation (72), it is unlikely that such disarray would exist in healthy subjects who abstained from severe exercise prior to the study. The only remaining possibility of which we are aware is that there may have been inter-muscle variations in free water content, which would increase the randomness of the first eigenvector (increasing SD(v1)) and hence the isotropic quality of the diffusion (decreasing FA). Variations in free water content would also directly affect the magnitude of the diffusion coefficients. The data in Figures 6 and 7 are consistent with this prediction.
These data, along with the correlations among relaxation, diffusion, and qMT parameters, suggest the influence of a shared biophysical mechanism for the variations in all of these parameters. Modest correlations were observed between PSR and λ2, λ3, FA, and SD(v1). These relationships are similar to those from Ou et al. in rat models of multiple sclerosis (73,74) and Bryant et al. in models of muscle inflammation (75). The relationship between the diffusion properties and PSR may be caused by a single property, such as water content. The data from the BSA phantom studies show that variations in protein content affect PSR and the water diffusivities in a similar fashion to the in vivo relationships. Or, it may be that two separate properties affect the diffusion properties and PSR through separate mechanisms, but happen to co-vary in a way that causes λ2, λ3, FA, and SD(v1) to be correlated to PSR. Similar arguments could be made about the inverse correlations between the relaxation rates and the diffusion coefficients. These experiments were not intended to identify the mechanism for these relationships. However, all of the relationships discussed here are consistent with the existence of a common mechanism in which a greater proportion of free water reduces PSR, reduces R1 and R2, increases the diffusion coefficient in all directions, and increases the isotropic character of water diffusion.
Because of the importance of free water and fat content on these parameters, and given the high frequency of inflammation and fat replacement of muscle in diseased muscles, we consider it likely that the relationships among these parameters will vary in diseased muscle. Such variations might occur in the strength, slope, and/or intercept of the relationships. Examining these relationships might therefore provide a useful basis for characterizing individual components of muscle pathology more specifically.
Summary and Conclusions
In conclusion, a number of quantitative MRI methods, including relaxation (T1 and T2), qMT (PSR), fat/water content, and DT-MRI (λ1-3, FA, ADC, and SD(v1)) have been determined in healthy human thigh muscles. A good repeatability was obtained for all measurements except PSR(FS). In young, healthy subjects, the normative values and between-muscle differences in these indices were evaluated and the relationships among the parameters were discussed. Recognizing the limitations resulting from the relatively small range of fat contents and states of muscle health that were studied, the results of these analyses emphasize the important of free water content in determining the values for these quantitative MRI parameters. This work enables the evaluation of pathophysiological changes in muscle diseases objectively and quantitatively; and it supports and informs approaches that examine changes to individual quantitative MRI parameters as well as the relationships among them.
Supplementary Material
Acknowledgments
This study was funded by NIH grants R01 AR057091, R01 EB014308, and K25 EB013659. The authors thank Jingping Xie, PhD for making BSA phantoms and MR technologists, Donna M. Butler, Kristen George-Durrett, Leslie McIntosh, and David Pennell, for their assistance with data acquisition.
Grant support: NIH/NIAMS R01 AR057091, R01 EB014308, K25 EB013659
List of Abbreviations and Symbols
- AD
Adductor magnus/longus muscles
- ADC
Apparent diffusion coefficient
- ANOVA
Analysis of variance
- B0
Static magnetic field
- B1+
Radiofrequency magnetic field
- BF
Biceps femoris muscle
- BMI
Body mass index
- BSA
Bovine serum albumin
- b-value
Diffusion weighting value
- DTI
Diffusion tensor imaging
- FA
Fractional anisotropy
- ffat
Fraction of tissue occupied by fat
- FOV
Field of view
- FS
Fat signal suppression
- HSD
Honestly significant difference
- ICC
Intra-class correlation coefficient
- kmf
Exchange rate from the macromolecular pool to the free water pool
- MRI
Magnetic resonance imaging
- MTR
Magnetization transfer ratio
- MT
Magnetization transfer
- n
Number of subjects
- NEX
Number of excitations
- p
Probability of a Type I statistical error
- PSR
Pool size ratio
- qMT
Quantitative magnetization transfer
- R1f
Longitudinal relaxation rate of the free water pool
- R1Obs
Observed longitudinal relaxation rate
- RC
Repeatability coefficient
- RF
Rectus femoris muscle
- ROI
Region of interest
- SD
Standard deviation
- SENSE
Sensitivity encoding
- Sf
Inversion ratio of the free water pool
- SIR
Selective inversion recovery
- SM
Semimembranosus muscle
- ST
Semitendinosus muscle
- T1
Longitudinal relaxation time constant
- T2
Transverse relaxation time constant
- TD
Pre-delay
- TE
Echo time
- TI
Inversion time
- TR
Repetition time
- TSE
Turbo spin-echo
- VI
Vastus intermedius muscle
- VL
Vastus lateralis muscle
- VM
Vastus medialis muscle
- λ1
First eigenvalue of the diffusion tensor
- λ2
Second eigenvalue of the diffusion tensor
- λ3
Third eigenvalue of the diffusion tensor
References
- 1.Kaufman LD, Gruber BL, Gerstman DP, Kaell AT. Preliminary observations on the role of magnetic resonance imaging for polymyositis and dermatomyositis. Ann Rheum Dis. 1987;46(8):569–572. doi: 10.1136/ard.46.8.569. [DOI] [PMC free article] [PubMed] [Google Scholar]
- 2.Fraser DD, Frank JA, Dalakas M, Miller FW, Hicks JE, Plotz P. Magnetic resonance imaging in the idiopathic inflammatory myopathies. J Rheumatol. 1991;18(11):1693–1700. [PubMed] [Google Scholar]
- 3.Kimball AB, Summers RM, Turner M, Dugan EM, Hicks J, Miller FW, Rider LG. Magnetic resonance imaging detection of occult skin and subcutaneous abnormalities in juvenile dermatomyositis: Implications for diagnosis and therapy. Arthr Rheumatism. 2000;43(8):1866–1873. doi: 10.1002/1529-0131(200008)43:8<1866::AID-ANR24>3.0.CO;2-6. [DOI] [PubMed] [Google Scholar]
- 4.McDaniel JD, Ulmer JL, Prost RW, Franczak MB, Jaradeh S, Hamilton CA, Mark LP. Magnetization transfer imaging of skeletal muscle in autosomal recessive limb girdle muscular dystrophy. J Comp Assist Tomog. 1999;23(4):609–614. doi: 10.1097/00004728-199907000-00023. [DOI] [PubMed] [Google Scholar]
- 5.Qi J, Olsen NJ, Price RR, Winston JA, Park JH. Diffusion-weighted imaging of inflammatory myopathies: Polymyositis and dermatomyositis. J Magn Reson Imaging. 2008;27(1):212–217. doi: 10.1002/jmri.21209. [DOI] [PubMed] [Google Scholar]
- 6.Park JH, Vansant JP, Kumar NG, Gibbs SJ, Curvin MS, Price RR, Partain CL, James AE. Dermatomyositis: correlative MR imaging and P-31 MR spectroscopy for quantitative characterization of inflammatory disease. Radiology. 1990;177(2):473–479. doi: 10.1148/radiology.177.2.2217788. [DOI] [PubMed] [Google Scholar]
- 7.Park JH, Vital TL, Ryder NM, Hernanz-Schulman M, Leon Partain C, Price RR, Olsen NJ. Magnetic resonance imaging and P-31 magnetic resonance spectroscopy provide unique quantitative data useful in the longitudinal management of patients with dermatomyositis. Arthr Rheumatism. 1994;37(5):736–746. doi: 10.1002/art.1780370519. [DOI] [PubMed] [Google Scholar]
- 8.Park JH, Olsen NJ, Jr LK, Vital T, Buse R, Kari S, Schulman MH, Price RR. Use of magnetic resonance imaging and p-31 magnetic resonance spectroscopy to detect and quantify muscle dysfunction in the amyopathic and myopathic variants of dermatomyositis. Arthr Rheumatism. 1995;38(1):68–77. doi: 10.1002/art.1780380111. [DOI] [PubMed] [Google Scholar]
- 9.Huang Y, Majumdar S, Genant HK, Chan WP, Sharma KR, Yu P, Mynhier M, Miller RG. Quantitative MR relaxometry study of muscle composition and function in Duchenne muscular dystrophy. J Magn Reson Imaging. 1994;4(1):59–64. doi: 10.1002/jmri.1880040113. [DOI] [PubMed] [Google Scholar]
- 10.Kim HK, Laor T, Horn PS, Racadio JM, Wong B, Dardzinski BJ. T2 Mapping in Duchenne muscular dystrophy: Distribution of disease activity and correlation with clinical assessments. Radiology. 2010;255(3):899–908. doi: 10.1148/radiol.10091547. [DOI] [PubMed] [Google Scholar]
- 11.Arpan I, Forbes SC, Lott DJ, Senesac CR, Daniels MJ, Triplett WT, Deol JK, Sweeney HL, Walter GA, Vandenborne K. T2 mapping provides multiple approaches for the characterization of muscle involvement in neuromuscular diseases: a cross-sectional study of lower leg muscles in 5–15-year-old boys with Duchenne muscular dystrophy. NMR Biomed. 2013;26(3):320–328. doi: 10.1002/nbm.2851. [DOI] [PMC free article] [PubMed] [Google Scholar]
- 12.Fan RH, Does MD. Compartmental relaxation and diffusion tensor imaging measurements in vivo in λ-carrageenan-induced edema in rat skeletal muscle. NMR Biomed. 2008;21(6):566–573. doi: 10.1002/nbm.1226. [DOI] [PMC free article] [PubMed] [Google Scholar]
- 13.Louie EA, Gochberg DF, Does MD, Damon BM. Transverse relaxation and magnetization transfer in skeletal muscle: effect of pH. Magn Reson Med. 2009;61(3):560–569. doi: 10.1002/mrm.21847. [DOI] [PMC free article] [PubMed] [Google Scholar]
- 14.Sinclair CD, Samson RS, Thomas DL, Weiskopf N, Lutti A, Thornton JS, Golay X. Quantitative magnetization transfer in in vivo healthy human skeletal muscle at 3 T. Magn Reson Med. 2010;64(6):1739–1748. doi: 10.1002/mrm.22562. [DOI] [PMC free article] [PubMed] [Google Scholar]
- 15.Sinclair C, Morrow J, Janiczek R, Hanna M, Reilly M, Yousry T, Samson R, Weiskopf N, Lutti A, Thomas D, Gola yX, Thornton J. Multi-parameter quantitation of coincident fat and water skeletal muscle pathology. Proc 21st Annual Meeting ISMRM; 2013; Salt Lake City, UT. [Google Scholar]
- 16.Heemskerk AM, Strijkers GJ, Drost MR, van Bochove GS, Nicolay K. Skeletal muscle degeneration and regeneration after femoral artery ligation in mice: Monitoring with diffusion MR imaging. Radiology. 2007;243(2):413–421. doi: 10.1148/radiol.2432060491. [DOI] [PubMed] [Google Scholar]
- 17.Zaraiskaya T, Kumbhare D, Noseworthy MD. Diffusion tensor imaging in evaluation of human skeletal muscle injury. J Magn Reson Imaging. 2006;24(2):402–408. doi: 10.1002/jmri.20651. [DOI] [PubMed] [Google Scholar]
- 18.McMillan AB, Shi D, Pratt SJP, Lovering RM. Diffusion tensor MRI to assess damage in healthy and dystrophic skeletal nuscle after lengthening contractions. J Biomed Biotech. 2011;2011 doi: 10.1155/2011/970726. [DOI] [PMC free article] [PubMed] [Google Scholar]
- 19.Glover GH. Multipoint Dixon technique for water and fat proton and susceptibility imaging. J Magn Reson Imaging. 1991;1(5):521–530. doi: 10.1002/jmri.1880010504. [DOI] [PubMed] [Google Scholar]
- 20.Reeder SB, Pineda AR, Wen Z, Shimakawa A, Yu H, Brittain JH, Gold GE, Beaulieu CH, Pelc NJ. Iterative decomposition of water and fat with echo asymmetry and least-squares estimation (IDEAL): application with fast spin-echo imaging. Magn Reson Med. 2005;54(3):636–644. doi: 10.1002/mrm.20624. [DOI] [PubMed] [Google Scholar]
- 21.Berglund J, Johansson L, Ahlström H, Kullberg J. Three-point Dixon method enables whole-body water and fat imaging of obese subjects. Magn Reson Med. 2010;63(6):1659–1668. doi: 10.1002/mrm.22385. [DOI] [PubMed] [Google Scholar]
- 22.Gochberg DF, Gore JC. Quantitative magnetization transfer imaging via selective inversion recovery with short repetition times. Magn Reson Med. 2007;57(2):437–441. doi: 10.1002/mrm.21143. [DOI] [PMC free article] [PubMed] [Google Scholar]
- 23.Haskell WL, Lee IM, Pate RR, Powell KE, Blair SN, Franklin BA, Macera CA, Heath GW, Thompson PD, Bauman A. Physical activity and public health: updated recommendation for adults from the American College of Sports Medicine and the American Heart Association. Med Sci Sports Exerc. 2007;39(8):1423–1434. doi: 10.1249/mss.0b013e3180616b27. [DOI] [PubMed] [Google Scholar]
- 24.Yarnykh VL. Actual flip-angle imaging in the pulsed steady state: a method for rapid three-dimensional mapping of the transmitted radiofrequency field. Magn Reson Med. 2007;57(1):192–200. doi: 10.1002/mrm.21120. [DOI] [PubMed] [Google Scholar]
- 25.Levitt MH, Freeman R. Compensation for pulse imperfections in NMR spin-echo experiments. J Magn Reson. 1981;43:65–80. [Google Scholar]
- 26.Poon CS, Henkelman RM. Practical T2 quantitation for clinical applications. J Magn Reson Imaging. 1992;2(5):541–553. doi: 10.1002/jmri.1880020512. [DOI] [PubMed] [Google Scholar]
- 27.Dortch RD, Li K, Gochberg DF, Welch EB, Dula AN, Tamhane AA, Gore JC, Smith SA. Quantitative magnetization transfer imaging in human brain at 3 T via selective inversion recovery. Magn Reson Med. 2011;66(5):1346–1352. doi: 10.1002/mrm.22928. [DOI] [PMC free article] [PubMed] [Google Scholar]
- 28.Nagy Z, Weiskopf N. Efficient fat suppression by slice-selection gradient reversal in twice-refocused diffusion encoding. Magn Reson Med. 2008;60(5):1256–1260. doi: 10.1002/mrm.21746. [DOI] [PMC free article] [PubMed] [Google Scholar]
- 29.Hamilton G, Yokoo T, Bydder M, Cruite I, Schroeder ME, Sirlin CB, Middleton MS. In vivo characterization of the liver fat 1H MR spectrum. NMR Biomed. 2011;24(7):784–790. doi: 10.1002/nbm.1622. [DOI] [PMC free article] [PubMed] [Google Scholar]
- 30.Li K, Zu Z, Xu J, Janve VA, Gore JC, Does MD, Gochberg DF. Optimized inversion recovery sequences for quantitative T1 and magnetization transfer imaging. Magn Reson Med. 2010;64(2):491–500. doi: 10.1002/mrm.22440. [DOI] [PMC free article] [PubMed] [Google Scholar]
- 31.Smith SA, Golay X, Fatemi A, Mahmood A, Raymond GV, Moser HW, van Zijl PC, Stanisz GJ. Quantitative magnetization transfer characteristics of the human cervical spinal cord in vivo: application to adrenomyeloneuropathy. Magn Reson Med. 2009;61(1):22–27. doi: 10.1002/mrm.21827. [DOI] [PMC free article] [PubMed] [Google Scholar]
- 32.Basser PJ, Mattiello J, LeBihan D. MR diffusion tensor spectroscopy and imaging. Biophys J. 1994;66(1):259–267. doi: 10.1016/S0006-3495(94)80775-1. [DOI] [PMC free article] [PubMed] [Google Scholar]
- 33.Martin Bland J, Altman D. Statistical methods for assessing agreement between two methods of clinical measurement. The Lancet. 1986;327(8476):307–310. [PubMed] [Google Scholar]
- 34.Wren TAL, Bluml S, Tseng-Ong L, Gilsanz V. Three-point technique of fat quantification of muscle tissue as a marker of disease progression in Duchenne muscular dystrophy: Preliminary study. Am J Roentgenol. 2008;190(1):W8–W12. doi: 10.2214/AJR.07.2732. [DOI] [PubMed] [Google Scholar]
- 35.Kinali M, Arechavala-Gomeza V, Cirak S, Glover A, Guglieri M, Feng L, Hollingsworth KG, Hunt D, Jungbluth H, Roper HP, Quinlivan RM, Gosalakkal JA, Jayawant S, Nadeau A, Hughes-Carre L, Manzur AY, Mercuri E, Morgan JE, Straub V, Bushby K, Sewry C, Rutherford M, Muntoni F. Muscle histology vs MRI in Duchenne muscular dystrophy. Neurology. 2011;76(4):346–353. doi: 10.1212/WNL.0b013e318208811f. [DOI] [PMC free article] [PubMed] [Google Scholar]
- 36.Akima H, Lott D, Senesac C, Deol J, Germain S, Arpan I, Bendixen R, Lee Sweeney H, Walter G, Vandenborne K. Relationships of thigh muscle contractile and non-contractile tissue with function, strength, and age in boys with Duchenne muscular dystrophy. Neuromuscul Disord. 2012;22(1):16–25. doi: 10.1016/j.nmd.2011.06.750. [DOI] [PMC free article] [PubMed] [Google Scholar]
- 37.Torriani M, Townsend E, Thomas BJ, Bredella MA, Ghomi RH, Tseng BS. Lower leg muscle involvement in Duchenne muscular dystrophy: an MR imaging and spectroscopy study. Skeletal Radiol. 2012;41(4):437–445. doi: 10.1007/s00256-011-1240-1. [DOI] [PMC free article] [PubMed] [Google Scholar]
- 38.Fischmann A, Hafner P, Gloor M, Schmid M, Klein A, Pohlman U, Waltz T, Gonzalez R, Haas T, Bieri O, Fischer D. Quantitative MRI and loss of free ambulation in Duchenne muscular dystrophy. J Neurol. 2012:1–6. doi: 10.1007/s00415-012-6733-x. [DOI] [PubMed] [Google Scholar]
- 39.Kovanlikaya A, Mittelman S, Ward A, Geffner M, Dorey F, Gilsanz V. Obesity and fat quantification in lean tissues using three-point Dixon MR imaging. Pediatr Radiol. 2005;35(6):601–607. doi: 10.1007/s00247-005-1413-y. [DOI] [PubMed] [Google Scholar]
- 40.Silver HJ, Niswender KD, Kullberg J, Berglund J, Johansson L, Bruvold M, Avison MJ, Welch EB. Comparison of gross body fat-water magnetic resonance imaging at 3 Tesla to dual-energy X-ray absorptiometry in obese women. Obesity (Silver Spring) 2012 doi: 10.1002/oby.20287. [DOI] [PMC free article] [PubMed] [Google Scholar]
- 41.Karampinos DC, Yu H, Shimakawa A, Link TM, Majumdar S. T1-corrected fat quantification using chemical shift-based water/fat separation: Application to skeletal muscle. Magn Reson Med. 2011;66(5):1312–1326. doi: 10.1002/mrm.22925. [DOI] [PMC free article] [PubMed] [Google Scholar]
- 42.Elder CP, Cook RN, Chance MA, Copenhaver EA, Damon BM. Image-based calculation of perfusion and oxyhemoglobin saturation in skeletal muscle during submaximal isometric contractions. Magn Reson Med. 2010;64(3):852–861. doi: 10.1002/mrm.22475. [DOI] [PMC free article] [PubMed] [Google Scholar]
- 43.Gold GE, Han E, Stainsby J, Wright G, Brittain J, Beaulieu C. Musculoskeletal MRI at 3.0 T: Relaxation times and image vontrast. Am J Roentgeno. 2004;183(2):343–351. doi: 10.2214/ajr.183.2.1830343. [DOI] [PubMed] [Google Scholar]
- 44.Morrow JM, Sinclair CDJ, Fischmann A, Reilly MM, Hanna MG, Yousry TA, Thornton JS. Reproducibility, and age, body-weight and gender dependency of candidate skeletal muscle MRI outcome measures in healthy volunteers. Eur Radiol. 2014:1–11. doi: 10.1007/s00330-014-3145-6. [DOI] [PMC free article] [PubMed] [Google Scholar]
- 45.Forbes SC, Walter GA, Rooney WD, Wang DJ, DeVos S, Pollaro J, Triplett W, Lott DJ, Willcocks RJ, Senesac C, Daniels MJ, Byrne BJ, Russman B, Finkel RS, Meyer JS, Sweeney HL, Vandenborne K. Skeletal muscles of ambulant children with Duchenne muscular dystrophy: Validation of multicenter study of evaluation with MR imaging and MR spectroscopy. Radiology. 2013 doi: 10.1148/radiol.13121948. [DOI] [PMC free article] [PubMed] [Google Scholar]
- 46.Damon BM, Gregory CD, Hall KL, Stark HJ, Gulani V, Dawson MJ. Intracellular acidification and volume increases explain R2 decreases in exercising muscle. Magn Reson Med. 2002;47(1):14–23. doi: 10.1002/mrm.10043. [DOI] [PubMed] [Google Scholar]
- 47.Lebel RM, Wilman AH. Transverse relaxometry with stimulated echo compensation. Magn Reson Med. 2010;64(4):1005–1014. doi: 10.1002/mrm.22487. [DOI] [PubMed] [Google Scholar]
- 48.Lankford CL, Does MD. Fast, artifact-free T2 mapping with fast spin echo using the extended phase graph and joint parameter reconstruction. Proc 21st Annual Meeting of ISMRM; 2013; p. 2461. [Google Scholar]
- 49.Dortch RD, Moore J, Li K, Jankiewicz M, Gochberg DF, Hirtle JA, Gore JC, Smith SA. Quantitative magnetization transfer imaging of human brain at 7 T. Neuroimage. 2013;64:640–649. doi: 10.1016/j.neuroimage.2012.08.047. [DOI] [PMC free article] [PubMed] [Google Scholar]
- 50.Johnson MA, Polgar J, Weightman D, Appleton D. Data on the distribution of fibre types in thirty-six human muscles. An autopsy study. J Neurol Sci. 1973;18(1):111–129. doi: 10.1016/0022-510x(73)90023-3. [DOI] [PubMed] [Google Scholar]
- 51.Kovanen V, Suominen H, Heikkinen E. Collagen of slow twitch and fast twitch muscle fibres in different types of rat skeletal muscle. Eur J Appl Physiol Occup Physiol. 1984;52(2):235–242. doi: 10.1007/BF00433399. [DOI] [PubMed] [Google Scholar]
- 52.Gochberg DF, Kennan RP, Maryanski MJ, Gore JC. The role of specific side groups and pH in magnetization transfer in polymers. J Magn Reson. 1998;131(2):191–198. doi: 10.1006/jmre.1998.1371. [DOI] [PubMed] [Google Scholar]
- 53.Sobol WT, Cameron IG, Inch WR, Pintar MM. Modeling of proton spin relaxation in muscle tissue using nuclear magnetic resonance spin grouping and exchange analysis. Biophys J. 1986;50(1):181–191. doi: 10.1016/S0006-3495(86)83450-6. [DOI] [PMC free article] [PubMed] [Google Scholar]
- 54.Heemskerk AM, Drost MR, van Bochove GS, van Oosterhout MF, Nicolay K, Strijkers GJ. DTI-based assessment of ischemia-reperfusion in mouse skeletal muscle. Magn Reson Med. 2006;56(2):272–281. doi: 10.1002/mrm.20953. [DOI] [PubMed] [Google Scholar]
- 55.Saotome T, Sekino M, Eto F, Ueno S. Evaluation of diffusional anisotropy and microscopic structure in skeletal muscles using magnetic resonance. Magn Reson Imaging. 2006;24(1):19–25. doi: 10.1016/j.mri.2005.09.009. [DOI] [PubMed] [Google Scholar]
- 56.Damon BM, Ding Z, Anderson AW, Freyer AS, Gore JC. Validation of diffusion tensor MRI-based muscle fiber tracking. Magn Reson Med. 2002;48(1):97–104. doi: 10.1002/mrm.10198. [DOI] [PubMed] [Google Scholar]
- 57.Heemskerk AM, Strijkers GJ, Vilanova A, Drost MR, Nicolay K. Determination of mouse skeletal muscle architecture using three-dimensional diffusion tensor imaging. Magn Reson Med. 2005;53(6):1333–1340. doi: 10.1002/mrm.20476. [DOI] [PubMed] [Google Scholar]
- 58.Lansdown DA, Ding Z, Wadington M, Hornberger JL, Damon BM. Quantitative diffusion tensor MRI-based fiber tracking of human skeletal muscle. J Appl Physiol. 2007;103(2):673–681. doi: 10.1152/japplphysiol.00290.2007. [DOI] [PMC free article] [PubMed] [Google Scholar]
- 59.Damon BM, Heemskerk AM, Ding Z. Polynomial fitting of DT-MRI fiber tracts allows accurate estimation of muscle architectural parameters. Magn Reson Imaging. 2012;30(5):589–600. doi: 10.1016/j.mri.2012.02.003. [DOI] [PMC free article] [PubMed] [Google Scholar]
- 60.Damon BM. Effects of image noise in muscle diffusion tensor (DT)-MRI assessed using numerical simulations. Magn Reson Med. 2008;60(4):934–944. doi: 10.1002/mrm.21707. [DOI] [PMC free article] [PubMed] [Google Scholar]
- 61.Froeling M, Nederveen AJ, Nicolay K, Strijkers GJ. DTI of human skeletal muscle: the effects of diffusion encoding parameters, signal-to-noise ratio and T2on tensor indices and fiber tracts. NMR in Biomedicine. 2013 doi: 10.1002/nbm.2959. n/a-n/a. [DOI] [PubMed] [Google Scholar]
- 62.Heemskerk AM, Sinha TK, Wilson KJ, Ding Z, Damon BM. Repeatability of DTI-based skeletal muscle fiber tracking. NMR Biomed. 2010;23(3):294–303. doi: 10.1002/nbm.1463. [DOI] [PMC free article] [PubMed] [Google Scholar]
- 63.Froeling M, Oudeman J, van den Berg S, Nicolay K, Maas M, Strijkers GJ, Drost MR, Nederveen AJ. Reproducibility of diffusion tensor imaging in human forearm muscles at 3.0 T in a clinical setting. Magn Reson Med. 2010;64(4):1182–1190. doi: 10.1002/mrm.22477. [DOI] [PubMed] [Google Scholar]
- 64.Sinha S, Sinha U. Reproducibility analysis of diffusion tensor indices and fiber architecture of human calf muscles in vivo at 1.5 Tesla in neutral and plantarflexed ankle positions at rest. J Magn Reson Imaging. 2011;34(1):107–119. doi: 10.1002/jmri.22596. [DOI] [PMC free article] [PubMed] [Google Scholar]
- 65.Budzik JF, Le Thuc V, Demondion X, Morel M, Chechin D, Cotten A. In vivo MR tractography of thigh muscles using diffusion imaging: initial results. Eur Radiol. 2007;17(12):3079–3085. doi: 10.1007/s00330-007-0713-z. [DOI] [PubMed] [Google Scholar]
- 66.Kermarrec E, Budzik JF, Khalil C, Thuc VL, Hancart-Destee C, Cotten A. In vivo diffusion tensor imaging and tractography of human thigh muscles in healthy subjects. Am J Roentgenol. 2010;195(5):W352–W356. doi: 10.2214/AJR.09.3368. [DOI] [PubMed] [Google Scholar]
- 67.Scheel M, von Roth P, Winkler T, Arampatzis A, Prokscha T, Hamm B, Diederichs G. Fiber type characterization in skeletal muscle by diffusion tensor imaging. NMR Biomed. 2013;26(10):1220–1224. doi: 10.1002/nbm.2938. [DOI] [PubMed] [Google Scholar]
- 68.Polgar J, Johnson MA, Weightman D, Appleton D. Data on fibre size in thirty-six human muscles: An autopsy study. J Neurol Sci. 1973;19(3):307–318. doi: 10.1016/0022-510x(73)90094-4. [DOI] [PubMed] [Google Scholar]
- 69.Trotter JA, Purslow PP. Functional morphology of the endomysium in series fibered muscles. J Morphol. 1992;212(2):109–122. doi: 10.1002/jmor.1052120203. [DOI] [PubMed] [Google Scholar]
- 70.Karampinos D, King K, Sutton B, Georgiadis J. Myofiber ellipticity as an explanation for transverse asymmetry of skeletal muscle diffusion MRI in vivo signal. Ann Biomed Eng. 2009;37(12):2532–2546. doi: 10.1007/s10439-009-9783-1. [DOI] [PMC free article] [PubMed] [Google Scholar]
- 71.Williams SE, Heemskerk AM, Welch EB, Li K, Damon BM, Park JH. Quantitative effects of inclusion of fat on muscle diffusion tensor MRI measurements. J Magn Reson Imaging. 2013;38(5):1292–1297. doi: 10.1002/jmri.24045. [DOI] [PMC free article] [PubMed] [Google Scholar]
- 72.Chen J, Song SK, Liu W, McLean M, Allen JS, Tan J, Wickline SA, Yu X. Remodeling of cardiac fiber structure after infarction in rats quantified with diffusion tensor MRI. Am J Physiol Heart Circ Physiol. 2003;285(3):H946–954. doi: 10.1152/ajpheart.00889.2002. [DOI] [PubMed] [Google Scholar]
- 73.Janve VA, Zu Z, Yao SY, Li K, Zhang FL, Wilson KJ, Ou X, Does MD, Subramaniam S, Gochberg DF. The radial diffusivity and magnetization transfer pool size ratio are sensitive markers for demyelination in a rat model of type III multiple sclerosis (MS) lesions. Neuroimage. 2013;74:298–305. doi: 10.1016/j.neuroimage.2013.02.034. [DOI] [PMC free article] [PubMed] [Google Scholar]
- 74.Ou X, Sun SW, Liang HF, Song SK, Gochberg DF. The MT pool size ratio and the DTI radial diffusivity may reflect the myelination in shiverer and control mice. NMR Biomed. 2009;22(5):480–487. doi: 10.1002/nbm.1358. [DOI] [PMC free article] [PubMed] [Google Scholar]
- 75.Bryant N, Li K, Does M, Barnes S, Gochberg D, Yankeelov T, Park J, Damon B. Multi-parametric MRI characterization of inflammation in murine skeletal muscle. NMR Biomed. 2014;27:716–725. doi: 10.1002/nbm.3113. [DOI] [PMC free article] [PubMed] [Google Scholar]
Associated Data
This section collects any data citations, data availability statements, or supplementary materials included in this article.