

Abstract
Indica and japonica are two main subspecies of Asian cultivated rice (Oryza sativa L.) that differ clearly in morphological and agronomic traits, in physiological and biochemical characteristics and in their genomic structure. However, the proteins and genes responsible for these differences remain poorly characterized. In this study, proteomic tools, including two-dimensional electrophoresis and mass spectrometry, were used to globally identify proteins that differed between two sequenced rice varieties (93–11 and Nipponbare). In all, 47 proteins that differed significantly between 93–11 and Nipponbare were identified using mass spectrometry and database searches. Interestingly, seven proteins were expressed only in Nipponbare and one protein was expressed specifically in 93–11; these differences were confirmed by quantitative real-time PCR and proteomic analysis of other indica and japonica rice varieties. This is the first report to successfully demonstrate differences in the protein composition of indica and japonica rice varieties and to identify candidate proteins and genes for future investigation of their roles in the differentiation of indica and japonica rice.
Keywords: indica and japonica rice, molecular marker, proteomics, quantitative real-time PCR, unique proteins
Introduction
The Asian cultivated rice (Oryza sativa L.) is one of the world’s most important food crops and affords the staple food for more than half of the world’s population (Sasaki and Burr, 2000). Indica and japonica rice are two main subspecies of Asian cultivated rice. Indica rice is mainly cultivated in tropical and subtropical environments at lower latitudes or altitudes, whereas japonica rice is grown mainly in more temperate environments at higher latitudes or altitudes. During the long history of rice domestication, the indica and japonica rice varieties have clearly diverged in morphological characteristics, agronomic traits and physiological and biochemical features, as well as in yield, quality and stress resistance. However, the proteins and genes responsible for these differences and their roles in these two rice varieties remain poorly characterized. In addition, the tremendous amount of geographic overlap in adaptation between the two varieties makes it difficult to identify indica and japonica rice efficiently.
The mechanisms of genetic differentiation and formation between indica and japonica rice are of general interest wherever rice is cultivated (Vaughan et al., 2008). The identification of indica and japonica rice varieties is traditionally based mainly on morphological characters and physiological and biochemical features. In recent years, with the rapid development of molecular biology, a variety of molecular markers, including random amplified polymorphic DNA (RAPD), restriction fragment length polymorphism (RFLP), microsatellite markers (SSR) and DNA insertion and deletion (InDel) have been widely used to identify japonica and indica rice varieties at the molecular level (Oka and Chang, 1962; Liu et al., 1995; Wang and Li, 1997; Long and Xu, 2002; Lu et al., 2002, 2009; Zhu et al., 2004; Wang et al., 2006). However, these morphological and physiological traits and molecular markers frequently yield divergent results in the identification of indica and japonica rice.
The fast development of whole genome sequencing technology and the application of bioinformatics have made it possible to detect differences between indica and japonica rice at the genomic level. However, traditional functional genomics have focused mainly on changes in mRNA abundance in histiocytes that do not truly reflect the changes in protein expression because of the transcriptional regulation of mRNA (Jugran et al., 2010; Ding et al., 2012). Proteomic studies represent a well-established strategy for the global analysis of protein expression profiles under various conditions (Agrawal et al., 2006; Yang et al., 2006, 2007a,b; Agrawal and Rakwal, 2011; Fan et al., 2011; Deng et al., 2013; Mitsui et al., 2013; Wang et al., 2013).
Rice proteomic studies have investigated mainly the protein profiles of various organs, tissues and subcellular structures and the influences of a variety of environmental factors on gene expression (Komatsu et al., 2004). In contrast, there have been few proteomic investigations of indica-japonica differentiation. Exploration of the mechanisms of genetic differentiation between indica and japonica rice can improve our understanding of the characteristics of these two subspecies of Asian cultivated rice and has an important bearing on the rational use of rice germplasm resources. In this study, we undertook a global proteomic analysis of indica and japonica rice varieties and sought to identify important proteins involved in indica-japonica differentiation.
Materials and Methods
Rice materials
Two sequenced rice varieties, 93-11 (Oryza sativa L. ssp. indica) and Nipponbare (Oryza sativa L. ssp. japonica), were used to compare the protein expression patterns of indica and japonica rice. Both varieties were provided by the Institute of Food Crops, Jiangsu Academy of Agricultural Sciences, China.
Culture conditions
Rice seeds stored at −20 °C were sterilized with 1% NaClO for 30 min, washed five times with sterilized water, soaked for 36 h in sterilized water at 28 °C and then germinated in the dark for 48 h. The seedlings were subsequently cultivated in an artificial climate chamber with a 16 h light period (28 °C) and 8 h dark period (25 °C). Leaves were collected at the three-leaf stage seedling, immediately frozen in liquid nitrogen and stored at −80 °C until protein extraction. The experiments were repeated three times and triplicate gel images are shown in Supplementary Material (Figures S1 and S2).
Protein extraction
Protein extraction was done using a modified version of the protocol described by Shen et al. (2003). Samples (0.2 g) were ground to a fine powder in liquid nitrogen and homogenized in pre-cooled extraction buffer (20 mM Tris-HCl pH 7.5, 250 mM sucrose, 10 mM EGTA, 1 mM PMSF, 1 mM DTT and 1% Triton X-100). The homogenate was transferred to an Eppendorf tube, centrifuged (15,000 g, 4 °C, 20 min) and the supernatant then collected. Proteins were precipitated by adding 1/4 volume of cold 50% TCA in an ice bath for 30 min. After centrifugation (15,000 g, 4 °C, 20 min), the supernatant was discarded. The precipitate was washed four times with cold acetone containing 0.07% (w/v) DTT, centrifuged (15,000 g, 4 °C, 10 min each time) and vacuum-dried. The dried powder was dissolved in sample buffer (7 M urea, 2 M thoiurea, 4% w/v CHAPS, 2% Ampholine, pH 3.5–10, 1% w/v DTT) at 4 °C overnight and then centrifuged (15,000 g, 4 °C, 10 min). The supernatant was used for two-dimensional electrophoresis. The protein concentrations were measured using the method of Bradford (1976).
Two-dimensional electrophoresis (2-DE)
2-DE was done with 13 cm immobilized IPG gel strips (GE Healthcare, BIO-Science, linear, pH 4–7) according to the manufacturer’s recommendations (GE Healthcare, BIO-Science). Initially, 400 μg of total protein was loaded onto the IPG strip using passive rehydration (12–13 h). Next, isoelectric focusing (IEF) was done at 300, 500, 1,000 and 8,000 V for 1 h each and then held at 8,000 V until a total voltage of 32,000 Vh was reached. After isoelectric focusing, the strips were equilibrated for 15 min in equilibration buffer (0.05 M Tris-HCl, pH 6.8, 2.5% SDS, 30% v/v glycerol and 1% DTT) and then equilibrated again for 15 min (0.05 M Tris-HCl, pH 6.8, 2.5% SDS, 30% (v/v) glycerol and 2.5% (w/v) iodoacetamide). Subsequently, second-dimensional electrophoresis was done with a Laemmli (1970) buffer system using 5% stacking gels and 15% resolving gels. After this electrophoresis, the gels were stained with 0.116% Coomassie brilliant blue R-250 in a solution containing 25% (v/v) ethanol and 8% acetic acid.
Image analysis and protein identification
The 2-DE gels were scanned in transparency mode at 300 dpi resolution using a UMAX Power Look 2100XL scanner (Maxium Tech, Taiwan, China). Spot detection and gel comparisons were done using ImageMaster™ 2D platinum version 5.0 software (GE Healthcare BIO-Science). The optimized parameters were: saliency = 2, smooth = 3 and minimum area = 50. Spots were expressed as a percentage of the total volume relative to the whole set of gel spots. All data were analyzed using Statistical Package for the Social Sciences (SPSS) software. The protein spots with significant differences were regarded as different proteins (p < 0.05; Student’s t-test). The differentially expressed protein spots in 93-11 and Nipponbare were excised manually from the gels and rinsed in ultrapure water with two rounds of ultrasonic treatment (10 min/each). The gels were then destained 2∼3 times ultrasonically in 50 μL of destaining buffer containing 25 mM NH4HCO3 and 50% ACN until the gels became colorless. Subsequently, the gel pieces were washed with 25 mM NH4HCO3, 50% ACN, and 100% ACN sequentially, vacuum-dried and then swollen in 25 mM NH4HCO3 containing 10 μg of trypsin/mL (Promega, Madison, WI, USA) for 30 min at 4 °C. After adding a further 10–15 μL of 25 mM NH4HCO3, the gel pieces were digested at 37 °C overnight (11–16 h). The peptides in the resulting digestion were identified by MALDI-TOF MS (Bruker Daltonics, Ultraflex-TOF-TOF, Germany).
The peptide mass finger prints were used to search in the National Center for Biotechnology Information non-redundant database (NCBInr) online using the Mascot program. Oryza sativa was selected as the taxonomic category. The search parameters were set as follows: carbamidomethyl was selected as a fixed modification, Gln- > pyro-Glu (N-term Q) was used as a variable modification, trypsin was selected as the enzyme, one missed cleavage was allowed, and the peptide tolerance was set at ± 0.3 Da with MH+ mass values. Proteins with a MOWSE score > 64 were considered to be credible.
Gene ontology analysis of identified proteins
All of the identified proteins were classified into three sets of ontologies: molecular function, cellular component and biological process using the online analysis tool Web Gene Ontology Annotation Plot (WEGO) (Ye et al., 2006). The Gene Ontology (GO) IDs of the identified proteins were obtained through InterProscan searching with the amino acid sequences and were output in txt format. Subsequently, the annotation files of up- and down-regulated proteins and unique proteins in 93-11 and Nipponbare were respectively uploaded in InterproScan.txt into WEGO. Finally, the analysis results were output as a histogram file after online operation.
RNA extraction and quantitative real-time PCR
Total RNA was extracted by using Trizol reagent (Invitrogen, USA) and 1 μg of RNA was used for first strand synthesis. The specific primers of the genes corresponding to the protein spots identified by 2-DE were shown in Table 1. The polymerase chain reaction (PCR) was done in a total volume of 20 μL containing 2 μLof primers, 1 μL of cDNA, 10 μL of SYBR Premix ExTaq (Takara, Japan), 0.1 μL of ROX Reference Dye II and 6.9 μLofH2O. Amplification was done using an Mx3000P PCR thermocycler (Stratagene) as follows: 2 min at 94 °C, followed by 40 cycles of 15 s at 94 °C, 15 s at 56∼60 °C and 10 s at 72 °C. The ACTIN gene was used as an internal reference gene and the experiments were done three times.
Table 1.
Primer sequences used for quantitative real-time PCR.
| Spot no.1 | Protein name | Forward primer (5′-3′) | Reverse primer (5′-3′) |
|---|---|---|---|
| 8 | 2,3-bisphosphoglycerate-independent phosphoglycerate mutase | CTGCTTCTGAAAGGTGCCAG | TAGCGGTCCATGGTAACATAC |
| 37 | Harpin binding protein 1 | TCGTCTTGCTGCGCCTCGAC | TGCCCGCCGCGTAGTCCAC |
| 39 | L-Ascorbate peroxidase 1 | ACTCGGCGGGGACGTTCGAC | TGGTAGAAATCGGCGTAGGAG |
| 42 | Chlorophyll A-B binding protein | CCAGGTGGCCCATTCGAC | GTGAGCAGGTTGTTGCCGAAG |
| Actin | TGTGTTGGACTCTGGTGA | TCCTCCAATCCAGACACTG |
Identified protein spot number (see Table 2).
Results
Protein expression profiles and differentially expressed proteins between 93-11 and Nipponbare
Proteomic analyses have been widely used to identify numerous proteins in rice (Yang et al., 2006, 2007a,b; Chitteti and Peng, 2007; Torabi et al., 2009; Chi et al., 2010; Fan et al., 2011; He et al., 2011; Nwugo and Huerta, 2011; Ding et al., 2012; Wang et al., 2013). In order to obtain optimal and reproducible results, the key steps, including sample preparation, protein loading, IEF parameters and Coomassie blue staining, were repeatedly explored and attempted (Yang et al., 2012). In addition, to obtain a general overview of the whole proteome of rice, we initially used 13 cm IPG gel strips with a linear range of pH 3–10 to perform 2-DE. Most of the protein spots were found to be located in a pH range of 4–7 and a molecular mass of 20–100 kDa (data not shown). Therefore, in present study, 13 cm IPG gel strip (pH 4–7, linear) was selected for 2-DE. Totally, more than 678 protein spots could be detected in Coomassie blue R-250 stained gels (Figure 1). The expression of 47 proteins differed significantly (p < 0.05) between 93-11 (O. sativa L. ssp. indica) and Nipponbare (O. sativa L. ssp. japonica), with 93-11/Nipponbare ratios ≥ 1.5 and ≤ 0.67 (as analyzed using the Statistical Package for the Social Sciences software; SPSS inc., Chicago, IL). Of these 47 proteins, 14 were up-regulated and 25 were down-regulated in 93-11. Some proteins were also found to be specifically expressed in 93-11 or Nipponbare (Figures 1 and 2). Each of the different protein spots was assigned a number, with the upward and downward pointing arrows indicating proteins that were up-regulated and down-regulated, respectively, in 93-11 (Figure 1). The protein spots with a plus symbol were detected only in this 2-D gel.
Figure 1.

The proteomic profiles of Nipponbare and 93-11. The protein spots 1 to 47 were identified by MS and database searches. The upward and downward pointing arrows indicate up-regulated and down-regulated proteins in 93-11, respectively. Protein spots unique in this 2-D gel are identified with a plus symbol (+). NPB – Nipponbare.
Figure 2.
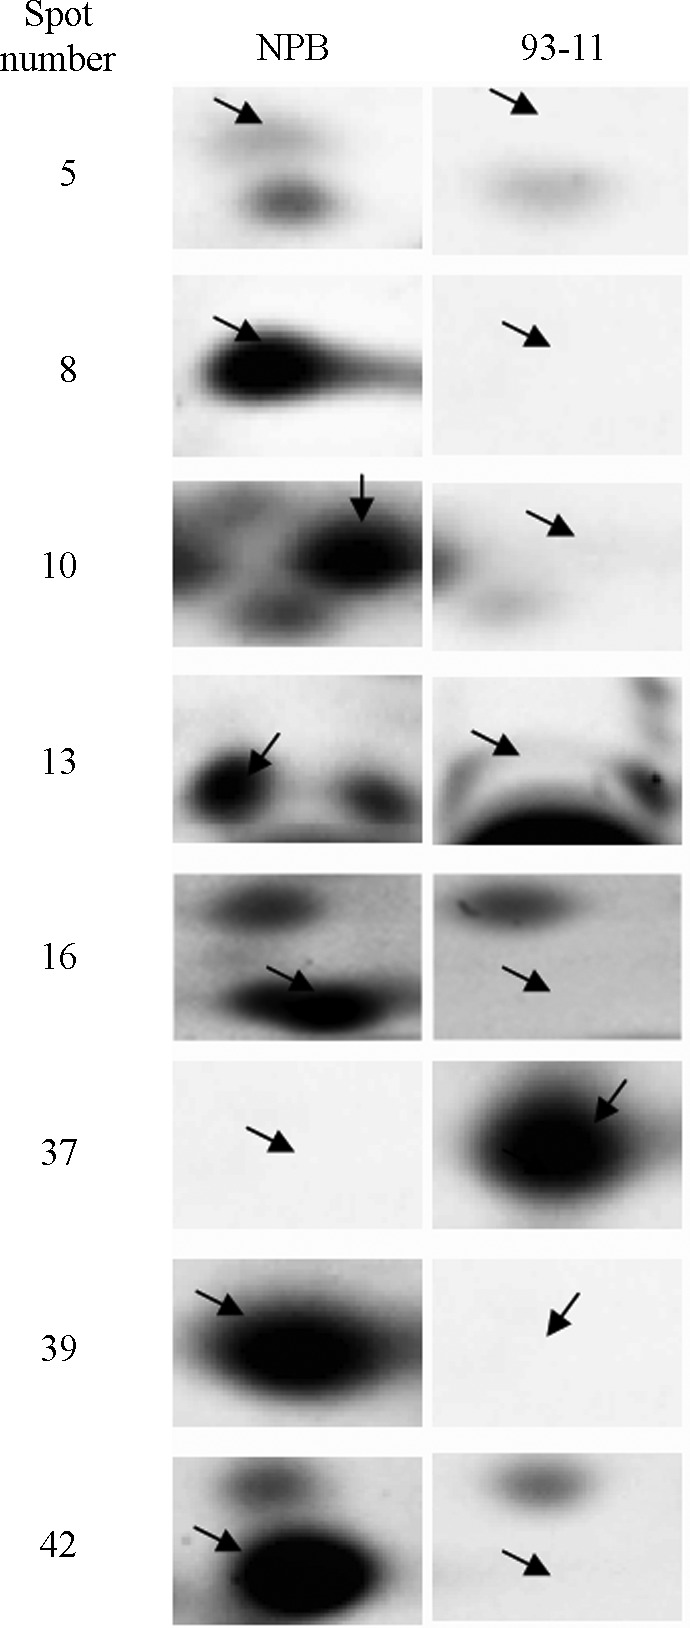
The unique protein spots in Nipponbare and 93-11. NPB – Nipponbare.
Protein identification by MALDI-TOF MS and functional classification
As shown in Table 2, 47 protein spots were identified by MS and database searches. These proteins represented 45 different gene products and were classified into eight categories, according to their functions (Bevan et al., 1998), as follows: cell structure (1), disease/defense (5), energy (15), metabolism (7), molecular chaperone (2), protein quality (1), transporters (3) and unknown protein (13). As shown in Figure 3, 32% of the identified proteins were classified in the energy group, 15% in the metabolism group and 11% participated in disease/defense processes. Together, these proteins accounted for 58% of the identified proteins. Additionally, 28% of the identified proteins were unknown proteins that may be novel proteins or genes in rice. Twelve of the identified proteins had a MSCOT score < 64, but the sequence coverage of some of these proteins, i.e., 36%, 39%, 43%, 60%, 35% and 80% for spots 7, 18, 21, 29, 45 and 46, respectively, was sufficient for their positive identification. The theoretical molar mass and pI values of some protein spots were quite different from their experimental values. Such discrepancies are common in proteomic studies and probably reflect post-translational modifications, protein splicing or degradation (Yan et al., 2006; Jiang et al., 2007; Minagawa et al., 2008).
Table 2.
Identification of differentially expressed proteins in the leaves of three-leaf stage seedlings.
| Spot no. | Mr (kD)/pI | MOWSE score | NMP1 | SC (%)2 | Accession no. | Protein name | Function | Fold-change3 |
|---|---|---|---|---|---|---|---|---|
| Unique proteins in NPB | ||||||||
| 5 | 60.66/6.02 | 50 | 6 | 12 | NP_001044693 | Plastid sufB/K09014 Fe-S cluster assembly protein SufB | Transporters | |
| 8 | 60.98/5.42 | 119 | 12 | 30 | NP_001044625 | K15633 2,3-bisphosphoglycerate-independent phosphoglycerate mutase | Energy | |
| 10 | 57.05/4.95 | 65 | 11 | 18 | AAX85991 | Protein disulfide isomerase | Molecular chaperone | |
| 13 | 48.30/5.33 | 133 | 14 | 46 | EEC74867 | Enolase | Energy | |
| 16 | 39.71/4.70 | 136 | 12 | 45 | EAY78710 | Hypothetical protein OsI_33814 | Unknown protein | |
| 39 | 27.26/5.31 | 103 | 8 | 44 | A2XFC7 | L-Ascorbate peroxidase 1 | Disease/defense | |
| 42 | 24.04/4.73 | 113 | 7 | 52 | ABG22426 | Chlorophyll A-B binding protein | Energy | |
| Unique proteins in 93-11 | ||||||||
| 37 | 28.46/8.92 | 72 | 7 | 32 | AAR26484 | Harpin binding protein 1 | Disease/defense | |
| Down-regulated proteins | ||||||||
| 1 | 32.45/8.34 | 53 | 6 | 19 | NP_001064703 | Translin-like protein | Energy | 2.3 |
| 2 | 66.24/4.97 | 188 | 15 | 43 | ABG22608 | Heat shock cognate 70 kDa protein | Molecular chaperone | 3.2 |
| 3 | 68.71/5.20 | 143 | 17 | 34 | NP_001058280 | K02145 V-type H+-transporting ATPase subunit A | Transporters | 1.6 |
| 4 | 72.89/5.51 | 82 | 8 | 18 | NP_001058625 | K03798 cell division protease FtsH | Protein quality | 1.8 |
| 6 | 10.96/9.80 | 65 | 6 | 35 | EEC81964 | Hypothetical protein OsI_25859 | Unknown protein | 1.7 |
| 9 | 59.06/6.66 | 109 | 12 | 30 | AAS46052 | ATP synthase CF1 α chain | Energy | 2.6 |
| 11 | 50.25/4.92 | 177 | 17 | 48 | NP_001060075 | Tubulin α-1 chain | Cell structure | 1.9 |
| 15 | 53.98/5.38 | 204 | 19 | 48 | YP_052756 | ATP synthase CF1 βsubunit | Energy | 3.7 |
| 17 | 51.79/5.43 | 196 | 17 | 50 | ABD57308 | UDP-glucose pyrophosphorylase | Metabolism | 2.1 |
| 21 | 10.00/9.55 | 41 | 3 | 43 | EEE56687 | Hypothetical protein OsJ_06143 | Unknown protein | 2.7 |
| 22 | 51.76/5.43 | 120 | 10 | 33 | P93431 | Ribulose bisphosphate carboxylase/oxygenase activase | Energy | 3.5 |
| 23 | 47.70/5.85 | 163 | 15 | 44 | ABG22614 | Ribulose bisphosphate carboxylase/oxygenase activase | Energy | 2.0 |
| 24 | 42.10/6.28 | 187 | 15 | 55 | NP_001045577 | K01738 cysteine synthase A | Metabolism | 2.4 |
| 25 | 39.41/5.51 | 108 | 9 | 44 | NP_001048045 | K01915 glutamine synthetase | Metabolism | 2.4 |
| 26 | 63.28/9.67 | 71 | 8 | 18 | NP_001049403 | DEAD-like helicase | Metabolism | 2.0 |
| 29 | 9.05/9.89 | 52 | 4 | 60 | BAB86226 | Hypothetical protein | Unknown protein | 1.8 |
| 30 | 41.64/5.66 | 71 | 7 | 29 | NP_001052622 | Isocitrate lyase and phosphorylmutase family protein | Metabolism | 2.9 |
| 33 | 41.10/7.98 | 135 | 11 | 36 | BAD07827 | Putative ferredoxin-NADP(H) oxidoreductase | Energy | 1.9 |
| 34 | 27.46/5.35 | 72 | 6 | 41 | NP_001049751 | Glutathione S-transferase | Energy | 2.4 |
| 36 | 37.90/6.49 | 55 | 8 | 19 | EAZ22588 | Glyoxalase | Disease/defense | 1.6 |
| 38 | 27.22/5.21 | 134 | 10 | 53 | NP_001060741 | K00434 L-ascorbate peroxidase | Disease/defense | 3.0 |
| 40 | 31.37/9.13 | 150 | 12 | 56 | NP_001054439 | NAD(P)-binding domain containing protein | Energy | 2.2 |
| 41 | 78.99/5.12 | 59 | 8 | 18 | NP_001060879 | Topoisomerase-like protein | Energy | 1.6 |
| 43 | 28.31/5.67 | 114 | 9 | 49 | NP_001047050 | K03386 peroxiredoxin (alkyl hydroperoxide reductase subunit C) | Disease/defense | 11.9 |
| 44 | 17.67/5.36 | 105 | 8 | 72 | NP_001057800 | Os06g0538900 | Unknown protein | 1.6 |
| Up-regulated proteins | ||||||||
| 7 | 11.75/5.93 | 43 | 3 | 36 | EEC73655 | Hypothetical protein OsI_08183 | Unknown protein | 2.2 |
| 12 | 54.04/5.47 | 162 | 14 | 43 | NP_039390 | ATP synthase CF1 β subunit | Energy | 2.9 |
| 14 | 53.98/5.30 | 229 | 21 | 58 | AAA84588 | atpB gene | Energy | 12.5 |
| 18 | 12.84/11.55 | 50 | 4 | 39 | EEE60029 | Oligopeptide transporter OPT superfamily | Unknown protein | 2.1 |
| 19 | 47.15/5.34 | 148 | 14 | 41 | EEE59878 | Hypothetical protein OsJ_12478 | Transporters | 1.9 |
| 20 | 46.48/5.51 | 82 | 8 | 23 | BAD17459 | Putative UDP-glucosyltransferase | Metabolism | 1.6 |
| 27 | 47.49/6.96 | 157 | 14 | 45 | NP_001062517 | K00051 malate dehydrogenase (NADP+) | Energy | 2.8 |
| 28 | 8.77/10.03 | 73 | 7 | 58 | BAC79840 | Hypothetical protein | Unknown protein | 2.7 |
| 31 | 34.92/6.24 | 82 | 9 | 27 | EEC67171 | Hypothetical protein OsI_34036 | Unknown protein | 4.9 |
| 32 | 29.60/11.21 | 55 | 5 | 24 | BAD87468 | Hypothetical protein | Unknown protein | 4.7 |
| 35 | 39.18/7.98 | 112 | 13 | 43 | NP_001045608 | K02641 ferredoxin-NADP+ reductase | Metabolism | 2.8 |
| 45 | 10.96/9.80 | 52 | 4 | 35 | EEC81964 | Hypothetical protein | Unknown protein | 2.3 |
| 46 | 8.31/9.56 | 59 | 4 | 80 | NP_001065452 | Os10g0570200 | Unknown protein | 2.1 |
| 47 | 17.43/9.67 | 53 | 4 | 31 | EAY90175 | Hypothetical protein OsI_11740 | Unknown protein | 4.3 |
Number of matched peptides.
Sequence coverage.
p < 0.05.
Figure 3.

Functional classifications of the identified proteins (Bevan et al., 1998).
Gene ontology analysis of differentially expressed proteins
GO analysis is widely used in proteomic research to annotate the physiological roles of the identified proteins. Based on GO analysis, 36 proteins of the 47 identified proteins were matched to more than one GO, four proteins had only one matched GO and no GO annotation was available for seven protein spots (spots 7, 16, 21, 29, 32, 46 and 47). The unique protein spots in 93-11 (spot 37) or Nipponbare (spots 5, 8, 10, 13, 39 and 42) also matched more than one GO. Gene ontology analysis showed that most of the different proteins were located in the cytoplasm and were involved in cell, cell part, macromolecular complex, organelle, organelle part, antioxidant, binding, catalytic, electron carrier, structural molecule, transporter, anatomical structure formation, biological regulation, cellular component biogenesis, cellular component organization, cellular process, establishment of localization, localization, metabolic process, pigmentation and response to stimulus (Figure 4). Some unique proteins in 93-11 and Nipponbare displayed functional specificity and were involved only in functions such as electron carrier, structural molecule, biological regulation and pigmentation (Figure 4).
Figure 4.

Gene ontology (GO) categories of the identified differentially expressed proteins in 93-11 and Nipponbare. These proteins were divided into three main categories and 21 subcategories (Ye et al., 2006).
Quantitative real-time PCR
Among the identified unique proteins, four (2,3-bisphosphoglycerate-independent phosphoglycerate mutase, L-ascorbate peroxidase 1, chlorophyll A-B binding protein, harpin binding protein 1) were selected to investigate their expression patterns at the transcript level (Figure 5). Total RNA was extracted from 93-11 and Nipponbare followed by quantitative real-time PCR analysis. The qRT-PCR results showed that the expression patterns of the four proteins at the transcript level were consistent with the proteomic analysis.
Figure 5.

Relative expression levels of 2,3-bisphosphoglycerate-independent phosphoglycerate mutase, L-ascorbate peroxidase 1, chlorophyll A-B binding protein and harpin binding protein 1 in 93-11 and Nipponbare. The X-axis shows the protein spot number and the Y-axis shows the relative expression level of each protein.
Discussion
The wide range of overlap in the geographic distribution and phenotypic variation of indica and japonica rice varieties means that the use of only morphological/physiological traits or molecular markers in genomic studies may not be sufficient to accurately distinguish the two subspecies. Since the proteomic tools 2-DE and MS can systematically identify different proteins in rice (Yang et al., 2006, 2007a,b; Chitteti and Peng, 2007; Torabi et al., 2009; Chi et al., 2010; Fan et al., 2011; He et al., 2011; Nwugo and Huerta, 2011; Ding et al., 2012; Wang et al., 2013), they can provide additional information that is useful for identifying indica and japonica rice varieties at the protein level. In this study, we used proteomic methods to identify differences in the proteins of two rice varieties (93-11 and Nipponbare). Using 2-DE, 47 significantly different proteins were detected and successfully identified by MALDI-TOF MS and database searches, including eight proteins that were specifically expressed in Nipponbare or 93-11 (Figures 1 and 2); these eight proteins could be useful markers for distinguishing between indica and japonica rice varieties. To further confirm the differential expression of these unique proteins, we selected four proteins (spots 8, 37, 39 and 42) for analysis by qRT-PCR, the findings of which were consistent with the 2-DE results. We also examined several other indica or japonica rice varieties (japonica rice varieties: Wuyujing 3, Wuyunjing 7; indica rice varieties: Nanjing 11, Minghui 63) using 2-DE and the results were similar to those for 93-11 and Nipponbare (Figure 6). The complete gel images of the indica and japonica varieties are shown in the supplementary files (Figures S3 and S4).
Figure 6.

Enlarged views of the unique proteins (spots 8, 13, 37, 39 and 42) in indica and japonica rice varieties. Indica rice varieties: 93-11, NJ11 – Nanjing 11, MH63 – Minghui 63. Japonica rice varieties: NPB – Nipponbare, WYJ3 – Wuyujing 3 and WYJ7 – Wuyunjing 7.
The eight unique proteins were plastid sufB (spot 5), 2,3-bisphosphoglycerate-independent phosphoglycerate mutase (spot 8), protein disulfide isomerase (spot 10), enolase (spot 13), hypothetical protein OsI_33814 (spot 16), L-ascorbate peroxidase 1 (spot 39), harpin binding protein 1 (spot 37) and chlorophyll A-B binding protein (spot 42). The SufB protein is a [4Fe-4S] protein (Layer et al., 2007) with an important role in photosynthetic electron transport, biosynthetic and metabolic reactions and the regulation of gene expression (Johnson et al., 2005). 2,3-Bisphosphoglycerate-independent phosphoglycerate mutase and enolase are both enzymes involved in glycolysis. Enolase, a key glycolytic enzyme, catalyzes the dehydration of 2-phosphoglycerate to form phosphoric acid. Additionally, its ability to function as a heat-shock protein and to bind cytoskeletal and chromatin structures indicates that enolase may play an important role in transcription and a variety of pathophysiological processes (Pancholi, 2001). Ascorbate peroxidase (APX) is a hydrogen peroxide-scavenging enzyme found only in higher plants and eukaryotic algae. Furthermore, APX is essential for protecting chloroplasts and other cell constituents from damage by hydrogen peroxide and hydroxyl radical derivatives (Shigeoka et al., 2002). Chlorophyll A-B binding protein, which belongs to the light-harvesting chlorophyll a/b-binding protein (LHCP) family, is mainly protected against proteases in the thylakoid (Kuttkat et al., 1995). Protein disulfide isomerase (PDI) is a multifunctional protein with an important role in protein folding processes (Gilbert, 1998). PDI is a necessary folding catalyst that catalyzes disulfide formation and isomerization, in addition to acting as a chaperone that limits aggregation (Wilkinson and Gilbert, 2004). Harpin binding protein-1 (HrBP1) has important biological functions in pest control and stimulates systemic acquired resistance (SAR) in plants (Wei et al., 1992).
The eight unique proteins identified here is a greater number than the three specifically expressed marker proteins reported for indica and japonica rice varieties by Saruyama and Shinbashi (1992). Meanwhile, in the latter study, only about 300 protein spots from seed embryos were detected in gel images. Moreover, the different proteins were not identified through MS and database searches, which limited their applications. In the present study, the leaves of three-leaf stage seedlings were sampled and more than 678 protein spots were detected. In addition, the different proteins were also identified by MS and database searches. As mentioned above, these specifically expressed proteins play important roles in plants and are mainly related to energy, stress and/or defense responses. Our findings therefore represent an extension of previous results.
The use of gel images along with the expression patterns from other indica and japonica rice varieties could provide useful information. Indeed, as shown in Figures S1 and S2, we obtained reproducible, high-resolution and high-sensitivity gel images. Figure 6 showed that spots 8, 13, 37, 39 and 42 were only expressed in indica or japonica rice varieties (compare Figures 6, S3 and S4). These observations, in conjunction with the qPCR-based expression pattern for the unique proteins in 93-11 and Nipponbare, suggest that these unique proteins may reflect the genetic differentiation of indica and japonica rice varieties and could be useful protein markers for distinguishing between indica and japonica rice varieties. Overall, the identification of proteins that are differentially expressed between 93-11 and Nipponbare should improve our understanding of the mechanisms of genetic differentiation that gave rise to indica and japonica rice. The findings described here not only provide candidate proteins and genes for indica-japonica differentiation but also demonstrate that comparative proteomic approach can be helpful in identifying novel proteins or genes in rice studies.
Supplementary Material
The following online material is available for this article:
Figure S1 - Triplicate gel images for 93-11.
Figure S2 - Triplicate gel images for Nipponbare.
Figure S3 - Complete gel images of the indica varieties.
Figure S4 - Complete gel images of the japonica varieties.
This material is available as part of the online article from http://www.scielo.br/gmb.
Acknowledgments
We thank Prof. Shihua Shen for help with the design and execution of this work. This work was supported by the National Natural Science Foundation of China (grant no. 31201189), the Postdoctoral Science Foundation of China (grant no. 2013M531289), the Universities Natural Science Research Project of Jiangsu Province (grant no. 13KJB180006), the Scientific Research Promotion Fund for the Talents of Jiangsu University (grant no. 11JDG049) and Postdoctoral Fund of Department of Personnel of Jiangsu Province (grant no. 1102010C).
Footnotes
Associate Editor: Márcio de Castro Silva Filho
References
- Agrawal GK, Rakwal R. Rice proteomics: A move toward expanded proteome coverage to comparative and functional proteomics uncovers the mysteries of rice and plant biology. Proteomics. 2011;11:1630–1649. doi: 10.1002/pmic.201000696. [DOI] [PubMed] [Google Scholar]
- Agrawal GK, Jwa NS, Iwahashi Y, Yonekura M, Iwahashi H, Rakwal R. Rejuvenating rice proteomics: Facts, challenges, and visions. Proteomics. 2006;6:5549–5576. doi: 10.1002/pmic.200600233. [DOI] [PubMed] [Google Scholar]
- Bevan M, Bancroft I, Bent E, Love K, Goodman H, Dean C, Bergkamp R, Dirkse W, Van Staveren M, Stiekema W, et al. Analysis of 1.9 Mb of contiguous sequence from chromosome 4 of Arabidopsis thaliana. Nature. 1998;391:485–488. doi: 10.1038/35140. [DOI] [PubMed] [Google Scholar]
- Bradford MM. A rapid and sensitive method for the quantitation of microgram quantities of protein utilizing the principle of protein-dye binding. Anal Biochem. 1976;72:248–254. doi: 10.1016/0003-2697(76)90527-3. [DOI] [PubMed] [Google Scholar]
- Chi F, Yang P, Han F, Jing Y, Shen S. Proteomic analysis of rice seedlings infected by Sinorhizobium meliloti 1021. Proteomics. 2010;10:1861–1874. doi: 10.1002/pmic.200900694. [DOI] [PubMed] [Google Scholar]
- Chitteti BR, Peng Z. Proteome and phosphoproteome differential expression under salinity stress in rice (Oryza sativa) roots. J Proteome Res. 2007;6:1718–1727. doi: 10.1021/pr060678z. [DOI] [PubMed] [Google Scholar]
- Deng ZY, Gong CY, Wang T. Use of proteomics to understand seed development in rice. Proteomics. 2013;13:1784–1800. doi: 10.1002/pmic.201200389. [DOI] [PubMed] [Google Scholar]
- Ding C, You J, Wang S, Liu Z, Li G, Wang Q, Ding Y. A proteomic approach to analyze nitrogen- and cytokinin-responsive proteins in rice roots. Mol Biol Rep. 2012;39:1617–1626. doi: 10.1007/s11033-011-0901-4. [DOI] [PubMed] [Google Scholar]
- Fan W, Cui W, Li X, Chen S, Liu G, Shen S. Proteomics analysis of rice seedling responses to ovine saliva. J Plant Physiol. 2011;168:500–509. doi: 10.1016/j.jplph.2010.08.012. [DOI] [PubMed] [Google Scholar]
- Gilbert HF. Protein Disulfide Isomerases. Methods Enzymol. 1998;290:26–50. doi: 10.1016/s0076-6879(98)90005-2. [DOI] [PubMed] [Google Scholar]
- He D, Han C, Yao J, Shen S, Yang P. Constructing the metabolic and regulatory pathways in germinating rice seeds through proteomic approach. Proteomics. 2011;11:2693–2713. doi: 10.1002/pmic.201000598. [DOI] [PubMed] [Google Scholar]
- Jiang Y, Yang B, Harris NS, Deyholos MK. Comparative proteomic analysis of NaCl stress-responsive proteins in Arabidopsis roots. J Exp Bot. 2007;58:3591–3607. doi: 10.1093/jxb/erm207. [DOI] [PubMed] [Google Scholar]
- Johnson DC, Dean DR, Smith AD, Johnson MK. Structure, function, and formation of biological iron-sulfur clusters. Annu Rev Biochem. 2005;74:247–281. doi: 10.1146/annurev.biochem.74.082803.133518. [DOI] [PubMed] [Google Scholar]
- Jugran A, Bhatt ID, Rawal RS. Characterization of agro-diversity by seed storage protein electrophoresis: Focus on rice germplasm from Uttarakhand Himalaya, India. Rice Sci. 2010;17:122–128. [Google Scholar]
- Komatsu S, Kojima K, Suzuki K, Ozaki K, Higo K. Rice Proteome Database based on two-dimensional polyacrylamide gel electrophoresis: Its status in 2003. Nucleic Acids Res. 2004;32:D388–D392. doi: 10.1093/nar/gkh020. [DOI] [PMC free article] [PubMed] [Google Scholar]
- Kuttkat A, Grimm R, Paulsen H. Light-harvesting chlorophyll a/b-binding protein inserted into isolated thylakoids binds pigments and is assembled into trimeric light-harvesting complex. Plant Physiol. 1995;109:1267–1276. doi: 10.1104/pp.109.4.1267. [DOI] [PMC free article] [PubMed] [Google Scholar]
- Laemmli UK. Cleavage of structural proteins during the assembly of the head of bacteriophage T4. Nature. 1970;227:680–685. doi: 10.1038/227680a0. [DOI] [PubMed] [Google Scholar]
- Layer G, Gaddam SA, Ayala-Castro CN, Ollagnier-de Choudens S, Lascoux D, Fontecave M, Outten FW. SufE transfers sulfur from sufS to sufB for iron-sulfur cluster assembly. J Biol Chem. 2007;282:13342–13350. doi: 10.1074/jbc.M608555200. [DOI] [PubMed] [Google Scholar]
- Liu K, Zhang Q, Zhang D, Xie Y. Genetic variation and indica-japonica differentiation in Yunnan indigenous rice. Acta Bot Sin. 1995;37:718–724. [Google Scholar]
- Long W, Xu M. RAPD-based genetic difference between indica rice and japonica rice. J Yunnan Agric Univ. 2002;17:245–247. [Google Scholar]
- Lu BR, Cai X, Xin J. Efficient indica and japonica rice identification based on the InDel molecular method: Its implication in rice breeding and evolutionary research. Prog Nat Sci. 2009;19:1241–1252. [Google Scholar]
- Lu BR, Zheng K, Qian H, Zhuang J. Genetic differentiation of wild relatives of rice as assessed by RFLP analysis. Theor Appl Genet. 2002;106:101–106. doi: 10.1007/s00122-002-1013-2. [DOI] [PubMed] [Google Scholar]
- Minagawa H, Honda M, Miyazaki K, Tabuse Y, Teramoto R, Yamashita T, Nishino R, Takatori H, Ueda T, Kamijo K, et al. Comparative proteomic and transcriptomic profiling of the human hepatocellular carcinoma. Biochem Biophys Res Commun. 2008;366:186–192. doi: 10.1016/j.bbrc.2007.11.101. [DOI] [PubMed] [Google Scholar]
- Mitsui T, Shiraya T, Kaneko K, Wada K. Proteomics of rice grain under high temperature stress. Front Plant Sci. 2013;4:36. doi: 10.3389/fpls.2013.00036. [DOI] [PMC free article] [PubMed] [Google Scholar]
- Nwugo CC, Huerta AJ. The effect of silicon on the leaf proteome of rice (Oryza sativa L.) plants under cadmium-stress. J Proteome Res. 2011;10:518–528. doi: 10.1021/pr100716h. [DOI] [PubMed] [Google Scholar]
- Oka HI, Chang WT. Rice varieties intermediate between wild and cultivated forms and the origin of the japonica type. Bot Bull Acad Sin. 1962;3:109–131. [Google Scholar]
- Pancholi V. Multifunctional α-enolase: Its role in diseases. Cell Mol Life Sci. 2001;58:902–920. doi: 10.1007/PL00000910. [DOI] [PMC free article] [PubMed] [Google Scholar]
- Saruyama H, Shinbashi N. Identification of specific proteins from seed embryos by two-dimensional gel electrophoresis for the discrimination between indica and japonica rice. Theor Appl Genet. 1992;84:947–951. doi: 10.1007/BF00227408. [DOI] [PubMed] [Google Scholar]
- Sasaki T, Burr B. International Rice Genome Sequencing Project: The effort to completely sequence the rice genome. Curr Opin Plant Biol. 2000;3:138–142. doi: 10.1016/s1369-5266(99)00047-3. [DOI] [PubMed] [Google Scholar]
- Shen S, Jing Y, Kuang T. Proteomics approach to identify wound-response related proteins from rice leaf sheath. Proteomics. 2003;3:527–535. doi: 10.1002/pmic.200390066. [DOI] [PubMed] [Google Scholar]
- Shigeoka S, Ishikawa T, Tamoi M, Miyagawa Y, Takeda T, Yabuta Y, Yoshimura K. Regulation and function of ascorbate peroxidase isoenzymes. J Exp Bot. 2002;53:1305–1319. [PubMed] [Google Scholar]
- Torabi S, Wissuwa M, Heidari M, Naghavi MR, Gilany K, Hajirezaei MR, Omidi M, Yazdi-Samadi B, Ismail AM, Salekdeh GH. A comparative proteome approach to decipher the mechanism of rice adaptation to phosphorous deficiency. Proteomics. 2009;9:159–170. doi: 10.1002/pmic.200800350. [DOI] [PubMed] [Google Scholar]
- Vaughan DA, Lu BR, Tomooka N. The evolving story of rice evolution. Plant Sci. 2008;174:394–408. [Google Scholar]
- Wang S, Liu X, Xu C, Shi L, Zhang X, Ding D, Wang Y. Genome polymorphisms between indica and japonica revealed by RFLP. Sci Agric Sin. 2006;39:1038–1043. [Google Scholar]
- Wang X, Li R. Determination and classification of sub-species of Asian rice and their inter-subspecies hybrids. Chin Sci Bull. 1997;42:2596–2603. [Google Scholar]
- Wang YD, Wang X, Ngai SM, Wong YS. Comparative proteomics analysis of selenium responses in selenium-enriched rice grains. J Proteome Res. 2013;12:808–820. doi: 10.1021/pr300878y. [DOI] [PubMed] [Google Scholar]
- Wei ZM, Laby RJ, Zumoff CH, Bauer DW, He SY, Collmer A, Beer SV. Harpin, elicitor of the hypersensitive response produced by the plant pathogen Erwinia amylovora. Science. 1992;257:85–88. doi: 10.1126/science.1621099. [DOI] [PubMed] [Google Scholar]
- Wilkinson B, Gilbert HF. Protein disulfide isomerase. Biochim Biophys Acta Proteins Proteomics. 2004;1699:35–44. doi: 10.1016/j.bbapap.2004.02.017. [DOI] [PubMed] [Google Scholar]
- Yan SP, Zhang QY, Tang ZC, Su WA, Sun WN. Comparative proteomic analysis provides new insights into chilling stress responses in rice. Mol Cell Proteomics. 2006;5:484–496. doi: 10.1074/mcp.M500251-MCP200. [DOI] [PubMed] [Google Scholar]
- Yang P, Liang Y, Shen S, Kuang T. Proteome analysis of rice uppermost internodes at the milky stage. Proteomics. 2006;6:3330–3338. doi: 10.1002/pmic.200500260. [DOI] [PubMed] [Google Scholar]
- Yang P, Chen H, Liang Y, Shen S. Proteomic analysis of de-etiolated rice seedlings upon exposure to light. Proteomics. 2007a;7:2459–2468. doi: 10.1002/pmic.200600215. [DOI] [PubMed] [Google Scholar]
- Yang P, Li X, Wang X, Chen H, Chen F, Shen S. Proteomic analysis of rice (Oryza sativa) seeds during germination. Proteomics. 2007b;7:3358–3368. doi: 10.1002/pmic.200700207. [DOI] [PubMed] [Google Scholar]
- Yang Y, Cui W, Liu X, Zhu K, Chen K. Improvement of two-dimensional electrophoresis of rice (Oryza sativa L.) proteomics. Chin J Appl Environ Biol. 2012;18:819–823. [Google Scholar]
- Ye J, Fang L, Zheng H, Zhang Y, Chen J, Zhang Z, Wang J, Li S, Li R, Bolund L. WEGO: A web tool for plotting GO annotations. Nucleic Acids Res. 2006;34:W293–297. doi: 10.1093/nar/gkl031. [DOI] [PMC free article] [PubMed] [Google Scholar]
- Zhu MY, Wang YY, Zhu YY, Lu BR. Estimating genetic diversity of rice landraces from Yunnan by SSR assay and its implication for conservation. Acta Bot Sin. 2004;46:1458–1467. [Google Scholar]
Internet Resources
- Mascot program, http://www.matrixscience.com November 30, 2012.
- InterProscan program, http://www.ebi.ac.uk/Tools/InterProScan January 9, 2013.
- WEGO software, http://wego.genomics.org.cn January 10, 2013.
Associated Data
This section collects any data citations, data availability statements, or supplementary materials included in this article.
Supplementary Materials
Figure S1 - Triplicate gel images for 93-11.
Figure S2 - Triplicate gel images for Nipponbare.
Figure S3 - Complete gel images of the indica varieties.
Figure S4 - Complete gel images of the japonica varieties.