



Currently all clinical practice guidelines recommend multiphasic CT and MR imaging with extracellular agents for diagnosis and staging of hepatocellular carcinoma (HCC); these modalities provide valuable information regarding vascularity and have excellent accuracy for diagnosis of large nodular HCCs, but they have limited sensitivity for early HCCs as well as for small and progressed HCCs.
Abstract
Computed tomography (CT) and magnetic resonance (MR) imaging play critical roles in the diagnosis and staging of hepatocellular carcinoma (HCC). The second article of this two-part review discusses basic concepts of diagnosis and staging, reviews the diagnostic performance of CT and MR imaging with extracellular contrast agents and of MR imaging with hepatobiliary contrast agents, and examines in depth the major and ancillary imaging features used in the diagnosis and characterization of HCC.
© RSNA, 2014
Learning Objectives:
After reading the article and taking the test, the reader will be able to:
■ Describe the essential elements for diagnosis and staging of hepatocellular carcinoma (HCC)
■ Describe the major and ancillary CT and MR imaging features used in the diagnosis and characterization of HCC
■ Discuss the advantages and disadvantages of extracellular and hepatobiliary agents for diagnosis and staging of HCC
Accreditation and Designation Statement
The RSNA is accredited by the Accreditation Council for Continuing Medical Education (ACCME) to provide continuing medical education for physicians. The RSNA designates this journal-based SA-CME activity for a maximum of 1.0 AMA PRA Category 1 Credit TM. Physicans should claim only the credit commensurate with the extent of their participation in the activity.
Disclosure Statement
The ACCME requires that the RSNA, as an accredited provider of CME, obtain signed disclosure statements from the authors, editors, and reviewers for this activity. For this journal-based SA-CME activity, author disclosures are listed at the end of this article.
Introduction
This two-part review discusses the current state of the art for computed tomography (CT)- and magnetic resonance (MR) imaging–based diagnosis and staging of hepatocellular carcinoma (HCC). The first article reviewed basic background material including HCC epidemiology, key concepts in hepatocarcinogenesis, CT and MR imaging technique, and the CT and MR imaging appearance of cirrhotic nodules, low-grade dysplastic nodules, and high-grade dysplastic nodules. This second article builds on these concepts and reviews in detail the diagnosis and staging of HCC using CT and MR imaging. In the article, we focus on CT and MR imaging because these currently are the most important modalities for HCC diagnosis and staging. Other imaging methods have been advocated for these purposes, including contrast material–enhanced ultrasonography (1), CT hepatic angiography and CT arterial portography (2), MR imaging with Kupffer cell agents (3), and positron emission tomography (4), but these modalities are utilized mainly as supplementary tests for select indications, not performed in many parts of the world, and hence not discussed here. While the emphasis is on diagnosis and staging, this article also reviews emerging roles of CT and MR imaging for predicting HCC tumor grade and other important biologic properties.
Diagnosis and Staging: Basic Concepts
Diagnosis
Unlike most cancers, in which imaging findings are confirmed by means of tissue sampling prior to therapy, imaging may be used to establish the diagnosis of HCC noninvasively, and treatment, including major surgical options such as hepatic resection and liver transplantation, may be initiated without confirmatory biopsy (5). The rationale is that in well-defined high-risk populations (eg, patients with cirrhosis), some imaging features permit diagnosis of HCC with a positive predictive value approximating 100%, while biopsy has many limitations for HCC diagnosis and staging such as frequent false-negative results in small HCCs (6,7) and impracticability for evaluating multiple lesions concurrently. It also has a number of attendant risks including needle tract seeding (2.7%) and bleeding complications (0.5%). According to current guidelines (8–11), biopsy is reserved for indeterminate nodules that do not satisfy radiologic criteria for HCC. Implicit in imaging-based diagnosis is the differentiation of HCC from nonmalignant cirrhosis-associated nodules (eg, cirrhotic nodules, low-grade dysplastic nodules, high-grade dysplastic nodules) and benign lesions and pseudolesions that may be encountered in the cirrhotic liver (eg, small hemangiomas, perfusion alterations, focal or confluent fibrosis). Also important is differentiation of HCC from nonhepatocellular malignancies that may occur in the cirrhotic liver (12). Among these, differentiation from mass-forming intrahepatic cholangiocarcinoma (ICC) is particularly important. As mentioned in part I, patients with cirrhosis and viral hepatitis have elevated risk for developing ICC as well as HCC, and ICC may account for up to 5% of cancers in these patients (13). Unlike HCC, however, it tends to disseminate systemically early in its course, and patients with ICC usually are not eligible for liver transplantation (14). Thus, it is not sufficient to use imaging to establish the diagnosis of a malignant liver tumor; it needs to establish the diagnosis of HCC specifically.
Staging
Staging systems are key to predict the prognosis of patients with cancer, to stratify the patients according to prognostic variables in the setting of clinical trials, to allow exchange of information among researchers, and to guide the therapeutic approach (15). In general, the prognosis of solid tumors is greatly affected by tumor stage. In HCC patients, however, prognosis assessment is complicated due to the geographic and biologic heterogeneity of the disease and lack of consensus on how to best classify patients. To assess the prognosis of HCC patients it may be necessary to take into consideration not only the tumor stage but also liver function, physical status, and treatment efficacy (16). Conventionally HCC has been classified by the TNM (tumor-node-metastasis) or Okuda staging systems. The TNM system is based on data from patients who underwent curative resections and its use is limited because liver function is not considered (17). The Okuda classification takes tumor size and the degree of underlying cirrhosis into account, but it has limitations in stratifying patients with early or intermediate stage disease (15,18). Several new systems have been proposed recently to incorporate tumor stage, liver function, and physical status (15). Among them the Barcelona Clinic Liver Cancer (BCLC) staging system links the stage of the disease to a specific treatment strategy (19). There is a corresponding treatment schedule for each stage, ranging from curative therapies to best supportive care. It has been suggested that this system is best suited for treatment guidance and particularly to select patients with early stage disease who could benefit from curative therapies (5). However, a limitation of the BCLC system is lack of discrimination within the intermediate stage (BCLC-B), as this stage encompasses a broad clinical spectrum with potential for prognostic heterogeneity (20).
Although there is no universal agreement on the best staging that can be recommended worldwide, most current systems incorporate radiologic staging. Radiologic staging refers to the imaging-based determination of the number and size of HCC nodules within the liver as well as the presence of macrovascular invasion and extrahepatic metastases (21). Although there are minor differences between the systems in how the stage is determined by the size and number of nodules, radiologic staging is used to inform clinical decision making, optimize treatment strategies, and determine eligibility and priority for liver transplantation (5,22). Patients with macrovascular invasive HCC or extrahepatic metastases are not eligible for liver transplantation, while those with one 2–5-cm HCC nodule or with two to three HCCs nodules measuring up to 3 cm may be assigned priority for transplantation (22). According to Organ Procurement and Transplantation Network policy, only nodules that satisfy imaging criteria for definite HCC or that are proven by means of biopsy to be HCC contribute to the staging (22). Imaging-detected nodules that are suspicious but not diagnostic for HCC usually are ignored for staging purposes. Detection of microvascular invasion and differentiation of the two causes of multifocality (intrahepatic metastasis or multicentric carcinogenesis) are not part of routine radiologic staging, as imaging methods for these purposes have not yet been validated. With emerging understanding of HCC genomics, there is no doubt that personalized approaches will be introduced in clinical practice based on molecular targeted therapies (23,24). Under these new circumstances, it is likely that tumor biology will play an important role in future staging.
Diagnostic Performance of CT and MR Imaging
Currently, all major clinical practice guidelines endorse multiphasic CT and MR imaging with extracellular contrast agents as the first-line modalities for diagnosis and staging of HCC (8–11). As discussed in part I, these examinations should include late hepatic arterial, portal venous, and, at about 3–5 minutes, delayed phase acquisitions. Precontrast imaging is needed for MR imaging but, to reduce radiation dose, usually may be omitted for CT, except in patients previously treated with locoregional embolic or ablative therapies, without loss of significant diagnostic information. While some single-center comparative studies have shown slightly better performance of dynamic MR imaging using extracellular contrast agents than multiphasic CT (25,26), the differences are small. The per-lesion sensitivity of MR imaging for nodular HCC of all sizes is 77%–100%, while that of CT is 68%–91% (25,27–30). The per-lesion sensitivities, stratified by size, are 100% for both modalities for nodular HCCs larger than 2 cm, 44%–47% (MR imaging) and 40%–44% (CT) for 1–2-cm HCCs (25,26,29), and 29%–43% (MR imaging) and 10%–33% (CT) for HCCs smaller than 1 cm (26,27,29). Thus, both modalities provide excellent sensitivity for nodular HCCs larger than 2 cm, modest sensitivity for 1–2-cm HCCs, and poor sensitivity for HCCs smaller than 1 cm, and it is not yet clear which modality is superior. Advantages of CT are that it is widely available, rapid, robust, and compared with MR imaging needs less expertise to perform and to interpret images. Disadvantages include radiation exposure and relatively low soft-tissue contrast. By comparison, MR imaging provides higher soft-tissue contrast and permits assessment of a greater number of tissue properties, which in principle may help in lesion detection and characterization. On the other hand, MR imaging is more time consuming, less robust, and more prone to artifacts. It requires greater expertise to perform and interpret images, and it is less available. Thus, while MR imaging may be preferred over CT at many academic centers, there is insufficient data to recommend MR imaging over CT in community or less-specialized centers.
Although MR imaging with hepatobiliary agents is not yet integrated into most clinical practice guidelines, it is discussed here because it is emerging worldwide as a leading method for diagnosis and staging of HCC, and accumulating evidence suggests that MR imaging with hepatobiliary agents is the most sensitive method for detection of small HCCs and of premalignant lesions likely to progress to overt HCC (31–37). As discussed in part I, these agents permit acquisition of hepatobiliary phase images that provide information on hepatocellular function, thereby supplementing the information provided by the vascular phases. In comparative studies, gadoxetate disodium–enhanced MR imaging had significantly higher per-lesion sensitivity and/or overall accuracy for the diagnosis of HCC than multiphasic CT (38,39), CT hepatic angiography/CT arterial portography (40,41), and MR imaging with extracellular agents (39); in two additional studies, differences between gadoxetate disodium–enhanced MR imaging and multiphasic CT studies were not significant (31). Fewer studies have compared gadobenate dimeglumine–enhanced MR imaging with other modalities: One study found no difference in overall accuracy between gadobenate dimeglumine–enhanced MR imaging and multiphasic CT (27), while another found gadobenate dimeglumine–enhanced MR imaging to have higher sensitivity and accuracy (38). The one study comparing gadoxetate disodium– and gadobenate dimeglumine–enhanced MR imaging found no significant performance differences (42).
Diagnosis and Staging of HCC with Extracellular Agents
Multiphasic CT and MR imaging with extracellular agents permit diagnosis and staging of HCC based mainly on assessment of vascularity. The principles are essentially the same for CT and MR imaging, and so the two modalities are discussed together. Major imaging features of HCC depicted in the vascular phases of CT and MR imaging are summarized in Table 1. MR imaging and, to a lesser extent, CT also allow assessment of ancillary features that may help detect and characterize liver lesions as well as modify reader confidence; these are discussed later.
Table 1.
Major Imaging Features of HCC Assessed in the Vascular Phases of CT and MR Imaging

Note.—The information in this table is intended for application in patients at risk for development of HCC due to cirrhosis, chronic viral hepatitis, or other factors. It is not intended for application in the general population.
Using extracellular agents, the hallmark diagnostic features of HCC at multiphasic CT or MR imaging are arterial phase hyperenhancement (Fig 1) followed by portal venous or delayed phase washout appearance (7–12,22,43–45).
Figure 1a:
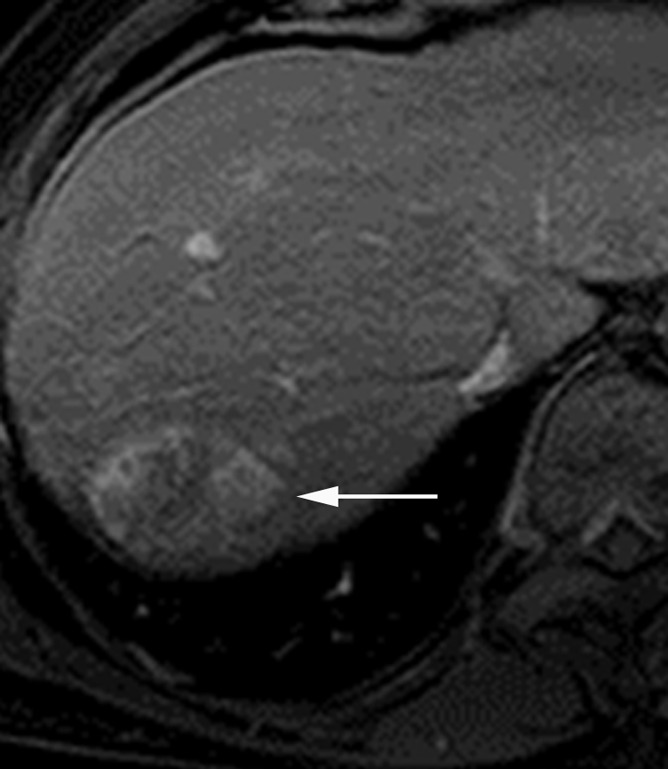
Images in a 69-year-old man with encapsulated progressed HCC. (a) T1-weighted three-dimensional (3D) gradient-echo (GRE) MR image with fat suppression (repetition time msec/echo time msec, 3.0/1.4; 10° flip angle) obtained in late hepatic arterial phase after administration of gadolinium-based contrast agent shows hyperenhancing mass (arrow) with mosaic architecture in segment VII. (b) Mass is isointense on portal venous phase image with a capsule appearance (arrow). Mosaic architecture and capsule appearance permit confident diagnosis of HCC, even though mass does not appear to wash out to hypointensity relative to liver in portal venous phase. (c) Photograph of gross pathologic specimen confirms progressed HCC with fibrous capsule.
Figure 1b:
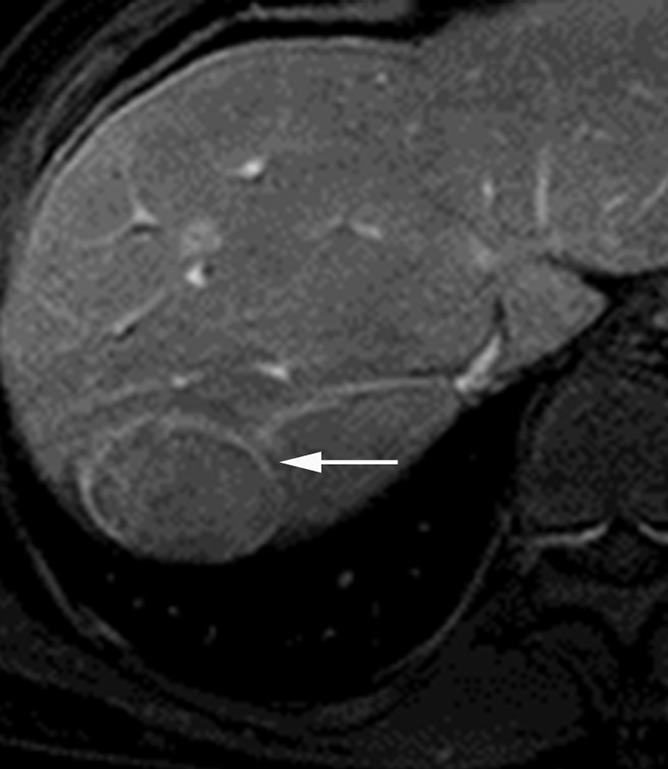
Images in a 69-year-old man with encapsulated progressed HCC. (a) T1-weighted three-dimensional (3D) gradient-echo (GRE) MR image with fat suppression (repetition time msec/echo time msec, 3.0/1.4; 10° flip angle) obtained in late hepatic arterial phase after administration of gadolinium-based contrast agent shows hyperenhancing mass (arrow) with mosaic architecture in segment VII. (b) Mass is isointense on portal venous phase image with a capsule appearance (arrow). Mosaic architecture and capsule appearance permit confident diagnosis of HCC, even though mass does not appear to wash out to hypointensity relative to liver in portal venous phase. (c) Photograph of gross pathologic specimen confirms progressed HCC with fibrous capsule.
Figure 1c:
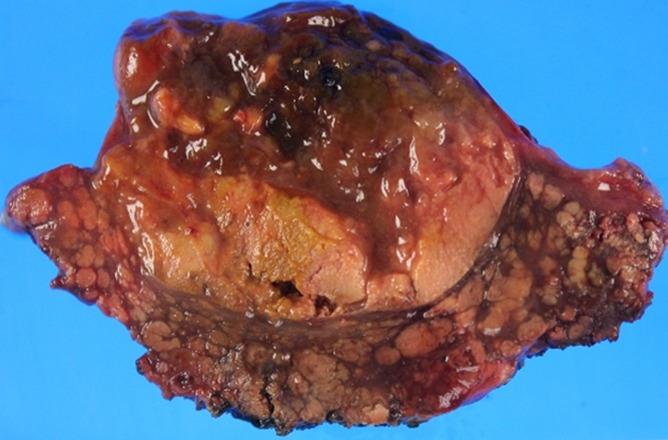
Images in a 69-year-old man with encapsulated progressed HCC. (a) T1-weighted three-dimensional (3D) gradient-echo (GRE) MR image with fat suppression (repetition time msec/echo time msec, 3.0/1.4; 10° flip angle) obtained in late hepatic arterial phase after administration of gadolinium-based contrast agent shows hyperenhancing mass (arrow) with mosaic architecture in segment VII. (b) Mass is isointense on portal venous phase image with a capsule appearance (arrow). Mosaic architecture and capsule appearance permit confident diagnosis of HCC, even though mass does not appear to wash out to hypointensity relative to liver in portal venous phase. (c) Photograph of gross pathologic specimen confirms progressed HCC with fibrous capsule.
Arterial phase hyperenhancement, sometimes termed arterial “wash-in” or arterial “hypervascularity,” is defined as enhancement in the arterial phase that unequivocally is greater than that of surrounding liver. The pathophysiologic basis for arterial phase hyperenhancement in HCC is well understood. Intranodular arterial supply increases during hepatocarcinogenesis (46). Hence, most cirrhotic nodules, dysplastic nodules and early HCCs are hypoenhancing or isoenhancing in the arterial phase (41). By comparison, most progressed HCCs are hyperenhancing (47). While arterial phase hyperenhancement is characteristic of progressed HCC, it is nonspecific as it can also be observed in benign perfusion alterations, small hemangiomas, small focal nodular hyperplasia–like lesions (48), some atypical cases of focal or confluent fibrosis, some atypical cirrhotic nodules and dysplastic nodules (49), and non-HCC malignancies such as small ICCs (50) or small hypervascular metastases such as neuroendocrine tumors. In patients with cirrhosis or chronic hepatitis, small vascular pseudolesions attributable to arterioportal shunts are particularly common, and the large majority of focal areas of enhancement seen only in the arterial phase and measuring less than 2 cm are nonneoplastic (51), especially those that are wedge shaped and subcapsular (52).
Washout appearance is defined as a visually assessed temporal reduction in enhancement relative to surrounding liver from an earlier to a later phase, resulting in portal venous or delayed phase hypoenhancement (12). This “washout” may be more conspicuous in the delayed compared with the portal venous phase, and in some lesions, “washout” may be depicted only in the delayed phase (53,54). The mechanisms underlying washout appearance in HCC are not fully understood. Several concurrent factors likely are contributory, including early venous drainage of contrast material from the tumor (true washout), progressive enhancement of background liver (due to retention of contrast material within fibrotic parenchyma), reduced intranodular portal venous blood supply, tumoral hypercellularity with corresponding reduction in extracellular volume, and intrinsic hypoattenuation/hypointensity (44). Thus, the visually assessed temporal reduction in enhancement relative to liver may be caused by factors other than true washout, and for this reason the term washout appearance is advocated by the Liver Imaging Reporting and Data System (LI-RADS) (12). Like arterial phase hyperenhancement, washout appearance by itself is not specific for HCC as this feature may be observed in cirrhotic nodules and dysplastic nodules. Additionally, focal areas of parenchymal distortion and enhancing fibrosis may create the perception of “washout” (55). Thus, washout appearance should not be used as a feature of HCC unless the findings are unequivocal (12). Until now, most investigators have evaluated washout appearance subjectively. Recently Liu and colleagues (56) proposed a quantitative definition for washout based on CT attenuation values in user-defined regions of interest in lesion and adjacent liver; studies are needed to compare the accuracy and interreader reliability for HCC diagnosis using quantitative versus subjective definitions of “washout.”
Although the individual features are nonspecific, the combination of arterial phase hyperenhancement and portal venous and/or delayed phase washout appearance is highly specific for HCC in patients with cirrhosis or other risk factors for HCC (7,43,45). In such patients, this temporal enhancement pattern has approximately 100% specificity for HCCs 20 mm or larger and approximately 90% specificity for 10- to 19-mm HCC (7,44,55). Importantly, the combination of arterial phase hyperenhancement and washout appearance very rarely is observed in ICC (50). Due to its high specificity, this temporal enhancement pattern is incorporated into all current systems developed for CT- or MR imaging–based diagnosis of HCC in at-risk patients (8–12,22). This temporal enhancement pattern is not specific for the diagnosis of HCC in the general population, however, in which the differential diagnosis includes metastasis, hepatocellular adenoma, and other lesions.
Another imaging feature characteristic of progressed HCC is capsule appearance (45,55,57–59), which refers to a peripheral rim of smooth hyperenhancement in the portal venous or delayed phase (12) (Fig 1). The degree of enhancement usually increases from early to later phases, and the delayed phase may be superior to the portal venous phase for identifying this feature (57,60). Retrospective studies of resected HCCs have shown that capsule appearance at CT (59) or MR imaging (57,58) correlates with the presence of a tumor capsule at pathologic examination; a tumor capsule is a frequent pathologic feature of progressed HCC but not of early HCC, dysplastic nodules, or cirrhotic nodules. The progressive enhancement has been attributed to slow flow within intracapsular vessels as well as contrast agent retention within the extravascular connective tissue of the capsule (57). While imaging-based capsule appearance correlates with the presence of a tumor capsule at pathologic examination, about one quarter of nodules with radiologically detected “capsules” lack a true capsule at pathologic examination but instead are surrounded by “pseudocapsules” consisting of mixed fibrous tissue and dilated sinusoids (58). Thus, capsule appearance is not pathognomonic for the presence of a true tumor capsule. Nevertheless, because precursor nodules (cirrhotic nodules and dysplastic nodules) and non-HCC tumors usually do not demonstrate progressive rim enhancement, capsule appearance has been shown to be an important predictor of HCC (45,55). Although some investigators have found that capsule appearance does not incrementally increase the sensitivity or specificity for HCC since it usually is seen in HCCs with other hallmark imaging features (45), other investigators have found that capsule appearance is valuable by permitting diagnosis of HCC without definite washout appearance (55) (Fig 1). According to two diagnostic systems (12,22), a mass 2 cm or larger with arterial phase hyperenhancement and capsule appearance can be diagnosed definitively as HCC even in the absence of washout appearance; for 10- to 19-mm masses with arterial phase hyperenhancement, both capsule appearance and washout appearance are required.
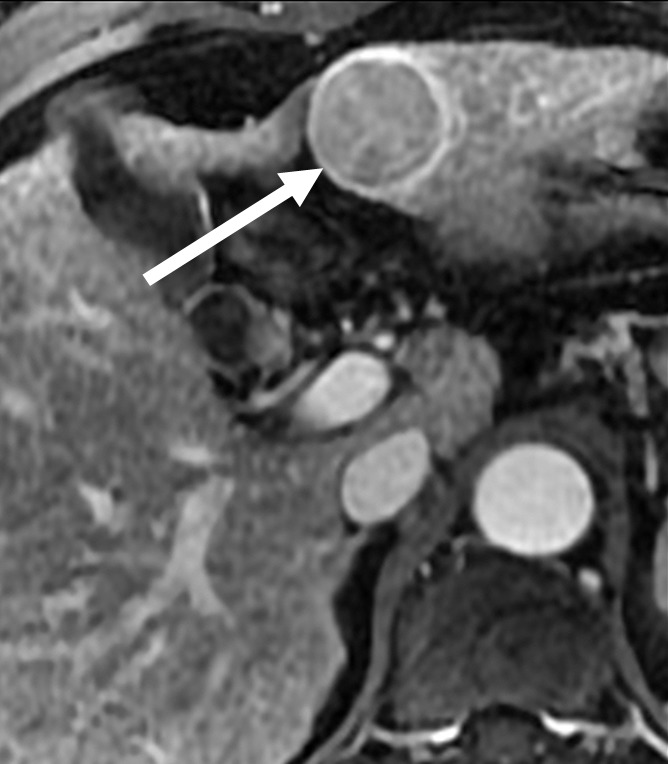
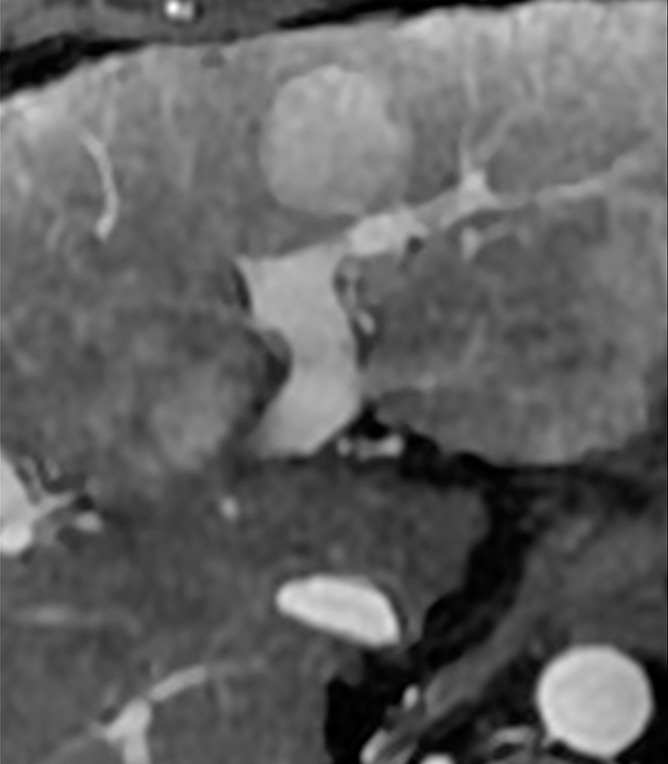
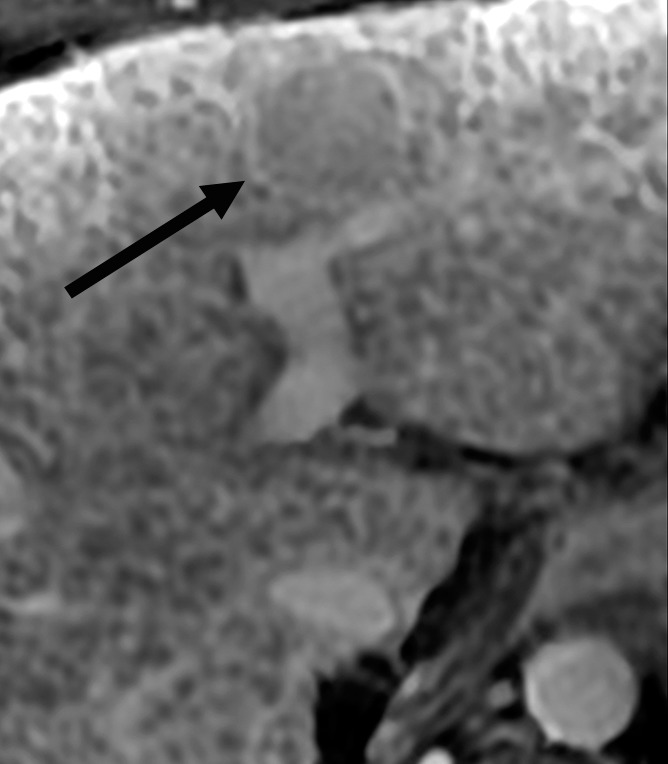
A potential pitfall in applying this feature is that some small ICCs show peripheral enhancement in all phases (50), which may be misinterpreted as a “capsule;” a discriminating characteristic is that the peripheral enhancement in ICC tends to peak in the arterial phase and diminish in later phases, rather than progress. Another pitfall is that fibrous tissue surrounding cirrhotic nodules and dysplastic nodules may enhance on delayed phase images, generating the perception of a “capsule” (55); thus, radiologists should apply this feature only if the enhancing rim unequivocally is thicker or more conspicuous than the fibrous tissue surrounding background nodules (12) (Fig 2).
Figure 2a:
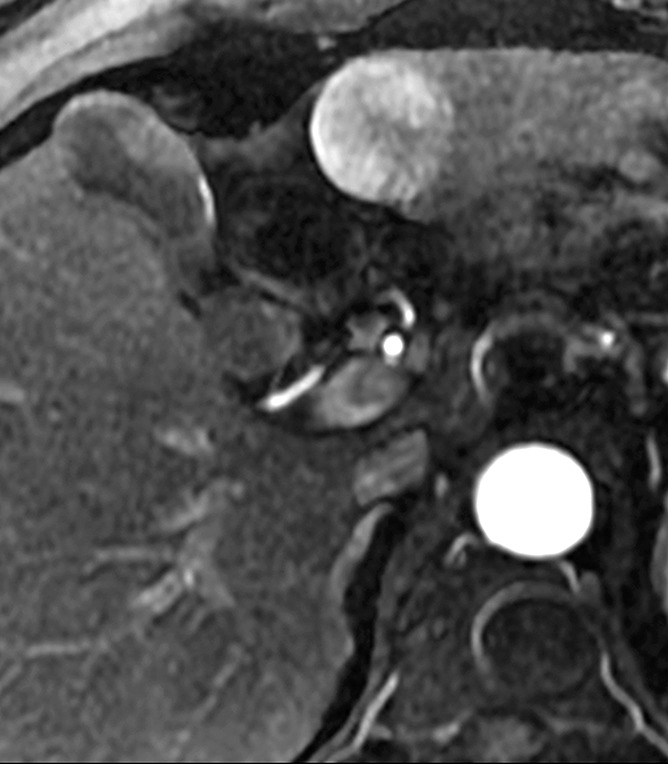
HCCs with and without definite capsule appearance. (a, b) HCC with definite capsule appearance in a 54-year-old man with hepatitis C–related cirrhosis. T1-weighted 3D GRE MR images with fat suppression (3.0/1.4; 15° flip angle) obtained in (a) late hepatic arterial phase and (b) 3-minute delayed phase after administration of gadolinium-based contrast agent show 3.2-cm HCC in left lobe. Peripheral enhancing rim (arrow) in delayed phase is unequivocally thicker and more conspicuous than enhancing fibrosis surrounding background nodules, consistent with capsule appearance. (c, d) HCC without definite capsule appearance in 35-year-old man with hepatitis C–related cirrhosis. T1-weighted 3D GRE MR images with fat suppression (3.0/1.4; 15° flip angle) obtained in (c) late hepatic arterial phase and (d) 3-minute delayed phase after administration of gadolinium-based contrast agent show 2.5-cm HCC in left lobe. Peripheral enhancing rim (arrow) in delayed phase is of similar thickness and conspicuity as enhancing fibrosis surrounding background nodules.
Figure 2b:
HCCs with and without definite capsule appearance. (a, b) HCC with definite capsule appearance in a 54-year-old man with hepatitis C–related cirrhosis. T1-weighted 3D GRE MR images with fat suppression (3.0/1.4; 15° flip angle) obtained in (a) late hepatic arterial phase and (b) 3-minute delayed phase after administration of gadolinium-based contrast agent show 3.2-cm HCC in left lobe. Peripheral enhancing rim (arrow) in delayed phase is unequivocally thicker and more conspicuous than enhancing fibrosis surrounding background nodules, consistent with capsule appearance. (c, d) HCC without definite capsule appearance in 35-year-old man with hepatitis C–related cirrhosis. T1-weighted 3D GRE MR images with fat suppression (3.0/1.4; 15° flip angle) obtained in (c) late hepatic arterial phase and (d) 3-minute delayed phase after administration of gadolinium-based contrast agent show 2.5-cm HCC in left lobe. Peripheral enhancing rim (arrow) in delayed phase is of similar thickness and conspicuity as enhancing fibrosis surrounding background nodules.
Figure 2c:
HCCs with and without definite capsule appearance. (a, b) HCC with definite capsule appearance in a 54-year-old man with hepatitis C–related cirrhosis. T1-weighted 3D GRE MR images with fat suppression (3.0/1.4; 15° flip angle) obtained in (a) late hepatic arterial phase and (b) 3-minute delayed phase after administration of gadolinium-based contrast agent show 3.2-cm HCC in left lobe. Peripheral enhancing rim (arrow) in delayed phase is unequivocally thicker and more conspicuous than enhancing fibrosis surrounding background nodules, consistent with capsule appearance. (c, d) HCC without definite capsule appearance in 35-year-old man with hepatitis C–related cirrhosis. T1-weighted 3D GRE MR images with fat suppression (3.0/1.4; 15° flip angle) obtained in (c) late hepatic arterial phase and (d) 3-minute delayed phase after administration of gadolinium-based contrast agent show 2.5-cm HCC in left lobe. Peripheral enhancing rim (arrow) in delayed phase is of similar thickness and conspicuity as enhancing fibrosis surrounding background nodules.
Figure 2d:
HCCs with and without definite capsule appearance. (a, b) HCC with definite capsule appearance in a 54-year-old man with hepatitis C–related cirrhosis. T1-weighted 3D GRE MR images with fat suppression (3.0/1.4; 15° flip angle) obtained in (a) late hepatic arterial phase and (b) 3-minute delayed phase after administration of gadolinium-based contrast agent show 3.2-cm HCC in left lobe. Peripheral enhancing rim (arrow) in delayed phase is unequivocally thicker and more conspicuous than enhancing fibrosis surrounding background nodules, consistent with capsule appearance. (c, d) HCC without definite capsule appearance in 35-year-old man with hepatitis C–related cirrhosis. T1-weighted 3D GRE MR images with fat suppression (3.0/1.4; 15° flip angle) obtained in (c) late hepatic arterial phase and (d) 3-minute delayed phase after administration of gadolinium-based contrast agent show 2.5-cm HCC in left lobe. Peripheral enhancing rim (arrow) in delayed phase is of similar thickness and conspicuity as enhancing fibrosis surrounding background nodules.
Extracapsular extension with the formation of satellite nodules is frequently seen in large progressed HCC (61). These satellite nodules represent intrahepatic metastases within the venous drainage area around the main tumor (62). They often manifest as multiple subcentimeter nodules outside the tumor margins (usually within 2 cm). If corona enhancement (discussed later) is observed, they may be located within the corona enhancement area (63). These satellite nodules are by definition progressed lesions that have developed the ability to invade vessels and metastasize. Hence, despite their small size, they typically manifest arterial phase hyperenhancement, which would not be expected for HCCs of similar size arising through multistep hepatocarcinogenesis from precursor lesions (64). Other features of progressed HCCs such as washout appearance and capsule appearance may or may not be evident, depending on the size of the lesions, the spatial and contrast resolution of the images, and other factors. The presence of satellite nodules has been recognized as predictor of recurrence and lower survival after transplantation, resection, and local ablation (65). Although satellite nodules are frequently observed around progressed HCCs, the sensitivity and specificity of CT or MR imaging for their detection have not been extensively studied and merit further investigation. Also, satellite nodules may occur around ICC; thus, the presence of satellite nodules does not help in the differential diagnosis of HCC and ICC (66).
For nodules that meet diagnostic criteria for HCC, careful analysis of enhancement features may provide prognostic information. Single-center, retrospective studies have suggested that heterogeneous arterial phase enhancement with irregular ringlike structures predicts high tumor grade and posttreatment recurrence (67). A correlation between heterogeneous arterial enhancement and worrisome biologic features has not been consistently observed, however (68). Whether the intensity, as opposed to the heterogeneity, of arterial phase enhancement predicts tumor grade, microvascular invasion, or other prognostic features is controversial (69,70). Additionally, the rate at which tumors appear to “wash out” may be important. According to some single-center retrospective studies, early washout appearance manifesting in the portal venous phase predicts higher tumor grade (71,72) and, at a trend level, higher probability of microvascular invasion (68) than washout appearance manifesting only in the delayed phase. In HCCs with capsule appearance, radiologists should inspect the “capsule” carefully for its integrity, as imaging evidence of capsular disruption suggests the tumor has infiltrated through the capsule into the surrounding tissue, an indicator of poor prognosis (59,73).
In addition to diagnosis of individual HCC nodules, CT and MR imaging with extracellular agents also contribute to tumor staging by permitting diagnosis of macrovascular invasion (“tumor thrombus”). Identification of macrovascular invasion, and differentiation from bland thrombus, which also occurs with high frequency in patients with cirrhosis, is critical: The former usually precludes surgical treatment options such as resection or liver transplantation, while the latter may alter the surgical approach but usually does not exclude surgery from consideration. Specific imaging features of macrovascular invasion include direct extension of a parenchymal tumor mass into an adjacent vessel (74) and the presence within an occluded vein of arterial enhancing neovessels manifesting as defined as thin and punctate hyperenhancing “threads and streaks” within a portal venous or hepatic venous thrombus (Fig 3). Expansion of a thrombosed main portal vein to greater than or equal to 23 mm also suggests intraluminal tumor, with a reported sensitivity and specificity of 63% and 100%, respectively (75); caution should be exercised in interpretation of this feature, however, as acute bland thrombosis also may result in luminal expansion. Despite the importance of macrovascular invasion for tumor staging, treatment planning, and prognosis, the sensitivity and specificity of state-of-the-art CT and MR imaging for its diagnosis is not well known due to paucity of studies on this subject since 2000. In one recent study, Sorrentino and colleagues (76) evaluated the diagnostic performance of arterial phase hyperenhancement of the thrombus at CT and found a sensitivity of 87%. As mentioned later, in retrospective studies, diffusion-weighted MR imaging has been shown by some investigators to aid in the differentiation of macrovascular invasion from bland venous thrombus (77), but other investigators have not found diffusion-weighted imaging to be helpful (78). Larger prospective studies are needed to evaluate diffusion-weighted imaging for this purpose.
Figure 3a:
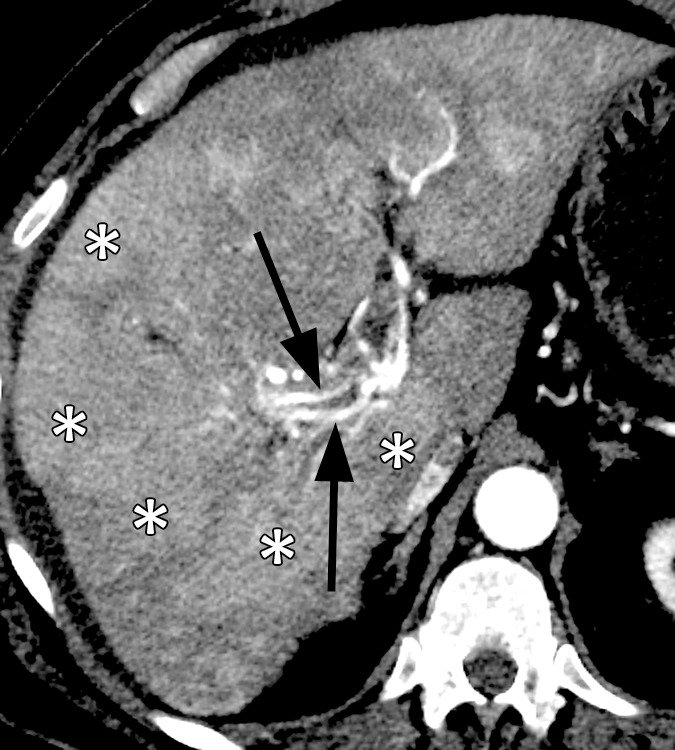
Images in a 64-year-old man with infiltrative HCC and macrovascular invasion. Axial CT images obtained in the (a) late arterial, (b) portal venous, and (c) 3-minute delayed phases after administration of an iodinated contrast agent reveal heterogeneously enhancing soft tissue expanding the lumen of the right portal vein and its branches consistent (arrowheads) with macrovascular invasion by HCC. Note arterial phase hyperenhancing tumoral arteries (arrows), sometimes described as “threads and streaks,” within the intraluminal tissue. Note patchy areas (*) of arterial phase hyperenhancement and delayed phase partial washout appearance in the liver parenchyma, consistent with infiltrative HCC.
Figure 3b:
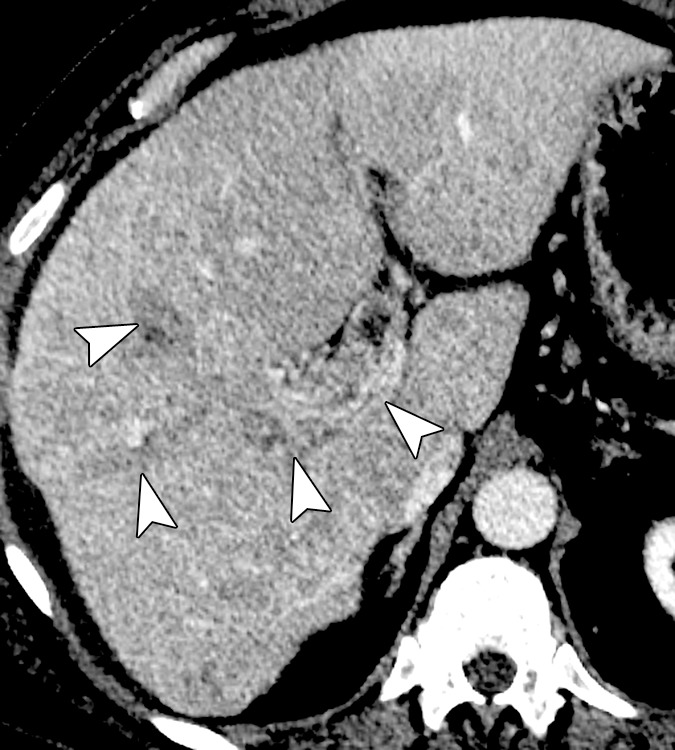
Images in a 64-year-old man with infiltrative HCC and macrovascular invasion. Axial CT images obtained in the (a) late arterial, (b) portal venous, and (c) 3-minute delayed phases after administration of an iodinated contrast agent reveal heterogeneously enhancing soft tissue expanding the lumen of the right portal vein and its branches consistent (arrowheads) with macrovascular invasion by HCC. Note arterial phase hyperenhancing tumoral arteries (arrows), sometimes described as “threads and streaks,” within the intraluminal tissue. Note patchy areas (*) of arterial phase hyperenhancement and delayed phase partial washout appearance in the liver parenchyma, consistent with infiltrative HCC.
Figure 3c:
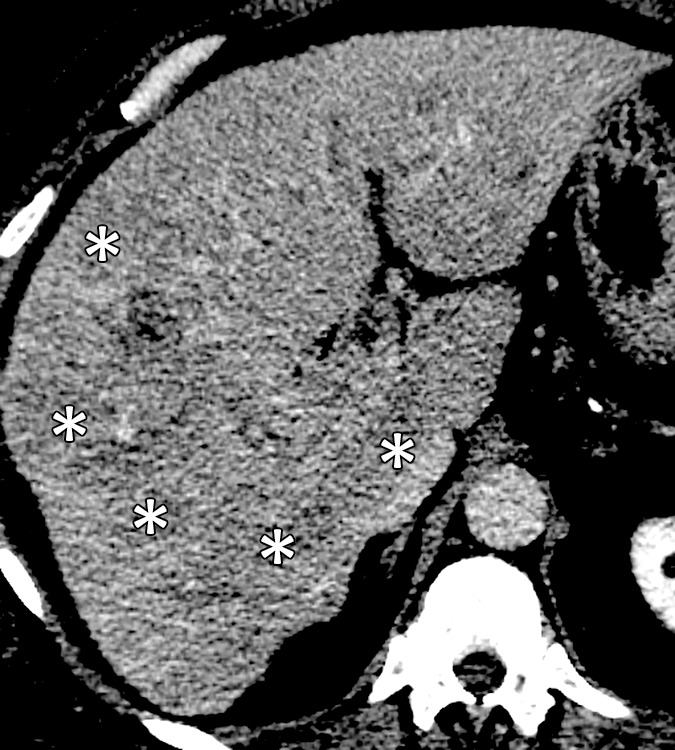
Images in a 64-year-old man with infiltrative HCC and macrovascular invasion. Axial CT images obtained in the (a) late arterial, (b) portal venous, and (c) 3-minute delayed phases after administration of an iodinated contrast agent reveal heterogeneously enhancing soft tissue expanding the lumen of the right portal vein and its branches consistent (arrowheads) with macrovascular invasion by HCC. Note arterial phase hyperenhancing tumoral arteries (arrows), sometimes described as “threads and streaks,” within the intraluminal tissue. Note patchy areas (*) of arterial phase hyperenhancement and delayed phase partial washout appearance in the liver parenchyma, consistent with infiltrative HCC.
The main limitation of CT and MR imaging with extracellular contrast agents for diagnosis and staging of HCC is low per-lesion sensitivity. Only HCCs that have developed sufficient neoangiogenesis to show arterial phase hyperenhancement and that also exhibit washout or capsule appearance can be unequivocally diagnosed. In general, these are progressed, moderately differentiated HCCs. Other HCCs may be difficult to diagnose. Up to approximately 40% of HCCs lack arterial phase hyperenhancement (41,79) and cannot be diagnosed as definite HCC using extracellular agents. These include most early HCCs (80); poorly differentiated, infiltrative HCCs, which may have weak, patchy arterial phase hyperenhancement (81); some nodular HCCs with tiny hypervascular foci too small to be perceived at CT or MR imaging (41); and HCCs in which true hyperenhancement is missed due to arterial phase mistiming or imaging artifacts. Additionally, approximately 40%–60% of small HCCs, even if hyperenhanced in the arterial phase, do not exhibit a washout or capsule appearance in the venous phases (29,55), and so cannot be diagnosed as definite HCC with extracellular agents.
Diagnosis and Staging of HCC with Hepatobiliary Agents
Hepatobiliary agents permit assessment not only of tumor vascularity but also of hepatocellular function based mainly on signal intensity relative to liver in the hepatobiliary phase. While the signal intensity of lesions relative to the liver in the hepatobiliary phase depends on a complex interplay between numerous incompletely understood factors (82), the dominant determinant is OATP8 expression (83,84). Thus, nodules with low or no OATP expression do not uptake hepatobiliary agents and appear hypointense in the hepatobiliary phase (83,84), while nodules with preserved or elevated OATP expression uptake the agents and tend to be isointense or hyperintense (83,84). The role of MRP2 and MRP3 (the transporters that excrete gadoxetate disodium and gadobenate dimeglumine into the bile [MRP2] and back into the sinusoids [MRP3]) in determining hepatobiliary phase signal intensity remains controversial (83,84). Hepatobiliary phase imaging features of HCC are summarized in Table 2 and are discussed below.
Table 2.
Hepatobiliary Phase Imaging Features of HCC

Note.—The information in this table is intended for application in patients at risk for development of HCC due to cirrhosis, chronic viral hepatitis, or other factors. It is not intended for application in the general population.
Since OATP expression declines during hepatocarcinogenesis, the assessment of signal intensity in the hepatobiliary phase helps in the detection and characterization of hepatocellular nodules in the cirrhotic liver. Most HCCs, including many early HCCs, and some high-grade dysplastic nodules are hypointense in the hepatobiliary phase (41) due to underexpression of OATP. By comparison, most cirrhotic nodules, most low-grade dysplastic nodules, some high-grade dysplastic nodules, and only a minority of HCCs are isointense or hyperintense due to preserved expression (85). As a corollary, cirrhosis-associated nodules that are hypointense in the hepatobiliary phase are likely to be malignant or premalignant (86), even in the absence of arterial phase hyperenhancement or venous phase “washout.”
These concepts can be exploited for diagnostic benefit (Fig 4). In patients with cirrhosis or chronic hepatitis, the addition of hepatobiliary phase images improves the per-lesion sensitivity for the diagnosis of HCC by 6%–15% for gadoxetate disodium (87–89) and by 9% for gadobenate dimeglumine (38). By depicting HCCs as easily discernible hypointense nodules against a strongly enhanced background parenchyma (90), the hepatobiliary phase can increase HCC conspicuity and delineation. This facilitates detection and improves reader confidence for HCC nodules that otherwise may be difficult to visualize due to subtle features at other phases and sequences (90). Another benefit is in the interpretation of small nodular lesions characterized by arterial phase hyperenhancement and venous phase isoenhancement. Such lesions are indeterminate if evaluated only in the vascular phases but, after exclusion of hemangiomas, these are highly suspicious for malignancy if they demonstrate hypointensity in the hepatobiliary phase (10,91), with the major differential diagnosis including HCC and ICC. A related benefit is in the differentiation of hypervascular HCCs from hypervascular pseudolesions such as focal perfusion alterations due to arterioportal shunts (38,92), a frequent source of diagnostic confusion using extracellular agents. For most vascular pseudolesions, the underlying OATP expression is preserved and the hepatobiliary phase signal intensity is the same as that of background liver, in contradistinction to HCCs, which characteristically appear hypointense. Although the hepatobiliary phase helps in the differentiation of HCC from some benign entities such as arterioportal shunts, it may complicate the differentiation of HCC from other benign entities such as confluent fibrosis, which also appears hypointense in this phase and conceivably could be misinterpreted as HCC.
Figure 4a:
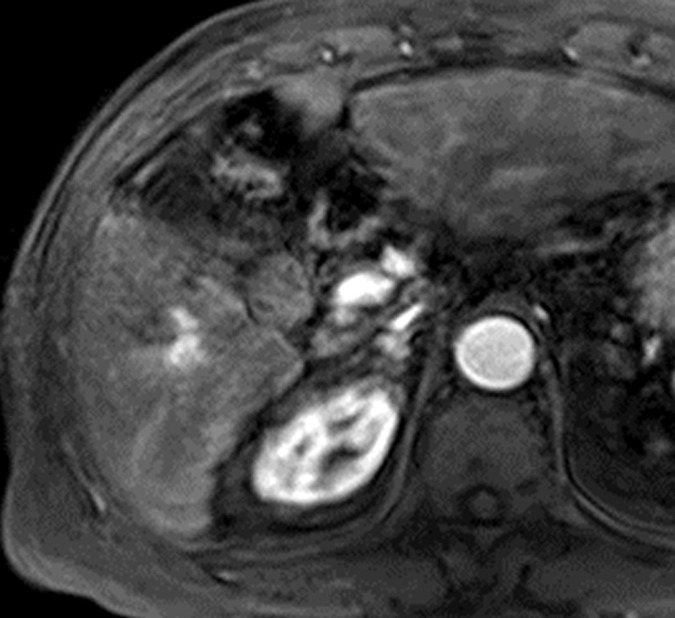
Images in a 59-year-old man with early HCC and hepatitis B–related cirrhosis. (a) Gadoxetate disodium–enhanced T1-weighted 3D GRE MR image (2.5/0.9; 11° flip angle) obtained in late hepatic arterial phase shows no definite early enhancement. (b) Transitional phase image obtained at 3 minutes depicts hypointense nodule (arrow). (c) Nodule is not clearly delineated on T2-weighted fat-saturated turbo spin-echo image (3413/88). (d) Nodule (arrow) is hypointense on hepatobiliary phase image acquired 20 minutes after injection. (e) Gross pathologic evaluation of resected specimen reveals small, vaguely nodular HCC (arrow). Histologic examination confirmed well-differentiated early HCC. Early HCCs frequently are isoenhancing relative to liver in arterial phase (incomplete neoarterialization) but seen clearly as hypointense nodules in the hepatobiliary phase (underexpression of OATP transporters). Note motion artifact in the arterial phase.
Figure 4b:
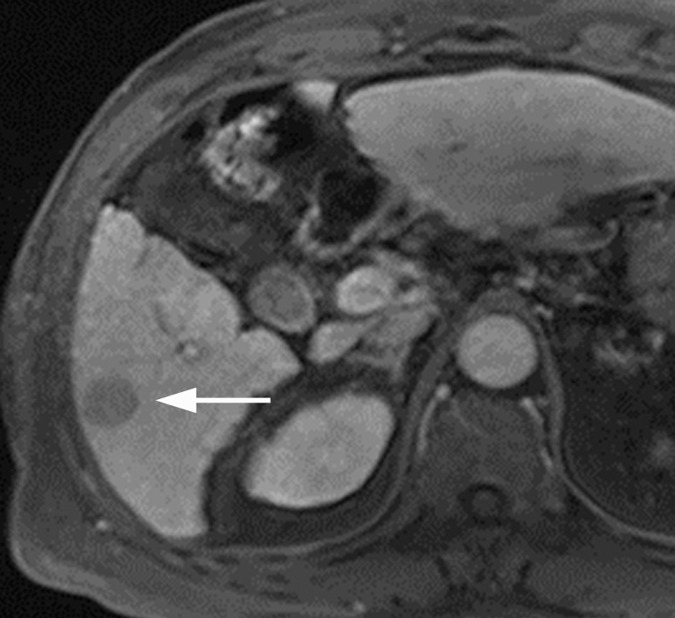
Images in a 59-year-old man with early HCC and hepatitis B–related cirrhosis. (a) Gadoxetate disodium–enhanced T1-weighted 3D GRE MR image (2.5/0.9; 11° flip angle) obtained in late hepatic arterial phase shows no definite early enhancement. (b) Transitional phase image obtained at 3 minutes depicts hypointense nodule (arrow). (c) Nodule is not clearly delineated on T2-weighted fat-saturated turbo spin-echo image (3413/88). (d) Nodule (arrow) is hypointense on hepatobiliary phase image acquired 20 minutes after injection. (e) Gross pathologic evaluation of resected specimen reveals small, vaguely nodular HCC (arrow). Histologic examination confirmed well-differentiated early HCC. Early HCCs frequently are isoenhancing relative to liver in arterial phase (incomplete neoarterialization) but seen clearly as hypointense nodules in the hepatobiliary phase (underexpression of OATP transporters). Note motion artifact in the arterial phase.
Figure 4c:
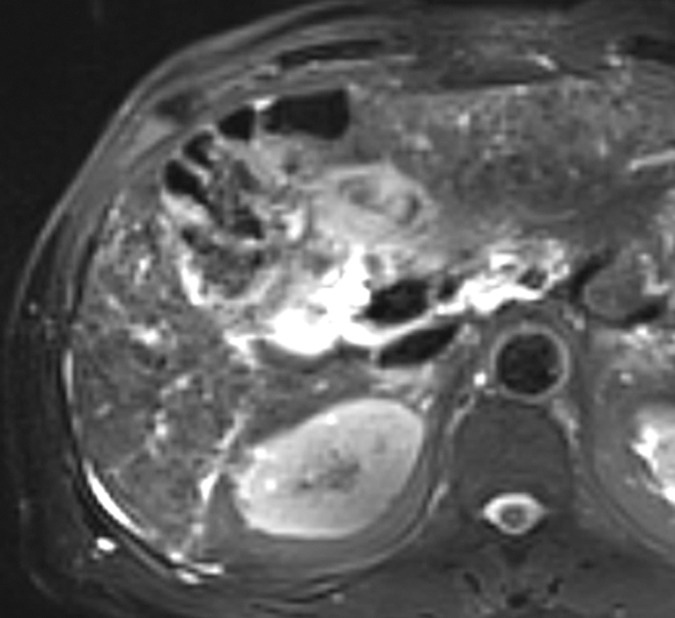
Images in a 59-year-old man with early HCC and hepatitis B–related cirrhosis. (a) Gadoxetate disodium–enhanced T1-weighted 3D GRE MR image (2.5/0.9; 11° flip angle) obtained in late hepatic arterial phase shows no definite early enhancement. (b) Transitional phase image obtained at 3 minutes depicts hypointense nodule (arrow). (c) Nodule is not clearly delineated on T2-weighted fat-saturated turbo spin-echo image (3413/88). (d) Nodule (arrow) is hypointense on hepatobiliary phase image acquired 20 minutes after injection. (e) Gross pathologic evaluation of resected specimen reveals small, vaguely nodular HCC (arrow). Histologic examination confirmed well-differentiated early HCC. Early HCCs frequently are isoenhancing relative to liver in arterial phase (incomplete neoarterialization) but seen clearly as hypointense nodules in the hepatobiliary phase (underexpression of OATP transporters). Note motion artifact in the arterial phase.
Figure 4d:
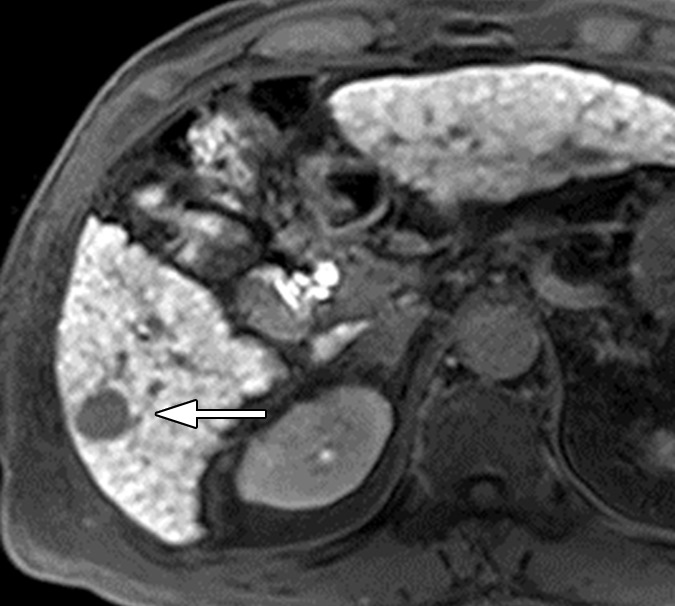
Images in a 59-year-old man with early HCC and hepatitis B–related cirrhosis. (a) Gadoxetate disodium–enhanced T1-weighted 3D GRE MR image (2.5/0.9; 11° flip angle) obtained in late hepatic arterial phase shows no definite early enhancement. (b) Transitional phase image obtained at 3 minutes depicts hypointense nodule (arrow). (c) Nodule is not clearly delineated on T2-weighted fat-saturated turbo spin-echo image (3413/88). (d) Nodule (arrow) is hypointense on hepatobiliary phase image acquired 20 minutes after injection. (e) Gross pathologic evaluation of resected specimen reveals small, vaguely nodular HCC (arrow). Histologic examination confirmed well-differentiated early HCC. Early HCCs frequently are isoenhancing relative to liver in arterial phase (incomplete neoarterialization) but seen clearly as hypointense nodules in the hepatobiliary phase (underexpression of OATP transporters). Note motion artifact in the arterial phase.
Figure 4e:
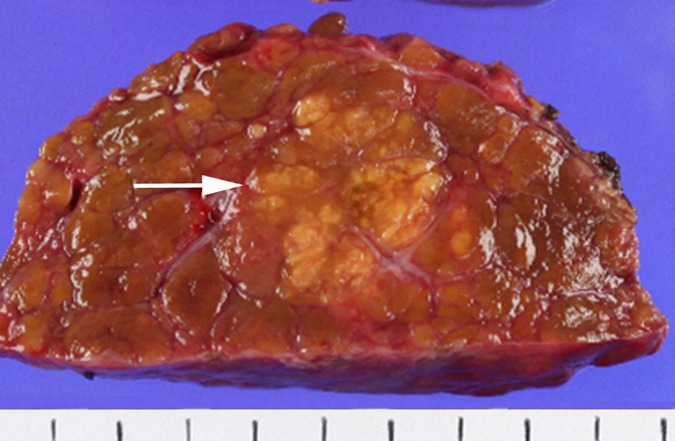
Images in a 59-year-old man with early HCC and hepatitis B–related cirrhosis. (a) Gadoxetate disodium–enhanced T1-weighted 3D GRE MR image (2.5/0.9; 11° flip angle) obtained in late hepatic arterial phase shows no definite early enhancement. (b) Transitional phase image obtained at 3 minutes depicts hypointense nodule (arrow). (c) Nodule is not clearly delineated on T2-weighted fat-saturated turbo spin-echo image (3413/88). (d) Nodule (arrow) is hypointense on hepatobiliary phase image acquired 20 minutes after injection. (e) Gross pathologic evaluation of resected specimen reveals small, vaguely nodular HCC (arrow). Histologic examination confirmed well-differentiated early HCC. Early HCCs frequently are isoenhancing relative to liver in arterial phase (incomplete neoarterialization) but seen clearly as hypointense nodules in the hepatobiliary phase (underexpression of OATP transporters). Note motion artifact in the arterial phase.
Perhaps the most important benefit of imaging the hepatobiliary phase is that it helps to identify early HCCs (41) (Fig 4). These HCCs have incomplete neoarterialization, frequently are isoenhancing in the vascular phases, and so cannot be reliably detected with extracellular agents. However, since OATP8 expression level decreases during hepatocarcinogenesis prior to complete neoarterialization and to elevation of arterial flow, such HCCs may be visible in the hepatobiliary phase as hypointense nodules (93,94), and some early HCCs are visible only in the hepatobiliary phase (40,95). The differential diagnosis for arterial phase hypoenhancing or isoenhancing nodules with hepatobiliary phase hypointensity includes high-grade dysplastic nodules (88,94), occasional low-grade dysplastic nodules (88), occasional large cirrhotic nodules (96), and nodular areas of fibrosis, so this finding is not specific for HCC, however. A recent retrospective study suggested that diffusion-weighted hyperintensity may be used to discriminate early HCCs from nonmalignant isovascular or hypovascular hepatobiliary phase hypointense nodules (97), but further studies are needed to validate diffusion-weighted imaging for this purpose. Other investigators have shown that if followed, many arterial phase hypoenhancing or isoenhancing nodules with hepatobiliary phase hypointensity will progress to hypervascular HCC over 12 months (33–37,98). The frequency of progression depends on baseline nodule size (36,37,98): Most nodules smaller than 1 cm with this appearance do not progress or progress only slowly (36,37), while nodules 1 cm or larger are more likely to progress. Other suggested predictors of progression include degree of hepatobiliary phase hypointensity (34), diffusion-weighted hyperintensity (34), T2 hyperintensity (33,34), and intralesional fat (33). The optimal management of arterial phase isoenhancing or hypoenhancing nodules with hepatobiliary phase hypointensity has not yet been determined. Depending on their size it may be reasonable to follow them with imaging or to biopsy them (91). They probably should not be ignored, however. In one study of patients who underwent resection for HCC, the presence of such nodules in the unresected liver remnant was a strong predictor of postoperative multicentric recurrence (99).
Although most HCCs are hypointense in the hepatobiliary phase, about 5%–12% HCCs are hyperintense (83,100,101), owing to overexpression of OATP (83,84). As mentioned in part I, the overexpression of OATP in some HCCs may be due to a genomic alteration during hepatocarcinogenesis or a distinct cell of origin (102). Histologically, most such HCCs are moderately differentiated and some are well differentiated (83,101,103). HCCs with isointensity or hyperintensity in the hepatobiliary phase may cause diagnostic confusion and be misinterpreted as nonmalignant. Other hepatobiliary phase features that favor HCC include focal defect(s) in contrast material uptake, presence of a hypointense rim (“capsule”) (Fig 5), and absence of architectural features of focal nodular hyperplasia (central scar and radiating fibrous septa) (100).
Figure 5a:
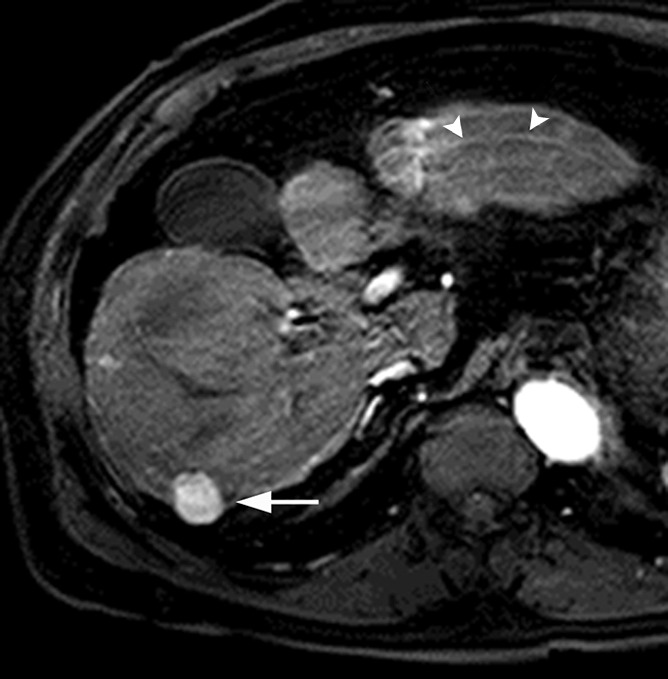
MR images in a 70-year-old man with HCC show hyperintensity in the hepatobiliary phase. (a) Gadoxetate disodium–enhanced T1-weighted 3D GRE image (2.5/0.9; 11° flip angle) in late hepatic arterial phase shows hyperenhancing mass (arrow) in right posterior liver. (b, c) Relative to liver, mass is slightly hyperintense in (b) portal venous phase and mildly hypointense in (c) transitional phase. (d) In the hepatobiliary phase, mass is hyperintense with hypointense rim, likely representing tumor capsule (arrow). Presence of hypointense rim permits confident diagnosis of HCC despite hyperintensity of lesion. Note motion artifact on arterial phase image (arrowheads).
Figure 5b:
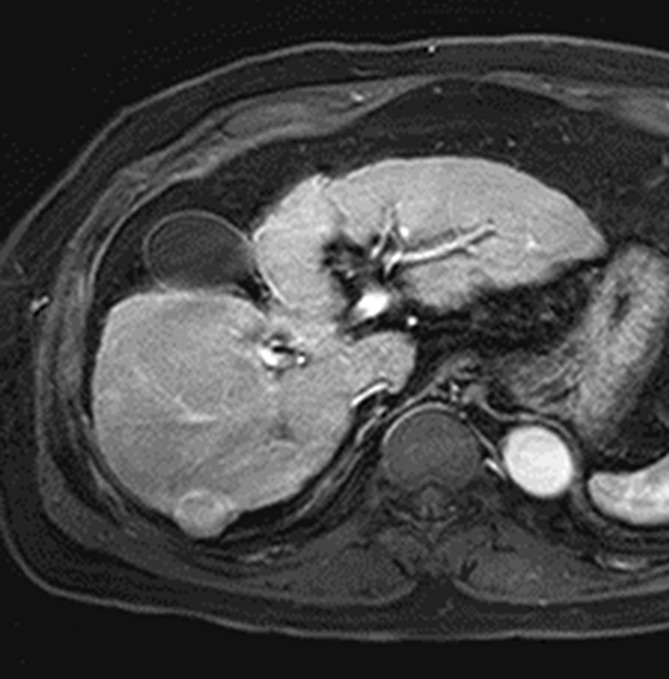
MR images in a 70-year-old man with HCC show hyperintensity in the hepatobiliary phase. (a) Gadoxetate disodium–enhanced T1-weighted 3D GRE image (2.5/0.9; 11° flip angle) in late hepatic arterial phase shows hyperenhancing mass (arrow) in right posterior liver. (b, c) Relative to liver, mass is slightly hyperintense in (b) portal venous phase and mildly hypointense in (c) transitional phase. (d) In the hepatobiliary phase, mass is hyperintense with hypointense rim, likely representing tumor capsule (arrow). Presence of hypointense rim permits confident diagnosis of HCC despite hyperintensity of lesion. Note motion artifact on arterial phase image (arrowheads).
Figure 5c:
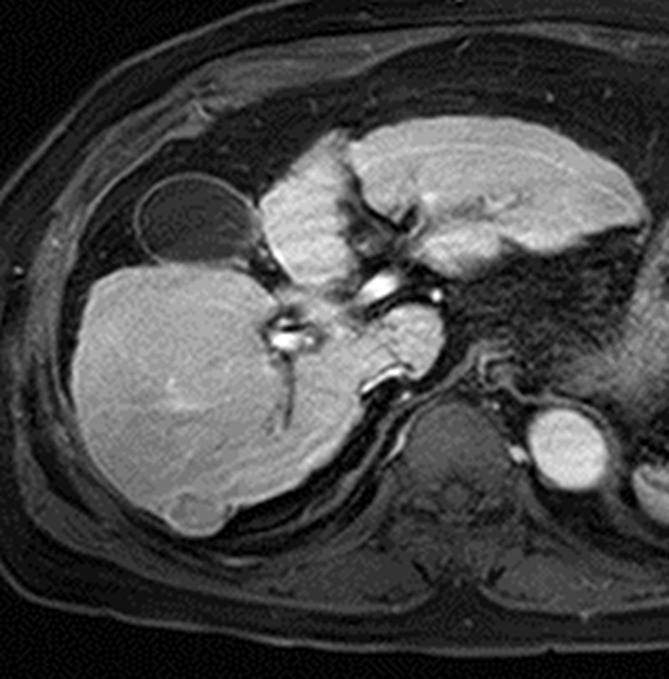
MR images in a 70-year-old man with HCC show hyperintensity in the hepatobiliary phase. (a) Gadoxetate disodium–enhanced T1-weighted 3D GRE image (2.5/0.9; 11° flip angle) in late hepatic arterial phase shows hyperenhancing mass (arrow) in right posterior liver. (b, c) Relative to liver, mass is slightly hyperintense in (b) portal venous phase and mildly hypointense in (c) transitional phase. (d) In the hepatobiliary phase, mass is hyperintense with hypointense rim, likely representing tumor capsule (arrow). Presence of hypointense rim permits confident diagnosis of HCC despite hyperintensity of lesion. Note motion artifact on arterial phase image (arrowheads).
Figure 5d:
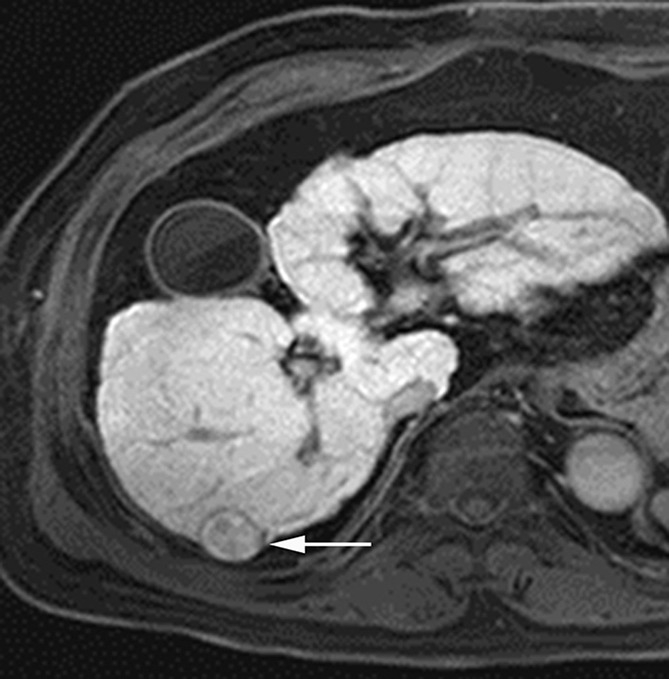
MR images in a 70-year-old man with HCC show hyperintensity in the hepatobiliary phase. (a) Gadoxetate disodium–enhanced T1-weighted 3D GRE image (2.5/0.9; 11° flip angle) in late hepatic arterial phase shows hyperenhancing mass (arrow) in right posterior liver. (b, c) Relative to liver, mass is slightly hyperintense in (b) portal venous phase and mildly hypointense in (c) transitional phase. (d) In the hepatobiliary phase, mass is hyperintense with hypointense rim, likely representing tumor capsule (arrow). Presence of hypointense rim permits confident diagnosis of HCC despite hyperintensity of lesion. Note motion artifact on arterial phase image (arrowheads).
Beyond making a diagnosis of HCC, an emerging role of hepatobiliary agent–enhanced MR imaging is to characterize HCC tumor biology and thereby provide prognostic information. In single-center retrospective studies, some investigators have found that, after excluding HCCs with hepatobiliary phase isoenhancement or hyperenhancement (ie, those with presumed OATP overexpression), the degree of nodule enhancement in the hepatobiliary phase after injection of gadoxetate disodium (93,102) or gadobenate (104) correlates inversely with tumor grade. The inverse correlation has been attributed to the progressive decline in OATP expression during hepatocarcinogenesis and suggests that quantitative analysis of nodule enhancement in the hepatobiliary phase may help to noninvasively predict this important histologic and prognostic feature (105). Other investigators have found that the degree of nodule enhancement does not correlate with tumor grade (69,106), however, or only correlates in the subset of patients with Child-Pugh class A liver disease and relatively preserved hepatocellular function in the background parenchyma (105). Other single-center retrospective studies have found that the degree of nodule enhancement in the hepatobiliary phase after injection of gadoxetate disodium was significantly lower in HCCs with biliary (106) or progenitor cell (107) markers; if validated by independent studies, this would be important, since HCCs with such markers have more aggressive biology and worse outcome clinically (108,109). Compared with hepatobiliary phase hypointense HCCs, HCCs with isointensity or hyperintensity in the hepatobiliary phase (ie, those with preserved OATP expression) may be biologically more indolent, with lower grade (101), less frequent vascular invasion (101,103,110), and longer recurrence-free survival after resection (47,101,110). Other investigators have analyzed tumor morphology in the hepatobiliary phase. In a retrospective study, nonsmooth tumor margin depicted in the hepatobiliary phase after injection of gadoxetate disodium was shown to correlate with microvascular invasion, intrahepatic metastasis, and early recurrence (111). The same finding after injection of gadobenate was found to predict microvascular invasion in univariate but not in multivariate analyses (112). Finally, peritumoral hypointensity seen on gadoxetate disodium–enhanced hepatobiliary phase images was shown in a retrospective study to be a specific, although insensitive, marker for microvascular invasion; the authors attributed the peritumoral hypointensity to altered expression of OATP or MRP2 receptors in the hepatic parenchyma caused by hemodynamic changes associated with tumor obstruction of minute portal veins (113).
The main disadvantage of the hepatobiliary phase alone for HCC diagnosis and staging is its nonspecificity. Any lesion not composed of functioning hepatocytes may appear hypointense, including benign entities (eg, hemangiomas, nodular or confluent areas of fibrosis, some atypical perfusion alterations) and non-HCC malignancies (eg, ICCs, metastases). Also, even though they are composed of nonmalignant hepatocytes, siderotic nodules may appear hypointense due to the T2* shortening effects of iron. Moreover, some lesions with large extracellular spaces (eg, fibrotic tumors including ICCs) may have paradoxical intermediate or mixed signal intensity due to extracellular contrast agent pooling (66), which may be misinterpreted as intracellular uptake. For these reasons, the hepatobiliary phase must be evaluated in conjunction with other phases and sequences—such a T1-weighted dual-echo, T2-weighted, or diffusion-weighted imaging—to differentiate HCC from other entities that may appear hypointense in the hepatobiliary phase. Careful analysis of the hepatobiliary phase enhancement pattern also may be helpful in the differentiation of HCC and ICC: A target appearance in the hepatobiliary phase, characterized by central enhancement with a peripheral hypointense rim, favors the diagnosis of ICC (114). The central enhancement has been attributed to pooling of the contrast agent within the dense fibrous stroma of the ICC tumor core.
In addition to the lack of specificity of the hepatobiliary phase, another challenge is that many conditions reduce contrast between lesions and liver, thereby limiting the efficacy of the hepatobiliary phase for lesion detection and characterization. Patients with severe hepatic dysfunction or cholestasis have limited uptake of hepatobiliary agents (82). Recent studies report that the diagnostic performance of gadoxetate disodium–enhanced MR imaging for HCC deteriorates with increasing severity of cirrhosis (115) and may be modest in patients with advanced cirrhosis on the liver transplant list (116). In addition, both iron overload and marked fibrosis may reduce hepatobiliary phase enhancement of the liver or they may give the parenchyma a heterogeneous appearance, factors that potentially lower the detectability of HCC. Finally, infiltrative HCC may be difficult to identify due to ill-defined margins and poor contrast between tumor and background liver. The optimal strategies for addressing these limitations have not yet been identified.
A potential pitfall unique to gadoxetate disodium is that this agent does not provide a conventional delayed vascular phase and instead provides a transitional phase; this phase overlaps with the portal venous phase and the hepatobiliary phase, lasts for several minutes, and represents a transition from extracellular-dominant to intracellular-dominant enhancement (117). The interpretation of signal intensity in the transitional phase is not yet well understood, and it possible that hypointensity relative to liver in the transitional phase may reflect hyperenhancement of liver rather than de-enhancement of a mass. Most nodules with arterial phase hyperintensity, portal venous phase isointensity, and transitional phase hypointensity probably are HCC, but the specificity of this pattern for HCC has not been established. Caution should be used in the interpretation of such nodules as the differential diagnosis may include atypical hemangioma and ICC in addition to HCC. For definitive diagnosis of HCC, therefore, washout appearance probably should be evaluated only in the portal venous phase after administration of gadoxetate disodium. Another challenge associated with the transitional phase is that the relatively high enhancement of the background parenchyma may obscure “capsular” enhancement and reduce the frequency or confidence with which this important feature can be perceived.
Other limitations unique to gadoxetate disodium–enhanced MR imaging include relatively weak arterial phase hyperenhancement (if the agent is used at its approved dose of 0.025 mmol gadolinium per kilogram of body weight) and relatively high frequency of arterial phase artifacts (mainly due to transient dyspnea associated with this agent [118]). The impact of these factors on diagnostic performance has not been determined and merits further study.
The accuracy of gadoxetate disodium–enhanced MR imaging for diagnosis of macrovascular invasion has not been reported in the published literature to our knowledge but is expected to be lower than that of MR imaging with extracellular agents. The reason is that gadoxetate disodium tends to generate relatively weak contrast between vessels and surrounding liver, attributable in part to its low dose and in part to strong parenchymal enhancement.
Ancillary Imaging Features for Diagnosis of HCC
As discussed in the previous two sections, the CT and MR imaging diagnosis of HCC is based mainly on assessment of vascularity, capsule appearance, and, if hepatobiliary agents are administered, signal intensity in the hepatobiliary phase. MR imaging and, to a lesser extent, CT also permit assessment of ancillary imaging features. While these ancillary imaging features usually do not permit definitive diagnosis of HCC, they provide incremental information that helps to characterize nodules and may improve the sensitivity for HCC. As summarized in Table 3 and discussed below, these ancillary features can be divided into those that favor the diagnosis of HCC specifically (intralesional fat, corona enhancement, nodule-in-nodule architecture, and mosaic architecture) and those that favor the diagnosis of malignancy but are not specific for HCC (mild-moderate T2 hyperintensity, restricted diffusion, and, if other features confirm a solid mass, lesional iron sparing).
Table 3.
Ancillary Imaging Features of HCC

Note.—The information in this table is intended for application in patients at risk for development of HCC due to cirrhosis, chronic viral hepatitis, or other factors. It is not intended for application in the general population.
Ancillary Features That Favor the Diagnosis of HCC
Intralesional fat refers to the presence of lipid within a mass in higher concentration than in the background liver (12). This feature can be detected at MR imaging by observing signal loss on out-of-phase compared with in-phase T1-weighted GRE images (12,45) (Fig 6). Although precontrast CT attenuation values correlate with fat content in HCC nodules (119), the detection of intralesional fat can be problematic at CT, because many factors other than fat affect the attenuation. Intralesional fat is frequently observed histologically in early HCC (41) and its detection at imaging favors the diagnosis of HCC. This imaging feature does not establish the diagnosis of HCC, however, as the differential diagnosis includes high-grade dysplastic nodule and occasionally low-grade dysplastic nodule (120). Nevertheless, in a patient with cirrhosis or other risk factor for HCC, the imaging-based identification of intralesional fat in a solid nodule raises concern for malignancy or premalignancy. Importantly, intralesional fat is extremely rare in non-HCC hepatic malignancies; thus, the detection of fat may help to exclude ICC in problematic cases. Despite these potential benefits, the incremental value of intralesional fat for the diagnosis of HCC has not yet been determined. In two separate multivariate analyses of MR imaging using extracellular agents, intralesional fat was shown to be noncontributory for the imaging-based diagnosis of HCC, in part because the presence of fat coincided with other more discriminatory imaging features (43,45). Intralesional fat may have value as a prognostic feature, however. Since intralesional fat is characteristic of early but—with the exception of the steatohepatitic variant of HCC (121)—not progressed HCC (41), HCCs with this feature may have more favorable prognosis, with longer time to progression and less risk of developing metastases, than non–fat-containing HCCs (122). Steatohepatitic HCC is a newly described variant of HCC with histologic features that resemble those of steatohepatitis in nonneoplastic liver (eg, steatosis, inflammation, evidence of hepatocyte injury, and pericellular fibrosis) (123). Emerging data suggest this variant occurs most commonly in persons with underlying steatohepatitis. Although confirmatory studies are needed, it appears that steatohepatitic HCCs may have pronounced intralesional fat even if they are progressed cancers with advanced tumor grade (123).
Figure 6a:
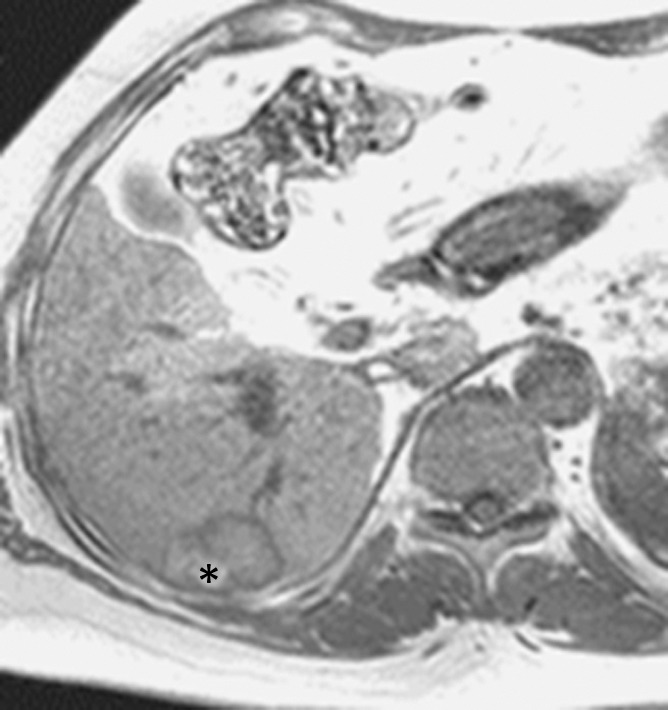
MR images in a 66-year-old woman with fat-containing HCC and hepatitis B–related cirrhosis. (a, b) Axial dual-echo GRE images show mass in segment VI of liver. Signal loss of mass on (b) out-of-phase compared with (a) in-phase image indicates intralesional fat. Note also nodule-in-nodule architecture on in-phase image with hyperintense inner nodule (*). (c) Mass shows heterogeneous predominantly peripheral enhancement in late hepatic arterial phase of gadoxetate disodium–enhanced T1-weighted 3D GRE image (3.0/1.4; 10° flip angle). (d) Mass is hypointense relative to liver in the portal venous phase. Surgical specimen confirmed moderately differentiated (Edmondson grade II) HCC with 80% fatty change. Although peripheral rim enhancement is somewhat unusual for HCC and can be observed in ICC and metastasis from extrahepatic primary, presence of intralesional fat permits confident radiologic diagnosis of HCC.
Figure 6b:
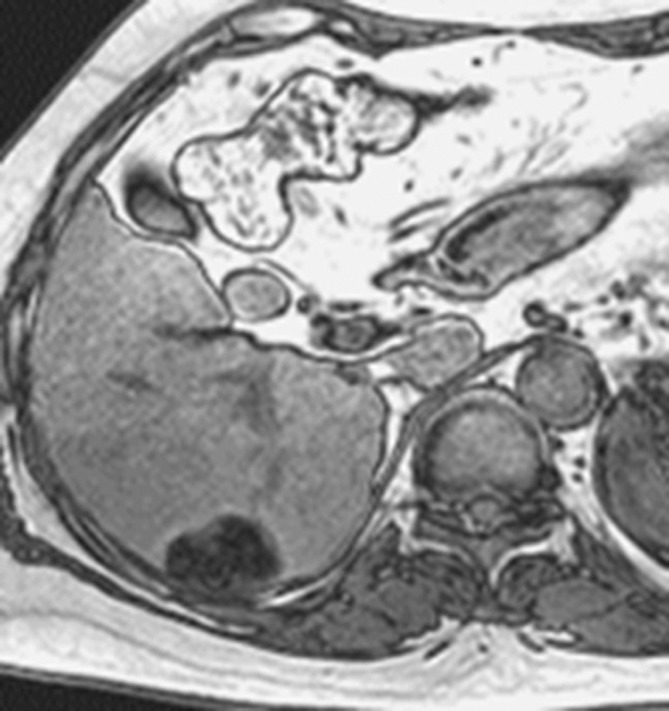
MR images in a 66-year-old woman with fat-containing HCC and hepatitis B–related cirrhosis. (a, b) Axial dual-echo GRE images show mass in segment VI of liver. Signal loss of mass on (b) out-of-phase compared with (a) in-phase image indicates intralesional fat. Note also nodule-in-nodule architecture on in-phase image with hyperintense inner nodule (*). (c) Mass shows heterogeneous predominantly peripheral enhancement in late hepatic arterial phase of gadoxetate disodium–enhanced T1-weighted 3D GRE image (3.0/1.4; 10° flip angle). (d) Mass is hypointense relative to liver in the portal venous phase. Surgical specimen confirmed moderately differentiated (Edmondson grade II) HCC with 80% fatty change. Although peripheral rim enhancement is somewhat unusual for HCC and can be observed in ICC and metastasis from extrahepatic primary, presence of intralesional fat permits confident radiologic diagnosis of HCC.
Figure 6c:
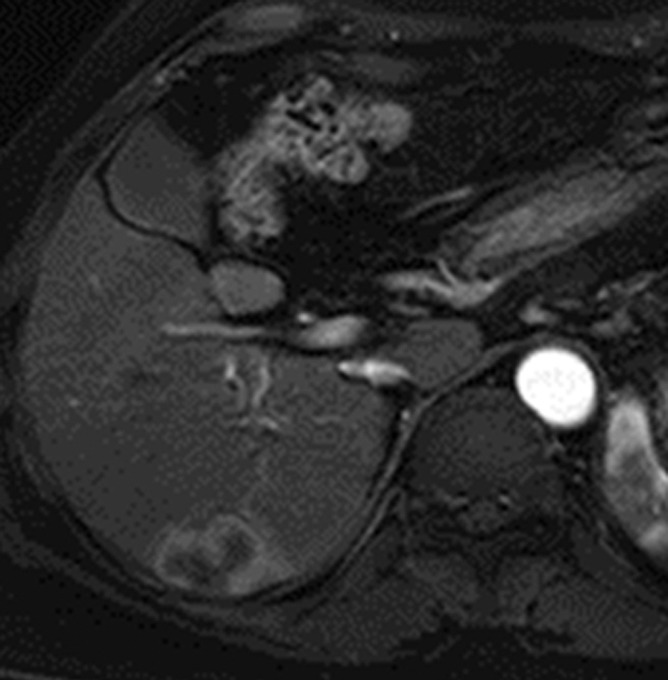
MR images in a 66-year-old woman with fat-containing HCC and hepatitis B–related cirrhosis. (a, b) Axial dual-echo GRE images show mass in segment VI of liver. Signal loss of mass on (b) out-of-phase compared with (a) in-phase image indicates intralesional fat. Note also nodule-in-nodule architecture on in-phase image with hyperintense inner nodule (*). (c) Mass shows heterogeneous predominantly peripheral enhancement in late hepatic arterial phase of gadoxetate disodium–enhanced T1-weighted 3D GRE image (3.0/1.4; 10° flip angle). (d) Mass is hypointense relative to liver in the portal venous phase. Surgical specimen confirmed moderately differentiated (Edmondson grade II) HCC with 80% fatty change. Although peripheral rim enhancement is somewhat unusual for HCC and can be observed in ICC and metastasis from extrahepatic primary, presence of intralesional fat permits confident radiologic diagnosis of HCC.
Figure 6d:
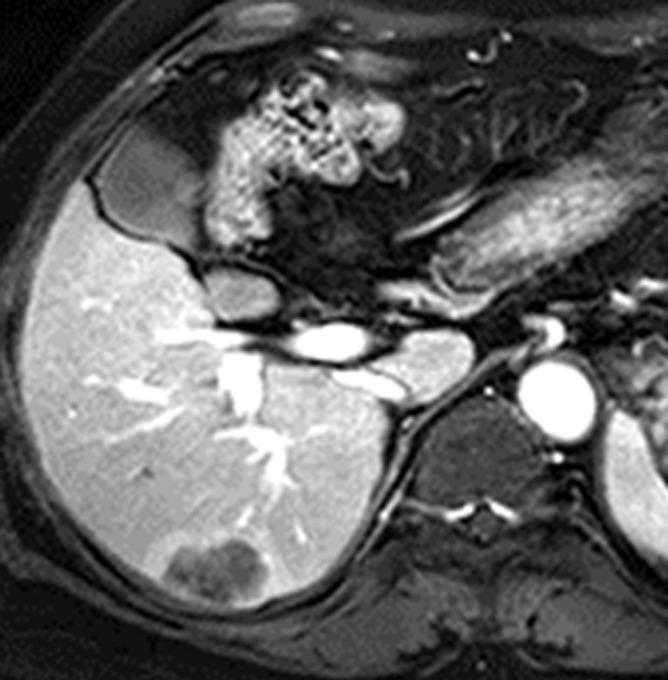
MR images in a 66-year-old woman with fat-containing HCC and hepatitis B–related cirrhosis. (a, b) Axial dual-echo GRE images show mass in segment VI of liver. Signal loss of mass on (b) out-of-phase compared with (a) in-phase image indicates intralesional fat. Note also nodule-in-nodule architecture on in-phase image with hyperintense inner nodule (*). (c) Mass shows heterogeneous predominantly peripheral enhancement in late hepatic arterial phase of gadoxetate disodium–enhanced T1-weighted 3D GRE image (3.0/1.4; 10° flip angle). (d) Mass is hypointense relative to liver in the portal venous phase. Surgical specimen confirmed moderately differentiated (Edmondson grade II) HCC with 80% fatty change. Although peripheral rim enhancement is somewhat unusual for HCC and can be observed in ICC and metastasis from extrahepatic primary, presence of intralesional fat permits confident radiologic diagnosis of HCC.
Corona enhancement is a feature of hypervascular, progressed HCC and refers to enhancement of the venous drainage area in the peritumoral parenchyma (124,125). As discussed in part I, venous drainage evolves during multistep hepatocarcinogenesis from hepatic veins (cirrhotic nodules, dysplastic nodules, and early HCCs) to sinusoids (unencapsulated progressed HCCs) to portal venules (encapsulated progressed HCCs). The sinusoids and portal venules draining progressed HCCs communicate with the sinusoids in the perinodular hepatic parenchyma; these drainage vessels carry contrast material from the tumor into the surrounding sinusoids, resulting in corona-shaped perinodular enhancement a few seconds after the tumor itself begins to enhance. Corona enhancement initially was described at CT during hepatic arteriography (126) but it also can be seen at multiphasic CT or MR imaging (127). It manifests as a transient zone or rim (“corona”) of enhancement around a progressed, hypervascular HCC in the late arterial phase or early portal venous phase, with fading to isoenhancement at subsequent phases (Fig 7). Although corona enhancement begins a few seconds after tumor enhancement, corona and tumor enhancement may appear to overlap if only a single acquisition is obtained during the arterial phase, and the corona may blend into the tumor. This overlap and blending may cause the tumor to appear larger than it really is at conventional CT or MR imaging (128) and also makes recognition of corona enhancement difficult; some investigators have proposed the use of high-temporal-resolution multiarterial phasic imaging from early to late hepatic arterial phase to facilitate its recognition (127). Corona enhancement may have variable thickness and uniformity, and it may be circumferential or eccentric. Its presence helps to differentiate small hypervascular HCCs from pseudolesions, such as arterioportal shunts, which are not associated with this feature (120). The sensitivity and specificity at multiphasic CT and MR imaging of corona enhancement for the diagnosis of progressed HCC has not been studied prospectively, however. Corona enhancement is not a feature of early HCC, which is drained by hepatic veins, and so does not help in the diagnosis of early HCC (128).
Figure 7a:
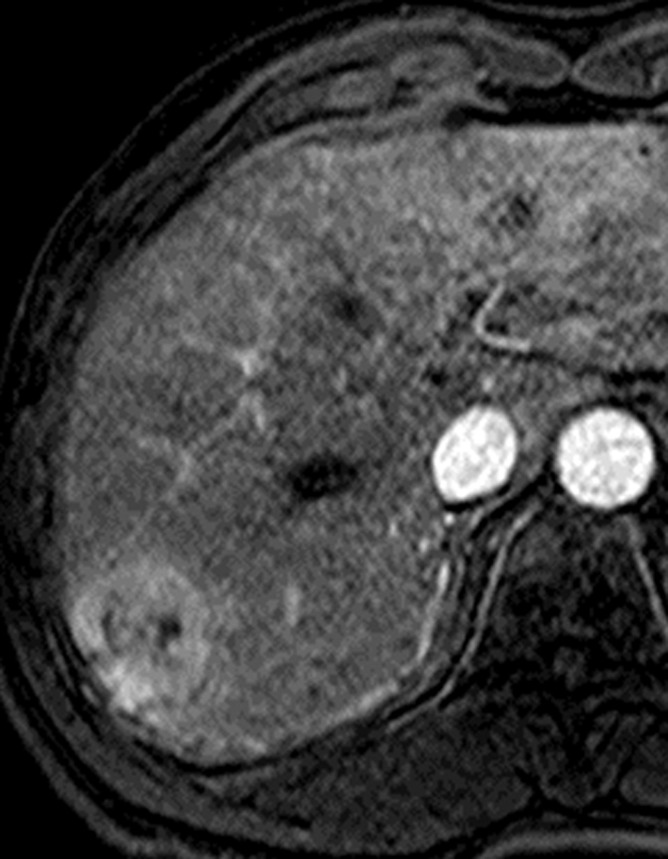
MR images in a 66-year-old man with HCC show corona enhancement and capsule appearance. T1-weighted 3D GRE images with fat suppression (3.2/1.6; 10° flip angle) obtained in (a) early and (b) late hepatic arterial phase after administration of gadolinium-based contrast agent show hyperenhancing mass in segment VII. Note partially circumferential enhancement (arrowheads) of variable thickness in the liver parenchyma around the mass in the late hepatic arterial phase. The enhancement of the perilesional parenchyma (arrowheads) fades in (c) the portal venous phase and is resolved by (d) the 3-minute delayed phase. The transient enhancement of the perilesional parenchyma is known as corona enhancement; this is thought to represent the area of liver parenchyma receiving venous drainage from progressed HCC and to be a frequent site of satellite metastases. Note the mass also has capsule appearance (arrow, d); as opposed to corona enhancement, which fades in the venous phases, capsule appearance manifests as progressively enhancing rim.
Figure 7b:
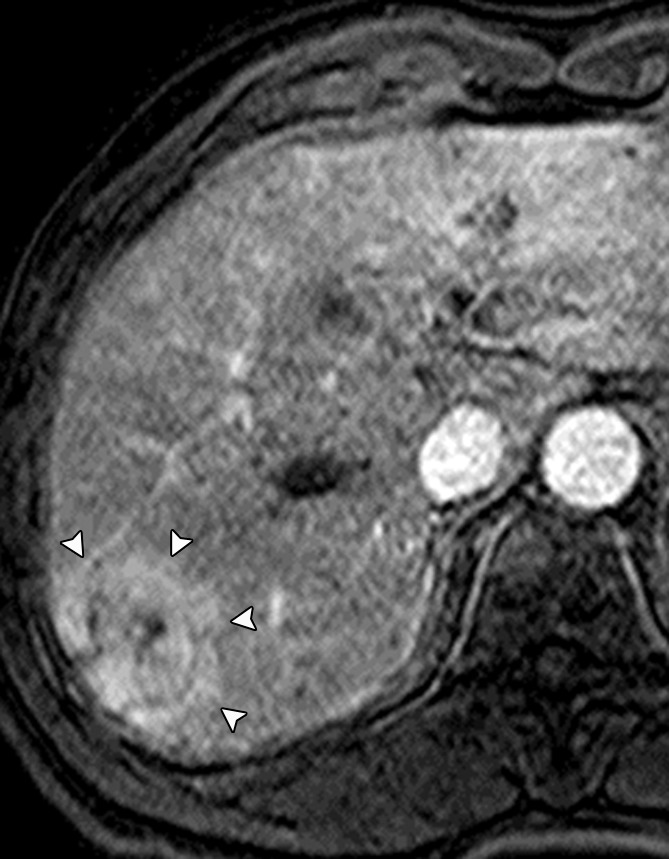
MR images in a 66-year-old man with HCC show corona enhancement and capsule appearance. T1-weighted 3D GRE images with fat suppression (3.2/1.6; 10° flip angle) obtained in (a) early and (b) late hepatic arterial phase after administration of gadolinium-based contrast agent show hyperenhancing mass in segment VII. Note partially circumferential enhancement (arrowheads) of variable thickness in the liver parenchyma around the mass in the late hepatic arterial phase. The enhancement of the perilesional parenchyma (arrowheads) fades in (c) the portal venous phase and is resolved by (d) the 3-minute delayed phase. The transient enhancement of the perilesional parenchyma is known as corona enhancement; this is thought to represent the area of liver parenchyma receiving venous drainage from progressed HCC and to be a frequent site of satellite metastases. Note the mass also has capsule appearance (arrow, d); as opposed to corona enhancement, which fades in the venous phases, capsule appearance manifests as progressively enhancing rim.
Figure 7c:
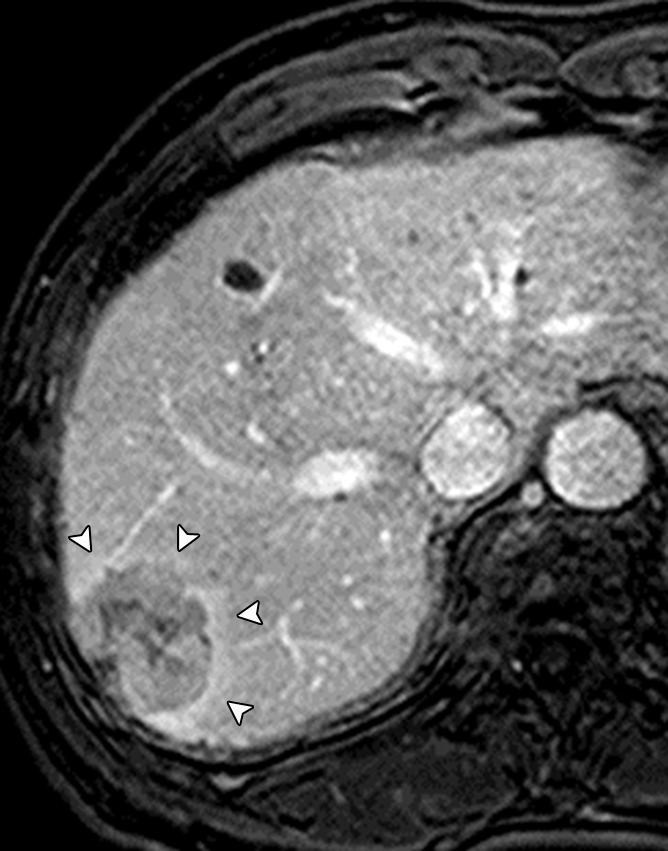
MR images in a 66-year-old man with HCC show corona enhancement and capsule appearance. T1-weighted 3D GRE images with fat suppression (3.2/1.6; 10° flip angle) obtained in (a) early and (b) late hepatic arterial phase after administration of gadolinium-based contrast agent show hyperenhancing mass in segment VII. Note partially circumferential enhancement (arrowheads) of variable thickness in the liver parenchyma around the mass in the late hepatic arterial phase. The enhancement of the perilesional parenchyma (arrowheads) fades in (c) the portal venous phase and is resolved by (d) the 3-minute delayed phase. The transient enhancement of the perilesional parenchyma is known as corona enhancement; this is thought to represent the area of liver parenchyma receiving venous drainage from progressed HCC and to be a frequent site of satellite metastases. Note the mass also has capsule appearance (arrow, d); as opposed to corona enhancement, which fades in the venous phases, capsule appearance manifests as progressively enhancing rim.
Figure 7d:
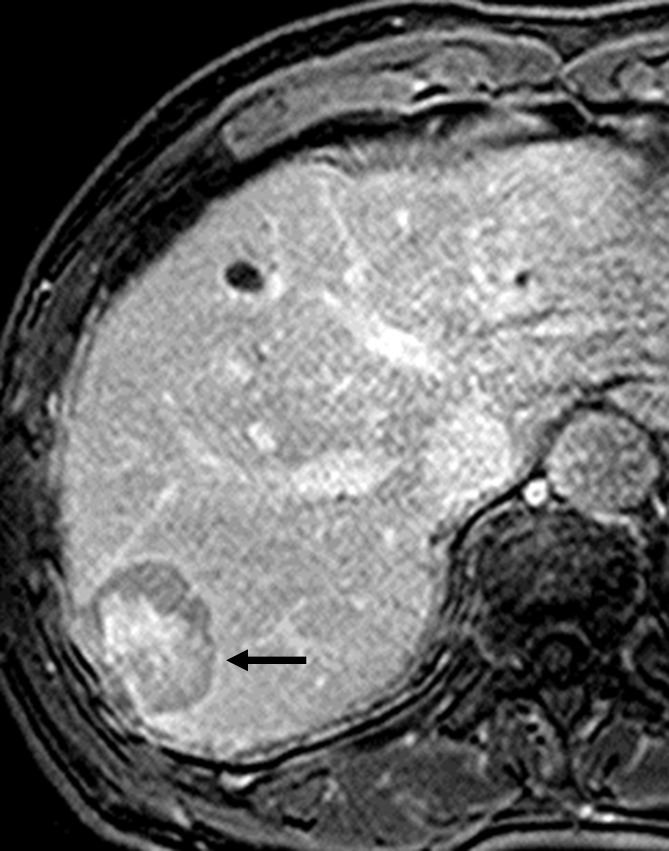
MR images in a 66-year-old man with HCC show corona enhancement and capsule appearance. T1-weighted 3D GRE images with fat suppression (3.2/1.6; 10° flip angle) obtained in (a) early and (b) late hepatic arterial phase after administration of gadolinium-based contrast agent show hyperenhancing mass in segment VII. Note partially circumferential enhancement (arrowheads) of variable thickness in the liver parenchyma around the mass in the late hepatic arterial phase. The enhancement of the perilesional parenchyma (arrowheads) fades in (c) the portal venous phase and is resolved by (d) the 3-minute delayed phase. The transient enhancement of the perilesional parenchyma is known as corona enhancement; this is thought to represent the area of liver parenchyma receiving venous drainage from progressed HCC and to be a frequent site of satellite metastases. Note the mass also has capsule appearance (arrow, d); as opposed to corona enhancement, which fades in the venous phases, capsule appearance manifests as progressively enhancing rim.
Beyond its potential contribution to the diagnosis of progressed, hypervascular HCC, corona enhancement may convey prognostic information. Single-center retrospective studies have suggested that large (129) or irregular and/or distorted (112) corona enhancement predicts microvascular invasion. Also, metastatic satellite nodules and local recurrences after resection or ablation frequently develop in the corona enhancement areas (63). To more effectively treat such metastases and reduce the risk of recurrence, some authors have recommended that the corona enhancement areas be included within the surgical resection margin or ablation zone (63,125).
Nodule-in-nodule architecture refers to the presence of a nodule within a larger nodule or mass (12). This imaging appearance corresponds to the nodule-in-nodule growth pattern observed at histologic evaluation (130) and suggests the emergence of a progressed HCC within a dysplastic nodule or early HCC (131). The subnodule, corresponding to the progressed HCC, typically shows arterial phase hyperenhancement as well as hyperintensity on T2-weighted images (41) and, if a hepatobiliary agent is given, hypointensity in the hepatobiliary phase (Fig 8). The surrounding parent nodule, corresponding to more well-differentiated tissue, typically is T1 hyperintense, T2 hypointense (132), and arterial phase hypo- or isoenhancing (85). The parent nodule may be fatty or iron rich (siderotic); the inner nodule usually contains less fat and, reflecting the iron “resistance” of neoplastic hepatocytes, less iron (133), While nodule-in-nodule configuration is characteristic of HCC, it is seen infrequently at CT and MR imaging (131), and the sensitivity and specificity of this feature for the diagnosis of HCC has not been established.
Figure 8a:
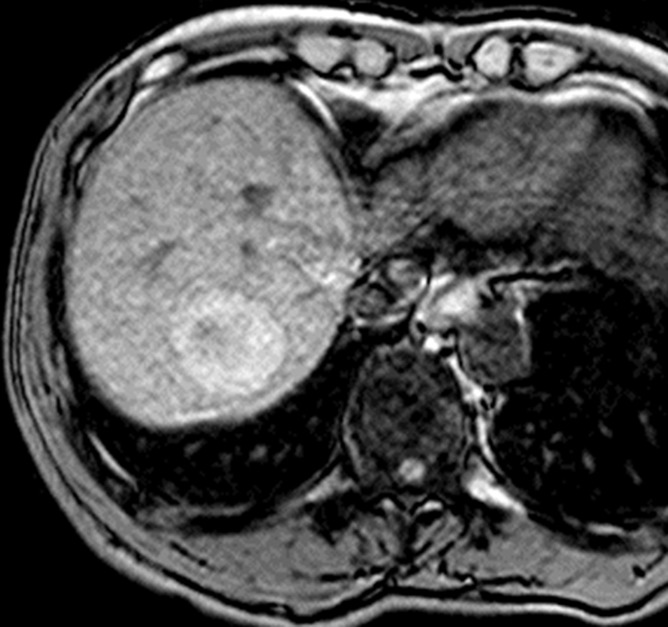
MR images in a 68-year-old man with HCC show nodule-in-nodule architecture. (a) Axial opposed-phase T1-weighted fast field echo image (181.3/2.3; 80° flip angle) and (b) precontrast T1-weighted 3D GRE image show hypointense inner nodule (1.5 cm) within hyperintense outer nodule (3.7 cm), consistent with nodule-in-nodule architecture. (c) Gadolinium-enhanced 3D GRE image in late hepatic arterial phase shows arterial hyperenhancement of inner nodule (arrow); outer nodule is isointense to liver. (d) Inner nodule shows washout appearance on 3-minute delayed phase image and, except for a small central area, is hypointense relative to outer nodule and surrounding liver; outer nodule remains isointense and is imperceptible on this image. Arterial phase hyperenhancement and venous phase washout appearance of inner nodule suggest progressed HCC arising within more well-differentiated parent nodule.
Figure 8b:
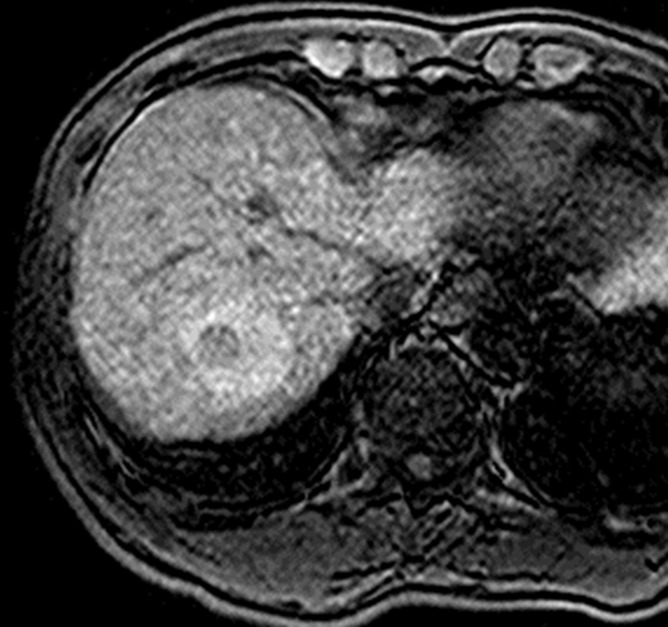
MR images in a 68-year-old man with HCC show nodule-in-nodule architecture. (a) Axial opposed-phase T1-weighted fast field echo image (181.3/2.3; 80° flip angle) and (b) precontrast T1-weighted 3D GRE image show hypointense inner nodule (1.5 cm) within hyperintense outer nodule (3.7 cm), consistent with nodule-in-nodule architecture. (c) Gadolinium-enhanced 3D GRE image in late hepatic arterial phase shows arterial hyperenhancement of inner nodule (arrow); outer nodule is isointense to liver. (d) Inner nodule shows washout appearance on 3-minute delayed phase image and, except for a small central area, is hypointense relative to outer nodule and surrounding liver; outer nodule remains isointense and is imperceptible on this image. Arterial phase hyperenhancement and venous phase washout appearance of inner nodule suggest progressed HCC arising within more well-differentiated parent nodule.
Figure 8c:
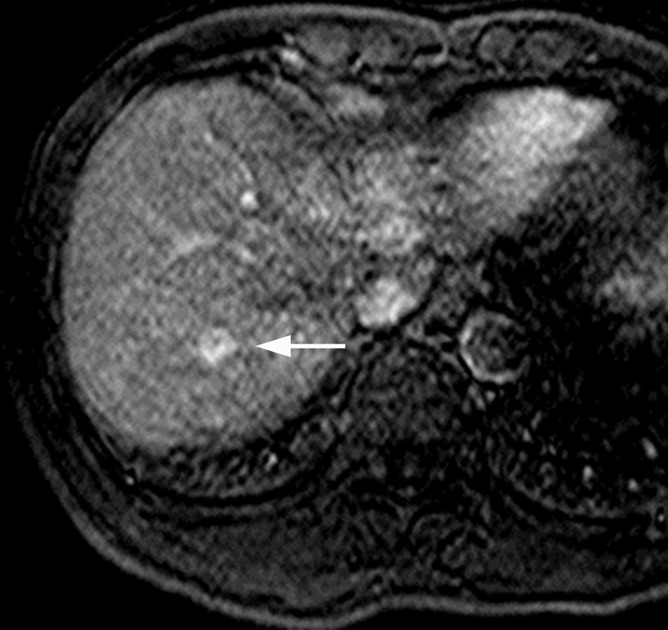
MR images in a 68-year-old man with HCC show nodule-in-nodule architecture. (a) Axial opposed-phase T1-weighted fast field echo image (181.3/2.3; 80° flip angle) and (b) precontrast T1-weighted 3D GRE image show hypointense inner nodule (1.5 cm) within hyperintense outer nodule (3.7 cm), consistent with nodule-in-nodule architecture. (c) Gadolinium-enhanced 3D GRE image in late hepatic arterial phase shows arterial hyperenhancement of inner nodule (arrow); outer nodule is isointense to liver. (d) Inner nodule shows washout appearance on 3-minute delayed phase image and, except for a small central area, is hypointense relative to outer nodule and surrounding liver; outer nodule remains isointense and is imperceptible on this image. Arterial phase hyperenhancement and venous phase washout appearance of inner nodule suggest progressed HCC arising within more well-differentiated parent nodule.
Figure 8d:
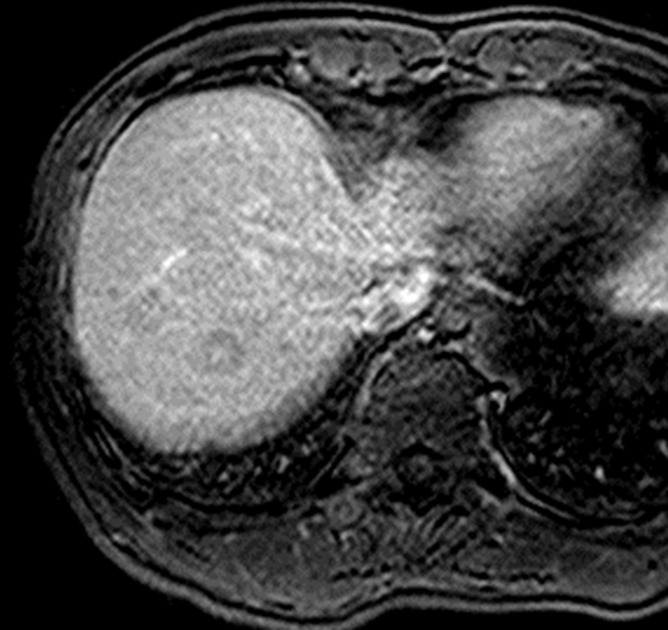
MR images in a 68-year-old man with HCC show nodule-in-nodule architecture. (a) Axial opposed-phase T1-weighted fast field echo image (181.3/2.3; 80° flip angle) and (b) precontrast T1-weighted 3D GRE image show hypointense inner nodule (1.5 cm) within hyperintense outer nodule (3.7 cm), consistent with nodule-in-nodule architecture. (c) Gadolinium-enhanced 3D GRE image in late hepatic arterial phase shows arterial hyperenhancement of inner nodule (arrow); outer nodule is isointense to liver. (d) Inner nodule shows washout appearance on 3-minute delayed phase image and, except for a small central area, is hypointense relative to outer nodule and surrounding liver; outer nodule remains isointense and is imperceptible on this image. Arterial phase hyperenhancement and venous phase washout appearance of inner nodule suggest progressed HCC arising within more well-differentiated parent nodule.
Mosaic architecture refers to the presence within a mass of randomly distributed internal nodules or compartments differing in enhancement (in the dynamic vascular phases or, if a hepatobiliary agent is administered, in the hepatobiliary phase), attenuation, intensity, shape, and size and often separated by fibrous septations (12,134) (Fig 1). The appearance is characteristic of and frequently observed in large HCCs (135) and reflects the mosaic configuration observed at pathologic examination (132). Although heterogeneity is a common characteristic of many liver lesions, mosaic architecture is unusual in tumors other than HCC, and so this feature helps in the differentiation of HCC from ICC. As mosaic architecture is uncommon in small HCCs (46,131), the incremental value of this feature for the diagnosis of small HCC is uncertain.
Ancillary Features That Favor the Diagnosis of Malignancy but Are Not Specific for HCC
Mild-moderate T2 hyperintensity refers to signal intensity on T2-weighted images that unequivocally is greater than that of background liver but less than that of bile ducts or other simple–fluid-filled structures (12). This feature is typical of HCC and has been described in 77% of HCCs larger than 3 cm (136). By comparison, cirrhotic nodules and dysplastic nodules characteristically are isointense or hypointense on T2-weighted images and rarely show mild-moderate T2 hyperintensity (137). Thus, mild-moderate hyperintensity in a nodule in a cirrhotic liver on T2-weighted images is highly suggestive of malignancy (137). However, this feature is not specific for HCC per se, as ICCs and metastases to the liver typically are T2 hyperintense as well. Thus, the presence of mild-moderate T2 hyperintensity cannot be used to establish the diagnosis of HCC in the absence of HCC-specific features. Moreover, mild-moderate T2 hyperintensity lacks sensitivity for HCC diagnosis. Many well-differentiated HCCs and some small moderately differentiated HCCs are T2 isointense or hypointense (136,138), while those with mild-moderate T2 hyperintensity may be obscured on T2-weighted images by parenchymal fibrosis (132). Finally, the incremental value of mild-moderate T2 hyperintensity for the diagnosis of HCC is modest, as most HCCs with this feature are progressed lesions that can be detected based on vascular or hepatobiliary phase imaging features. As a corollary, mild-moderate T2 hyperintensity suggests advanced tumor grade and so may have prognostic significance (136,139).
As opposed to mild-moderate T2 hyperintensity, diffuse marked T2 hyperintensity favors a benign etiology (12), as this signal pattern is characteristic of cysts and hemangiomas but not HCC. Similarly, although mild T2 hypointensity is nonspecific—with the differential diagnosis including dysplastic nodules and some cirrhotic nodules as well as HCCs—marked uniform hypointensity on T2-weighted images indicates the presence of iron, which as discussed in part I suggests a nonmalignant etiology (12).
Restricted diffusion refers to the presence of higher signal intensity than background liver, not attributable solely to T2 shine-through, on diffusion-weighted images acquired with at least moderate diffusion weighting (eg, b value ≥ 400 sec/mm2) (12). If an apparent diffusion coefficient (ADC) map is generated, the ADC of the lesion should be similar to or lower than that of liver by visual estimation (Fig 9). For masses that cannot be categorized as definite HCC based on other features, the presence of diffusion restriction favors the diagnosis of malignancy and helps differentiate HCC from dysplastic nodule (140). The underlying basis for diffusion restriction in malignant tumors is not completely understood; however, hypercellularity is assumed to be the main cause (141). Restricted diffusion also helps differentiate small hypervascular HCCs from hypervascular pseudolesions, which usually are isointense on diffusion-weighted images (142). Diffusion-weighted imaging also may increase the conspicuity of HCC nodules that on images from other sequences have low lesion-liver contrast or are obscured by high-signal-intensity vessels. Many but not all (143) studies have shown that the addition of diffusion-weighted imaging to MR imaging examinations incrementally increases the detection rate of HCC (32,142) and intrahepatic HCC metastases (144). The sensitivity of diffusion-weighted imaging for HCC detection is low, however. Many HCCs, particularly those with well-differentiated components, have no or only minimal diffusion restriction (143). Moreover, the background fibrotic/cirrhotic parenchyma frequently has reduced diffusivity compared with normal liver, thereby reducing lesion-liver contrast on diffusion-weighted images (32,141). Thus, in a mass with other imaging features of HCC, absence of diffusion restriction should not downgrade the suspicion level for HCC (132). Another challenge is that restricted diffusion is not specific for HCC as it may be observed in ICCs and other non-HCC malignancies (145). Similarly, small HCCs and hemangiomas may overlap in diffusion-weighted signal intensity (146). Thus diffusion-weighted images need to be interpreted in conjunction with other images. Unfortunately, diffusion-weighted images are prone to spatial distortion and other artifacts, which complicates the co-localization and interpretation of small nodules.
Figure 9a:
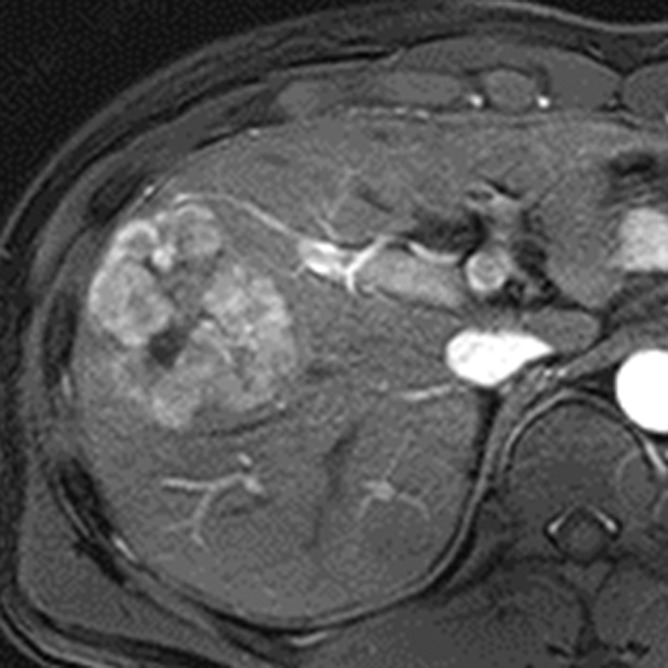
MR images in a 46-year-old man with hepatitis B–related cirrhosis and HCC show restricted diffusion. (a) Gadoxetate disodium–enhanced T1-weighted 3D GRE image (3.0/1.4; 10° flip angle) acquired in late hepatic arterial phase shows large heterogeneous mass with mosaic architecture measuring 6 cm in right lobe of liver. (b) Mass is moderately hyperintense on T2-weighted turbo spin-echo image (951/80). (c) Diffusion-weighted image (b = 800 sec/mm2) shows hyperintensity, suggesting restricted diffusion, confirmed on (d) ADC map. Estimated ADC is 1010 mm2/sec. Restricted diffusion is highly suggestive of malignancy but not specific for HCC. Mosaic architecture in arterial phase and washout appearance in venous phases (not shown) permit specific diagnosis of HCC. Note central necrotic component within tumor (*). Necrotic component is markedly hyperintense on T2-weighted image (b), and has relatively unrestricted diffusion (d).
Figure 9b:
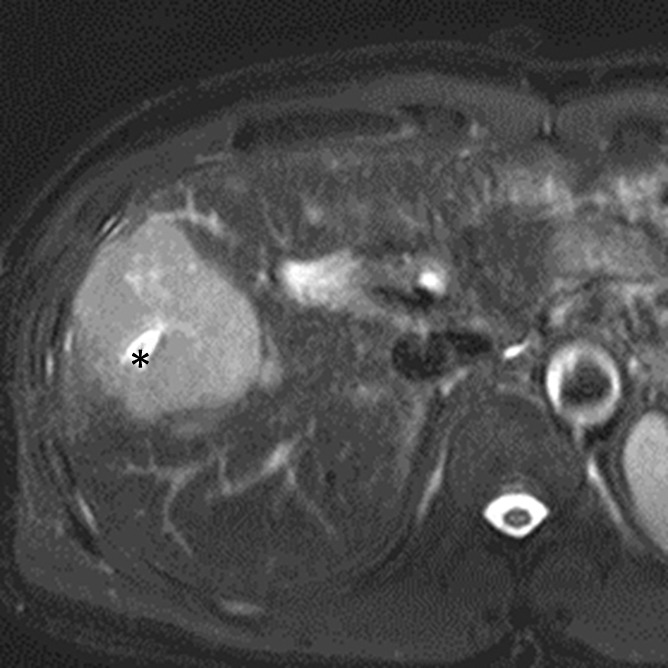
MR images in a 46-year-old man with hepatitis B–related cirrhosis and HCC show restricted diffusion. (a) Gadoxetate disodium–enhanced T1-weighted 3D GRE image (3.0/1.4; 10° flip angle) acquired in late hepatic arterial phase shows large heterogeneous mass with mosaic architecture measuring 6 cm in right lobe of liver. (b) Mass is moderately hyperintense on T2-weighted turbo spin-echo image (951/80). (c) Diffusion-weighted image (b = 800 sec/mm2) shows hyperintensity, suggesting restricted diffusion, confirmed on (d) ADC map. Estimated ADC is 1010 mm2/sec. Restricted diffusion is highly suggestive of malignancy but not specific for HCC. Mosaic architecture in arterial phase and washout appearance in venous phases (not shown) permit specific diagnosis of HCC. Note central necrotic component within tumor (*). Necrotic component is markedly hyperintense on T2-weighted image (b), and has relatively unrestricted diffusion (d).
Figure 9c:
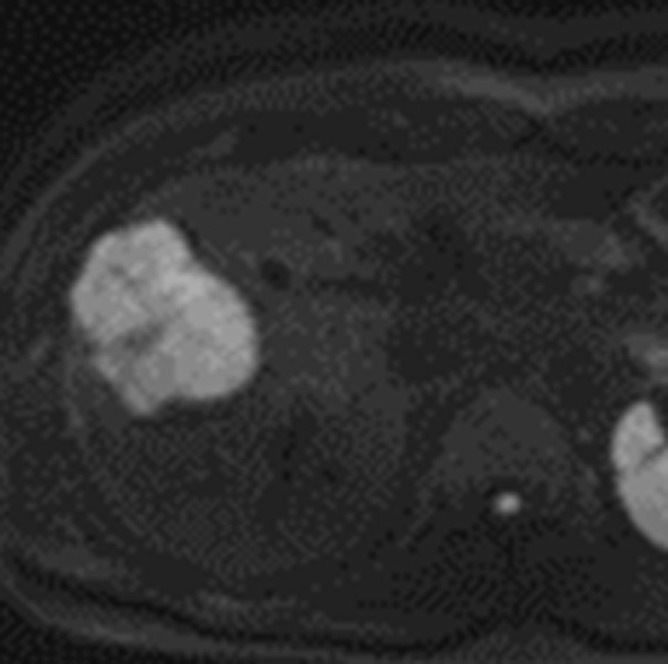
MR images in a 46-year-old man with hepatitis B–related cirrhosis and HCC show restricted diffusion. (a) Gadoxetate disodium–enhanced T1-weighted 3D GRE image (3.0/1.4; 10° flip angle) acquired in late hepatic arterial phase shows large heterogeneous mass with mosaic architecture measuring 6 cm in right lobe of liver. (b) Mass is moderately hyperintense on T2-weighted turbo spin-echo image (951/80). (c) Diffusion-weighted image (b = 800 sec/mm2) shows hyperintensity, suggesting restricted diffusion, confirmed on (d) ADC map. Estimated ADC is 1010 mm2/sec. Restricted diffusion is highly suggestive of malignancy but not specific for HCC. Mosaic architecture in arterial phase and washout appearance in venous phases (not shown) permit specific diagnosis of HCC. Note central necrotic component within tumor (*). Necrotic component is markedly hyperintense on T2-weighted image (b), and has relatively unrestricted diffusion (d).
Figure 9d:
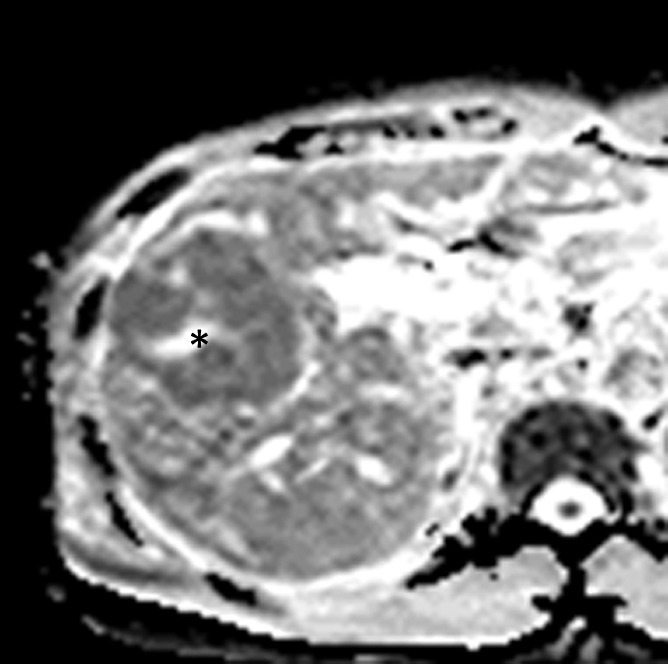
MR images in a 46-year-old man with hepatitis B–related cirrhosis and HCC show restricted diffusion. (a) Gadoxetate disodium–enhanced T1-weighted 3D GRE image (3.0/1.4; 10° flip angle) acquired in late hepatic arterial phase shows large heterogeneous mass with mosaic architecture measuring 6 cm in right lobe of liver. (b) Mass is moderately hyperintense on T2-weighted turbo spin-echo image (951/80). (c) Diffusion-weighted image (b = 800 sec/mm2) shows hyperintensity, suggesting restricted diffusion, confirmed on (d) ADC map. Estimated ADC is 1010 mm2/sec. Restricted diffusion is highly suggestive of malignancy but not specific for HCC. Mosaic architecture in arterial phase and washout appearance in venous phases (not shown) permit specific diagnosis of HCC. Note central necrotic component within tumor (*). Necrotic component is markedly hyperintense on T2-weighted image (b), and has relatively unrestricted diffusion (d).
In nodules that can be diagnosed as HCC based on other imaging features, restricted diffusion may be of prognostic value. Retrospective studies have suggested that restricted diffusion, as assessed by signal intensity ratio or ADC measurement, can be used to predict higher tumor grade (69,147,148), presence of progenitor cell markers (107), microvascular invasion (149), and early recurrence after resection (150). Results have been inconsistent, however, and some investigators have found no correlation between ADC and HCC tumor grade (151). It should be emphasized, moreover, that ADC and diffusion-weighted signal-intensity ratios are technique, field strength, and scanner dependent; hence, diffusion-weighted–based prediction thresholds may not be generalizable. Additionally, some investigators have suggested that restricted diffusion may aid in the differentiation of macrovascular invasion from bland venous thrombus (77); however, other investigators have found that restricted diffusion does not aid in this differentiation due to substantial overlap in ADCs between bland thrombus and macrovascular invasion (78). Owing to these conflicting results, caution should be exercised in using diffusion-weighted images for differentiating bland from malignant thrombus.
Lesional iron sparing refers to relative paucity of iron in a solid mass compared with that of background iron-overloaded liver (12). This feature can be detected on T2- or T2*-weighted MR images by observing hyperintensity in a solid mass relative to hypointense, siderotic hepatic parenchyma. Lesional iron sparing raises concern for premalignancy or malignancy because high-grade dysplastic nodules and HCCs characteristically are iron “resistant.” Thus, any iron-free solid nodule in an otherwise iron-overloaded liver should be regarded as suspicious for high-grade dysplastic nodule or HCC (152). This feature is not specific for high-grade dysplastic nodule/HCC, however, as it also is observed in ICC and other non-HCC malignancies. Also, confluent fibrosis tends to be iron-free and, if masslike in configuration, conceivably could be mistaken for a tumor.
As discussed above, unenhanced T1-weighted imaging may contribute to the assessment of ancillary features such as intralesional fat, nodule-in-nodule architecture, and mosaic architecture. Otherwise, unenhanced T1-weighted imaging plays a relatively minor role in the diagnosis of HCC, because HCCs and nonmalignant hepatic nodules have variable and overlapping T1 signal intensity (134,137). However, the signal intensity on T1-weighted images may help in characterizing nodules that can be diagnosed as definite HCC based on other features. Studies have shown that T1-hypointense HCC nodules tend to have higher tumor grade (71) while T1-hyperintense HCC nodules tend to have lower tumor grade (71,139).
Conclusion
Currently all clinical practice guidelines recommend multiphasic CT and MR imaging with extracellular agents for diagnosis and staging of HCC; these modalities provide valuable information regarding vascularity and have excellent accuracy for diagnosis of large nodular HCCs, but they have limited sensitivity for early HCCs as well as for small and progressed HCCs. Emerging evidence suggests that MR imaging with hepatobiliary agents may be the most sensitive technique for detection of such HCCs, but confirmatory studies, especially in patients with advanced cirrhosis, are needed. Despite the importance of macrovascular invasion for tumor staging, treatment planning, and prognosis, the sensitivity and specificity of state-of-the-art CT and MR imaging for its diagnosis is not well known due to paucity of studies on this subject. Ancillary imaging features provide incremental information that helps to characterize nodules and may improve the sensitivity for HCC. Some ancillary imaging features show promise for predicting tumor grade or microvascular invasion, but independent confirmatory studies are needed to validate these features for these purposes.
Essentials
■ Current management guidelines recommend multiphasic CT or MR imaging with extracellular agents for diagnosis and staging of hepatocellular carcinoma (HCC); unlike most cancers, in which imaging findings are confirmed by tissue sampling prior to therapy, imaging may be used to establish diagnosis of HCC noninvasively, and treatment, including major surgical options such as hepatic resection and liver transplantation, may be initiated without confirmatory biopsy.
■ The hallmark diagnostic features of HCC at multiphasic CT or MR imaging are arterial phase hyperenhancement followed by portal venous or delayed phase washout appearance; in patients with cirrhosis or other risk factors for HCC, this temporal enhancement pattern provides near 100% specificity for diagnosis of HCC.
■ Another imaging feature characteristic of progressed HCC is capsule appearance; the combination of arterial phase hyperenhancement and capsule appearance strongly suggests the diagnosis of HCC, even in the absence of washout appearance.
■ Cirrhosis-associated nodules that are hypointense in the hepatobiliary phase are likely to be malignant or premalignant, even in the absence of arterial phase hyperenhancement or venous phase “washout.”
■ Accumulating evidence suggests MR imaging with hepatobiliary agents may be the most sensitive method for detecting small HCCs and premalignant lesions likely to progress to overt HCC, but confirmatory studies, especially in patients with advanced cirrhosis, are needed.
Received October 9, 2013; revision requested November 25; revision received February 7, 2014; accepted March 5; final version accepted March 14.
Funding: Supported by the National Institutes of Health (grant DK088925).
Disclosures of Conflicts of Interest: J.Y.C. disclosed no relevant relationships. J.M.L. Activities related to the present article: disclosed no relevant relationships. Activities not related to the present article: grants and personal fees from Bayer Healthcare; grants from GE Healthcare, Dongseo Medical, Central Medical Service, Acuzen, and Starmed; and personal fees from Siemens Healthcare. Other relationships: disclosed no relevant relationships. C.B.S. Activities related to the present article: disclosed no relevant relationships. Activities not related to the present article: grants from GE and grants and personal fees from Bayer. Other relationships: disclosed no relevant relationships.
Abbreviations:
- ADC
- apparent diffusion coefficient
- GRE
- gradient echo
- HCC
- hepatocellular carcinoma
- ICC
- intrahepatic cholangiocarcinoma
- 3D
- three-dimensional
References
- 1.Lencioni R, Piscaglia F, Bolondi L. Contrast-enhanced ultrasound in the diagnosis of hepatocellular carcinoma. J Hepatol 2008;48(5):848–857. [DOI] [PubMed] [Google Scholar]
- 2.Kim SR, Ando K, Mita K, et al. Superiority of CT arterioportal angiography to contrast-enhanced CT and MRI in the diagnosis of hepatocellular carcinoma in nodules smaller than 2 cm. Oncology 2007;72(Suppl 1):58–66. [DOI] [PubMed] [Google Scholar]
- 3.Yoo HJ, Lee JM, Lee JY, et al. Additional value of SPIO-enhanced MR imaging for the noninvasive imaging diagnosis of hepatocellular carcinoma in cirrhotic liver. Invest Radiol 2009;44(12):800–807. [DOI] [PubMed] [Google Scholar]
- 4.Kim BK, Kang WJ, Kim JK, et al. 18F-fluorodeoxyglucose uptake on positron emission tomography as a prognostic predictor in locally advanced hepatocellular carcinoma. Cancer 2011;117(20):4779–4787. [DOI] [PubMed] [Google Scholar]
- 5.Bruix J, Sherman M; Practice Guidelines Committee, American Association for the Study of Liver Diseases. Management of hepatocellular carcinoma. Hepatology 2005;42(5):1208–1236. [DOI] [PubMed] [Google Scholar]
- 6.Hatfield MK, Beres RA, Sane SS, Zaleski GX. Percutaneous imaging-guided solid organ core needle biopsy: coaxial versus noncoaxial method. AJR Am J Roentgenol 2008;190(2):413–417. [DOI] [PubMed] [Google Scholar]
- 7.Forner A, Vilana R, Ayuso C, et al. Diagnosis of hepatic nodules 20 mm or smaller in cirrhosis: Prospective validation of the noninvasive diagnostic criteria for hepatocellular carcinoma. Hepatology 2008;47(1):97–104. [DOI] [PubMed] [Google Scholar]
- 8.Bruix J, Sherman M; American Association for the Study of Liver Diseases. Management of hepatocellular carcinoma: an update. Hepatology 2011;53(3):1020–1022. [DOI] [PMC free article] [PubMed] [Google Scholar]
- 9.European Association For The Study Of The Liver; European Organisation For Research And Treatment Of Cancer . EASL-EORTC clinical practice guidelines: management of hepatocellular carcinoma. J Hepatol 2012;56(4):908–943. [DOI] [PubMed] [Google Scholar]
- 10.Kudo M. Real practice of hepatocellular carcinoma in Japan: conclusions of the Japan Society of Hepatology 2009 Kobe Congress. Oncology 2010;78(Suppl 1):180–188. [DOI] [PubMed] [Google Scholar]
- 11.Omata M, Lesmana LA, Tateishi R, et al. Asian Pacific Association for the Study of the Liver consensus recommendations on hepatocellular carcinoma. Hepatol Int 2010;4(2):439–474. [DOI] [PMC free article] [PubMed] [Google Scholar]
- 12.American College of Radiology . Liver Imaging Reporting and Data System version 2013.1. http://www.acr.org/Quality-Safety/Resources/LIRADS/. Accessed July 19, 2013.
- 13.Singh P, Patel T. Advances in the diagnosis, evaluation and management of cholangiocarcinoma. Curr Opin Gastroenterol 2006;22(3):294–299. [DOI] [PubMed] [Google Scholar]
- 14.Meyer CG, Penn I, James L. Liver transplantation for cholangiocarcinoma: results in 207 patients. Transplantation 2000;69(8):1633–1637. [DOI] [PubMed] [Google Scholar]
- 15.Pons F, Varela M, Llovet JM. Staging systems in hepatocellular carcinoma. HPB (Oxford) 2005;7(1):35–41. [DOI] [PMC free article] [PubMed] [Google Scholar]
- 16.Bruix J, Sherman M, Llovet JM, et al. Clinical management of hepatocellular carcinoma. Conclusions of the Barcelona-2000 EASL conference. European Association for the Study of the Liver. J Hepatol 2001;35(3):421–430. [DOI] [PubMed] [Google Scholar]
- 17.Vauthey JN, Klimstra D, Blumgart LH. A simplified staging system for hepatocellular carcinomas. Gastroenterology 1995;108(2):617–618. [DOI] [PubMed] [Google Scholar]
- 18.Okuda K, Ohtsuki T, Obata H, et al. Natural history of hepatocellular carcinoma and prognosis in relation to treatment. Study of 850 patients. Cancer 1985;56(4):918–928. [DOI] [PubMed] [Google Scholar]
- 19.Llovet JM. Updated treatment approach to hepatocellular carcinoma. J Gastroenterol 2005;40(3):225–235. [DOI] [PubMed] [Google Scholar]
- 20.Kim BK, Kim SU, Park JY, et al. Applicability of BCLC stage for prognostic stratification in comparison with other staging systems: single centre experience from long-term clinical outcomes of 1717 treatment-naïve patients with hepatocellular carcinoma. Liver Int 2012;32(7):1120–1127. [DOI] [PubMed] [Google Scholar]
- 21.Sherman M. Hepatocellular carcinoma: screening and staging. Clin Liver Dis 2011;15(2):323–334, vii–x. [DOI] [PubMed] [Google Scholar]
- 22.Pomfret EA, Washburn K, Wald C, et al. Report of a national conference on liver allocation in patients with hepatocellular carcinoma in the United States. Liver Transpl 2010;16(3):262–278. [DOI] [PubMed] [Google Scholar]
- 23.Shanbhogue AK, Prasad SR, Takahashi N, Vikram R, Sahani DV. Recent advances in cytogenetics and molecular biology of adult hepatocellular tumors: implications for imaging and management. Radiology 2011;258(3):673–693. [DOI] [PubMed] [Google Scholar]
- 24.Mínguez B, Lachenmayer A. Diagnostic and prognostic molecular markers in hepatocellular carcinoma. Dis Markers 2011;31(3):181–190. [DOI] [PMC free article] [PubMed] [Google Scholar]
- 25.Burrel M, Llovet JM, Ayuso C, et al. MRI angiography is superior to helical CT for detection of HCC prior to liver transplantation: an explant correlation. Hepatology 2003;38(4):1034–1042. [DOI] [PubMed] [Google Scholar]
- 26.Rode A, Bancel B, Douek P, et al. Small nodule detection in cirrhotic livers: evaluation with US, spiral CT, and MRI and correlation with pathologic examination of explanted liver. J Comput Assist Tomogr 2001;25(3):327–336. [DOI] [PubMed] [Google Scholar]
- 27.Kim YK, Kim CS, Chung GH, et al. Comparison of gadobenate dimeglumine-enhanced dynamic MRI and 16-MDCT for the detection of hepatocellular carcinoma. AJR Am J Roentgenol 2006;186(1):149–157. [DOI] [PubMed] [Google Scholar]
- 28.Krinsky GA, Lee VS, Theise ND, et al. Hepatocellular carcinoma and dysplastic nodules in patients with cirrhosis: prospective diagnosis with MR imaging and explantation correlation. Radiology 2001;219(2):445–454. [DOI] [PubMed] [Google Scholar]
- 29.Sangiovanni A, Manini MA, Iavarone M, et al. The diagnostic and economic impact of contrast imaging techniques in the diagnosis of small hepatocellular carcinoma in cirrhosis. Gut 2010;59(5):638–644. [DOI] [PubMed] [Google Scholar]
- 30.Lim JH, Kim CK, Lee WJ, et al. Detection of hepatocellular carcinomas and dysplastic nodules in cirrhotic livers: accuracy of helical CT in transplant patients. AJR Am J Roentgenol 2000;175(3):693–698. [DOI] [PubMed] [Google Scholar]
- 31.Kim SH, Kim SH, Lee J, et al. Gadoxetic acid-enhanced MRI versus triple-phase MDCT for the preoperative detection of hepatocellular carcinoma. AJR Am J Roentgenol 2009;192(6):1675–1681. [DOI] [PubMed] [Google Scholar]
- 32.Park MJ, Kim YK, Lee MW, et al. Small hepatocellular carcinomas: improved sensitivity by combining gadoxetic acid-enhanced and diffusion-weighted MR imaging patterns. Radiology 2012;264(3):761–770. [DOI] [PubMed] [Google Scholar]
- 33.Hyodo T, Murakami T, Imai Y, et al. Hypovascular nodules in patients with chronic liver disease: risk factors for development of hypervascular hepatocellular carcinoma. Radiology 2013;266(2):480–490. [DOI] [PubMed] [Google Scholar]
- 34.Kim YK, Lee WJ, Park MJ, Kim SH, Rhim H, Choi D. Hypovascular hypointense nodules on hepatobiliary phase gadoxetic acid-enhanced MR images in patients with cirrhosis: potential of DW imaging in predicting progression to hypervascular HCC. Radiology 2012;265(1):104–114. [DOI] [PubMed] [Google Scholar]
- 35.Kobayashi S, Matsui O, Gabata T, et al. Relationship between signal intensity on hepatobiliary phase of gadolinium ethoxybenzyl diethylenetriaminepentaacetic acid (Gd-EOB-DTPA)-enhanced MR imaging and prognosis of borderline lesions of hepatocellular carcinoma. Eur J Radiol 2012;81(11):3002–3009. [DOI] [PubMed] [Google Scholar]
- 36.Kumada T, Toyoda H, Tada T, et al. Evolution of hypointense hepatocellular nodules observed only in the hepatobiliary phase of gadoxetate disodium-enhanced MRI. AJR Am J Roentgenol 2011;197(1):58–63. [DOI] [PubMed] [Google Scholar]
- 37.Takayama Y, Nishie A, Nakayama T, et al. Hypovascular hepatic nodule showing hypointensity in the hepatobiliary phase of gadoxetic acid-enhanced MRI in patients with chronic liver disease: prediction of malignant transformation. Eur J Radiol 2012;81(11):3072–3078. [DOI] [PubMed] [Google Scholar]
- 38.Marin D, Di Martino M, Guerrisi A, et al. Hepatocellular carcinoma in patients with cirrhosis: qualitative comparison of gadobenate dimeglumine-enhanced MR imaging and multiphasic 64-section CT. Radiology 2009;251(1):85–95. [DOI] [PubMed] [Google Scholar]
- 39.Park G, Kim YK, Kim CS, Yu HC, Hwang SB. Diagnostic efficacy of gadoxetic acid-enhanced MRI in the detection of hepatocellular carcinomas: comparison with gadopentetate dimeglumine. Br J Radiol 2010;83(996):1010–1016. [DOI] [PMC free article] [PubMed] [Google Scholar]
- 40.Ooka Y, Kanai F, Okabe S, et al. Gadoxetic acid-enhanced MRI compared with CT during angiography in the diagnosis of hepatocellular carcinoma. Magn Reson Imaging 2013;31(5):748–754. [DOI] [PubMed] [Google Scholar]
- 41.Sano K, Ichikawa T, Motosugi U, et al. Imaging study of early hepatocellular carcinoma: usefulness of gadoxetic acid-enhanced MR imaging. Radiology 2011;261(3):834–844. [DOI] [PubMed] [Google Scholar]
- 42.Park Y, Kim SH, Kim SH, et al. Gadoxetic acid (Gd-EOB-DTPA)-enhanced MRI versus gadobenate dimeglumine (Gd-BOPTA)-enhanced MRI for preoperatively detecting hepatocellular carcinoma: an initial experience. Korean J Radiol 2010;11(4):433–440. [DOI] [PMC free article] [PubMed] [Google Scholar]
- 43.Kim TK, Lee KH, Jang HJ, et al. Analysis of gadobenate dimeglumine-enhanced MR findings for characterizing small (1-2-cm) hepatic nodules in patients at high risk for hepatocellular carcinoma. Radiology 2011;259(3):730–738. [DOI] [PubMed] [Google Scholar]
- 44.Marrero JA, Hussain HK, Nghiem HV, Umar R, Fontana RJ, Lok AS. Improving the prediction of hepatocellular carcinoma in cirrhotic patients with an arterially-enhancing liver mass. Liver Transpl 2005;11(3):281–289. [DOI] [PubMed] [Google Scholar]
- 45.Rimola J, Forner A, Tremosini S, et al. Non-invasive diagnosis of hepatocellular carcinoma ≤ 2 cm in cirrhosis. Diagnostic accuracy assessing fat, capsule and signal intensity at dynamic MRI. J Hepatol 2012;56(6):1317–1323. [DOI] [PubMed] [Google Scholar]
- 46.Efremidis SC, Hytiroglou P. The multistep process of hepatocarcinogenesis in cirrhosis with imaging correlation. Eur Radiol 2002;12(4):753–764. [DOI] [PubMed] [Google Scholar]
- 47.Choi JW, Lee JM, Kim SJ, et al. Hepatocellular carcinoma: imaging patterns on gadoxetic acid-enhanced MR Images and their value as an imaging biomarker. Radiology 2013;267(3):776–786. [DOI] [PubMed] [Google Scholar]
- 48.Lee JM, Choi BI. Hepatocellular nodules in liver cirrhosis: MR evaluation. Abdom Imaging 2011;36(3):282–289. [DOI] [PubMed] [Google Scholar]
- 49.Cruite I, Schroeder M, Merkle EM, Sirlin CB. Gadoxetate disodium-enhanced MRI of the liver: part 2, protocol optimization and lesion appearance in the cirrhotic liver. AJR Am J Roentgenol 2010;195(1):29–41. [DOI] [PubMed] [Google Scholar]
- 50.Rimola J, Forner A, Reig M, et al. Cholangiocarcinoma in cirrhosis: absence of contrast washout in delayed phases by magnetic resonance imaging avoids misdiagnosis of hepatocellular carcinoma. Hepatology 2009;50(3):791–798. [DOI] [PubMed] [Google Scholar]
- 51.Holland AE, Hecht EM, Hahn WY, et al. Importance of small (< or = 20-mm) enhancing lesions seen only during the hepatic arterial phase at MR imaging of the cirrhotic liver: evaluation and comparison with whole explanted liver. Radiology 2005;237(3):938–944. [DOI] [PubMed] [Google Scholar]
- 52.Hwang SH, Yu JS, Kim KW, Kim JH, Chung JJ. Small hypervascular enhancing lesions on arterial phase images of multiphase dynamic computed tomography in cirrhotic liver: fate and implications. J Comput Assist Tomogr 2008;32(1):39–45. [DOI] [PubMed] [Google Scholar]
- 53.Lim JH, Choi D, Kim SH, et al. Detection of hepatocellular carcinoma: value of adding delayed phase imaging to dual-phase helical CT. AJR Am J Roentgenol 2002;179(1):67–73. [DOI] [PubMed] [Google Scholar]
- 54.Monzawa S, Ichikawa T, Nakajima H, Kitanaka Y, Omata K, Araki T. Dynamic CT for detecting small hepatocellular carcinoma: usefulness of delayed phase imaging. AJR Am J Roentgenol 2007;188(1):147–153. [DOI] [PubMed] [Google Scholar]
- 55.Khan AS, Hussain HK, Johnson TD, Weadock WJ, Pelletier SJ, Marrero JA. Value of delayed hypointensity and delayed enhancing rim in magnetic resonance imaging diagnosis of small hepatocellular carcinoma in the cirrhotic liver. J Magn Reson Imaging 2010;32(2):360–366. [DOI] [PubMed] [Google Scholar]
- 56.Liu YI, Shin LK, Jeffrey RB, Kamaya A. Quantitatively defining washout in hepatocellular carcinoma. AJR Am J Roentgenol 2013;200(1):84–89. [DOI] [PubMed] [Google Scholar]
- 57.Grazioli L, Olivetti L, Fugazzola C, et al. The pseudocapsule in hepatocellular carcinoma: correlation between dynamic MR imaging and pathology. Eur Radiol 1999;9(1):62–67. [DOI] [PubMed] [Google Scholar]
- 58.Ishigami K, Yoshimitsu K, Nishihara Y, et al. Hepatocellular carcinoma with a pseudocapsule on gadolinium-enhanced MR images: correlation with histopathologic findings. Radiology 2009;250(2):435–443. [DOI] [PubMed] [Google Scholar]
- 59.Lim JH, Choi D, Park CK, Lee WJ, Lim HK. Encapsulated hepatocellular carcinoma: CT-pathologic correlations. Eur Radiol 2006;16(10):2326–2333. [DOI] [PubMed] [Google Scholar]
- 60.Iannaccone R, Laghi A, Catalano C, et al. Hepatocellular carcinoma: role of unenhanced and delayed phase multi-detector row helical CT in patients with cirrhosis. Radiology 2005;234(2):460–467. [DOI] [PubMed] [Google Scholar]
- 61.Kojiro M. Histopathology of liver cancers. Best Pract Res Clin Gastroenterol 2005;19(1):39–62. [DOI] [PubMed] [Google Scholar]
- 62.Sakamoto M, Hirohashi S, Tsuda H, Shimosato Y, Makuuchi M, Hosoda Y. Multicentric independent development of hepatocellular carcinoma revealed by analysis of hepatitis B virus integration pattern. Am J Surg Pathol 1989;13(12):1064–1067. [DOI] [PubMed] [Google Scholar]
- 63.Sakon M, Nagano H, Nakamori S, et al. Intrahepatic recurrences of hepatocellular carcinoma after hepatectomy: analysis based on tumor hemodynamics. Arch Surg 2002;137(1):94–99. [DOI] [PubMed] [Google Scholar]
- 64.Oda T, Tsuda H, Scarpa A, Sakamoto M, Hirohashi S. Mutation pattern of the p53 gene as a diagnostic marker for multiple hepatocellular carcinoma. Cancer Res 1992;52(13):3674–3678. [PubMed] [Google Scholar]
- 65.Kim SH, Choi SB, Lee JG, et al. Prognostic factors and 10-year survival in patients with hepatocellular carcinoma after curative hepatectomy. J Gastrointest Surg 2011;15(4):598–607. [DOI] [PubMed] [Google Scholar]
- 66.Kang Y, Lee JM, Kim SH, Han JK, Choi BI. Intrahepatic mass-forming cholangiocarcinoma: enhancement patterns on gadoxetic acid-enhanced MR images. Radiology 2012;264(3):751–760. [DOI] [PubMed] [Google Scholar]
- 67.Kawamura Y, Ikeda K, Seko Y, et al. Heterogeneous type 4 enhancement of hepatocellular carcinoma on dynamic CT is associated with tumor recurrence after radiofrequency ablation. AJR Am J Roentgenol 2011;197(4):W665–W673. [DOI] [PubMed] [Google Scholar]
- 68.Griffin N, Addley H, Sala E, et al. Vascular invasion in hepatocellular carcinoma: is there a correlation with MRI? Br J Radiol 2012;85(1014):736–744. [DOI] [PMC free article] [PubMed] [Google Scholar]
- 69.An C, Park MS, Jeon HM, et al. Prediction of the histopathological grade of hepatocellular carcinoma using qualitative diffusion-weighted, dynamic, and hepatobiliary phase MRI. Eur Radiol 2012;22(8):1701–1708. [DOI] [PubMed] [Google Scholar]
- 70.Chandarana H, Robinson E, Hajdu CH, Drozhinin L, Babb JS, Taouli B. Microvascular invasion in hepatocellular carcinoma: is it predictable with pretransplant MRI? AJR Am J Roentgenol 2011;196(5):1083–1089. [DOI] [PubMed] [Google Scholar]
- 71.Enomoto S, Tamai H, Shingaki N, et al. Assessment of hepatocellular carcinomas using conventional magnetic resonance imaging correlated with histological differentiation and a serum marker of poor prognosis. Hepatol Int 2011;5(2):730–737. [DOI] [PMC free article] [PubMed] [Google Scholar]
- 72.Okamoto D, Yoshimitsu K, Nishie A, et al. Enhancement pattern analysis of hypervascular hepatocellular carcinoma on dynamic MR imaging with histopathological correlation: validity of portal phase imaging for predicting tumor grade. Eur J Radiol 2012;81(6):1116–1121. [DOI] [PubMed] [Google Scholar]
- 73.Iguchi T, Aishima S, Taketomi A, et al. Extracapsular penetration is a new prognostic factor in human hepatocellular carcinoma. Am J Surg Pathol 2008;32(11):1675–1682. [DOI] [PubMed] [Google Scholar]
- 74.Willatt JM, Hussain HK, Adusumilli S, Marrero JA. MR. Imaging of hepatocellular carcinoma in the cirrhotic liver: challenges and controversies. Radiology 2008;247(2):311–330. [DOI] [PubMed] [Google Scholar]
- 75.Tublin ME, Dodd GD, 3rd, Baron RL. Benign and malignant portal vein thrombosis: differentiation by CT characteristics. AJR Am J Roentgenol 1997;168(3):719–723. [DOI] [PubMed] [Google Scholar]
- 76.Sorrentino P, Tarantino L, D’Angelo S, et al. Validation of an extension of the international non-invasive criteria for the diagnosis of hepatocellular carcinoma to the characterization of macroscopic portal vein thrombosis. J Gastroenterol Hepatol 2011;26(4):669–677. [DOI] [PubMed] [Google Scholar]
- 77.Catalano OA, Choy G, Zhu A, Hahn PF, Sahani DV. Differentiation of malignant thrombus from bland thrombus of the portal vein in patients with hepatocellular carcinoma: application of diffusion-weighted MR imaging. Radiology 2010;254(1):154–162. [DOI] [PubMed] [Google Scholar]
- 78.Sandrasegaran K, Tahir B, Nutakki K, et al. Usefulness of conventional MRI sequences and diffusion-weighted imaging in differentiating malignant from benign portal vein thrombus in cirrhotic patients. AJR Am J Roentgenol 2013;201(6):1211–1219. [DOI] [PubMed] [Google Scholar]
- 79.Yoon SH, Lee JM, So YH, et al. Multiphasic MDCT enhancement pattern of hepatocellular carcinoma smaller than 3 cm in diameter: tumor size and cellular differentiation. AJR Am J Roentgenol 2009;193(6):W482–W489. [DOI] [PubMed] [Google Scholar]
- 80.Kim SH, Lee WJ, Lim HK, Park CK. SPIO-enhanced MRI findings of well-differentiated hepatocellular carcinomas: correlation with MDCT findings. Korean J Radiol 2009;10(2):112–120. [DOI] [PMC free article] [PubMed] [Google Scholar]
- 81.Kanematsu M, Semelka RC, Leonardou P, Mastropasqua M, Lee JK. Hepatocellular carcinoma of diffuse type: MR imaging findings and clinical manifestations. J Magn Reson Imaging 2003;18(2):189–195. [DOI] [PubMed] [Google Scholar]
- 82.Higaki A, Tamada T, Sone T, et al. Potential clinical factors affecting hepatobiliary enhancement at Gd-EOB-DTPA-enhanced MR imaging. Magn Reson Imaging 2012;30(5):689–693. [DOI] [PubMed] [Google Scholar]
- 83.Narita M, Hatano E, Arizono S, et al. Expression of OATP1B3 determines uptake of Gd-EOB-DTPA in hepatocellular carcinoma. J Gastroenterol 2009;44(7):793–798. [DOI] [PubMed] [Google Scholar]
- 84.Kitao A, Zen Y, Matsui O, et al. Hepatocellular carcinoma: signal intensity at gadoxetic acid-enhanced MR Imaging—correlation with molecular transporters and histopathologic features. Radiology 2010;256(3):817–826. [DOI] [PubMed] [Google Scholar]
- 85.Kudo M. Multistep human hepatocarcinogenesis: correlation of imaging with pathology. J Gastroenterol 2009;44(Suppl 19):112–118. [DOI] [PubMed] [Google Scholar]
- 86.Golfieri R, Grazioli L, Orlando E, et al. Which is the best MRI marker of malignancy for atypical cirrhotic nodules: hypointensity in hepatobiliary phase alone or combined with other features? Classification after Gd-EOB-DTPA administration. J Magn Reson Imaging 2012;36(3):648–657. [DOI] [PubMed] [Google Scholar]
- 87.Ahn SS, Kim MJ, Lim JS, Hong HS, Chung YE, Choi JY. Added value of gadoxetic acid-enhanced hepatobiliary phase MR imaging in the diagnosis of hepatocellular carcinoma. Radiology 2010;255(2):459–466. [DOI] [PubMed] [Google Scholar]
- 88.Golfieri R, Renzulli M, Lucidi V, Corcioni B, Trevisani F, Bolondi L. Contribution of the hepatobiliary phase of Gd-EOB-DTPA-enhanced MRI to Dynamic MRI in the detection of hypovascular small (≤ 2 cm) HCC in cirrhosis. Eur Radiol 2011;21(6):1233–1242. [DOI] [PubMed] [Google Scholar]
- 89.Haradome H, Grazioli L, Tinti R, et al. Additional value of gadoxetic acid-DTPA-enhanced hepatobiliary phase MR imaging in the diagnosis of early-stage hepatocellular carcinoma: comparison with dynamic triple-phase multidetector CT imaging. J Magn Reson Imaging 2011;34(1):69–78. [DOI] [PubMed] [Google Scholar]
- 90.Tanimoto A, Kuwatsuru R, Kadoya M, et al. Evaluation of gadobenate dimeglumine in hepatocellular carcinoma: results from phase II and phase III clinical trials in Japan. J Magn Reson Imaging 1999;10(3):450–460. [DOI] [PubMed] [Google Scholar]
- 91.Kudo M, Matsui O, Sakamoto M, et al. Role of gadolinium-ethoxybenzyl-diethylenetriamine pentaacetic acid-enhanced magnetic resonance imaging in the management of hepatocellular carcinoma: consensus at the Symposium of the 48th Annual Meeting of the Liver Cancer Study Group of Japan. Oncology 2013;84(Suppl 1):21–27. [DOI] [PubMed] [Google Scholar]
- 92.Sun HY, Lee JM, Shin CI, et al. Gadoxetic acid-enhanced magnetic resonance imaging for differentiating small hepatocellular carcinomas (< or = 2 cm in diameter) from arterial enhancing pseudolesions: special emphasis on hepatobiliary phase imaging. Invest Radiol 2010;45(2):96–103. [DOI] [PubMed] [Google Scholar]
- 93.Kogita S, Imai Y, Okada M, et al. Gd-EOB-DTPA-enhanced magnetic resonance images of hepatocellular carcinoma: correlation with histological grading and portal blood flow. Eur Radiol 2010;20(10):2405–2413. [DOI] [PubMed] [Google Scholar]
- 94.Bartolozzi C, Battaglia V, Bargellini I, et al. Contrast-enhanced magnetic resonance imaging of 102 nodules in cirrhosis: correlation with histological findings on explanted livers. Abdom Imaging 2013;38(2):290–296. [DOI] [PubMed] [Google Scholar]
- 95.Kim MJ, Lee M, Choi JY, Park YN. Imaging features of small hepatocellular carcinomas with microvascular invasion on gadoxetic acid-enhanced MR imaging. Eur J Radiol 2012;81(10):2507–2512. [DOI] [PubMed] [Google Scholar]
- 96.Park HJ, Kim YK, Park MJ, Lee WJ. Small intrahepatic mass-forming cholangiocarcinoma: target sign on diffusion-weighted imaging for differentiation from hepatocellular carcinoma. Abdom Imaging 2013;38(4):793–801. [DOI] [PubMed] [Google Scholar]
- 97.Lee MH, Kim SH, Park MJ, Park CK, Rhim H. Gadoxetic acid-enhanced hepatobiliary phase MRI and high-b-value diffusion-weighted imaging to distinguish well-differentiated hepatocellular carcinomas from benign nodules in patients with chronic liver disease. AJR Am J Roentgenol 2011;197(5):W868–W875. [DOI] [PubMed] [Google Scholar]
- 98.Takechi M, Tsuda T, Yoshioka S, et al. Risk of hypervascularization in small hypovascular hepatic nodules showing hypointense in the hepatobiliary phase of gadoxetic acid-enhanced MRI in patients with chronic liver disease. Jpn J Radiol 2012;30(9):743–751. [DOI] [PubMed] [Google Scholar]
- 99.Toyoda H, Kumada T, Tada T, et al. Non-hypervascular hypointense nodules detected by Gd-EOB-DTPA-enhanced MRI are a risk factor for recurrence of HCC after hepatectomy. J Hepatol 2013;58(6):1174–1180. [DOI] [PubMed] [Google Scholar]
- 100.Suh YJ, Kim MJ, Choi JY, Park YN, Park MS, Kim KW. Differentiation of hepatic hyperintense lesions seen on gadoxetic acid-enhanced hepatobiliary phase MRI. AJR Am J Roentgenol 2011;197(1):W44–W52. [DOI] [PubMed] [Google Scholar]
- 101.Kitao A, Matsui O, Yoneda N, et al. Hypervascular hepatocellular carcinoma: correlation between biologic features and signal intensity on gadoxetic acid-enhanced MR images. Radiology 2012;265(3):780–789. [DOI] [PMC free article] [PubMed] [Google Scholar]
- 102.Kitao A, Matsui O, Yoneda N, et al. The uptake transporter OATP8 expression decreases during multistep hepatocarcinogenesis: correlation with gadoxetic acid enhanced MR imaging. Eur Radiol 2011;21(10):2056–2066. [DOI] [PubMed] [Google Scholar]
- 103.Kim JY, Kim MJ, Kim KA, Jeong HT, Park YN. Hyperintense HCC on hepatobiliary phase images of gadoxetic acid-enhanced MRI: correlation with clinical and pathological features. Eur J Radiol 2012;81(12):3877–3882. [DOI] [PubMed] [Google Scholar]
- 104.Manfredi R, Maresca G, Baron RL, et al. Delayed MR imaging of hepatocellular carcinoma enhanced by gadobenate dimeglumine (Gd-BOPTA). J Magn Reson Imaging 1999;9(5):704–710. [DOI] [PubMed] [Google Scholar]
- 105.Kim HY, Choi JY, Kim CW, et al. Gadolinium ethoxybenzyl diethylenetriamine pentaacetic acid-enhanced magnetic resonance imaging predicts the histological grade of hepatocellular carcinoma only in patients with Child-Pugh class A cirrhosis. Liver Transpl 2012;18(7):850–857. [DOI] [PubMed] [Google Scholar]
- 106.Choi JY, Kim MJ, Park YN, et al. Gadoxetate disodium-enhanced hepatobiliary phase MRI of hepatocellular carcinoma: correlation with histological characteristics. AJR Am J Roentgenol 2011;197(2):399–405. [DOI] [PubMed] [Google Scholar]
- 107.Jeong HT, Kim MJ, Kim YE, Park YN, Choi GH, Choi JS. MRI features of hepatocellular carcinoma expressing progenitor cell markers. Liver Int 2012;32(3):430–440. [DOI] [PubMed] [Google Scholar]
- 108.Durnez A, Verslype C, Nevens F, et al. The clinicopathological and prognostic relevance of cytokeratin 7 and 19 expression in hepatocellular carcinoma. A possible progenitor cell origin. Histopathology 2006;49(2):138–151. [DOI] [PubMed] [Google Scholar]
- 109.Yamashita T, Forgues M, Wang W, et al. EpCAM and alpha-fetoprotein expression defines novel prognostic subtypes of hepatocellular carcinoma. Cancer Res 2008;68(5):1451–1461. [DOI] [PubMed] [Google Scholar]
- 110.Vasuri F, Golfieri R, Fiorentino M, et al. OATP 1B1/1B3 expression in hepatocellular carcinomas treated with orthotopic liver transplantation. Virchows Arch 2011;459(2):141–146. [DOI] [PubMed] [Google Scholar]
- 111.Ariizumi S, Kitagawa K, Kotera Y, et al. A non-smooth tumor margin in the hepatobiliary phase of gadoxetic acid disodium (Gd-EOB-DTPA)-enhanced magnetic resonance imaging predicts microscopic portal vein invasion, intrahepatic metastasis, and early recurrence after hepatectomy in patients with hepatocellular carcinoma. J Hepatobiliary Pancreat Sci 2011;18(4):575–585. [DOI] [PubMed] [Google Scholar]
- 112.Kim H, Park MS, Choi JY, et al. Can microvessel invasion of hepatocellular carcinoma be predicted by pre-operative MRI? Eur Radiol 2009;19(7):1744–1751. [DOI] [PubMed] [Google Scholar]
- 113.Kim KA, Kim MJ, Jeon HM, et al. Prediction of microvascular invasion of hepatocellular carcinoma: usefulness of peritumoral hypointensity seen on gadoxetate disodium-enhanced hepatobiliary phase images. J Magn Reson Imaging 2012;35(3):629–634. [DOI] [PubMed] [Google Scholar]
- 114.Chong YS, Kim YK, Lee MW, et al. Differentiating mass-forming intrahepatic cholangiocarcinoma from atypical hepatocellular carcinoma using gadoxetic acid-enhanced MRI. Clin Radiol 2012;67(8):766–773. [DOI] [PubMed] [Google Scholar]
- 115.Kim AY, Kim YK, Lee MW, et al. Detection of hepatocellular carcinoma in gadoxetic acid-enhanced MRI and diffusion-weighted MRI with respect to the severity of liver cirrhosis. Acta Radiol 2012;53(8):830–838. [DOI] [PubMed] [Google Scholar]
- 116.Nakamura Y, Tashiro H, Nambu J, et al. Detectability of hepatocellular carcinoma by gadoxetate disodium-enhanced hepatic MRI: tumor-by-tumor analysis in explant livers. J Magn Reson Imaging 2013;37(3):684–691. [DOI] [PubMed] [Google Scholar]
- 117.Nakamura Y, Toyota N, Date S, et al. Clinical significance of the transitional phase at gadoxetate disodium-enhanced hepatic MRI for the diagnosis of hepatocellular carcinoma: preliminary results. J Comput Assist Tomogr 2011;35(6):723–727. [DOI] [PubMed] [Google Scholar]
- 118.Davenport MS, Viglianti BL, Al-Hawary MM, et al. Comparison of acute transient dyspnea after intravenous administration of gadoxetate disodium and gadobenate dimeglumine: effect on arterial phase image quality. Radiology 2013;266(2):452–461. [DOI] [PubMed] [Google Scholar]
- 119.Takayasu K, Furukawa H, Wakao F, et al. CT diagnosis of early hepatocellular carcinoma: sensitivity, findings, and CT-pathologic correlation. AJR Am J Roentgenol 1995;164(4):885–890. [DOI] [PubMed] [Google Scholar]
- 120.Kanematsu M, Kondo H, Goshima S, Tsuge Y, Watanabe H. Magnetic resonance imaging of hepatocellular carcinoma. Oncology 2008;75(Suppl 1):65–71. [DOI] [PubMed] [Google Scholar]
- 121.Salomao M, Yu WM, Brown RS, Jr, Emond JC, Lefkowitch JH. Steatohepatitic hepatocellular carcinoma (SH-HCC): a distinctive histological variant of HCC in hepatitis C virus-related cirrhosis with associated NAFLD/NASH. Am J Surg Pathol 2010;34(11):1630–1636. [DOI] [PubMed] [Google Scholar]
- 122.Siripongsakun S, Lee JK, Raman SS, Tong MJ, Sayre J, Lu DS. MRI detection of intratumoral fat in hepatocellular carcinoma: potential biomarker for a more favorable prognosis. AJR Am J Roentgenol 2012;199(5):1018–1025. [DOI] [PubMed] [Google Scholar]
- 123.Salomao M, Remotti H, Vaughan R, Siegel AB, Lefkowitch JH, Moreira RK. The steatohepatitic variant of hepatocellular carcinoma and its association with underlying steatohepatitis. Hum Pathol 2012;43(5):737–746. [DOI] [PubMed] [Google Scholar]
- 124.Ueda K, Matsui O, Kawamori Y, et al. Hypervascular hepatocellular carcinoma: evaluation of hemodynamics with dynamic CT during hepatic arteriography. Radiology 1998;206(1):161–166. [DOI] [PubMed] [Google Scholar]
- 125.Kita R, Sakamoto A, Nagata Y, et al. Visualization of blood drainage area from hypervascular hepatocellular carcinoma on ultrasonographic images during hepatic arteriogram: Comparison with depiction of drainage area on contrast-enhanced ultrasound. Hepatol Res 2012;42(10):999–1007. [DOI] [PubMed] [Google Scholar]
- 126.Ueda K, Matsui O, Kawamori Y, et al. Differentiation of hypervascular hepatic pseudolesions from hepatocellular carcinoma: value of single-level dynamic CT during hepatic arteriography. J Comput Assist Tomogr 1998;22(5):703–708. [DOI] [PubMed] [Google Scholar]
- 127.Ito K, Fujita T, Shimizu A, et al. Multiarterial phase dynamic MRI of small early enhancing hepatic lesions in cirrhosis or chronic hepatitis: differentiating between hypervascular hepatocellular carcinomas and pseudolesions. AJR Am J Roentgenol 2004;183(3):699–705. [DOI] [PubMed] [Google Scholar]
- 128.Matsui O, Kobayashi S, Sanada J, et al. Hepatocelluar nodules in liver cirrhosis: hemodynamic evaluation (angiography-assisted CT) with special reference to multi-step hepatocarcinogenesis. Abdom Imaging 2011;36(3):264–272. [DOI] [PMC free article] [PubMed] [Google Scholar]
- 129.Nishie A, Yoshimitsu K, Asayama Y, et al. Radiologic detectability of minute portal venous invasion in hepatocellular carcinoma. AJR Am J Roentgenol 2008;190(1):81–87. [DOI] [PubMed] [Google Scholar]
- 130.Kojiro M. ‘Nodule-in-nodule’ appearance in hepatocellular carcinoma: its significance as a morphologic marker of dedifferentiation. Intervirology 2004;47(3-5):179–183. [DOI] [PubMed] [Google Scholar]
- 131.Efremidis SC, Hytiroglou P, Matsui O. Enhancement patterns and signal-intensity characteristics of small hepatocellular carcinoma in cirrhosis: pathologic basis and diagnostic challenges. Eur Radiol 2007;17(11):2969–2982. [DOI] [PubMed] [Google Scholar]
- 132.Khatri G, Merrick L, Miller FH. MR imaging of hepatocellular carcinoma. Magn Reson Imaging Clin N Am 2010;18(3):421–450, x. [DOI] [PubMed] [Google Scholar]
- 133.Terada T, Kadoya M, Nakanuma Y, Matsui O. Iron-accumulating adenomatous hyperplastic nodule with malignant foci in the cirrhotic liver. Histopathologic, quantitative iron, and magnetic resonance imaging in vitro studies. Cancer 1990;65(9):1994–2000. [DOI] [PubMed] [Google Scholar]
- 134.Zech CJ, Reiser MF, Herrmann KA. Imaging of hepatocellular carcinoma by computed tomography and magnetic resonance imaging: state of the art. Dig Dis 2009;27(2):114–124. [DOI] [PubMed] [Google Scholar]
- 135.Lee KH, O’Malley ME, Haider MA, Hanbidge A. Triple-phase MDCT of hepatocellular carcinoma. AJR Am J Roentgenol 2004;182(3):643–649. [DOI] [PubMed] [Google Scholar]
- 136.Kadoya M, Matsui O, Takashima T, Nonomura A. Hepatocellular carcinoma: correlation of MR imaging and histopathologic findings. Radiology 1992;183(3):819–825. [DOI] [PubMed] [Google Scholar]
- 137.Matsui O, Kadoya M, Kameyama T, et al. Adenomatous hyperplastic nodules in the cirrhotic liver: differentiation from hepatocellular carcinoma with MR imaging. Radiology 1989;173(1):123–126. [DOI] [PubMed] [Google Scholar]
- 138.Muramatsu Y, Nawano S, Takayasu K, et al. Early hepatocellular carcinoma: MR imaging. Radiology 1991;181(1):209–213. [DOI] [PubMed] [Google Scholar]
- 139.Ebara M, Fukuda H, Kojima Y, et al. Small hepatocellular carcinoma: relationship of signal intensity to histopathologic findings and metal content of the tumor and surrounding hepatic parenchyma. Radiology 1999;210(1):81–88. [DOI] [PubMed] [Google Scholar]
- 140.Xu PJ, Yan FH, Wang JH, Shan Y, Ji Y, Chen CZ. Contribution of diffusion-weighted magnetic resonance imaging in the characterization of hepatocellular carcinomas and dysplastic nodules in cirrhotic liver. J Comput Assist Tomogr 2010;34(4):506–512. [DOI] [PubMed] [Google Scholar]
- 141.Taouli B, Koh DM. Diffusion-weighted MR imaging of the liver. Radiology 2010;254(1):47–66. [DOI] [PubMed] [Google Scholar]
- 142.Vandecaveye V, De Keyzer F, Verslype C, et al. Diffusion-weighted MRI provides additional value to conventional dynamic contrast-enhanced MRI for detection of hepatocellular carcinoma. Eur Radiol 2009;19(10):2456–2466. [DOI] [PubMed] [Google Scholar]
- 143.Kim YK, Kim CS, Han YM, Lee YH. Detection of liver malignancy with gadoxetic acid-enhanced MRI: is addition of diffusion-weighted MRI beneficial? Clin Radiol 2011;66(6):489–496. [DOI] [PubMed] [Google Scholar]
- 144.Yu JS, Chung JJ, Kim JH, et al. Detection of small intrahepatic metastases of hepatocellular carcinomas using diffusion-weighted imaging: comparison with conventional dynamic MRI. Magn Reson Imaging 2011;29(7):985–992. [DOI] [PubMed] [Google Scholar]
- 145.Miller FH, Hammond N, Siddiqi AJ, et al. Utility of diffusion-weighted MRI in distinguishing benign and malignant hepatic lesions. J Magn Reson Imaging 2010;32(1):138–147. [DOI] [PubMed] [Google Scholar]
- 146.Galea N, Cantisani V, Taouli B. Liver lesion detection and characterization: role of diffusion-weighted imaging. J Magn Reson Imaging 2013;37(6):1260–1276. [DOI] [PubMed] [Google Scholar]
- 147.Heo SH, Jeong YY, Shin SS, et al. Apparent diffusion coefficient value of diffusion-weighted imaging for hepatocellular carcinoma: correlation with the histologic differentiation and the expression of vascular endothelial growth factor. Korean J Radiol 2010;11(3):295–303. [DOI] [PMC free article] [PubMed] [Google Scholar]
- 148.Nishie A, Tajima T, Asayama Y, et al. Diagnostic performance of apparent diffusion coefficient for predicting histological grade of hepatocellular carcinoma. Eur J Radiol 2011;80(2):e29–e33. [DOI] [PubMed] [Google Scholar]
- 149.Suh YJ, Kim MJ, Choi JY, Park MS, Kim KW. Preoperative prediction of the microvascular invasion of hepatocellular carcinoma with diffusion-weighted imaging. Liver Transpl 2012;18(10):1171–1178. [DOI] [PubMed] [Google Scholar]
- 150.Nakanishi M, Chuma M, Hige S, et al. Relationship between diffusion-weighted magnetic resonance imaging and histological tumor grading of hepatocellular carcinoma. Ann Surg Oncol 2012;19(4):1302–1309. [DOI] [PubMed] [Google Scholar]
- 151.Nasu K, Kuroki Y, Tsukamoto T, Nakajima H, Mori K, Minami M. Diffusion-weighted imaging of surgically resected hepatocellular carcinoma: imaging characteristics and relationship among signal intensity, apparent diffusion coefficient, and histopathologic grade. AJR Am J Roentgenol 2009;193(2):438–444. [DOI] [PubMed] [Google Scholar]
- 152.Zhang J, Krinsky GA. Iron-containing nodules of cirrhosis. NMR Biomed 2004;17(7):459–464. [DOI] [PubMed] [Google Scholar]