



Abstract
A novel polymerase chain reaction (PCR) device was developed that uses wire-guided droplet manipulation (WDM) to guide a droplet over three different heating chambers. After PCR amplification, end-point detection is achieved using a smartphone-based fluorescence microscope. The device was tested for identification of the 16S rRNA gene V3 hypervariable region from Escherichia coli genomic DNA. The lower limit of detection was 103 genome copies per sample. The device is portable with smartphone-based end-point detection and provides the assay results quickly (15 min for a 30-cycle amplification) and accurately. The system is also shock and vibration resistant, due to the multiple points of contact between the droplet and the thermocouple and the Teflon film on the heater surfaces. The thermocouple also provides realtime droplet temperature feedback to ensure it reaches the set temperature before moving to the next chamber/step in PCR. The device is equipped to use either silicone oil or coconut oil. Coconut oil provides additional portability and ease of transportation by eliminating spilling because its high melting temperature means it is solid at room temperature.
Keywords: 16S rRNA, contact angle, polymerase chain reaction, smartphone, coconut oil
1. Introduction
Current methods for detecting Escherichia coli (E. coli) in samples include culture kits such as Colilert® (Idexx Laboratories, 2014), mass spectrometry (Sauer and Kliem, 2010), agar plate culture, and polymerase chain reaction (PCR) (Shannon et al., 2007). E. coli is a common foodborne and waterborne pathogen that may produce Shiga toxin (Griffin and Tauxe, 1991) and thus can be highly pathogenic. E. coli O157:H7 is the classic pathogenic strain of the bacterial species (Griffin and Tauxe, 1991). It was first suggested to be used as an indicator bacterium in the 1890's, and it has become one of the most commonly used indicator bacteria for fecal contamination of water supplies (Prescott and Winslow, 1931). There have been various criteria proposed to qualify a good indicator bacterium (Myers et al., 2014). Currently, no organism meets all criteria perfectly. E. coli is the ideal indicator because it can be detected by tests that are sensitive, specific, simple, and inexpensive, and it survives long enough to be detected (Edberg et al., 2000).
With many samples, the US Centers for Disease Control and Prevention (CDC) recommends culture as the best practice (CDC, 2012), which takes 18-24 h, depending on species, growth conditions, and sample quality. Contaminated food and water samples could be consumed within this 18–24 hour time period, so culture assay times are not fast enough to prevent illness. Unfortunately, the food and water safety industry is unable to monitor for potential contamination in real-time. While alternative methods, such as immunoassay-based microfluidics, have been suggested (Fronczek et al., 2013; Heinze et al., 2010; Han et al., 2008; Kwon et al., 2010; Angus et al., 2012), they are not yet scalable or sufficiently specific to identify different bacterial strains or pathogenicity.
A better alternative is to use PCR, which was invented in 1983 (Bartlett and Stirling, 2003) and has become the gold standard for identification and detection of specific DNA and RNA sequences from many biological agents (Murphy and Bustin, 2009). PCR can be used to detect the presence of a pathogen and to identify different strains, mutants, and pathogenic phenotypes (Beutin et al., 2002; Welsh et al., 1991; Welsh and McClelland, 1990; Punia et al., 2004). The need for biological amplification (growth in culture) is eliminated by PCR, which uses enzymatic amplification to enable detection more quickly. PCR is sensitive to low copy numbers because it exponentially amplifies a specific target sequence (Mullis et al., 1986). The speed, sensitivity, and specificity of PCR enable urgent detection of pathogens found in food and water samples.
In theory, PCR can be used to detect a single bacterium, virus, or fungal spore. In practice however, this is not the case, because detection by gel electrophoresis requires 0.5–5 ng of DNA per band (Life Technologies, 2014) and detection by fluorescence requires 1011 amplicons/μL (Zhu et al., 2012). To achieve detectable levels of amplification, greater than 30 thermal cycles are required, and it is well established that non-specific product formation can sabotage PCR specificity at high cycle numbers. Additionally, DNA extraction inefficiencies and the presence of PCR inhibitors in sample matrices make single-cell level detection difficult. Single-cell level identification by PCR requires sophisticated equipment and careful sample preparation under sterile conditions, which are difficult to obtain outside of a laboratory setting.
While PCR protocols for detection of Shiga toxin genes and other E. coli genes are available, the real-world use of PCR has several limitations. Laboratory equipment, including a centrifuge, thermocycler, gel electrophoresis chamber and power supply, and UV gel imaging station, is required that is not necessary for simple culture based assays. Additionally, sample preparation can take more than 60 min. Conventional, conduction-based PCR thermocycling can take 45–180 min, depending on the thermocycling efficiency and number of thermal cycles. Moreover, if the instrument is not equipped to perform quantitative PCR (qPCR), the process time is further increased by 40–120 min because of the necessity to perform agarose gel electrophoresis.
The use of a simple, rapid PCR assay would allow these limitations to be overcome. There have been numerous attempts to decrease PCR assay times. One approach is to reduce the reaction volume to the nanoliter or picoliter scale. This volume is substantially smaller than is used for conventional PCR (typically in the microliter scale), and enables faster heat transfer thus leading to faster assays (Yoon and Kim, 2012; Lee et al., 2006; Cheong et al., 2008). Direct laser irradiation of nanoliter droplets of PCR solution has been used to further increase heating rates (Kim et al., 2009). Numerous commercial nanoliter or picoliter PCR instruments have been developed and are currently being marketed (Baker, 2012). The major disadvantage of using this approach for pathogen detection is that the small sample volume leads to a poor limit of detection. For example, if the limit of detection of an E. coli PCR assay were 10 CFU/mL, one would need at least 108 CFU/mL to have at least 1 CFU of E. coli per 0.1 nL volume. At this concentration, amplification may not be necessary, and a simple lateral flow assay may be used. Therefore, various capture and concentration methods have been added to increase the target concentration prior to amplification (Lee et al., 2006; Cheong et al., 2008), which introduces more complication. Additional problems may arise in gene sequencing due to smaller volume and low product yield.
Another approach is the use of microliter-sized droplets in oil immersion, where the droplets are moved within a microfluidic channel (Li et al., 2011; Delibato et al., 2009), or on a flat, patterned substrate (Chang et al., 2006; Ohashi et al., 2007; You and Yoon, 2012) over three different temperature regions (for denaturation, annealing, and extension). (In conventional PCR systems, there is a heating block with tubes containing the sample, where conductive heating and cooling are repeated for multiple cycles.) For droplets on a patterned substrate, various droplet actuation methods have been demonstrated, including electrowetting-on-dielectric (EWOD) (Cho et al., 2003), surface acoustic wave (SAW) (Rocha-Gaso et al., 2009), and magnetofluidics (Egatz-Gόmez et al., 2006), to move a droplet from one temperature area to the other. In this manner, the time required for heating and cooling can be significantly reduced (Yoon and Kim, 2012). However, in both formats, heat transfer to the droplet is difficult to control because the temperature regions in a small device are in close proximity and heat is dissipated between the components. Since the droplets are continuously moving across different regions, temperature feedback from the droplet itself becomes critical, and most of the above attempts have not demonstrated such feedback.
For both nano- or picoliter PCR and microliter droplet PCR, real-time detection is essential in order to achieve rapid detection by PCR (gel electrophoresis requires additional 40-120 min). Real-time detection is commonly accomplished by measuring fluorescence from an intercalating dye such as SYBR Green I. Several techniques have also been developed to determine fragment size by electrophoretic separation of the fluorescently stained products (Easley et al., 2006; Huang et al., 2006).
In this paper, we present a rapid, easy-to-use, portable PCR device, capable of detecting the 16S rRNA gene found in bacteria. Our device uses wire-guided droplet manipulation (WDM) to move droplets between three different heating surfaces with oil immersion. PCR by WDM has been shown to provide enhanced convective heat transfer for decreased assay times and detection from complicated sample matrices (You and Yoon, 2012; Harshman et al., 2014). In our approach, we use 10 μL droplets, eliminating the need for highly concentrated samples or additional concentration steps.
In this work, we present the following improvements to PCR by WDM: 1) linear configuration of heating chambers for an even smaller device, 2) physical contact of the droplet to the heater surface to ensure shock and vibration resistance, while minimizing the surface contact area by increasing the contact angle, 3) use of a thermocouple as a wire-guide to collect droplet temperature feedback and to guarantee correct thermocycling temperatures, 4) use of a smartphone-based fluorescence microscope to perform end-point detection, and 5) use of coconut oil as the surrounding medium to provide additional portability.
2. Materials and Methods
2.1. Device
The device chamber and sled were designed using SolidWorks software (Dassault Systèmes, SolidWorks Corporation, Waltham, MA, USA) and fabricated using a Dimension uPrint Rapid Prototyping Device (Stratasys, Inc., Eden Prairie, MN, USA) with acrylonitrile butadiene styrene (ABS) material. This linear layout made the device smaller (1.3 L = 20.3 cm × 10.2 cm × 6.4 cm) than our previous design (13.3 L = 22.6 cm × 15.2 cm × 38.7 cm; Harshman et al., 2014). It also simplified the motor control and positioning by using a sled (Fig. 1A) without the need for correcting its position during thermocycling. The position of the droplet was controlled by a custom ordered linear actuator (part number: 21F4U-2.5; Haydon Kerk Motion Solutions, Inc., Waterbury, CT, USA). The linear actuator was driven by an EasyDriver motor driver (Sparkfun Electronics, Boulder, CO, USA), which was controlled by an Arduino Uno microcontroller. This Arduino Uno microcontroller also received feedback from a type-K thermocouple (Sparkfun Electronics), predominately composed of nickel that has been proven to be corrosion-resistant. The temperature sensitive junction of the thermocouple was physically immersed in the droplet. All programming was done in the Arduino software provided at Arduino.cc. Heater pads were designed using PCB Artist (Advanced Circuits, Aurora, CO, USA) and were ordered from Advanced Circuits. Surface-mounted type-K thermocouples (part number: SA1-K, Omega Engineering, Inc., Stamford, CT, USA) were additionally used to monitor the temperatures on the heater surfaces and provide feedback for a proportional-integral-derivative (PID) controller programmed into a secondary Arduino Uno microcontroller. Measurements from the surface-mounted and droplet immersed thermocouples were output to separate liquid crystal display screens (Sparkfun Electronics). Silicone oil was the primary immersive liquid (catalog number: 181838-1L; Sigma-Aldrich Co., St. Louis, MO, USA), but coconut oil (Spectrum Organic Products, Hain Celestial Group, Inc., Melville, NY, USA) was also used. The droplet was separated from the heaters using a hydrophobic Teflon film with a self-adhesive backing (product number: 2208T61; McMaster-Carr, Elmhurst, IL, USA) (Fig. 1B). All electronics, except the heaters, were powered by the Arduino's 5 V or 3.3 V outputs. Heaters were each powered by a 3.3 V power supply with 2 A maximum current (item number 9902 PS; Marlin P. Jones & Associates, Inc., Lake Park, FL, USA). The two Arduinos, one for heater surface temperature control and the other for motor control and droplet temperature measurements, were powered by a similar power supply at 9 V and shared a common ground.
Figure 1.

Schematic illustrations for the device layout and its operation. (A) All the major components of the device, less the circuit. A disposable cartridge, pre-loaded with solid coconut oil at room temperature and a droplet of PCR mixture (within the oil), is connected to the device. (B) The oil melts upon initial heating and the thermocouple loop picks up the droplet (PCR mixture + sample target). The sample solution is added to the PCR mixture droplet using a pipette. (C) In one complete thermal cycle, the droplet moves from the denaturation chamber (98°C), to the annealing chamber (50°C), and then to the extension chamber (80°C). The droplet returns back to the denaturation chamber to commence another cycle. The droplet is guided across the chambers by a thermocouple loop, and it contacts on the Teflon-coated heater surfaces. A PCB heater and a surface-mounted thermocouple control the oil temperature in each chamber. The droplet stays in each chamber until the thermocouple loop detects that it has reached the desired temperature (95°C, 56°C, and 72°C, respectively). (D) A pipette dislodges the droplet upon completion of PCR thermocycling. (E) The thermocouple loop and the metal guide are moved to the extension chamber to secure room for a smartphone microscope. 1 μL of 20× SYBR Green I dye solution is added to the droplet. (F) A smartphone-based fluorescence microscope measures fluorescence.
Circuit layout as seen on the breadboards. (A) There are 3 MAX31855, one for each surface-mounted thermocouple. Three JZC-11F relays, one for each heater. The temperature and PID settings are displayed on a 20×4 serial LCD (not shown). (B) The motor controller circuit, showing the AD595 used for the thermocouple loop, which measures internal droplet temperature. Also shown is the EasyDriver connected to the Arduino microcontroller and Haydon-Kerk linear stepper motor. The output of the thermocouple is displayed on another 20×4 serial LCD (not shown). There are 3 buttons, one for starting thermocycling and two for manually positioning the thermocouple loop and droplet. Images created using Fritzing software (Friends of Fritzing e.V., Berlin, Germany). T/C =temperature control.
2.2. Bacteria Culture
E. coli K12 was purchased from Sigma-Aldrich (catalog number: EC1-5G; Sigma-Aldrich). It was cultured overnight in Lysogeny broth (LB; catalog no: L2542-500ML; Sigma-Aldrich). Culture was counted using LB agar (BioExpress, Kaysvilo, UT, USA) grown overnight at 37°C.
2.3. PCR Reagents
PCR reaction mixtures consisted of the following in a 5:1:1:1:2 ratio: Promega GoTaq® Green Master Mix (catalog number: M7122; Promega Corporation, Madison, WI, USA); 10 μM forward and reverse primers with sequences AAACTCAAAKGAATTGACGG and TTACTCACCCGTICGCCRCT, respectively; E. coli K12 genomic DNA; and nuclease free water. These primers are designed to amplify the V3 hypervariable region of 16S rRNA gene, with the expected product at 196 bp. Genomic DNA was extracted using a QIAamp® DNA Micro Kit (catalog number 56304; Qiagen, Venlo, Limburg, Netherlands) as per the manufacturer's instructions. Genomic DNA was quantified using a Qubit 2.0 Fluorometer (catalog number: Q32871; Life Technologies) as per the manufacturer's instructions. A total of 10 μL was used for each assay, while the sample volume was 1 μL. A starting E. coli genomic DNA content was varied from 2.6 ng/sample (equivalent to 5.2 × 10⁵ genomic copies/sample) down to 5.2 pg/sample (equivalent to 103 genomic copies/sample).
2.4. Conventional PCR Thermocycling
Initial experiments were carried out in an MJ Research PTC-150 Minicycler (MJ Research, Inc.; Waltham, MA, USA). Thermocycling conditions for PCR were as follows: denaturation for 30 s at 95°C, annealing for 30 s at 56°C, and extension for 40 s at 72°C.
2.5. Contact Angle Analysis
The contact angle analysis was performed using FTÅ200 contact angle/surface tension analyzer (First Ten Ångstroms, Inc., Portsmouth, VA, USA). A water droplet of 10 μL volume was placed on the Teflon film in either silicone or coconut oil immersion, and snapshots were taken. These were then analyzed using the FTÅ32 software.
2.6. Arduino Programming
The Arduino code was written using the free Arduino version 1.0.5 software (Arduino.cc) and the PID program was modified from the code as developed by Harshman et al. (2014). Figure 1 schematically illustrates how the Arduino microcontrollers are connected and control the heaters and the motor through thermocouple feedback. Briefly, there was one surface-mounted thermocouple for each heating chamber (for annealing, extension, and denaturation, respectively). The thermocouple signal is amplified using three separate MAX31855 thermocouple amplifiers (product ID 269; Adafruit, New York City, NY, USA) and is sent to an Arduino microcontroller. The PID code used this real-time temperature feedback to adjust the on/off cycle time of the heaters in each individual chamber. This allowed for a stable temperature in each heating chamber after a short ramp time. The temperature outputs of the thermocouples, the set temperature of each chamber, and the rate of the cycle were displayed on a serial liquid crystal display (LCD).
A separate Arduino for motor control was connected to an EasyDriver as well as an AD595-AQ op-amp (model number COM-00306; Sparkfun Electronics). The AD595-AQ was connected to a single thermocouple that ran down the center of the metal guide and acted as the top anchor and temperature feedback device for the droplet. This Arduino recorded the internal droplet temperature and used it to move the motor to the next step or to remain in the current chamber for continued heating or cooling. The thermocouple temperature sensing junction was physically position within the droplet to provide the most accurate measurement of the droplet temperature. This Arduino also output the droplet temperature data, the current cycle number, and step of the cycle on an LCD.
2.7. Droplet Thermocycling
The temperatures of the heating chambers were set to 98°C, 80°C, and 50°C for the denaturation, extension, and annealing chambers, respectively. The set temperatures are slightly higher than the desired extension (72°C) and denaturation (94°C) temperatures and slightly lower than the desired annealing temperature (60°C) to increase heating or cooling efficiency. The droplet initially started from the right-side (denaturation chamber), moved to the left-side (annealing chamber) through the middle (extension chamber), finally moved to the middle-side extension chamber, and returned back to the right-side (Fig. 1C). 10 μL of PCR reaction mixture, with 1 μL of E. coli genomic DNA, was used in each droplet experiment. The temperature of the droplet was measured approximately once every second by the immersed thermocouple. Upon reaching the desired temperature, the droplet immediately left the current chamber. For extension, the droplet remained for approximately 5 s after reaching the desired temperature to allow sufficient time for extension by the DNA polymerase. The immersed thermocouple was bent to create a ring shape (“thermocouple loop”) around the droplet. The thermocouple loop holds the droplet steady by hydrophilic attraction and surface tension. The motion of the droplet is illustrated in Figure 2A.
Figure 2.

(A) Graphical representation of the droplet being held steady with the thermocouple loop while simultaneously reading the internal droplet temperature for feedback to the controller. (B) The water droplet on the Teflon-coated heater surface in silicone oil immersion (top) and coconut oil immersion (bottom). The contact angle in silicone oil immersion is 154 ± 2° (n = 6), and the contact angle in coconut oil immersion is 157 ± 1° (n = 6).
2.8. Gel Electrophoresis
PCR products were analyzed by agarose gel electrophoresis using a 3% w/v agarose gel (catalog number A0169; Sigma-Aldrich) in 1× Tris-acetate-EDTA (TAE) buffer (catalog number 24710-030; Life Technologies). Gel electrophoresis was run for 40 min at 120 V with an electrophoresis power supply (catalog number FB200; Thermo Fisher Inc., Pittsburg, PA, USA). A 1 kb Plus DNA Ladder (catalog number 10787; Life Technologies) was used as a standard for fragment sizing. Gels were stained with either ethidium bromide (catalog number E1510; Sigma-Aldrich) or GelRed (Biotium, Inc., Hayward, CA, USA). Gels were imaged under UV illumination. All experiments with Promega GoTaq® Colorless Master Mix were verified using gel electrophoresis.
2.9. End-Point Detection Using Smartphone-Based Fluorescence Microscope
Once the thermocycling is finished, 1 μL of 20× SYBR Green I (SG) dye, prepared from 10,000× SG (Molecular Probes – Life Technologies, Eugene, OR, USA), was added to the reaction droplet using a pipette, resulting in 2× SG in the final solution (Fig. 1D,E). The droplet was dislodged from the thermocouple loop using a pipette tip to ensure optimum image capture by the smartphone-based fluorescence microscope. (The thermocouple loop scattered a substantial amount of incident light, greatly overshadowing the fluorescence signal.) This microscope attachment, designed and fabricated in our laboratory (Fronczek et al., 2014), is essentially a 3D printed attachment to a smartphone (iPhone, Apple, Inc., Cupertino, CA, USA) that uses the digital camera as a secondary objective lens and an image capture device (Fig. 1F). This attachment incorporates a 466 nm super bright blue LED (catalog number YSL-R542B5C-A11, China Young Sun LED Technologies Co., Ltd., Shenzhen, China), a 492 ± 10 nm bandpass filter for this blue LED (catalog number #65-087, Edmund Optics, Barrington, NJ, USA), a 500 nm dichroic shortpass filter (catalog number #69-178, Edmund Optics), two 10× objective lens (catalog number LA1560-A, Thor Labs, Newton, NJ, USA), and a 520 ± 10 nm bandpass filter for the smartphone camera (catalog number #65-093, Edmund Optics). The plastic attachment was designed using SolidWorks software and fabricated using a Dimension uPrint Rapid Prototyping Device with acrylonitrile butadiene styrene (ABS) material.
All images were analyzed using ImageJ (National Institute of Health, Bethesda, MD, USA) and the red, green, and blue channels were analyzed simultaneously. Pixel intensities were measured from a circular region of the image surrounding the droplet. Average green pixel intensities were collected from three different experiments. All intensities were normalized to those of a negative target control (NTC; no target with PCR mixture, amplified for 30 thermal cycles).
2.10. Impact and Vibration Tests
In order to simulate an impact for the droplet within the device, the metal base plate shown in Figure 1 was hit with a plastic mallet repeatedly. For vibrational tests, the metal base plate was lifted slightly and shaken in a consistent manner. The experiments were duplicated for the pendant droplet method, to simulate the previously reported droplet PCR device (Harshman et al., 2014). The vibration frequency and impact energy were evaluated by analyzing video clips captured during the experiments. The impact energy was calculated from the mass of a hammer (m) and its velocity (v), using E = mv2/2.
3. Results and Discussion
3.1. Contact Angle Analysis
The contact angle of a sessile water-droplet on the Teflon-coated heater surface immersed in oil was measured. The contact angle in silicone oil immersion is 154 ± 2° (n = 6) and in coconut oil immersion is 156 ± 1° (n = 6) (Fig. 2B). Both contact angles are greater than 150° and classify as superhydrophobic. The superhydrophobicity of the Teflon-coated heater surface when immersed in oil results from the similarity between the oil-water and Teflon-water contact angles (110° and 115°, respectively). The superhydrophobic surface prevents contamination between samples and maintains convective heating between the surface and the droplet.
3.2. Surface-Heated Droplet PCR Detection of E. coli K12
In order to demonstrate PCR amplification on our surface-heated droplet PCR system, two positive control reactions containing 2.6 ng of E. coli K12 genomic DNA was thermocycled for 30 cycles at a thermocycling speed of 30 s/cycle. In addition, a no template control (NTC) sample was thermocycled. Amplification of the 196 bp product, corresponding to the 16S rRNA gene V3 region, was confirmed for the positive controls by gel electrophoresis (Fig. 3A; representative images from three different set of experiments). Amplification could not be detected for the NTC sample (Fig. 3A), indicating assay specificity. The reaction droplets had a final volume of 10 μL, with 1 μL target DNA. The positive control experiment was conducted with silicone oil immersion. It took 3 min to pre-heat the oil chambers to their desired temperatures from room temperature, and each sample took 15 min to thermocycle. The results of the positive control experiment provide a proof of concept that the device is functional and can be tested further.
Figure 3.

(A) Gel electropherogram showing results from the positive control experiment using 2.6 ng of genomic DNA (equivalent to 5.2×10⁵ genomic copies) extracted from E. coli K12 and thermocycled for 30 cycles, with thermal cycle times of 30 s, on the surface-heated droplet PCR device. The genomic DNA was quantified by a Qubit 2.0 fluorimeter. The 196 bp product band is at the expected location, and there is no band observed for the no template control (NTC) sample. (B) Gel electropherogram showing the result of the dilution test. Genomic DNA in the range of 2.6 ng to 5.2 pg (5.2×10⁵ − 103 genomic copies) was thermocycled for 30 cycles, with thermocycle times of 30 s, on the surface-heated droplet PCR device. The PCR with the lowest DNA content (5.2 pg or approximately 103 genomic copies) produced a visible band.
To determine the sensitivity of our system, we conducted a dilution test (Fig. 3B). For the dilution test, we thermocycled reactions containing genomic DNA from 2.6 ng to 5.2 pg (equivalent to 5.2×10⁵ – 103 genomic copies). Amplification was confirmed by gel electrophoresis by identifying a band in the correct location at 196 bp for all samples in the range tested. The results of the dilution test establish that the device is sufficiently sensitive to amplify the 16S rRNA gene V3 region from the equivalent of 103 copies of the E. coli genome (5.2 pg of genomic DNA; roughly corresponding to 103 colony forming units or CFU). This level of detection is significantly lower than our previous work, which had a detection limit of 105 genomic copies or 1 ng of genomic DNA (Harshman et al., 2014).
3.3. End-Point Detection with Smartphone Microscope
To eliminate the need for PCR product confirmation by gel electrophoresis, we have implemented end-point identification of PCR amplification using a smartphone-based fluorescence microscope (Fig. 4B). End-point detection has been demonstrated by amplifying the V3 hypervariable region of 16S rRNA gene from 1 ng to 1 pg of E. coli genomic DNA. After PCR amplification, a pipette was used to dislodge the droplet from the thermocouple loop (Fig. 1D) and to add SYBR Green I (SG) dye to the reaction droplet (Fig. 1E). By dislodging the droplet, the smartphone-based fluorescence microscope can be correctly positioned (Fig. 1F) and focused and the strong scattering of incident light by the thermocouple loop is avoided. A smartphone-based fluorescence microscope (Fig. 4B) is used to capture the green fluorescence image of the droplet while it is still immersed in oil within the device. The excitation light from the blue LED is filtered by the 492 ± 10 nm bandpass filter and is transmitted through the 500 nm dichroic mirror. The excitation light is focused on the droplet by a lens. The SG emission is reflected at a 90° angle by the dichroic mirror towards the smartphone camera. Before the green fluorescence image of the droplet reaches the camera it is filtered by a 500 ± 10 nm bandpass filter to remove scattered blue light. The use of the bandpass filters and a dichroic mirror ensure that the smartphone captures only SG fluorescence. The average green pixel intensity of the fluorescence images is subsequently analyzed using ImageJ software, and is normalized to that of a NTC droplet. The normalized intensities are plotted against the initial target concentration and show an increasing trend as the initial DNA content increases (Fig. 4A). Representative fluorescence images taken by the smartphone are shown for each concentration in Figure 4A. The bands at 196 bp on the gel electropherogram from the same experiments were also quantified, normalized, and plotted against initial DNA content (Fig. 4A). The results of the dilution test and the end-point detection test show good agreement. The increasing trend is similar whether detection is made by the smartphone-based fluorescence microscope or by gel electrophoresis. Additionally, the smartphone-based fluorescence microscope could be adapted to work with other types of smartphones.
Figure 4.

(A) Normalized intensity is plotted against the E. coli genomic DNA content of the reaction. Green bars (left) show the average green pixel intensities of the images taken with the smartphone-based fluorescence microscope of a droplet on the device after thermocycling. Purple bars (right) show the average band intensities for the same amplifications analyzed by gel electrophoresis. All results are normalized to no target controls (NTC = no E. coli gene + PCR mixture, amplified for 30 cycles). All results are the mean of three different experiments and error bars represent standard error. Representative fluorescence images of the droplet on the device are shown above the chart for each concentration. (B) Schematic of the optical layout of the smartphone-based fluorescence microscope, which is contained within the 3D printed housing. The excitation source is a 466 nm blue LED that is filtered by a 492 ± 10 nm bandpass filter. A 500 nm dichroic shortpass filter separates the excitation light from the fluorescence emission from the droplet. The emission is further filtered by a 520 ± 10 nm bandpass filter before reaching the smartphone camera. Two lenses are used to focus the light at the position of the droplet and on the smartphone camera.
3.4. Portability: Vibration and Impact Shock Tests and Coconut Oil
In order to evaluate the resistance to vibration and impact shock, the surface-heated droplet PCR system was vibrated at a frequency of 1 Hz and impacted with an energy of 3.59 mJ. The energy of the impact shock was calculated using E = mv2/2; the mass of the hammer was 227 g and its velocity was 17.8 cm/s. The vibration frequency and impact energy were evaluated by analyzing video clips captured during the experiments, and still images taken from the video are shown in Figure 5A. Our surface-heated droplet PCR method is compared with the pendant droplet method reported by Harshman et al. (2014). Still images of both methods are shown during and after vibration and during and after impact shock (during and after images are taken within 1 s of each other). The surface-heated droplet PCR method withstood both vibration and impact shock, whereas the pendant droplet was dislodged by both vibration and impact shock. When the pendant droplet was dislodged, it was unable to be recovered, causing assay failure. These tests demonstrate the increased stability of the surface-heated droplet PCR system compared with the pendant droplet PCR system. This increased stability is a result of the droplet-thermocouple and the droplet-surface contact points. The robustness of the device will potentially enable it to be use in field situations such as within a moving vehicle.
Figure 5.
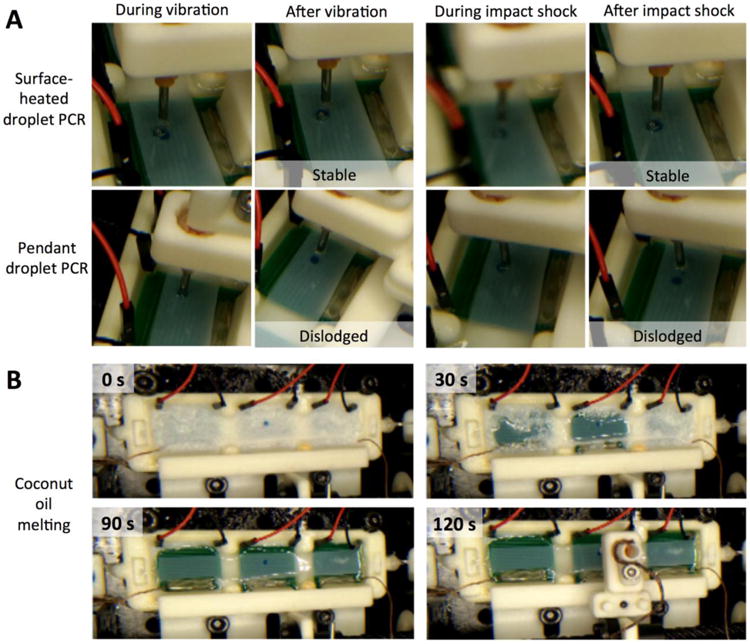
(A) Still images taken from a video of the vibration and impact shock tests of the surface-heated droplet PCR and the pendant droplet PCR methods. Images are shown during and after vibration and during and after impact shock (the during and after images are taken within 1 s of each other). The surface-heated droplet PCR method was able to successfully recover from vibration and impact shock and maintain droplet control. In comparison, the pendant droplet PCR method (where the droplet hangs from a syringe needle) was unable to recover from neither the vibration nor the impact shock and the droplet was dislodged from the needle tip. (B) Images taken from Supplementary Video 1 of the coconut oil melting with a 9 μL droplet of PCR mixture contained within. The images are taken at 0, 30, 90, and 120 s.
The use of coconut oil provides additional portability to the proposed system. Unlike silicone oil, coconut oil is a solid at room temperature. The coconut oil remains solid until the cartridge begins heat ramping from room temperature to the desired chamber temperatures (Fig. 5B). The oil melting process takes approximately 120 s and the heater surface temperatures stabilize in approximately 300 s. Because the coconut oil is solid at room temperature, the pre-filled cartridge is not susceptible to spilling when tilted or to cross-contamination. Additionally, a droplet of PCR mixture can be stored within the solid coconut oil to be used upon melting.
The operation and portability of the system with coconut oil are demonstrated in Figure 1 and in Supplementary Material 1. The cartridge is pre-loaded with solid coconut oil that encompasses a 9 μL droplet of PCR mixture. Once the cartridge is attached to the system and the chambers are heated to the desired temperatures for denaturation, annealing and extension, the coconut oil melts completely. The melted coconut oil provides the necessary oil immersion environment. After melting, a 1 μL sample of bacterial genomic DNA is added to the droplet. The resulting droplet is subsequently thermocycled by moving it over the three heated surfaces. After thermocycling is complete, the droplet can be dislodged from the thermocouple and imaged by the smartphone-based fluorescence microscope. The entire cartridge is relatively inexpensive and can be made disposable to avoid cross-contamination. Together with the vibration- and shock-proof nature described in the above, the device can be used as a rapid and field-deployable PCR assay system.
4. Conclusion
Polymerase chain reaction (PCR) by wire-guided droplet manipulation (WDM), as demonstrated in Harshman et al. (2014), is an excellent method to increase the heat transfer efficiency and to resolve inhibition effects of sample matrices. Taking advantage of the benefits of PCR by WDM, we have developed a surface-heated droplet PCR system that is simpler and has the following improvements: droplet stability, droplet temperature feedback, portability, and end-point detection. To increase the droplet stability, we replaced the syringe needle with a thermocouple loop, which also provides temperature feedback, and placed the droplet in contact with the Teflon-coated heater surface. The droplet stability, reduced complexity, smaller size, and use of coconut oil allow for portability and for in-field use. Due to its low power consumption, the device could be powered by lithium ion batteries, which supply 3.7 V. The heaters are currently powered by 3.3 V and 2 A (6.6 W maximum power), and all the other electronic components are powered by the Arduino's 3.3 V outputs at 150 mA (0.5 W maximum power). The maximum power consumption of the entire device is 7.1 W, and lithium-ion batteries can provide up to 265 Wh/kg. So the minimum size of a battery pack to run the device for 19 min at a maximum power of 7.1 W is only 8.5 g.
The addition of a smartphone-based fluorescence microscope allows for end-point detection of PCR amplification. By this method, PCR results are provided faster than with gel electrophoresis and with simpler equipment. A conventional qPCR system will take at least 45 min to display results from a 30-cycle assay. In contrast, our system does not need a laboratory environment and provides a result in 19 min (3 min for pre-heating the cartridge and melting the coconut oil, 15 min for thermocycling, and 1 min for adding SYBR Green I dye to the droplet). Specifically, detection by the smartphone-based fluorescence microscope is achieved nearly immediately. The food and water safety industry is in need of tools for real-time monitoring of pathogens, and our simple, stable and portable system allows the sensitive and specific PCR assay to be conducted in the field. Our system combines rapid thermocycling and smartphone-based end-point detection to provide results quickly, to communicate the results remotely, and ultimately to prevent disease outbreaks in the food and water supply.
Supplementary Material
Supplementary Video 1. A video demonstrating the portability of the droplet PCR system with coconut oil. The heating chambers are pre-filled with coconut oil that is solid at room temperature. Once the heaters are turned on, the coconut oil melts, revealing a 9 μL droplet of PCR mixture. A 1 μL sample that may contain bacterial genomic DNA is added to the droplet of PCR mixture, and the resulting droplet is subsequently thermocycled by moving across the surface of three heating chambers.
Highlights.
- Linear configuration of heating chambers for a smaller device.
- Superhydrophobic contact of a droplet to the heater for shock/vibration resistance.
- Use of a thermocouple loop as a wire-guide to collect droplet temperature feedback.
- A smartphone-based fluorescence microscope performs immediate, end-point detection.
- Use of coconut oil as the surrounding medium to provide additional portability.
Acknowledgments
This work was supported by the research grant from the Animal and Plant Quarantine Agency, South Korea (I-1541780-2012-13- 0101). DKH acknowledges the training grant support from the Cardiovascular Biomedical Engineering Training Grant from U.S. National Institutes of Health (T32HL007955).
Footnotes
Publisher's Disclaimer: This is a PDF file of an unedited manuscript that has been accepted for publication. As a service to our customers we are providing this early version of the manuscript. The manuscript will undergo copyediting, typesetting, and review of the resulting proof before it is published in its final citable form. Please note that during the production process errors may be discovered which could affect the content, and all legal disclaimers that apply to the journal pertain.
References
- Angus SV, Kwon HJ, Yoon JY. J Environ Monit. 2012;14:3295–3304. doi: 10.1039/c2em30700f. [DOI] [PubMed] [Google Scholar]
- Baker M. Nat Meth. 2012;9:541–544. [Google Scholar]
- Bartlett JMS, Stirling D. PCR Protocols. 2nd. Humana Press; New Jersey: 2003. [Google Scholar]
- CDC (United States Centers for Disease Control and Prevention) Guidance for Public Health Laboratories on the Isolation and Characterization of Shiga Toxin-Producing Escherichia coli (STEC) from Clinical Specimens. [accessed 17.07.2014];2012 http://www.cdc.gov/ecoli/clinicians.html.
- Chang YH, Lee GB, Huang FC, Chen YY, Lin JL. Biomed Microdev. 2006;8:215–225. doi: 10.1007/s10544-006-8171-y. [DOI] [PubMed] [Google Scholar]
- Cheong KH, Yi DK, Lee JG, Park JM, Kim MJ, Edel JB, Ko C. Lab Chip. 2008;8:810–813. doi: 10.1039/b717382b. [DOI] [PubMed] [Google Scholar]
- Cho SK, Moon H, Kim CJ. J Microelectromech Syst. 2003;12:70–80. [Google Scholar]
- Delibato E, Gattuso A, Minucci A, Auricchio B, De Medici D, Toti L, Castagnola M, Capoluongo E, Gianfranceschi MV. J Sep Sci. 2009;32:3817–3821. doi: 10.1002/jssc.200900166. [DOI] [PubMed] [Google Scholar]
- Easley CJ, Karlinseq JM, Bienvenue JM, Legendre LA, Roper MG, Feldman SH, Hughes MA, Hewlett EL, Merkel TJ, Ferrance JP, Landers JP. Proc Natl Acad Sci USA. 2006;103:19272–19277. doi: 10.1073/pnas.0604663103. [DOI] [PMC free article] [PubMed] [Google Scholar]
- Edberg S, Rice E, Karlin R, Allen M. J Appl Microbiol. 2000;88:106S–116S. doi: 10.1111/j.1365-2672.2000.tb05338.x. [DOI] [PubMed] [Google Scholar]
- Egatz-Gómez A, Melle S, García AA, Lindsay SA, Márquez M, Domínguez-García P, Rubio MA, Picraux ST, Taraci JL, Clement T, Yang D, Hayes MA, Gust D. Appl Phys Lett. 2006;89:034106. [Google Scholar]
- Fronczek CF, You DJ, Yoon JY. Biosens Bioelectron. 2013;40:342–349. doi: 10.1016/j.bios.2012.07.076. [DOI] [PubMed] [Google Scholar]
- Fronczek CF, Park TS, Harshman DK, Nicolini AM, Yoon JY. RSC Adv. 2014;4:11103–11110. [Google Scholar]
- Griffin PM, Tauxe RV. Epidemiol Rev. 1991;13:60–98. doi: 10.1093/oxfordjournals.epirev.a036079. [DOI] [PubMed] [Google Scholar]
- Han JH, Heinze BC, Yoon JY. Biosens Bioelectron. 2008;23:1303–1306. doi: 10.1016/j.bios.2007.11.013. [DOI] [PubMed] [Google Scholar]
- Harshman DK, Reyes R, Park TS, You DJ, Song JY, Yoon JY. Biosens Bioelectron. 2014;53:167–174. doi: 10.1016/j.bios.2013.08.057. [DOI] [PMC free article] [PubMed] [Google Scholar]
- Heinze BC, Gamboa JR, Kim K, Song JY, Yoon JY. Anal Bioanal Chem. 2010;398:2693–2700. doi: 10.1007/s00216-010-4201-y. [DOI] [PubMed] [Google Scholar]
- Huang FC, Liao CS, Lee GB. Electrophoresis. 2006;27:3297–3305. doi: 10.1002/elps.200600458. [DOI] [PubMed] [Google Scholar]
- Idexx Laboratories. Colilert Water Testing Product Information, 2014. [accessed 17.07.2014];2014 https://www.idexx.com/water/products/colilert.html.
- Kim H, Dixit S, Green CJ, Faris GW. Optics Express. 2009;17:283–289. doi: 10.1364/oe.17.000218. [DOI] [PMC free article] [PubMed] [Google Scholar]
- Kwon HJ, Dean ZS, Angus SV, Yoon JY. JALA: J Assoc Lab Autom. 2010;15:216–223. [Google Scholar]
- Lee JG, Cheong KH, Huh N, Kim S, Choi JW, Ko C. Lab Chip. 2006;6:886–895. doi: 10.1039/b515876a. [DOI] [PubMed] [Google Scholar]
- Li YY, Zhang CS, Xing D. Anal Biochem. 2011;415:87–96. doi: 10.1016/j.ab.2011.04.026. [DOI] [PubMed] [Google Scholar]
- Life Technologies. Ethidium Bromide (EtBr) Dye for DNA and RNA Detection. [accessed 17.07.2014];2014 http://www.lifetechnologies.com/us/en/home/life-science/dna-rna-purification-analysis/nucleic-acid-gel-electrophoresis/dna-stains/etbr.html.
- Mullis K, Faloona F, Scharf S, Saiki GH, Erlich H. Cold Spring Harb Symp Quant Biol. 1986;51:263–273. doi: 10.1101/sqb.1986.051.01.032. [DOI] [PubMed] [Google Scholar]
- Murphy J, Bustin SA. Expert Rev Mol Diagn. 2009;9:187–197. doi: 10.1586/14737159.9.2.187. [DOI] [PubMed] [Google Scholar]
- Myers D, Stoeckel D, Bushon R. Fecal Indicator Bacteria (ver. 2.0): US Geological Survey Techniques of Water-Resources Investigations, TWRI Book 9. [accessed 05.08.2014];2014 http://water.usgs.gov/owq/FieldManual/Chapter7/7.1.html.
- Ohashi T, Kuyama H, Hanafusa N, Togawa Y. Biomed Microdev. 2007;9:695–702. doi: 10.1007/s10544-007-9078-y. [DOI] [PubMed] [Google Scholar]
- Prescott SC, Winslow CEA. Elements of Water Bacteriology: With Special Reference to Sanitary Water Analysis. 5th. Wiley; New York: 1931. [Google Scholar]
- Rocha-Gaso MI, March-Iborra C, Montoya-Baides A, Arnau-Vives A. Sensors. 2009;9:5740–5769. doi: 10.3390/s90705740. [DOI] [PMC free article] [PubMed] [Google Scholar]
- Sauer S, Kliem M. Nat Rev Microbiol. 2010;8:74–82. doi: 10.1038/nrmicro2243. [DOI] [PubMed] [Google Scholar]
- Shannon KE, Lee DY, Trevors JT, Beaudette LA. Sci Total Environ. 2007;382:121–129. doi: 10.1016/j.scitotenv.2007.02.039. [DOI] [PubMed] [Google Scholar]
- Welsh J, McClelland M. Nucleic Acids Res. 1990;18:7213–7218. doi: 10.1093/nar/18.24.7213. [DOI] [PMC free article] [PubMed] [Google Scholar]
- Welsh J, Petersen C, McClelland M. Nucleic Acids Res. 1991;19:303–306. doi: 10.1093/nar/19.2.303. [DOI] [PMC free article] [PubMed] [Google Scholar]
- Yoon JY, Kim B. Sensors. 2012;12:10713–10741. doi: 10.3390/s120810713. [DOI] [PMC free article] [PubMed] [Google Scholar]
- You DJ, Yoon JY. J Biol Eng. 2012;6:15. doi: 10.1186/1754-1611-6-15. [DOI] [PMC free article] [PubMed] [Google Scholar]
- Zhu Z, Jenkins G, Zhang W, Zhang M, Guan Z, Yang CJ. Anal Bioanal Chem. 2012;403:2127–43. doi: 10.1007/s00216-012-5914-x. [DOI] [PubMed] [Google Scholar]
Associated Data
This section collects any data citations, data availability statements, or supplementary materials included in this article.
Supplementary Materials
Supplementary Video 1. A video demonstrating the portability of the droplet PCR system with coconut oil. The heating chambers are pre-filled with coconut oil that is solid at room temperature. Once the heaters are turned on, the coconut oil melts, revealing a 9 μL droplet of PCR mixture. A 1 μL sample that may contain bacterial genomic DNA is added to the droplet of PCR mixture, and the resulting droplet is subsequently thermocycled by moving across the surface of three heating chambers.