

Abstract
Background
Malnutrition, weight loss, and muscle wasting (sarcopenia) are common among women with advanced ovarian cancer and have been associated with adverse clinical outcomes and survival. Our objective is to investigate overall survival (OS) related to changes in skeletal muscle (SM) for patients with advanced ovarian cancer treated with neoadjuvant chemotherapy and interval debulking.
Methods
Ovarian cancer patients (n = 123) treated with neoadjuvant chemotherapy and interval debulking in the area of Maastricht (the Netherlands) between 2000 and 2014 were included retrospectively. Surface areas of SM and adipose tissue were defined on computed tomography at the level of the third lumbar vertebra. Low SM at baseline and SM changes during chemotherapy were compared with Kaplan Meier curves, and Cox‐regression models were applied to test predictors of OS.
Results
Median OS for patients who lost SM (n = 83) was 916 ± 99 days, which was significantly different from median OS for patients who maintained or gained SM (n = 40), which was 1431 ± 470 days (P = 0.004). Loss of SM was also a significant predictor of OS in multivariable Cox‐regression analysis (hazard ratio 1.773 (95%CI: 1.018–3.088), P = 0.043). Low baseline SM did not influence survival.
Conclusions
Patients with ovarian cancer have a worse survival when they lose SM during neoadjuvant chemotherapy. Evaluation of low SM at a specific time point is not prognostic for OS. External and prospective validation of these findings is imperative. Nutritional, pharmacological, and/or physical intervention studies are necessary to establish whether SM impairment can be prevented to prolong ovarian cancer survival.
Keywords: Sarcopenia, Body composition, Computed tomography, Survival, Ovarian neoplasms, Induction chemotherapy
Introduction
Although survival rates have improved over the past decades, ovarian cancer still has the highest mortality of the gynaecological malignancies.1 Ovarian cancer is responsible for 150 000 deaths worldwide annually, and 5‐year survival in Europe and the USA is 38–45%.1, 2, 3 Prognostic factors that have been identified for women diagnosed with ovarian cancer are age, performance status, histologic tumour type, tumour stage (Fédération Internationale de Gynécologie et d'Obstétrique, FIGO stage), and preoperative tumour load.4, 5 However, complete resection of macroscopic tumour at cytoreductive surgery has been found to be the most important prognostic factor, and it is vital that surgery is always aimed at achieving this goal.4, 5 Primary debulking is the preferred treatment for patients with advanced ovarian cancer. When primary debulking is not possible because the patient's physical condition does not allow it or it is estimated that complete tumour resection cannot be accomplished, neoadjuvant chemotherapy followed by interval debulking provides an alternative treatment option with comparable survival rates.5
Cancer cachexia, a syndrome of involuntary weight loss and muscle wasting, is common among women with advanced ovarian cancer and has also been associated with adverse clinical outcomes and survival.6 However, weight loss is a poor indicator of disease status in ovarian cancer considering the fact that it is frequently not apparent because of growing volumes of ascites, oedema, or the tumour itself including its metastases. In like manner, other changes such as muscle wasting or accumulation of adipose tissue in different compartments of the body remain indiscernible to the beholder when bodyweight alone is evaluated. In recent years, the understanding of cancer‐related weight loss has therefore guided research to the study of body composition features rather than bodyweight alone. Computed tomography (CT) has been extensively studied and applied in this field and has the advantage that scans are often readily available for cancer patients. CT imaging enables precise quantification of skeletal muscle (SM) mass and different adipose depots on a single slice, which can be used to estimate total body muscle and fat mass.7, 8 Cross‐sectional analysis of tissue at the level of the third lumbar vertebra (L3) strongly correlates with total body adipose and muscle mass and has thus been widely adopted for characterization of cancer patients.7, 9, 10 Among the compartments that can be distinguished on CT are SM, intramuscular adipose tissue (IMAT), visceral adipose tissue (VAT), and subcutaneous adipose tissue (SAT).
Severe loss of SM mass—known as sarcopenia—is associated with poor survival in patients with various types of cancer.11, 12, 13, 14 Adverse effects are also seen from redistribution of adipose tissue from subcutaneous depots to storage sites in SM and the abdominal cavity.11, 15, 16 Studies concerning body composition and survival in patients with ovarian cancer are scarce. In a retrospective study of advanced ovarian cancer patients undergoing primary debulking surgery, SM and VAT were not predictive of survival, but low combined SAT + IMAT was associated with worse overall survival (OS).17 These results have not been confirmed by others. Changes in body composition in patients undergoing neoadjuvant or palliative chemotherapy have been evaluated in oesophageal, gastric, pancreatic, and lung cancer.18, 19, 20, 21 These studies have included relatively small numbers of patients, which makes it difficult to assess the validity of their findings. The impact of neoadjuvant chemotherapy on muscle mass in ovarian cancer patients has not been investigated.
This study aims to investigate OS in patients with ovarian cancer related to the changes in SM mass and body composition arising during neoadjuvant chemotherapy.
Methods
Eligible patients
This study has been approved by the local Medical Ethics Committee and has been performed in accordance with the ethical standards laid down in the 1964 Declaration of Helsinki. The Medical Ethics Committee waived the requirement for obtaining informed consent.
A retrospective study was performed including patients with advanced ovarian cancer (FIGO 2013 stage IIB‐IV) who were treated with neoadjuvant chemotherapy prior to interval debulking in the Maastricht University Medical Centre (Maastricht, the Netherlands) between January 2000 and June 2014. Subjects were eligible for inclusion when the following criteria were met: (i) a routine abdominal CT scan was performed before the start of neoadjuvant chemotherapy and a second abdominal CT scan before interval debulking (typically after 3–4 cycles of chemotherapy), (ii) both CT scans were of sufficient quality to perform accurate measurements of tissue area, and (iii) sufficient relevant clinical data could be retrieved from the patient's file. OS was computed from the date of the initial CT scan up to the date of death from any cause. The CT date was chosen instead of the date of diagnosis because this date could not be retrieved for all patients. For patients who were still alive at the time of analysis, a fixed date was set for data collection, and all patients were censored at this date, which was at least 6 months after the last included subject was diagnosed.
The following clinical characteristics were recorded: age, FIGO stage, length, weight, weight loss preceding diagnosis, number of chemotherapy cycles, days between CT scans, percentage weight loss during chemotherapy, and surgical outcome. Age was evaluated at the time of the initial CT scan and categorized into <60 years, 61–70 years and >70 years. Reported weight and length were used to calculate body mass index (BMI) in kg/m2. Patients were assigned to BMI categories established by the World Health Organization: BMI <18.5 = underweight, BMI 18.5–24.9 = normal weight, BMI 25–29.9 = overweight and BMI >30 = obese.22 The outcome of interval debulking was categorized into complete (no visible evidence of macroscopic residual disease), optimal (macroscopic residual disease < 1 cm), or incomplete (macroscopic residual disease > 1 cm).
Body composition measurements
For each CT scan, a single axial slice at the level of L3 was selected. Image analysis software, SliceOmatic v5.0 (Tomovision, Montreal, QC, Canada), was used to demarcate SM, IMAT, VAT, and SAT according to predefined validated boundaries based on the number of Hounsfield Units (HU). An example of how tissues were measured with SliceOmatic software is shown in Figure 1. The following thresholds were applied: −29 to +150 HU for SM, −190 to −30 HU for IMAT and SAT, and −150 to −50 HU for VAT. A single assessor who was trained in the anatomy of the specific tissues of interest evaluated all scans subsequently, and the surface areas in square centimeter were quantified automatically based on the demarcations. The assessor was not aware of the outcome of the patients. Total adipose tissue (TAT) was computed by summating IMAT, VAT, and SAT. The surface area of SM was normalised for stature to compute the SM index (SMI) in cm2/m2. The median SMI at baseline from our own population was used to divide patients in a low muscle mass group (SMI below median) and a high muscle mass group (SMI equal to or above median).
Figure 1.

Body composition analysis with SliceOmatic®.
Changes in surface area between CT scans were expressed as a percentage. This percentage change was divided by the number of days between scans and multiplied by 100 days to provide a standard measure for all patients (percent change per 100 days). A measurement error of 2% was adopted based on previously reported accuracy of CT for muscle and fat tissue analysis.7 Changes between −2% and +2% were thus considered ‘maintenance of tissue’. Finally, changes were dichotomised into loss of tissue (>2% decrease per 100 days) and maintenance/gain of tissue (any increase or ≤2% decrease). For practical reasons, the term ‘gain of tissue’ will hereafter be used to describe both maintenance and gain of tissue.
Statistical analysis
The mean changes in muscle and adipose tissue were analyzed with paired t‐tests, and the mean percentage change per 100 days was calculated for SM, IMAT, VAT, SAT, and TAT. Survival curves were computed using Kaplan–Meier estimates with log‐rank tests. ‘Low baseline SMI’ was compared with ‘high baseline SMI’, and ‘loss of SM’ was compared with ‘gain of SM’. Baseline characteristics were analyzed with independent t‐tests for continuous variables and chi‐squared or Fisher's exact tests for categorical variables. Statistical significance for all comparative tests was determined at P < 0.05.
Univariable and multivariable proportional hazards Cox‐regression models were applied to test predictors of OS and calculate individual hazard ratio's (HR) with 95% confidence intervals (95%CI). Clinical variables and body composition parameters were initially tested as effect modifiers in a univariable model at a significance level of 10%. All significant variables were then tested together in a multivariable model in which a significance level of 5% was applied. The continuous variables that were tested were age, BMI (pre‐chemotherapy and post‐chemotherapy), weight loss during chemotherapy, weight loss preceding diagnosis, and number of cycles of chemotherapy. Age and BMI were also assessed categorically. The categorical variables of main interest were changes in SM, IMAT, VAT, SAT, and TAT during chemotherapy in which loss of tissue was compared with gain of tissue. The remaining categorical variables tested were low SMI at baseline and after chemotherapy (yes or no), FIGO stage IV (in comparison with FIGO stages II and III combined), presence of ascites (yes or no), and complete interval debulking (in comparison with optimal and incomplete interval debulking). All subjects were analyzed and missing data were indicated separately when applicable. All analyses were performed with the statistical software package SPSS v20.0 (IBM Corp, Chicago, IL, USA).
Results
We identified 566 patients that were treated for ovarian cancer in the Maastricht University Medical Centre between January 2000 and June 2014 (Figure 2). After exclusion of 436 patients (patients with non‐advanced disease, patients without CT examinations, patients who only underwent primary debulking, and/or patients without sufficient clinical data), 130 patients were evaluated with CT measurements. Another seven patients were excluded either because of missing CT scans pre‐chemotherapy or post‐chemotherapy or because of insufficient quality of the scans. Final analysis was conducted on 123 patients with 246 CT scans. Baseline characteristics for the included subjects are presented in Table 1. At the time of censoring, 52 out of 123 patients (42%) were still alive. Follow‐up for this group was at least 6 months and ranged from 231 to 3850 days with a median of 681 days.
Figure 2.
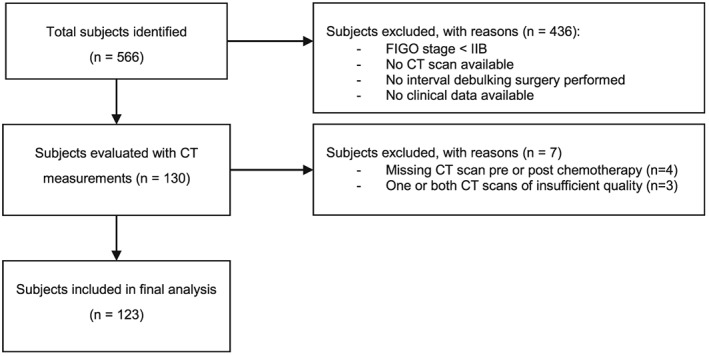
Flow diagram.
Table 1.
Baseline characteristics
| All patients (n = 123) | SM loss (n = 83) | SM gain (n = 40) | ||
|---|---|---|---|---|
| Age in years | mean ± SE (range) | 66.5 ± 0.8 (39–86) | 67.6 ± 1.0 (48–86) | 64.2 ± 1.6 (39–82) |
| <60 years | n (%) | 33 (26.8) | 18 (21.7) | 15 (37.5) |
| 61–70 years | n (%) | 46 (37.4) | 31 (37.3) | 15 (37.5) |
| >70 years | n (%) | 44 (35.8) | 34 (41.0) | 10 (25.0) |
| FIGO stage | ||||
| II | n (%) | 2 (1.6) | 2 (2.4) | 0 (0.0) |
| III | n (%) | 79 (64.2) | 53 (63.9) | 26 (65.0) |
| IV | n (%) | 42 (34.1) | 28 (33.7) | 14 (35.0) |
| BMI in kg/m2 PRE chemotherapy | mean ± SE | 25.9 ± 0.5 | 26.6 ± 0.5 | 24.5 ± 0.9 |
| Underweight (BMI < 18.5) | n (%) | 2 (1.6) | 1 (1.2) | 1 (2.5) |
| Normal weight (BMI 18.5‐24.9) | n (%) | 31 (25.2) | 17 (20.5) | 14 (35.0) |
| Overweight (BMI 25.0‐29.9) | n (%) | 34 (27.6) | 25 (30.1) | 9 (22.5) |
| Obese (BMI > 30.0) | n (%) | 10 (8.1) | 8 (9.6) | 2 (5.0) |
| Missing values | n (%) | 46 (37.4) | 32 (38.6) | 14 (35.0) |
| BMI in kg/m2 post‐chemotherapy | mean ± SE | 25.0 ± 0.3 | 25.5 ± 0.4 | 24.1 ± 0.6 |
| Underweight (BMI < 18.5) | n (%) | 1 (0.8) | 0 (0.0) | 1 (2.5) |
| Normal weight (BMI 18.5‐24.9) | n (%) | 61 (49.6) | 39 (47.0) | 22 (55.0) |
| Overweight (BMI 25.0‐29.9) | n (%) | 43 (35.0) | 31 (37.3) | 12 (30.0) |
| Obese (BMI > 30.0) | n (%) | 10 (8.1) | 8 (9.6) | 2 (5.0) |
| Missing values | n (%) | 8 (6.5) | 5 (6.0) | 3 (7.5) |
| Weight loss preceding diagnosis in kga | mean ± SE | −3.7 ± 0.6 | −3.7 ± 0.8 | −3.7 ± 1.0 |
| SMI at baseline in cm2/m2 | mean ± SE | 41.7 ± 0.5 | 42.8 ± 0.6c | 39.3 ± 0.9c |
| Low baseline SMI (SMI < 41.5) | n (%) | 62 (50.4) | 34 (41.0)c | 28 (70.0)c |
| SMI after chemotherapy in cm2/m2 | mean ± SE | 39.8 ± 0.5 | 39.3 ± 0.5 | 40.7 ± 0.9 |
| Low SMI after chemotherapy (SMI < 41.5) | n (%) | 80 (65.0) | 56 (67.5) | 24 (60.0) |
| Cycles of neoadjuvant chemotherapy | mean ± SE | 3.43 ± 0.1 | 3.5 ± 0.1 | 3.4 ± 0.1 |
| 3 | n (%) | 87 (70.7) | 58 (69.9) | 29 (72.5) |
| 4 | n (%) | 27 (22.0) | 19 (22.9) | 8 (20) |
| >5 | n (%) | 9 (7.3) | 6 (7.2) | 3 (7.5) |
| Days between CT scans | mean ± SE | 84 ± 1.77 | 84 ± 2.2 | 84 ± 3.0 |
| Percentage weight loss during chemotherapyb | mean % ± SE | −3.6 ± 0.8 | −4.8 ± 1.0c | −1.4 ± 1.1c |
| Outcome interval debulking | ||||
| Complete | n (%) | 56 (45.5) | 34 (41.0) | 22 (55.0) |
| Optimal | n (%) | 42 (34.1) | 31 (37.3) | 11 (27.5) |
| Incomplete | n (%) | 25 (20.3) | 18 (21.7) | 7 (17.5) |
| Presence of ascites | n (%) | 67 (54.5) | 43 (51.8) | 24 (60.0) |
| OS in days | median ± SD | 986 ± 111 | 916 ± 99c | 1431 ± 470c |
SE, standard error of the mean; SM, skeletal muscle; BMI, body mass index; SMI, skeletal muscle index; CT, computed tomography; OS, overall survival.
Missing values: 58/123 missing
Missing values: 53/123 missing.
Significant differences between SM loss and SM gain (P < 0.05, independent‐samples t‐test or chi‐squared test).
Body composition at baseline
Mean body composition measurements at baseline are shown in Table 2. Median SMI at baseline was 41.5 cm2/m2, which was used as cut‐off to define high and low baseline SMI in the study population.
Table 2.
Body composition changes during neoadjuvant chemotherapy
| Baseline L3 area in cm2 (median ± SD) | Change in L3 area in cm2 (median ± SD) | Rate of change in L3 area in %/100 days (median ± SD) | |
|---|---|---|---|
| SM | 109.1 ± 14.2 | −4.5 ± 8.3* | −5.2 ± 9.8 |
| IMAT | 14.2 ± 10.1 | +0.7 ± 3.8** | +5.6 ± 34.7 |
| VAT | 66.2 ± 58.5 | −0.6 ± 21.1** | −0.8 ± 56.3 |
| SAT | 181.5 ± 87.4 | −11.2 ± 39.0* | −6.1 ± 36.4 |
| TAT | 266.0 ± 140.0 | −10.9 ± 51.3* | −4.5 ± 34.1 |
SD, standard deviation; SM, skeletal muscle; IMAT, intramuscular adipose tissue; VAT, visceral adipose tissue; SAT, subcutaneous adipose tissue; TAT, total adipose tissue.
indicate significant changes in L3 area measurements between scan 1 and 2 (
P < 0.001,
P < 0.05 using Paired‐Samples t‐test).
Subjects with high versus low baseline SMI did not show significant differences in OS with a P‐value of 0.613 in Kaplan–Meier analysis (Figure 3).
Figure 3.

Survival proportions: baseline skeletal muscle index.
Body composition changes during neoadjuvant chemotherapy
Median body composition changes after neoadjuvant chemotherapy are shown in Table 2. Treatment with neoadjuvant chemotherapy resulted in significant decreases in median SM, VAT, SAT, and TAT as well as a significant increase in IMAT. Median decrease in SM for this period was 5.2% per 100 days.
Subjects who were able to maintain or gain SM during chemotherapy had an increased OS in Kaplan–Meier analysis in comparison with patients who lost SM (P = 0.004, Figure 4). This difference in survival was most prominent from 2 years after start of therapy onwards. To assess other differences between patients with gain or loss of muscle mass, baseline characteristics were presented separately for these groups in Table 1. Besides a significant difference in OS as already noted in Kaplan–Meier analysis, only two other variables showed differences between both groups. Mean SMI at baseline was significantly lower in the group of patients who could increase SM, and low baseline SMI was present in 70% of these patients compared with 41% of patients who experienced muscle loss during chemotherapy (P = 0.003). Furthermore, patients who lost SM during chemotherapy also lost more weight in general between scans (4.8% weight loss versus 1.4% weight loss, P = 0.043).
Figure 4.

Survival proportions: changes in skeletal muscle.
Finally, we tested whether our variable of interest—change in SM—held significance in a Cox‐regression model under influence of other potential predictors of OS. Only four variables were significant at the level of 10% in the univariable model and were included in the multivariable model: (i) age >70 years, (ii) complete interval debulking, (iii) loss of SM, and (iv) loss of VAT (Table 3). Age >70 years did not retain significance in the multivariable model. Completeness of interval debulking had a positive outcome on OS with a HR of 0.49 (P = 0.005). Loss of SM and loss of VAT were also significant in the multivariable model and influenced OS negatively with HR's of 1.77 and 1.83, respectively.
Table 3.
Univariable and multivariable Cox‐regression analyses
| Univariable analysis | Multivariable analysis | |||
|---|---|---|---|---|
| Variables | HR (95% CI) | P‐value | HR (95% CI) | P‐value |
| Age at diagnosis | 1.020 (0.993–1.048) | 0.144 | ||
| Age at diagnosis <60 years | 0.913 (0.547–1.523) | 0.726 | ||
| Age at diagnosis >70 years | 1.616 (0.999–2.616) | 0.051e | 1.274 (0.780–2.080) | 0.333 |
| BMI pre‐chemotherapya | 1.027 (0.963–1.096) | 0.413 | ||
| BMI post‐chemotherapyb | 0.998 (0.931–1.070) | 0.950 | ||
| Obesity pre‐chemotherapy (BMI > 30)a | 1.099 (0.431–2.802) | 0.843 | ||
| Obesity post‐chemotherapy (BMI > 30)b | 0.893 (0.323–2.468) | 0.828 | ||
| Percentage weight loss between scansc | 0.968 (0.924–1.015) | 0.180 | ||
| Weight loss preceding diagnosisd | 1.005 (0.934–1.080) | 0.903 | ||
| FIGO stage IV | 1.480 (0.918–2.387) | 0.108 | ||
| Cycles of chemotherapy | 1.031 (0.798–1.332) | 0.814 | ||
| Complete interval debulking | 0.452 (0.277–0.737) | 0.001f | 0.488 (0.296–0.806) | 0.005f |
| Loss of SM during chemotherapy | 2.218 (1.280–3.844) | 0.005f | 1.773 (1.018–3.088) | 0.043f |
| Loss of IMAT during chemotherapy | 1.346 (0.837–2.166) | 0.220 | ||
| Loss of VAT during chemotherapy | 1.854 (1.158–2.970) | 0.010f | 1.828 (1.131–2.952) | 0.014f |
| Loss of SAT during chemotherapy | 0.890 (0.553–1.432) | 0.630 | ||
| Loss of TAT during chemotherapy | 1.411 (0.878–2.268) | 0.155 | ||
| Low baseline SMI | 0.887 (0.556–1.414) | 0.613 | ||
| Low SMI after chemotherapy | 1.054 (0.649–1.710) | 0.832 | ||
| Presence of ascites at baseline | 1.111 (0.689–1.794) | 0.665 | ||
HR, hazard ratio; CI, confidence interval; BMI, body mass index; SM, skeletal muscle; IMAT, intramuscular adipose tissue; VAT, visceral adipose tissue; SAT, subcutaneous adipose tissue; TAT, total adipose tissue.
Missing data for 46 patients, analysis was carried out with available data from 77 patients.
Missing data for 8 patients, analysis was carried out with available data from 115 patients.
Missing data for 53 patients, analysis was carried out with available data from 70 patients.
Missing data for 58 patients, analysis was carried out with available data from 65 patients.
P‐value < 0.1
P‐value < 0.05.
Discussion
Key findings
Our goal was to investigate whether changes in SM mass occur in ovarian cancer patients undergoing neoadjuvant chemotherapy and if so, whether these changes have an impact on survival. We found that women who maintained or gained SM during neoadjuvant treatment had a better prognosis than women who lost SM.
Loss of SM during chemotherapy and a shorter OS are closely related according to our findings, but the direct causality of this relationship is unclear. Loss of SM is one of the hallmarks of cancer cachexia. The increased amount of weight loss in the muscle loss group suggests that these patients suffered from a higher degree of cachexia. The metabolic and inflammatory changes associated with cachexia together with the decreased muscle nitrogen reserves could explain the poor prognosis in this group.23 Inactive and malnourished patients will experience more muscle wasting and are more prone to have complications when undergoing surgery.24, 25 Reasons why patients are unable to maintain a healthy diet or physical activity are diverse. Patients with a good responding tumour might feel better compared with patients with bulky, poor‐responding tumours. Perioperative malnutrition has also been associated with higher rates of suboptimal debulking surgery and thus a shorter survival in a study of older women diagnosed with ovarian cancer.26 In addition, muscle loss by itself is associated with poor physical function, increased chemotherapy toxicity, and longer recovery after surgery.27, 28, 29 Finally, the presence of comorbidities and old age could also be detrimental. However, age did not reach statistical significance in our multivariable Cox‐regression survival model.
Interestingly, decrease in SM over time was an important prognostic factor for OS, while low SM at a specific time point was not. We measured the SMI at baseline and after chemotherapy, but OS was not different for patients with low SMI versus high SMI. Moreover, when we compared patients who gained SM and lost SM, we found that patients with a gain of SM had a lower mean SMI at baseline. Many studies on sarcopenia only measure baseline/single time point SM, which sometimes has an effect on but often does not influence survival.17, 21, 30, 31 In our opinion, measuring SM loss over time is absolutely necessary to adequately identify sarcopenic patients, because important limitations of baseline measurements are that they cannot measure SM loss and are greatly influenced by interpersonal variation of muscle mass and other variables such as obesity and ethnicity. The poor prognostic value of ‘low baseline SMI’ was clearly shown in our data, where low muscle index at baseline could not predict survival, and in fact, many patients with low baseline SMI gained muscle mass during chemotherapy and were classified as high baseline SMI after neoadjuvant treatment.
Our results have also shown an association between loss of VAT and a shorter OS. This was also confirmed in other studies.20, 32 We approach this finding with caution because we have noticed that VAT was not always easily identified and measured in subjects where ascites was present before treatment, as was the case in 55% of patients. Therefore an increase in VAT could represent an increased measurement of VAT because of diminished ascites after chemotherapy treatment rather than an actual increase in VAT because of other causes. Survival gain associated with an increase of VAT could thus reflect the group of patients with a good response to chemotherapy. However, this hypothesis cannot be confirmed in our data because patients with ascites were divided equally among the women who gained VAT and the women who lost VAT during chemotherapy.
Other authors in the field have found mixed results regarding the relationship between muscle and adipose tissue changes and survival. Our findings are concordant with the outcome of a study in non‐small cell lung cancer patients; Stene et al. found a longer OS for patients who maintained or gained SM in comparison with patients who lost SM, and survival was irrespective of the presence of sarcopenia at baseline.21 In general, a mean decrease in SM is seen during chemotherapy for patients with lung cancer, pancreatic cancer, and oesophagogastric cancer, similar to our findings in ovarian cancer.18, 19, 20, 21, 32, 33 However, this decrease in SM did not alter OS rates in oesophagogastric cancer.18, 19 In pancreatic cancer, a decline in SM and VAT was recorded during neoadjuvant chemotherapy, but only loss of VAT was associated with a shorter OS.20, 32
Known prognostic factors such as age, BMI, tumour stage, or weight loss may attribute to prognosis, but we were not able to find a significant relationship for these variables with OS. As reported by Prado et al., obesity is not protective against muscle loss, on the contrary; sarcopenic obesity was associated with poorer functional status and was an independent predictor of survival.31 Therefore, an evaluation of bodyweight instead of body composition can be misleading when a patient is assessed.
Limitations
Because of the retrospective nature of this study, it was not always possible to retrieve all variables and possible confounders of interest in all patients. Body weight—and BMI—both before the start of treatment as well as during chemotherapy were not retrievable for all subjects. It would also have been interesting to incorporate World Health Organization performance status and tumour marker CA125 into the analyses, but due to too many missing data, this was not possible.
A second important shortcoming of this study is selection bias. Instead of studying all patients with ovarian cancer, we only selected the patients with advanced disease who were assigned to neoadjuvant chemotherapy and interval debulking. These patients often have large bulky tumours, more advanced locoregional and distal tumour spread, and/or a worse performance status, which prevents them from undergoing primary surgical treatment. For this study, we intentionally made the decision to use this particular group because it gave us the opportunity to compare muscle loss over the course of time due to the availability of multiple CT scans. Patients who are treated with primary debulking only receive one CT scan before treatment and are not followed‐up with CT during adjuvant chemotherapy unless a suspicion of recurrence arises. Whether our results can be reproduced in ovarian cancer patients who receive primary cytoreductive surgery without neoadjuvant chemotherapy will be a topic of future research.
Furthermore, our study took place in a specialized oncologic centre in the south of the Netherlands. Survival rates could vary between specialized and non‐specialized centres but also countries or health care systems across the world. Therefore, we believe it is important that body composition measurement studies for gynaecological malignancies should be validated in other populations.
Unlike many other published manuscripts, we decided to use our own cut‐off value to define sarcopenia in our population. Other authors refer to the study of Prado et al. in which a value of 38.5 for SMI is used to define sarcopenic patients, but this cut‐off value is based on obese patients with respiratory and gastrointestinal tumours, and we did not find this cut‐off representative for the present study population.31 The use of a different and lower cut‐off value (e.g. 38.5) would have resulted in a higher number of sarcopenic patients; we tested whether this significantly changed any of the outcomes but found that this was not the case in both the Kaplan–Meier and Cox‐regression analyses (data not shown). Instead, we decided to set our own cut‐offs, which is a more unbiased approach.
Conclusion and implications for practice and research
In this manuscript, we have provided evidence that loss of SM and loss of VAT during neoadjuvant chemotherapy is detrimental to OS for ovarian cancer patients. Evaluation of SM at a specific time point does not help in predicting survival, which is why we propose a measurement over time to adequately identify sarcopenic patients. External and prospective validation of these findings in other cohorts from (inter)national centres is imperative. However, even more important are prospective randomized controlled trials investigating whether nutritional, pharmacological and/or physical interventions to maintain or even increase SM and adipose tissue can improve OS in ovarian cancer patients. Nutritional intervention schemes have been developed for ovarian cancer patients and cancer patients in general, largely based on expert opinions and often lacking clinical evidence.34, 35
Acknowledgements
The authors certify that they comply with the ethical guidelines for authorship and publishing of the Journal of Cachexia, Sarcopenia and Muscle.36
Conflict of interest
None declared.
Rutten, I. J. G. , van Dijk, D. P. J. , Kruitwagen, R. F. P. M. , Beets‐Tan, R. G. H. , Olde Damink, S. W. M. , and van Gorp, T. (2016) Loss of skeletal muscle during neoadjuvant chemotherapy is related to decreased survival in ovarian cancer patients. Journal of Cachexia, Sarcopenia and Muscle, 7: 458–466. doi: 10.1002/jcsm.12107.
Footnotes
Example of CT scans pre‐chemotherapy (a,c) and post‐chemotherapy (b,d) in a 46–year old patient with FIGO stage IV ovarian cancer. Increases in SM, IMAT, VAT and SAT were measured with SliceOmatic v5.0 (Tomovision, Montreal, QC, Canada). NB: the increase in VAT is accompanied by a reduction of ascites; A*, ascites; L3, third lumbar vertebra; SM, skeletal muscle (red); IMAT, intramuscular adipose tissue (green); VAT, visceral adipose tissue (yellow); SAT, subcutaneous adipose tissue (teal).
Kaplan–Meier curve comparing overall survival between high baseline SMI and low baseline SMI; P‐value = 0.613; SMI, skeletal muscle index.
Kaplan Meier curve comparing overall survival between loss of skeletal muscle (>2% decrease per 100 days) and maintenance or gain of skeletal muscle (any increase or ≤ 2% decrease per 100 days); P‐value = 0.004; SM, skeletal muscle.
References
- 1. Ferlay J, Soerjomataram I, Ervik M, Dikshit R, Eser S, Mathers C et al GLOBOCAN 2012 v1.0, Cancer Incidence and Mortality Worldwide: IARC CancerBase No. 11, 2013.
- 2. Surveillance, Epidemiology, and End Results (SEER) Program SEER 9 Incidence & U.S. Mortality Research Data (1973–2011). In: National Cancer Institute D, Surveillance Research Program, Surveillance Systems Branch, released April 2014, based on the November 2013 submission, editor.
- 3. De Angelis R, Sant M, Coleman MP, Francisci S, Baili P, Pierannunzio D, et al Cancer survival in Europe 1999–2007 by country and age: results of EUROCARE‐‐5‐a population‐based study. Lancet Oncol 2014;15:23–34. [DOI] [PubMed] [Google Scholar]
- 4. du Bois A, Reuss A, Pujade‐Lauraine E, Harter P, Ray‐Coquard I, Pfisterer J. Role of surgical outcome as prognostic factor in advanced epithelial ovarian cancer: a combined exploratory analysis of 3 prospectively randomized phase 3 multicenter trials: by the Arbeitsgemeinschaft Gynaekologische Onkologie Studiengruppe Ovarialkarzinom (AGO‐OVAR) and the Groupe d'Investigateurs Nationaux Pour les Etudes des Cancers de l'Ovaire (GINECO). Cancer 2009;115:1234–1244. [DOI] [PubMed] [Google Scholar]
- 5. Vergote I, Trope CG, Amant F, Kristensen GB, Ehlen T, Johnson N, et al Neoadjuvant chemotherapy or primary surgery in stage IIIC or IV ovarian cancer. N Engl J Med 2010;363:943–953. [DOI] [PubMed] [Google Scholar]
- 6. Tisdale MJ. Cachexia in cancer patients. Nat Rev Cancer 2002;2:862–871. [DOI] [PubMed] [Google Scholar]
- 7. Mourtzakis M, Prado CM, Lieffers JR, Reiman T, McCargar LJ, Baracos VE. A practical and precise approach to quantification of body composition in cancer patients using computed tomography images acquired during routine care. Appl Physiol Nutr Metab 2008;33:997–1006. [DOI] [PubMed] [Google Scholar]
- 8. Ross R. Advances in the application of imaging methods in applied and clinical physiology. Acta Diabetol 2003;40 Suppl 1:S45–S50. [DOI] [PubMed] [Google Scholar]
- 9. Shen W, Punyanitya M, Wang Z, Gallagher D, St‐Onge MP, Albu J, et al Total body skeletal muscle and adipose tissue volumes: estimation from a single abdominal cross‐sectional image. J Appl Physiol 2004;97:2333–2338. [DOI] [PubMed] [Google Scholar]
- 10. Shen W, Punyanitya M, Wang Z, Gallagher D, St‐Onge MP, Albu J, et al Visceral adipose tissue: relations between single‐slice areas and total volume. Am J Clin Nutr 2004;80:271–278. [DOI] [PMC free article] [PubMed] [Google Scholar]
- 11. Fujiwara N, Nakagawa H, Kudo Y, Tateishi R, Taguri M, Watadani T, et al Sarcopenia, intramuscular Fat deposition, and visceral adiposity independently predict the outcomes of hepatocellular carcinoma. J Hepatol 2015;doi:10.1016/j.jhep.2015.02.031. [DOI] [PubMed] [Google Scholar]
- 12. Lanic H, Kraut‐Tauzia J, Modzelewski R, Clatot F, Mareschal S, Picquenot JM, et al Sarcopenia is an independent prognostic factor in elderly patients with diffuse large B‐cell lymphoma treated with immunochemotherapy. Leuk Lymphoma 2014;55:817–823. [DOI] [PubMed] [Google Scholar]
- 13. Martin L, Birdsell L, Macdonald N, Reiman T, Clandinin MT, McCargar LJ, et al Cancer cachexia in the age of obesity: skeletal muscle depletion is a powerful prognostic factor, independent of body mass index. J Clin Oncol 2013;31:1539–1547. [DOI] [PubMed] [Google Scholar]
- 14. Psutka SP, Carrasco A, Schmit GD, Moynagh MR, Boorjian SA, Frank I, et al Sarcopenia in patients with bladder cancer undergoing radical cystectomy: impact on cancer‐specific and all‐cause mortality. Cancer 2014;120:2910–2918. [DOI] [PubMed] [Google Scholar]
- 15. Guiu B, Petit JM, Bonnetain F, Ladoire S, Guiu S, Cercueil JP, et al Visceral fat area is an independent predictive biomarker of outcome after first‐line bevacizumab‐based treatment in metastatic colorectal cancer. Gut 2010;59:341–347. [DOI] [PubMed] [Google Scholar]
- 16. Ladoire S, Bonnetain F, Gauthier M, Zanetta S, Petit JM, Guiu S, et al Visceral fat area as a new independent predictive factor of survival in patients with metastatic renal cell carcinoma treated with antiangiogenic agents. Oncologist 2011;16:71–81. [DOI] [PMC free article] [PubMed] [Google Scholar]
- 17. Torres ML, Hartmann LC, Cliby WA, Kalli KR, Young PM, Weaver AL, et al Nutritional status, CT body composition measures and survival in ovarian cancer. Gynecol Oncol 2013;129:548–553. [DOI] [PubMed] [Google Scholar]
- 18. Awad S, Tan BH, Cui H, Bhalla A, Fearon KC, Parsons SL, et al Marked changes in body composition following neoadjuvant chemotherapy for oesophagogastric cancer. Clin Nutr 2012;31:74–77. [DOI] [PubMed] [Google Scholar]
- 19. Yip C, Goh V, Davies A, Gossage J, Mitchell‐Hay R, Hynes O, et al Assessment of sarcopenia and changes in body composition after neoadjuvant chemotherapy and associations with clinical outcomes in oesophageal cancer. Eur Radiol 2014;24:998–1005. [DOI] [PubMed] [Google Scholar]
- 20. Dalal S, Hui D, Bidaut L, Lem K, Del Fabbro E, Crane C, et al Relationships among body mass index, longitudinal body composition alterations, and survival in patients with locally advanced pancreatic cancer receiving chemoradiation: a pilot study. J Pain Symptom Manage 2012;44:181–191. [DOI] [PMC free article] [PubMed] [Google Scholar]
- 21. Stene GB, Helbostad JL, Amundsen T, Sorhaug S, Hjelde H, Kaasa S, et al Changes in skeletal muscle mass during palliative chemotherapy in patients with advanced lung cancer. Acta Oncol 2015;54:340–348. [DOI] [PubMed] [Google Scholar]
- 22. World Health Organization . Obesity: Preventing and Managing the Global EpidemicReport of a WHO Consultation (WHO Technical Report Series 894), Geneva, Switzerland: World Health Organization; 2000. [PubMed] [Google Scholar]
- 23. Fearon K, Arends J, Baracos V. Understanding the mechanisms and treatment options in cancer cachexia. Nat Rev Clin Oncol 2013;10:90–99. [DOI] [PubMed] [Google Scholar]
- 24. Kortebein P, Ferrando A, Lombeida J, Wolfe R, Evans WJ. Effect of 10 days of bed rest on skeletal muscle in healthy older adults. JAMA 2007;297:1772–1774. [DOI] [PubMed] [Google Scholar]
- 25. Schiesser M, Kirchhoff P, Muller MK, Schafer M, Clavien PA. The correlation of nutrition risk index, nutrition risk score, and bioimpedance analysis with postoperative complications in patients undergoing gastrointestinal surgery. Surgery 2009;145:519–526. [DOI] [PubMed] [Google Scholar]
- 26. Alphs HH, Zahurak ML, Bristow RE, Diaz‐Montes TP. Predictors of surgical outcome and survival among elderly women diagnosed with ovarian and primary peritoneal cancer. Gynecol Oncol 2006;103:1048–1053. [DOI] [PubMed] [Google Scholar]
- 27. Baracos V, Kazemi‐Bajestani SM. Clinical outcomes related to muscle mass in humans with cancer and catabolic illnesses. Int J Biochem Cell Biol 2013;45:2302–2308. [DOI] [PubMed] [Google Scholar]
- 28. Prado CM, Lieffers JR, Bowthorpe L, Baracos VE, Mourtzakis M, McCargar LJ. Sarcopenia and physical function in overweight patients with advanced cancer. Can J Diet Pract Res 2013;74:69–74. [DOI] [PubMed] [Google Scholar]
- 29. Prado CM, Baracos VE, McCargar LJ, Reiman T, Mourtzakis M, Tonkin K, et al Sarcopenia as a determinant of chemotherapy toxicity and time to tumor progression in metastatic breast cancer patients receiving capecitabine treatment. Clin Cancer Res 2009;15:2920–2926. [DOI] [PubMed] [Google Scholar]
- 30. Kuroki LM, Mangano M, Allsworth JE, Menias CO, Massad LS, Powell MA, et al Pre‐operative assessment of muscle mass to predict surgical complications and prognosis in patients with endometrial cancer. Ann Surg Oncol 2015;22:972–979. [DOI] [PMC free article] [PubMed] [Google Scholar]
- 31. Prado CM, Lieffers JR, McCargar LJ, Reiman T, Sawyer MB, Martin L, et al Prevalence and clinical implications of sarcopenic obesity in patients with solid tumours of the respiratory and gastrointestinal tracts: a population‐based study. Lancet Oncol 2008;9:629–635. [DOI] [PubMed] [Google Scholar]
- 32. Cooper AB, Slack R, Fogelman D, Holmes HM, Petzel M, Parker N, et al Characterization of anthropometric changes that occur during neoadjuvant therapy for potentially resectable pancreatic cancer. Ann Surg Oncol 2014;doi:10.1245/s10434-014-4285-2. [DOI] [PMC free article] [PubMed] [Google Scholar]
- 33. Murphy RA, Mourtzakis M, Chu QS, Baracos VE, Reiman T, Mazurak VC. Nutritional intervention with fish oil provides a benefit over standard of care for weight and skeletal muscle mass in patients with nonsmall cell lung cancer receiving chemotherapy. Cancer 2011;117:1775–1782. [DOI] [PubMed] [Google Scholar]
- 34. Jacquelin‐Ravel N, Pichard C. Clinical nutrition, body composition and oncology: a critical literature review of the synergies. Crit Rev Oncol Hematol 2012;84:37–46. [DOI] [PubMed] [Google Scholar]
- 35. Balogun N, Forbes A, Widschwendter M, Lanceley A. Noninvasive nutritional management of ovarian cancer patients: beyond intestinal obstruction. Int J Gynecol Cancer 2012;22:1089–1095. [DOI] [PubMed] [Google Scholar]
- 36. von Haehling S, Morley JE, Coats AJS, Anker SD. Ethical guidelines for publishing in the Journal of Cachexia, Sarcopenia and Muscle: update 2015. J Cachexia Sarcopenia Muscle 2015;6:315–316. [DOI] [PMC free article] [PubMed] [Google Scholar]