

Abstract
The mammalian intestine houses a complex microbial community, which influences normal epithelial growth and development, and is integral to the repair of damaged intestinal mucosa1–3. Restitution of injured mucosa involves the recruitment of immune cells, epithelial migration and proliferation4,5. Although microenvironmental alterations have been described in wound healing6, a role for extrinsic influences, such as members of the microbiota, has not been reported. Here, we show that a distinct subpopulation of the normal mucosal-associated gut microbiota expands and preferentially colonizes sites of damaged murine mucosa in response to local environmental cues. Our results demonstrate that formyl peptide receptor 1 (FPR1) and neutrophilic NADPH oxidase (NOX2) are required for the rapid depletion of microenvironmental oxygen and compensatory responses, resulting in a dramatic enrichment of an anaerobic bacterial consortium. Furthermore, the dominant member of this wound-mucosa-associated microbiota, Akkermansia muciniphila (an anaerobic, mucinophilic gut symbiont7,8), stimulated proliferation and migration of enterocytes adjacent to the colonic wounds in a process involving FPR1 and intestinal epithelial-cell-specific NOX1-dependent redox signalling. These findings thus demonstrate how wound microenvironments induce the rapid emergence of ‘probiont’ species that contribute to enhanced repair of mucosal wounds. Such microorganisms could be exploited as potential therapeutics.
Intestinal mucosal damage is observed in inflammatory bowel disease, enteric infections, as well as following surgical/mechanical trauma and toxic/environmental insults. To model intestinal injury and repair, we and others have utilized miniaturized endoscopy and biopsy forceps to generate defined mucosal wounds in the distal colon of wild-type (WT) mice in a coordinated and highly reproducible fashion9–11 (Fig. 1a and Supplementary Fig. 1). In this study, we first visualized the endogenous bacteria present in the colonic wound bed by panbacterial fluorescent in situ hybridization (FISH) and scanning electron microscopy (Fig. 1b,c). During homeostasis, the microbiota in the colonic contents is largely separated from the underlying colonic mucosa (Fig. 1b and Supplementary Fig. 2) by an inner mucus layer12. However, at day 0 to 2 post wounding, the injured mucosa is in direct contact with a commensal microbiota due to the loss of three key features: fully differentiated enterocytes, goblet cells and the derived mucus layer (Fig. 1b and Supplementary Fig. 2), which reverses within 4–6 days. To characterize the wound-associated microbiota, colonic mucosal tissue was collected on days 0, 2, 4 and 6 post injury, and total DNA was purified from the wounds as well as from adjacent intact mucosa and local luminal contents. Bacterial 16S rRNA genes (V4 region) were polymerase chain reaction (PCR)-amplified and the amplicons were sequenced using the Illumina Miseq high-throughput sequencing (HTS) platform13. At the phyla level, microbiota analysis revealed that the mucosa-associated microbiota consisted of a higher abundance of Firmicutes and a lower abundance of Bacteroidetes compared to the microbiota of the luminal content (Fig. 1d). Interestingly, the composition of phyla present in the wound bed at day 0 most closely resembled that of the luminal content. However, the microbiota composition of the resealing wounds at day 2 post biopsy, and later, differed considerably from that of intact mucosa as well as the colonic luminal contents (Fig. 1d). Furthermore, a principal coordinates plot (PCoA) also demonstrated that the microbiota associated with wounds 2 days post biopsy clustered distinctly from that of intact mucosa (Fig. 1e, circled cluster). Microbiota associated with resealing wounds at days 4 and 6 clustered progressively closer to those of intact mucosa. Linear discriminate analysis (LDA) identified seven anaerobic and microaerophilic commensal bacterial genera (Fig. 1f) that increased in abundance specifically in the early regenerative mucosa (days 2 and 4). Most notably, the relative abundance of anaerobic mucinophilic Akkermansia (phyla: Verrucomicrobia) increased dramatically (Fig. 1d,f). Additional bacteria that are represented in the wound-associated consortium include the anaerobic taxa Coprococcus, Mucispirillum, Odoribacter, Prevotella and Oscillospira (Fig. 1f). Interestingly, aerotolerant lactobacilli had decreased in number in wounds 2 days post injury, but had increased within 4–6 days after injury (Supplementary Fig. 3a). These findings indicate that, during repair of gut mucosal injury, temporally dynamic local environmental conditions in the wound favour the growth of specific taxa, and define a wound-associated microbiota consortium that preferentially thrives for several days and resolves to the original state as the wound repairs.
Figure 1. Restitutive wound induces spatiotemporal change of wound mucosa-associated microbiota.
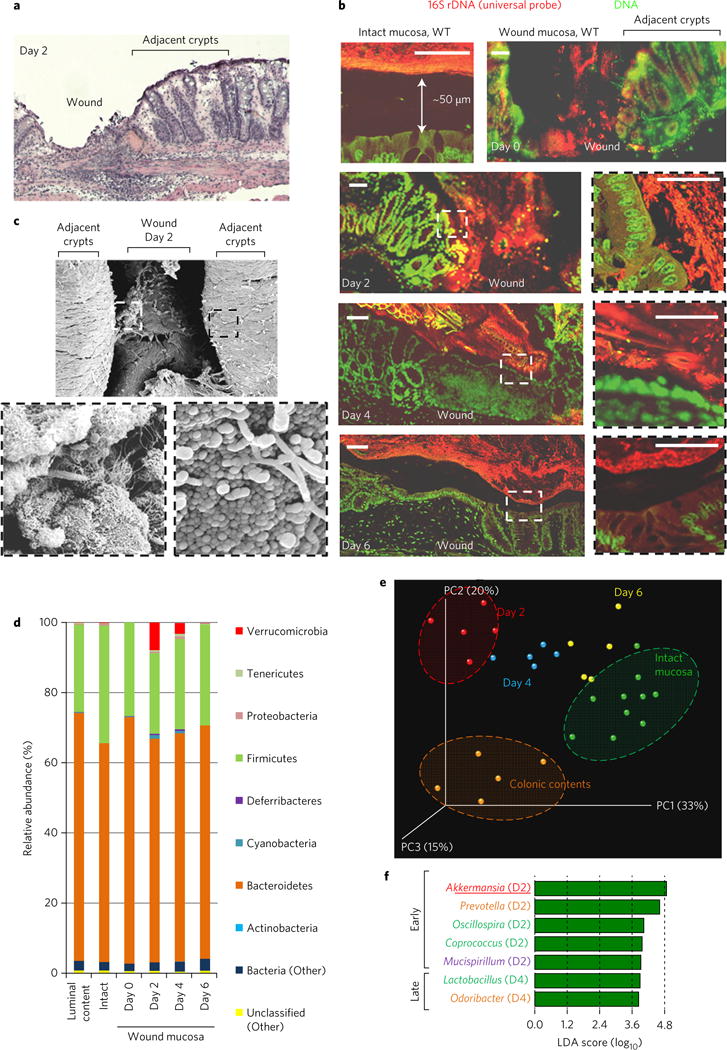
a, H&E-stained wound bed. b, FISH of mucosal wound beds (n = 10 per group) using a pan-bacterial probe (red). Scale bars, 50 μm. c, Scanning electron micrograph of wound bed. d, Mean relative abundance of bacterial phyla determined by HTS (n = 5 wounds per group). e, PCoA plot of microbiota community structure in injured mucosa. f, LDA scores reflecting positive association of bacterial genus with restitutive mucosa. D2 and D4 denote day 2 and day 4, respectively.
Sites of intestinal mucosal inflammation and subsequent restitution are characterized by multiple alterations in the tissue microenvironment, including the appearance of pro-resolving mediators, cytokines, mucins and changes in oxygen tension6. For example, during trinitrobenzenesulphonic acid (TNBS)-induced colitis, oxygen in the inflamed epithelia is rapidly depleted by the NOX2-mediated oxidative burst within recruited neutrophils, in concert with an increased synthesis of a mucin protein, MUC3, from the intestinal epithelial cells (IECs)14. We hypothesized that such physiological changes within a mucosal wound microenvironment establish preferential conditions for the rapid growth of Akkermansia, an anaerobic and mucinophilic organism. To explore this hypothesis, we first investigated oxygen depletion in biopsy wounds using pimonidazole HCl. This compound is reduced in a hypoxic environment and forms immunodetectable protein adducts. This analysis detected considerably reduced oxygen concentrations in the wound bed 2 days post injury (Fig. 2a and Supplementary Fig. 3c)—a time point when wound-associated Akkermansia and other anaerobic bacteria are at their greatest abundance (Fig. 1d), and at the maximal influx of neutrophils (Supplementary Fig. 3d,e). The hypoxic microenvironment subsided as the wounds resealed on days 4 and 6 post injury (Fig. 2a and Supplementary Fig. 3c). Because oxygen consumption is a consequence of the phagocytic respiratory burst14, we evaluated local colonic mucosal hypoxia in FPR1 and NOX2 knockout animals. At days 2 and 4 post injury, significantly less oxygen depletion was observed in the wound beds of Fpr1−/− and Nox2−/− mice compared with WT littermate controls, despite insignificant changes in then numbers of emigrated neutrophils (Fig. 2a,b and Supplementary Fig. 3d,e). Additionally, transcripts of genes induced by hypoxic responses in the epithelia (glut1 and muc3) increased ~2.5-fold in the mucosal bed of WT but not Fpr1−/− or Nox2−/− mice (Fig. 2c), and this increase was suppressed by inhibitors of HIF1α-dependent transcription (Supplementary Fig. 3g). Immunofluorescence staining also confirmed increased expression of MUC3 protein in the mucosal wounds of WT, but not Fpr1−/− mice (Supplementary Fig. 3f). Interestingly, the diminished hypoxia and decreased MUC3 expression detected in Fpr1−/− or Nox2−/− mice correlated with a reduction in anaerobic, mucinophilic Akkermansia in wound beds compared with WT mice (Fig. 3a–c). Specifically, quantitative analysis of microbiota revealed that the relative abundance of Akkermansia is about 7.8% in repairing wounds in WT mice (Fig. 1d), compared with 1.2% in restituting wounds within Fpr1−/− mice (Fig. 3a). In addition, the relative abundance of Akkermansia in resealing wounds in WT but not Fpr1−/− mice was qualitatively assessed and confirmed by FISH analysis using Akkermansia-specific 16S rRNA probes at day 2 (Fig. 3d). Finally, the relative abundance of Akkermansia could be increased by supplementation of MUC3 peptide (Supplementary Fig. 3g). These data confirm that the microenvironment in healing mucosal wounds is associated with FPR1/NOX2-dependent oxygen depletion, an increase in MUC3 mucin, and an enrichment of mucinophilic Akkermansia.
Figure 2. FPR1/NOX2 is required for microenvironmental changes in restitutive wounds, which promote anaerobic mucinophilic Akkermansia.
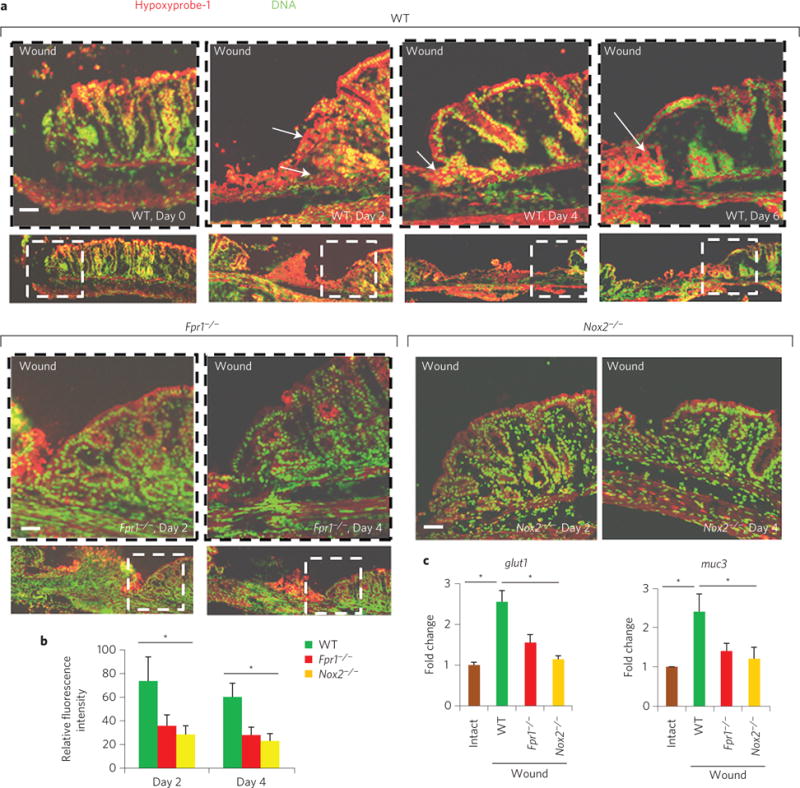
a, Immunofluorescence staining of pimonidazole HCl showing depletion of microenvironmental oxygen in mucosal wound beds (n = 10 per group). Arrows indicate areas of hypoxia. b, Quantitative representation of immunofluorescence analysis (by ImageJ software; expressed in units of fluorescence; mean ± s.e.m.) of pimonidazole HCl adduct staining in a. c, Real-time qPCR analysis (mean ± s.e.m.) of mucosal epithelial hypoxia response genes glut1 and muc3 in wounds (n = 11 per group). Scale bars, 50 μm. *P < 0.05; Student’s t-test.
Figure 3. FPR1 is required for enrichment of Akkermansia sp.
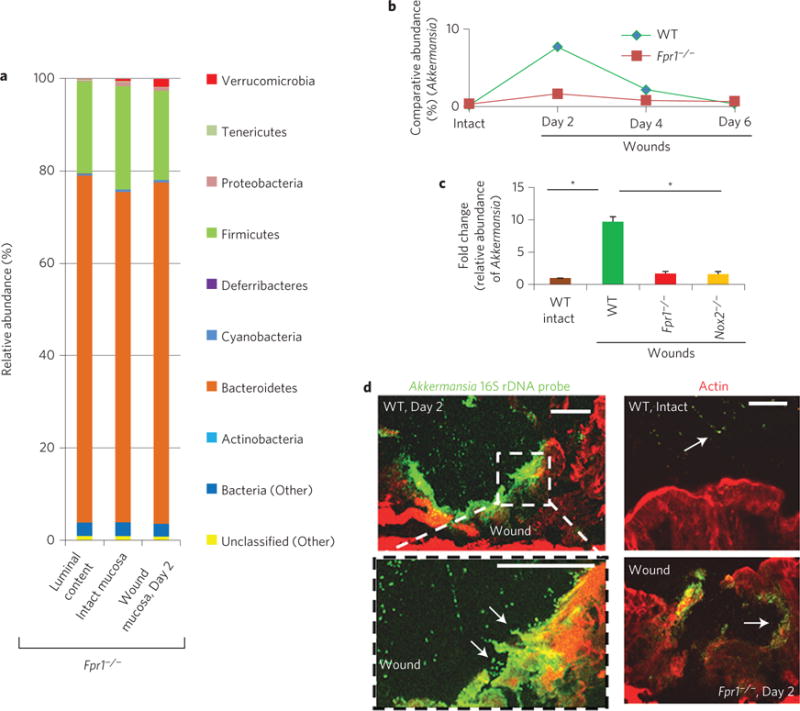
a, Relative abundance of bacterial phyla determined by HTS from Fpr1−/− mice. Data represent mean of relative abundance with n = 5 wounds per group. b, Comparative relative abundance of Akkermansia in wounds in WT and Fpr1−/− mice determined by HTS. n = 5 wounds/group. c, Real-time qPCR analysis of fold change in specific relative abundance of Akkermansia (mean ± s.e.m; n = 10 per group). d, Visualization of Akkermansia (green) in wound beds (n = six per group) by FISH. Scale bars, 50 μm. *P < 0.05; Student’s t-test.
We recently reported that specific bacterial stimulation of cellular reactive oxygen species (ROS) augments intestinal epithelial proliferation and migration9,15–17. To investigate whether Akkermansia influences these key cellular events, colonic mucosal resealing was assessed following intrarectal administration of exogenous A. muciniphila (ATCC BAA-835). In WT mice, wounds treated with A. muciniphila for 6 days exhibited statistically significant enhanced mucosal closure (74.14%, P < 0.05) when compared with control treatment (43.7%) (Supplementary Fig. 4). However, no significantly enhanced wound closure was observed in similarly treated Fpr1−/− mice (57.4%) when compared with normal controls. Akkermansia also mediates restitutive effects in a dextran sodium sulphate (DSS)-induced colitis model (Supplementary Fig. 4c–e). Significantly, monocolonization of Akkermansia in cultured epithelial cells accelerated resealing in an in vitro scratch wound, suggesting that beneficial events could be mediated by this strain in isolation (Supplementary Fig. 4f). We have previously demonstrated a role for select commensal bacteria in promoting intestinal epithelial-specific NADPH NOX1-dependent ROS generation in IECs, which in turn activate downstream redox-dependent phosphorylation of ERK-MAPK and focal adhesion proteins (such as FAK) that mediate epithelial wound closure in a FPR1/NOX1-dependent manner9,15,16. Indeed, the administration of increasing amounts of A. muciniphila to WT mice resulted in a corresponding increase in wound edge-associated ROS, which was detected using a stable, non-toxic redox-sensitive fluorophore16 (Supplementary Fig. 5), while minimal ROS generation was detected in the IECs of Fpr1−/− or Nox1−/− IEC mice administered A. muciniphila (Fig. 4a,b). In contrast, WT levels of IEC ROS generation were detected in resealing epithelial wounds in Nox2−/− mice (Fig. 4a,b). Moreover, and again consistent with previous data9,10, lactobacilli (Lactobacillus rhamnosus GG, or LGG), but not Escherichia coli, induced cellular ROS generation (Fig. 4a). Consistently, exogenous A. muciniphila administration was associated with increased detectable ERK phosphorylation in colonic epithelial cells in WT, but not Fpr1−/− or Nox1−/− IEC mice (Fig. 4c), indicating that A. muciniphila requires FPR1 and NOX1 to modulate redox-dependent cellular signalling. Next, the influence of A. muciniphila on the proliferation of epithelial cells adjoining the wound was assessed by measuring EdU (5-ethynyl-2′-deoxyuridine) incorporation (Fig. 4d and Supplementary Fig. 6a). The treatment of wounds with A. muciniphila significantly increased (1.6-fold) the number of EdU-positive cells in the four to five colonic crypts adjacent to the wounds in WT but not Fpr1−/− mice (Fig. 4d,e). As expected, A. muciniphila also stimulated increased EdU incorporation and ERK phosphorylation in a cultured model intestinal epithelial cell line18 in an FPR-dependent manner (Supplementary Fig. 6b,c). These in vitro data also suggest that Akkermansia-induced signalling in IECs is an epithelial-cell-autonomous process.
Figure 4. Akkermansia muciniphila enhances redox-dependent wound restitution.
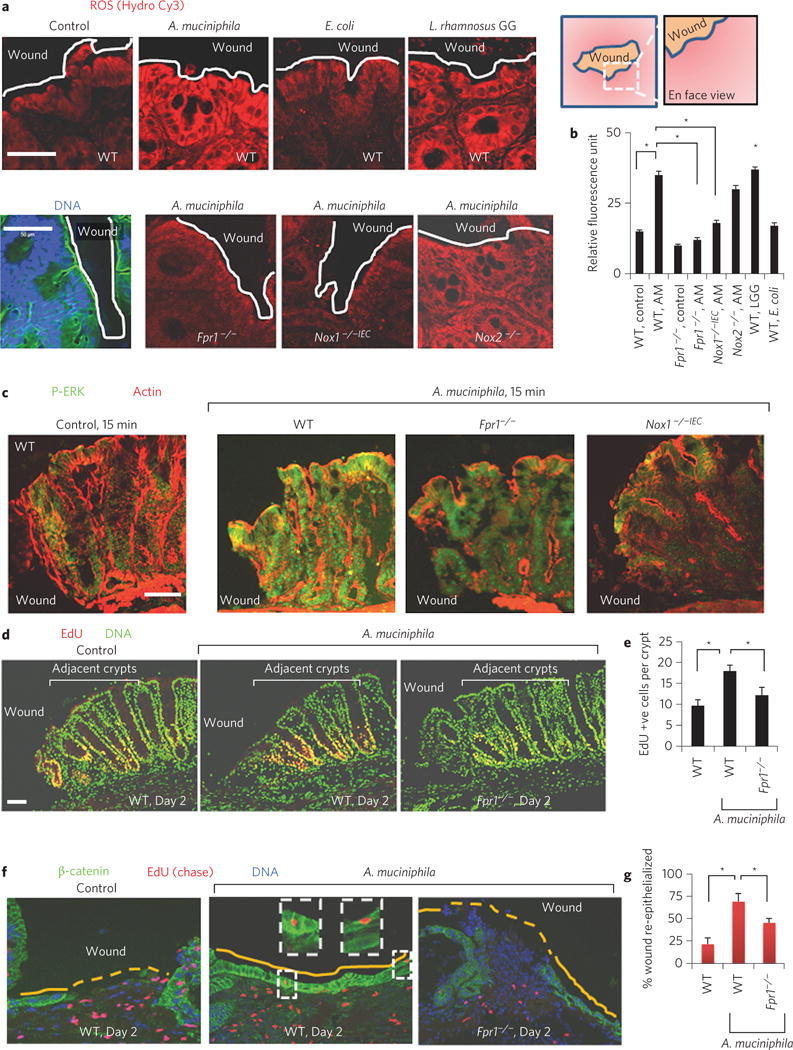
a, Cellular ROS generation in mucosal wounds oriented en face (n = 10 per group) after luminal treatments of wounds as in ref. 9. DNA, blue; actin, green. b, Quantitative representation of ROS production (mean ± s.e.m) in a. c, Immunofluorescence analysis of P-ERK in thin sections of colonic wounds (n = 11 per group). d, Enterocyte proliferation (EdU-positive cells in red) after intrarectal administration of A. muciniphila. e, Quantification of EdU-positive cells in five crypts adjacent to wounds (n = 12 per group). f, Re-epithelialization of wound beds (n = 12 per group) with EdU-labelled (red, chase assay) enterocytes in WT and Fpr1−/− mice. g, Quantification of wound re-epithelialization (mean ± s.e.m.) in f. Scale bars, 50 μm; *P < 0.05; Student’s t-test.
We next investigated the migration of enterocytes adjoining the wound using pulse–chase labelling with EdU Supplementary Fig. 7). Emigration of EdU-labelled enterocytes from adjoining crypts was observed 1 day post injury (Supplementary Fig. 7b). In addition, following an initial pulse and a 4 day chase period, we detected EdU-positive cells in the epithelial monolayer that entirely sealed wound beds in WT control mice (Supplementary Fig. 7b). Interestingly, in the A. muciniphila-treated WT mice, wounds were re-epithelialized within 2 days of injury (Fig. 4f,g), compared to partial re-epithelialization in WT control or A. muciniphila-treated Fpr1−/− mice over the same period. Akkermansia has been previously reported to be closely associated with colonic epithelial surfaces19 and to also influence epithelial gene expression20. These data confirm that Akkermansia, and other wound-associated bacteria, promote mucosal wound repair by FPR1-dependent redox-mediated control of epithelial proliferation and migration (Supplementary Fig. 8).
Overall, these results suggest that the microbiota can adapt to local environmental changes to form definable and transient consortia, a largely expected ecological event in niche occupancy. However, members of this consortium are able to stimulate pro-restitutive signalling and increased migration and proliferation, suggesting that during co-evolution, host factors were able to influence the community structure to select for specific organisms with beneficial properties, thus shaping a commensal relationship into a mutualistic one. Although there are clearly microbiota-independent environmental factors that influence wound healing, we propose the term ‘probiont’ to describe members of the microbiota that can utilize niche expansion to mediate beneficial effects. A focused study of this and other long-established host–microbial relationships during recuperation/recovery of diseases may be a fruitful source for the mining and isolation of microorganisms with therapeutic potential.
Methods
Mouse models
All animal experiments were approved by the Institutional Animal Care and Use Committee at Emory University and were performed according to National Institutes of Health guidelines. The mice had ad libitum access to a standard diet and water until reaching the desired age and/or weight. Animals were maintained on a 12 h light/12 h dark cycle under pathogen-free conditions. Fpr1−/− mice were purchased from Taconic. Nox2−/− null and corresponding control WT mice were purchased from Jackson Laboratory. Colonies of Fpr1−/−and Nox1−/− IEC mice were established and maintained in our research facility9,10, where both WT and knockout (homozygous) animals were the progeny of heterozygous parents. WT and knockout littermates were housed under the same pathogen-free conditions and were provided with standard diet and water. Age- (6–8 week) and sex-matched littermates were randomly divided into different groups. Sample sizes are indicated in the figure captions. Histological and endoscopic analyses were performed in a blinded fashion, and the sample sizes represent biological replicates. Genotyping was carried out by PCR of the WT Fpr1 allele or the mutated gene carrying the neomycin resistance gene (neor).
Bacterial strains
A. muciniphila was purchased from ATCC (BAA-835) and cultured according to ATCC culturing guidelines (http://www.atcc.org/products/all/BAA-835.aspx#generalinformation). For in vivo analysis, intrarectal doses containing 100 μl volumes of 6 × 10⁸ c.f.u. ml−1 A. muciniphila suspension were administered (see section ‘ROS assay in vivo’ for an explanation of the determination of bacterial dose). L. rhamnosus GG (LGG) was cultured according to methods described previously16.
Protocol for microbiota analysis
Analysis was performed according to ref. 13. DNA was extracted from luminal contents, mucosa or wound beds (n = 5 wounds per group; one mucosal wound bed collected from an individual mouse) using a PowerSoil kit from MoBio Laboratories. 16S rRNA genes were PCR-amplified from each sample using a composite forward primer and a reverse primer containing a unique 12-base barcode, designed using the Golay error-correcting scheme, which was used to tag PCR products from respective samples21. We used primers for paired-end 16S community sequencing on the Illumina platform using bacteria/archaeal primer 515F/806R (GTGCCAGCMGCCGCGGTAA and GGACTACHVGGGTWTCTAAT)13. Primers were specific for the V4 region of the 16S rRNA gene. The forward PCR primer sequence contained the sequence for the 5′ Illumina adapter (AATGATACGGCGACCACCGAGATCTACAC), the forward primer pad (TATGGTAATT), the forward primer linker (GT) and the forward primer sequence (GTGCCAGCMGCCGCGGTAA). Each reverse PCR primer sequence contained the reverse complement of the 3′ Illumina adapter (CAAGCAGAAGACGGCATACGAGAT), the Golay barcode (each sequence contained a different barcode), the reverse primer pad (AGTCAGTCAG), the reverse primer linker (CC) and the reverse primer (GGACTACHVGGGTWTCTAAT). Sequences of these primers have been published, are used widely by different laboratories, and are also available in ref. 13. Three independent PCR reactions were performed for each sample, combined and purified with Ampure magnetic purification beads (Agencourt), and the products were visualized by gel electrophoresis. The products were quantified, and a master DNA pool was generated from the purified products in equimolar ratios13. The pooled products were sequenced using an Illumina Miseq sequencing platform at the Emory Integrated Genomics Core (EIGC), Emory University. Bioinformatics analysis was performed using QIIME (Quantitative Insights into Microbial Ecology). Sequences were assigned to operational taxonomic units (OTUs) with UPARSE using 97% pairwise identity and were classified taxonomically using the RDP classifier retrained with Greengenes22. After chimera removal, the average number of reads per sample was 19,721. A single representative sequence for each OTU was aligned using PyNAST23, and a phylogenetic tree was then built using FastTree24. The phylogenetic tree was used to compute the UniFrac distances25. The PCoA analysis shown is unweighted. Bacterial characteristics including anaerobiosis and the preference for mucin of Akkermansia, Coprococcus, Mucispirillum, Odoribacter, Prevotella, Oscillospira and Lactobacillus were confirmed by a literature search using the genus name as well as the terms anaerobe or mucin and its glycosylated moieties. Linear discriminant analysis (LDA) scores were determined as in ref. 26.
FISH analysis
Carnoy’s fixed and paraffin-embedded colonic tissue sections were lysozyme-treated and washed12. Hybridization was performed by a universal bacterial probe directed against the 16S rRNA gene (GCTGCCTCCCGTAGGAGT)27. The sequence of the control non-specific probe was ACTCCTACGGGAGGCAGC27. The Akkermansia-specific probe sequence was CCTTGCGGTTGGCTTCAGAT8,28. In the present study, Akkermansia-specific probes were also tested against pure cultures of a number of enteric bacteria (Supplementary Fig. 2g) by FISH analysis on a multi-well glass slide coated with gelatin following the protocol described Pernthaler and colleagues29. In brief, the harvested and fixed pure cultures of bacteria were spotted on slides, hybridized with FISH probes as described above, and washed. Strain-specific FISH probes or universal probes were 5′-labelled with Cy3 or Cy5.
Endoscopy in live mice
To create discrete mucosal injuries in the mouse colon and to monitor their regeneration, a high-resolution miniaturized colonoscope system (Coloview Veterinary Endoscope, Karl Stortz) was used as described previously9. In brief, this system consisted of a miniature rigid endoscope (1.9 mm outer diameter), a xenon light source, a triple-chip high-resolution charge-coupled device camera, and an operating sheath with instrument channels and an air/water injection bulb to regulate inflation of the mouse colon (all from Karl Storz). The endoscope with outer operating sheath was inserted into the mid-descending colon and the mucosa was surveyed to the ano-rectal junction. The flexible biopsy forceps (diameter, French size 3) were inserted to remove single full-thickness areas of the entire mucosa and submucosa. On a flat-panel colour monitor, endoscopic procedures were viewed with high-resolution (1,024 × 768 pixels) images. This enabled us to take both video and still images of the endoscopic procedures. We used a 0.5 mm rod to calibrate our technique for measuring the wound size according to the methods of Seno and colleagues11. Image J software (National Institutes of Health) was used to analyse the wound sizes. Two independent operators acquired the data in a blinded fashion10. Mice were anaesthetized using ketamine and xylazine. We took particular care to avoid penetration of the muscularis propria9.
Wound-bed tissue preparation
Mucosal tissues containing the wound bed were preserved at −20 °C in optimal cutting temperature (OCT) media and frozen to perform immunofluorescence microscopy and histopathologic analysis. For histological analysis, wounds were oriented and cut in a proximal to distal manner and sections were prepared in 7 μm increments. As described in ref. 9, the sections with the largest area of the wound bed were considered the centre of the wound and were used for immunofluorescence staining. According to the protocol described by Johansson and colleagues, Carnoy’s fixatives were used as the standard method to preserve mucins in the wound tissues, which were subsequently used to perform FISH analysis of the microbiota as well as the detection of mucin proteins12,27. The wound-bed gross morphology was studied with a dissection microscope.
Cell migration in vivo
An EdU chase assay was used to determine epithelial migration to cover the wound bed9. Mice were injected intraperitonial (I.P.) with EdU at the time of biopsy injury and were euthanized two to four days later (that is, a chase assay of 2–4 days). This method is explained in Supplementary Fig. 7a. An intrarectal dose containing a 100 μl volume of 6 × 10⁸ c.f.u. ml−1 A. muciniphila suspension was administered for the abovementioned days. Immunohistochemical localization of EdU-labelled (red, Fig. 4f) cells was carried out using a Click-iT EdU Alexa Fluor Imaging Kit (Invitrogen). Sections were also immunostained for β-catenin (green, Fig. 4f) to identify enterocytes.
Cell migration in vitro
SK-CO15 monolayers were subjected to scratch wound assay in the presence of A. muciniphila, inoculated every 2 h. Wound areas were determined at 0 and 6 h, according to the methods as described in ref. 10. SK-CO15 cell monolayers were also incubated with Akkermansia and NAC (20 mM) or BOC2 (1 μg ml−1).
Cell proliferation in vivo
This method is explained in Supplementary Fig. 6a. EdU was administered I.P. at different time points (days 0, 1 and 2) after inflicting biopsy injury in mice. An intrarectal dose containing a 100 μl volume of 6 × 10⁸ c.f.u. ml−1 A. muciniphila suspension was administered for the abovementioned days. Mice were euthanized 2 h post EdU administration (pulse, 2 h), and tissue sections containing wound beds were collected in OCT medium and frozen. S-phase cells were detected by immunohistochemical localization of EdU-labelled cells using the Click-iT EdU Alexa Fluor Imaging Kit (Invitrogen).
Immunofluorescence
To determine the activation of phosphorylation of ERK in epithelial cells, intrarectal administrations of HBSS (Hank’s buffer salt solution), or A. muciniphila (ATCC BAA835) for the indicated times, were performed in anaesthetized mice. An intrarectal dose containing a 100 μl volume of 6 × 10⁸ c.f.u. ml−1 A. muciniphila suspension was administered. Mice were euthanized, and colons were opened along the mesenteric border. Mucosal tissues with the wound bed were preserved at −20 °C in OCT media and frozen. Antibodies were obtained as follows: anti ERK, phospho-ERK (Cell Signaling), anti MUC3 (Santa Cruz), anti MUC2 (Thermo Scientific), β-actin (Sigma-Aldrich), fluorescein (FITC)-conjugated goat anti-rabbit IgG (Jackson ImmunoResearch, and HRP-conjugated donkey anti-rabbit or sheep anti-mouse secondary antibody (GE Healthcare). Immunoblot and immunofluorescent labelling slips were performed as described previously15. Nuclei were stained with To-Pro3 iodide (Molecular Probes). Fluorescent images acquired by laser confocal microscopy.
ROS assay in vivo
To determine cellular ROS in the murine biopsy injury model, a ROS-sensitive dye, hydrocyanine 3, was used16. Hydrocyanine 3 is non-toxic and stable in vivo, and fluoresces when oxidized by ROS17,30. Mice were anaesthetized, followed by intrarectal injection with hydrocyanine 3. After 30 min of Hydro-Cy3 injection, biopsy injuries were made, and HBSS, A. muciniphila, LGG or E. coli were administrated for 15 min. To determine the dose response (as shown in Supplementary Fig. 5), intrarectal doses containing 100 μl volumes of different concentrations of A. muciniphila (2.5 × 10⁷ to 2.5 × 10⁹ c.f.u. ml−1) suspensions were administered. A dose of 100 μl of 6 × 10⁸ c.f.u. ml−1 A. muciniphila suspension yielded a maximum ROS generation, and was also used for subsequent in vivo analysis. Mice were euthanized, the colons were opened along the mesenteric border, and tissues were collected. After mounting on slides, samples were examined by confocal laser scanning microscopy. Images were captured using 535 nm laser extinction and a 560 nm emission filter. ImageJ software (National Institutes of Health) was used to analyse and measure the fluorescence intensity, and was expressed in units of fluorescence.
Cell culture
Methods of cell culture were as described previously18. To determine the epithelial-cell-autonomous effect, human intestinal epithelial cell line SK-CO15 was grown on membrane inserts in high-glucose (4.5 g l−1) DMEM supplemented with 10% FBS, 100 units per ml penicillin, 100 μg ml−1 streptomycin, 15 mM HEPES (pH 7.4), 2 mM L-glutamine, and 1% non-essential amino acids at 37 °C in a 4% CO2 incubator.
Akkermansia-specific qPCR
To quantify the Akkermansia abundance, we used validated primers specific for A. muciniphila: forward A. muciniphila, CAGCACGTGAAGGTGGGGAC, reverse A. muciniphila, CTTGCGGTTGGCTTCAGAT8,19,28,31. Primers were also tested to amplify a single amplicon length of 328 and were subsequently sequenced for verification. For quantification, total microbial DNA and universal bacterial primer sets 515F and 806R were used (GTGCCAGCMGCCGCGGTAA and GGACTACHVGGGTWTCTAAT)27,28,31. Detection was achieved using a FAST SYBR Green Master mix according to the manufacturer’s instructions. Standard curves were created using serial twofold dilutions of pure culture A. muciniphila genomic DNA. For Akkermansia-specific primers, the standard curve employed genomic DNA in the following amounts per reaction (in pg): 400, 200, 100, 50, 25, 12.5, 6.25, 3.13 and 1.56, as well as a no-DNA control (R2 = 0.9934). For qPCR with universal primer sets, the standard curve employed genomic DNA in the following amounts per reaction (ng): 10, 5, 2.5, 1.25, 0.63, 0.31, 0.16 and 0.08, as well as a no-DNA control (R2 = 0.9961). The following reverse transcriptase-PCR (RT-PCR) protocol was followed: 95 °C for 15 min, 40 cycles of 95 °C for 15 s, 66 °C (Akkermansia) and 50 °C (universal) for 40 s, and 72 °C for 30 s. A melting curve was performed after amplification to distinguish between the targeted and non-targeted PCR products. All reactions were performed in duplicate. According to ref. 31, bacterial abundance was analysed as genome equivalents, where A. muciniphila was assigned a multiplier of 3.42 × 10⁵ genome equivalents per ng DNA based on its genome size (2.66 Mbp; ATCC BAA-835)31. In addition, the gut microbial community as a whole was assigned a multiplier of 2.03 × 10⁵ based on a mean genome size of 4.50 Mbp (ref. 31). For qPCR analyses, the sample-specific relative abundance of A. muciniphila was determined as genome equivalents amplified by Akkermansia-specific primers divided by genome equivalents amplified by universal primers. Absolute abundance per gram of tissues was determined by adjusting for the dilutions performed during DNA extraction, normalization and qPCR setup, and dividing this concentration by the total grams of tissues utilized for the original DNA extraction. Finally, data were expressed as a fold change in wound tissues collected from different mouse backgrounds compared to intact mucosa of the WT mice.
qRT-PCR for quantifying gene expression
Total RNA was isolated from the distal small intestine using the Qiagen RNeasy RNA isolation kit and was used to synthesize cDNA. qPCR analysis was performed using the SYBR Green Master Mix (Invitrogen) and previously validated specific primer sets14 (glut1 TGCCTTGGATGTCCTATCTG and ACCAGGGCCTACTTCAAAGA; muc2 CCCAGAAGGGACTGTGTATG and TTGTGTTCGCTCTTGGTCAG; muc3 TGGTCAACTGCGAGAATGGA and TACGCTCTCCACCAGTTCCT). Signals were normalized to 18S rRNA levels within each sample and the normalized data were used to calculate the relative levels of gene expression using ΔΔCt analysis. Primer efficiencies were between 104 and 108%. Finally, data were expressed as the fold change in wound tissues collected from different mouse backgrounds compared to intact mucosa of the WT mice. A specific and potent HIF1α inhibitor (BAY 87-2243; Selectchem) was administered intrarectally (4 mg kg−1 body weight) or a MUC3 peptide (~Asp2236–Val2356; 1 or 5 μg peptide in 100 μl PBS dosage per day per mouse; Cloud-clone Corp.). Data are shown for higher concentration in Supplementary Fig. 3g.
DSS colitis
Mice were allowed free access to food and drinking water containing 3% (wt/vol) DSS for 6 days, and recovery was allowed for an additional 6 days. Daily clinical assessment and histological analysis were performed as described previously9,10. In accordance with ref. 10, an analysis of the percentage of ulceration in whole colon samples was performed using scanned photomicrographs of haematoxylin and eosin (H&E)-stained histological sections of the whole colon (Swiss role) of the mice and measuring the ulcerated (denuded mucosa) area to compare it with the colon length of each mouse10.
Statistics
Quantitative data are expressed as mean ± s.e.m. or s.d. for each treatment group. Each experiment was repeated three times or more. Statistical comparisons were performed using a two-tailed Student’s t-test or analysis of variance (ANOVA) with Tukey’s multiple comparison post-test (GraphPad Prism; GraphPad Software). P values less than 0.05 were considered significant (*P < 0.05; **P < 0.01).
Acknowledgments
The authors thank F. David, R. Isett, J. Taylor, H. Yi, M. Zwick and C. Kraft for helpful input. This work was supported by grants RO1DK089763 to A.S.N. and A.N., RO1DK055679 to A.N. and RO1AI64462 to A.S.N. A.A. is supported by a Career Development Award from the Crohn’s and Colitis Foundation of America.
Footnotes
Accession numbers
Sequencing data have been deposited in the European Nucleotide Archive under the accession PRJEB9302.
Author contributions
A.A., A.N. and A.S.N. conceptualized the study, directed the work and wrote the manuscript. A.A., G.L. A.N. and A.S.N. planned and analysed the experiments. R.M.J., A.A., G.L., M.Q., H.W., C.D. and H.N. performed the experiments.
Additional information
Supplementary information is available online.
Competing interests
The authors declare no competing financial interests.
References
- 1.Hooper LV, et al. Molecular analysis of commensal host-microbial relationships in the intestine. Science. 2001;291:881–884. doi: 10.1126/science.291.5505.881. [DOI] [PubMed] [Google Scholar]
- 2.Backhed F, Ley RE, Sonnenburg JL, Peterson DA, Gordon JI. Host–bacterial mutualism in the human intestine. Science. 2005;307:1915–1920. doi: 10.1126/science.1104816. [DOI] [PubMed] [Google Scholar]
- 3.Pull SL, Doherty JM, Mills JC, Gordon JI, Stappenbeck TS. Activated macrophages are an adaptive element of the colonic epithelial progenitor niche necessary for regenerative responses to injury. Proc Natl Acad Sci USA. 2005;102:99–104. doi: 10.1073/pnas.0405979102. [DOI] [PMC free article] [PubMed] [Google Scholar]
- 4.Lotz MM, et al. Intestinal epithelial restitution. Involvement of specific laminin isoforms and integrin laminin receptors in wound closure of a transformed model epithelium. Am J Pathol. 1997;150:747–760. [PMC free article] [PubMed] [Google Scholar]
- 5.Miyoshi H, Ajima R, Luo CT, Yamaguchi TP, Stappenbeck TS. Wnt5a potentiates TGFβ signaling to promote colonic crypt regeneration after tissue injury. Science. 2012;338:108–113. doi: 10.1126/science.1223821. [DOI] [PMC free article] [PubMed] [Google Scholar]
- 6.Colgan SP, Curtis VF, Campbell EL. The inflammatory tissue microenvironment in IBD. Inflamm Bowel Dis. 2013;19:2238–2244. doi: 10.1097/MIB.0b013e31828dcaaf. [DOI] [PMC free article] [PubMed] [Google Scholar]
- 7.Derrien M, Vaughan EE, Plugge CM, de Vos WM. Akkermansia muciniphila gen nov., sp nov., a human intestinal mucin-degrading bacterium. Int J Syst Evol Microbiol. 2004;54:1469–1476. doi: 10.1099/ijs.0.02873-0. [DOI] [PubMed] [Google Scholar]
- 8.Everard A, et al. Cross-talk between Akkermansia muciniphila and intestinal epithelium controls diet-induced obesity. Proc Natl Acad Sci USA. 2013;110:9066–9071. doi: 10.1073/pnas.1219451110. [DOI] [PMC free article] [PubMed] [Google Scholar]
- 9.Alam A, et al. Redox signaling regulates commensal-mediated mucosal homeostasis and restitution and requires formyl peptide receptor 1. Mucosal Immunol. 2014;7:645–655. doi: 10.1038/mi.2013.84. [DOI] [PMC free article] [PubMed] [Google Scholar]
- 10.Leoni G, et al. Annexin A1, formyl peptide receptor, and NOX1 orchestrate epithelial repair. J Clin Invest. 2013;123:443–454. doi: 10.1172/JCI65831. [DOI] [PMC free article] [PubMed] [Google Scholar]
- 11.Seno H, et al. Efficient colonic mucosal wound repair requires Trem2 signaling. Proc Natl Acad Sci USA. 2009;106:256–261. doi: 10.1073/pnas.0803343106. [DOI] [PMC free article] [PubMed] [Google Scholar]
- 12.Johansson ME, et al. The inner of the two Muc2 mucin-dependent mucus layers in colon is devoid of bacteria. Proc Natl Acad Sci USA. 2008;105:15064–15069. doi: 10.1073/pnas.0803124105. [DOI] [PMC free article] [PubMed] [Google Scholar]
- 13.Caporaso JG, et al. Ultra-high-throughput microbial community analysis on the Illumina HiSeq and MiSeq platforms. ISME J. 2012;6:1621–1624. doi: 10.1038/ismej.2012.8. [DOI] [PMC free article] [PubMed] [Google Scholar]
- 14.Campbell EL, et al. Transmigrating neutrophils shape the mucosal microenvironment through localized oxygen depletion to influence resolution of inflammation. Immunity. 2014;40:66–77. doi: 10.1016/j.immuni.2013.11.020. [DOI] [PMC free article] [PubMed] [Google Scholar]
- 15.Wentworth CC, Alam A, Jones RM, Nusrat A, Neish AS. Enteric commensal bacteria induce extracellular signal-regulated kinase pathway signaling via formyl peptide receptor-dependent redox modulation of dual specific phosphatase 3. J Biol Chem. 2011;286:38448–38455. doi: 10.1074/jbc.M111.268938. [DOI] [PMC free article] [PubMed] [Google Scholar]
- 16.Swanson PA, II, et al. Enteric commensal bacteria potentiate epithelial restitution via reactive oxygen species-mediated inactivation of focal adhesion kinase phosphatases. Proc Natl Acad Sci USA. 2011;108:8803–8808. doi: 10.1073/pnas.1010042108. [DOI] [PMC free article] [PubMed] [Google Scholar]
- 17.Jones RM, et al. Symbiotic lactobacilli stimulate gut epithelial proliferation via Nox-mediated generation of reactive oxygen species. EMBO J. 2013;32:3017–3028. doi: 10.1038/emboj.2013.224. [DOI] [PMC free article] [PubMed] [Google Scholar]
- 18.Babbin BA, et al. Formyl peptide receptor-1 activation enhances intestinal epithelial cell restitution through phosphatidylinositol 3-kinase-dependent activation of Rac1 and Cdc42. J Immunol. 2007;179:8112–8121. doi: 10.4049/jimmunol.179.12.8112. [DOI] [PubMed] [Google Scholar]
- 19.Reunanen J, et al. Akkermansia muciniphila adheres to enterocytes and strengthens the integrity of epithelial cell layer. Appl Environ Microbiol. 2015;81:3655–3662. doi: 10.1128/AEM.04050-14. [DOI] [PMC free article] [PubMed] [Google Scholar]
- 20.Derrien M, et al. Modulation of mucosal immune response, tolerance, and proliferation in mice colonized by the mucin-degrader Akkermansia muciniphila. Front Microbiol. 2011;2:166. doi: 10.3389/fmicb.2011.00166. [DOI] [PMC free article] [PubMed] [Google Scholar]
- 21.Hamady M, Walker JJ, Harris JK, Gold NJ, Knight R. Error-correcting barcoded primers for pyrosequencing khundreds of samples in multiplex. Nature Methods. 2008;5:235–237. doi: 10.1038/nmeth.1184. [DOI] [PMC free article] [PubMed] [Google Scholar]
- 22.McDonald D, et al. An improved Greengenes taxonomy with explicit ranks for ecological and evolutionary analyses of abacteria and archaea. ISME J. 2012;6:610–618. doi: 10.1038/ismej.2011.139. [DOI] [PMC free article] [PubMed] [Google Scholar]
- 23.Caporaso JG, et al. PyNAST: a flexible tool sfor aligning sequences to a template alignment. Bioinformatics. 2010;26:266–267. doi: 10.1093/bioinformatics/btp636. [DOI] [PMC free article] [PubMed] [Google Scholar]
- 24.Price MN, Dehal PS, Arkin AP. FastTree: kcomputing large minimum evolution trees with profiles instead of a distance matrix. Mol Biol Evol. 2009;26:1641–1650. doi: 10.1093/molbev/msp077. [DOI] [PMC free article] [PubMed] [Google Scholar]
- 25.Lozupone C, Knight R. UniFrac: a new phylogenetic method for comparing microbial communities. Appl Environ Microbiol. 2005;71:8228–8235. doi: 10.1128/AEM.71.12.8228-8235.2005. [DOI] [PMC free article] [PubMed] [Google Scholar]
- 26.Segata N, et al. Metagenomic biomarker discovery and explanation. Genome Biol. 2011;12:R60. doi: 10.1186/gb-2011-12-6-r60. [DOI] [PMC free article] [PubMed] [Google Scholar]
- 27.Vaishnava S, et al. The antibacterial lectin RegIIIgamma promotes the spatial segregation of microbiota and host in the intestine. Science. 2011;334:255–258. doi: 10.1126/science.1209791. [DOI] [PMC free article] [PubMed] [Google Scholar]
- 28.Derrien M, Collado MC, Ben-Amor K, Salminen S, de Vos WM. The Mucin degrader Akkermansia muciniphila is an abundant resident of the human intestinal tract. Appl Environ Microbiol. 2008;74:1646–1648. doi: 10.1128/AEM.01226-07. [DOI] [PMC free article] [PubMed] [Google Scholar]
- 29.Pernthaler J, Glöckner F-O, Schönhuber W, Amann R. In: Methods in Microbiology: Marine Microbiology. Paul J, editor. Vol. 30. Academic Press; 2001. pp. 207–210. http://go.nature.com/CdPztu. [Google Scholar]
- 30.Kundu K, et al. Hydrocyanines: a class of fluorescent sensors that can image reactive oxygen species in cell culture, tissue, and in vivo. Angew Chem Int Ed Engl. 2009;48:299–303. doi: 10.1002/anie.200804851. [DOI] [PMC free article] [PubMed] [Google Scholar]
- 31.Roopchand DE, et al. Dietary polyphenols promote growth of the gut bacterium Akkermansia muciniphila and attenuate high-fat diet-induced metabolic syndrome. Diabetes. 2015;64:2847–2858. doi: 10.2337/db14-1916. [DOI] [PMC free article] [PubMed] [Google Scholar]