

Abstract
Background
The optimal range of blood pressure variability remains unclear. We aimed to stratify the degree of risk of stroke based on visit‐to‐visit systolic blood pressure (SBP) variability in a large Chinese hypertensive population in 32 communities.
Methods and Results
We retrospectively analyzed the data of 20 702 hypertensive patients from the China Stroke Primary Prevention Trial. The participants were randomized into 2 treatment groups to receive either enalapril or enalapril plus folic acid. Their blood pressures were measured every 3 months. The outcome was the first stroke. Three parameters of SBP variability were calculated: standard deviation, coefficient of variation, and average real variability. The records of first 4, 6, 8, 10 and 12 visits at which SBP was measured were used to calculate SBP variability and to predict subsequent stroke risk in adjusted Cox regression models. After median follow‐up of 4.5 years, 597 patients had experienced stroke. Visit‐to‐visit SBP variability was an independent predictor of subsequent stroke (eg, the hazard ratio for the highest quintile of average real variability [22.67–61.07 mm Hg] over 6 visits was 1.55, 95% CI 1.07–2.25, P=0.021), independent of mean SBP over the follow‐up period. Its value was more predictive when more blood pressure records were used.
Conclusions
Visit‐to‐visit SBP variability is an independent predictor of primary stroke in Chinese hypertensive patients. This predictive value depends on the number of blood pressure measurements used to calculate variability but is independent of mean SBP.
Clinical Trial Registration
URL: http://www.clinicaltrials.gov. Unique identifier: NCT00794885.
Keywords: hypertension, stroke, systolic blood pressure variability
Subject Categories: Epidemiology, Hypertension, Cerebrovascular Disease/Stroke
Introduction
Stroke is the leading cause of death in China and the second leading cause of death in the world.1 Almost 77% of strokes are first attacks; therefore, primary prevention is of great importance.2 Hypertension is the most treatable and prevalent risk factor for stroke.3, 4 It affects >1 billion people around the world.5 In China, ≈200 million people suffer from hypertension.6 The diagnosis and treatment of hypertension focus on comparisons to the normal blood pressure (BP) range,7, 8, 9 which is calculated by the average BP during a defined period, according to all major clinical guidelines.10, 11, 12 Recently, debate has ensued regarding the optimal BP level. Although visit‐to‐visit systolic BP variability (SBPV) has proven to be a strong predictor of stroke, independent of mean systolic BP (SBP),13 it is still often dismissed or considered a random phenomenon.14 Visit‐to‐visit BP variability (BPV) represents episodic hypertension, which is usually untreated because the patient's BP may be within the normal range during the requisite repeated readings.8, 9 In the Oxford vascular study, 87% of the 150 patients had an average SBP >160 mm Hg during the previous 10 years, but 69% had an SBP <130 mm Hg on at least 2 visits.15
Several prior studies have focused on the relationship between visit‐to‐visit BPV and stroke primary prevention, but the optimal stable range of BPV is still unclear, as are the numbers of BP measurements and the intervals between visits that are used to calculate BPV. We studied a large cohort of hypertensive patients from 32 communities in Jiangsu and Anhui provinces from the China Stroke Primary Prevention Trial (CSPPT) and analyzed the different predictive values of visit‐to‐visit SBPV across different numbers of visits regarding stroke.
Methods
Study Population and Data Source
All patients in this study were participants in the CSPPT; the design and methods of the CSPPT have been described elsewhere.16 In brief, the CSPPT was a large, long‐term, multicommunity, controlled, randomized, double‐blind study. Half of the participants received enalapril and folic acid and half received enalapril alone to evaluate the effect of folic acid on lowering BP and blood homocysteine levels in reducing the risk of stroke and other cardiovascular events in Chinese hypertensive patients. In total, 20 702 hypertensive patients were screened and enrolled from May 2008 to May 2009. Hypertension was defined as SBP ≥140 mm Hg and/or diastolic BP ≥90 mm Hg at the screening visit and recruitment visit or, alternatively, currently under hypertension treatment. All participants were aged 45 to 75 years without any history of stroke, myocardial infarction, heart failure, coronary revascularization, congenital heart disease, and secondary hypertension. Details of inclusion and exclusion criteria have been described previously.16 Written informed consent was obtained from each patient, and the protocol was approved by the ethics committees of the relevant institutional review boards.
Follow‐up and Outcomes
After a 3‐week run‐in treatment, participants were followed up every 3 months. BP, study outcome events, and other details were recorded on each visit.
Stroke was the primary outcome, and it was defined (1) as rapidly developed clinical signs of focal or global deficits of cerebral function with symptoms lasting for ≥24 hours unless interrupted by surgery or death or (2) as a demonstrated lesion on brain computed tomography or magnetic resonance imaging scan 24 hours to 3 months after the attack that is consistent with clinical signs and with no apparent causes other than vascular origin. If no brain computed tomography or magnetic resonance imaging scan was available, stroke was still diagnosed in the presence of the specific symptoms and signs of focal disturbance of cerebral function.
The stroke was further divided into ischemic, hemorrhagic, or undetermined stroke based on the following criteria. Ischemic stroke was defined as an acute episode of focal cerebral function deficit caused by an infarction of the central nervous system. Hemorrhage may be a consequence. In this situation, the stroke was still an ischemic stroke with hemorrhagic transformation but was not a hemorrhagic stroke. Hemorrhagic stroke was defined as an acute episode of focal or global cerebral function deficit caused by intraparenchymal, intraventricular hemorrhage; however, subarachnoid hemorrhage was not an end point event of this study. Undetermined stroke was defined as a stroke with no imaging data available to categorize ischemic or hemorrhagic stroke.
Because patients with stroke histories were excluded, the first attack of symptomatic stroke during the follow‐up period was regarded as the first attack. Any stroke after the first stroke was regarded as a recurrent stroke, which was not the primary end point of this study.
The end point working group consisted of 2 neurologists, who collected relevant medical information and made preliminary assessments of the suspected end point events. Every case reported as a stroke event by both neurologists was further reviewed by the end point adjudication committee, which consisted of 3 neurologists. The end point adjudication committee was blinded to treatment and the resultant diagnosis. The data of each suspected case was reviewed by one of the neurologists on the end point adjudication committee to determine whether or not the case met the stroke definition criteria. When a case was questionable, all end point adjudication committee neurologists reviewed the data and could request additional data to resolve the disagreement. For such case, a final assessment was made by the committee chairman.
BP Measurement
BP was measured manually by a trained researcher using a standard mercury sphygmomanometer. Participants did not smoke or drink coffee in the 30 minutes prior to the measurement and took their regular medications as usual. After resting 5 minutes in a seated position, BP was measured 3 times. The average of at least 2 valid readings in each follow‐up visit was recorded and used for further analyses.
Basic Information
Sex, age, alcohol consumption, and cigarette smoking were recorded using questionnaires. Participants' height and weight were also measured at the recruitment visit. Body mass index (BMI) was calculated as weight in kilograms by height in square meters (kg/m2).
Laboratory Tests
The laboratory test results were from the baseline data collected at the recruitment visit, including fasting plasma glucose, triglycerides, total cholesterol, high‐density lipoprotein cholesterol, and blood homocysteine and creatinine.
Visit‐to‐Visit SBPV Parameters
In this study, 3 parameters of BPV were calculated: the first for standard deviation (SD) of SBP (SBPV‐SD), the second for coefficient variation (CV) of SBP (SBPV‐CV), and the third for average real variability (ARV) of SBP (SBPV‐ARV).
Statistical Analysis
SBPV quintiles were used to describe patient characteristics. Continuous data assumed to have normal distribution were described as mean±SD. Continuous data not assumed to have normal distribution were presented as median values (25th and 75th percentiles). Categorical variables are described as frequencies or percentages. Continuous data in different groups were compared by ANOVA or independent t tests, and categorical variables were compared by chi‐square tests. Variability of visit‐to‐visit SBP was quantified using 3 sets of analyses: Standard deviation:
Coefficient of variation:
Average real variability:
The first‐visit BP (or baseline BP) was excluded. The other visits with valid BP readings were used for further analyses. The first 4, 6, 8, 10, and 12 visits at which BP was measured in patients who did not have stroke during the respective between‐visit periods were used to calculate BPV. Patients who had a stroke between visits or who did not have at least the respective number of visits at which BP was measured were excluded. The association between patient characteristics and visit‐to‐visit BPV was assessed by linear regression. Multivariate Cox proportional hazard regression models were used to test the predictive power of subsequent, ischemic, and hemorrhagic stroke after the respective number of follow‐up visits. BPV parameters were further divided by quintiles to test the dose‐response relationship between BPV and stroke risk. Hazard ratios (HRs) and corresponding 95% CIs were calculated in relation to the lowest quintile (referent). Trend tests were computed by modeling BPV quintiles and medians as continuous variables. In the primary Cox regression analysis, we adjusted for mean SBP over the respective number of visits, age, sex, study center, randomized treatment group (enalapril–folic acid or enalapril), and other baseline risk factors (baseline SBP, fasting glucose, total cholesterol, triglycerides, high‐density lipoprotein cholesterol, homocysteine, creatinine, smoking status, alcohol consumption, and BMI). Further subgroup analyses were conducted for sex, age >60 and <60 years, baseline BMI >25 and <25, and mean SBP >140 and <140 mm Hg over the respective number of visits. A value of P<0.05 was considered statistically significant for all analyses. All statistical analyses were performed using Empower Stats software (R)(www.empowerstats.com, X&Y Solutions, Inc. Boston, MA) and R software, version 3.2.0(http://www.R-project.org/).
Results
Patient Characteristics
In this study, 20 702 patients were from 32 communities in China, with a mean of 14.6 follow‐up visits, ranging from 1 to 22 visits, and a median follow‐up time of 4.5 years. The sample size for the total number of visits is available in Table S1. The number of included and excluded patients at respective visits is shown in Table S2. The flow of inclusion and exclusion procedures is shown in Figure 1. Patients characteristics can be found in Table 1.
Figure 1.

Flow of participants in the analysis of BPV over 6 visits. BPV indicates blood pressure variability; CSPPT, China Stroke Primary Prevention Trial.
Table 1.
Baseline Characteristics of Quintiles of Standard Deviation of SBP Over 6 Visits
| Q1 | Q2 | Q3 | Q4 | Q5 | |
|---|---|---|---|---|---|
| Quintile range, mm Hg | 1.24–9.90 | 9.90–12.74 | 12.74–15.46 | 15.46–19.15 | 19.15–43.55 |
| Patients, n | 3679 | 3907 | 3894 | 3935 | 3833 |
| Male, n (%) | 1580 (42.9) | 1556 (39.8) | 1564 (40.2) | 1558 (39.6) | 1572 (41.0) |
| Age, y, mean (SD) | 58.8 (7.5) | 59.2 (7.4) | 59.9 (7.5) | 60.6 (7.4) | 61.7 (7.4) |
| BMI, mean (SD) | 25.1 (3.6) | 25.1 (3.6) | 25.1 (3.6) | 24.9 (3.7) | 24.7 (3.8) |
| Fasting plasma glucose, mmol/L, mean (SD) | 5.8 (1.6) | 5.8 (1.7) | 5.8 (1.8) | 5.8 (1.7) | 5.8 (1.7) |
| TG, mmol/L, mean (SD) | 1.7 (0.9) | 1.7 (1.0) | 1.7 (1.8) | 1.6 (0.9) | 1.6 (0.9) |
| TC, mmol/L, mean (SD) | 5.5 (1.2) | 5.5 (1.2) | 5.5 (1.2) | 5.5 (1.2) | 5.5 (1.2) |
| HDL, mmol/L, mean (SD) | 1.3 (0.4) | 1.3 (0.4) | 1.3 (0.4) | 1.4 (0.4) | 1.4 (0.4) |
| Homocysteine, μmol/L, mean (IQR) | 12.4 (10.3–15.2) | 12.3 (10.3–15.1) | 12.5 (10.4–15.4) | 12.5 (10.5–15.6) | 12.8 (10.8–16.0) |
| Creatinine, mg/dL, mean (SD) | 65.8 (16.6) | 65.2 (16.5) | 65.6 (17.9) | 65.7 (17.9) | 66.7 (18.4) |
| Baseline SBP, mm Hg, mean (SD) | 160.5 (17.2) | 163.2 (18.7) | 165.8 (19.3) | 169.2 (20.0) | 175.9 (22.6) |
| Baseline DBP, mm Hg, mean (SD) | 92.9 (10.9) | 93.2 (11.4) | 94.0 (12.0) | 94.3 (12.0) | 95.8 (13.0) |
| Smoking status, n (%) | |||||
| Never | 2572 (69.9) | 2753 (70.5) | 2682 (68.9) | 2771 (70.5) | 2531 (66.1) |
| Former | 314 (8.5) | 271 (6.9) | 303 (7.8) | 282 (7.2) | 286 (7.5) |
| Current | 792 (21.5) | 881 (22.6) | 908 (23.3) | 880 (22.4) | 1014 (26.5) |
| Alcohol consumption, n (%) | |||||
| Never | 2554 (69.5) | 2702 (69.2) | 2698 (69.3) | 2781 (70.7) | 2575 (67.2) |
| Former | 263 (7.2) | 290 (7.4) | 279 (7.2) | 256 (6.5) | 275 (7.2) |
| Current | 860 (23.4) | 913 (23.4) | 915 (23.5) | 896 (22.8) | 980 (25.6) |
| Treatment group | |||||
| Enalapril | 1826 (49.6) | 1973 (50.5) | 1930 (49.6) | 1949 (49.5) | 1904 (49.7) |
| Enalapril–folic acid | 1853 (50.4) | 1934 (49.5) | 1964 (50.4) | 1986 (50.5) | 1929 (50.3) |
BMI indicates body mass index; DBP, diastolic blood pressure; HDL, high‐density lipoprotein cholesterol; IQR, interquartile range; Q1 to Q5, each quintile of standard deviation over 6 visits; SBP, systolic blood pressure; TC, total cholesterol; TG, triglycerides.
We also examined whether there was a significant difference in baseline SBP, mean SBP, and visit‐to‐visit SBPV over the respective visits between participants receiving enalapril only and enalapril plus folic acid, and the results were insignificant (Table S3). Consequently, the data from the 2 treatment groups were combined. In the subsequent analyses, however, the data were adjusted for randomized treatment group to avoid the effect of drugs on stroke outcomes. Reproducibility of variability was moderate (intraclass correlation coefficient for SBPV‐SD was 0.21, 95% CI 0.19–0.22, visit 1−N/2 versus visit N/2−N, in which N is the total number of visit times).
Association Between Visit‐to‐Visit SBPV and Mean SBP
Higher quintiles of BPV over respective visits were associated with higher mean SBP during respective follow‐up periods and higher baseline SBP. There was only a weak correlation among the 3 measures of visit‐to‐visit SBPV and average SBP during the follow‐up period (eg, when n=6, r<0.4, [SD 0.33, CV 0.10, ARV 0.29]). The results are shown in Tables S4 through S6.
Association Between Visit‐to‐Visit SBPV and Stroke
After adjustment for mean SBP over 4, 6, and 8 visits, age, sex, center, randomized treatment group (enalapril–folic acid or enalapril), and other baseline risk factors (baseline SBP, fasting glucose, total cholesterol, triglycerides, high‐density lipoprotein cholesterol, homocysteine, creatinine, smoking status, alcohol consumption, and BMI), the 3 variables for SBPV (SD, CV, and ARV) over 4, 6, and 8 visits were independent predictors of subsequent stroke (eg, CV over 8 visits: HR 1.05, 95% CI 1.01–1.09, P<0.01) (Table S7). However, when SBPV was calculated over >8 visits, SD and CV failed to show significant associations with the risk of subsequent stroke in the multivariate regression model. ARV failed to show a significant association with the risk of subsequent stroke when it was calculated over >10 visits.
When we further divided stroke into ischemic stroke and hemorrhagic stroke, SBPV over 4, 6, 8, 10, and 12 visits was an independent predictor of subsequent ischemic stroke (eg, CV over 8 visits: HR 1.06, 95% CI 1.01–1.10, P<0.01). SBPV‐ARV, however, failed to show predictive value over >10 visits. SBPV had no association with hemorrhagic stroke in the multivariate regression models (Tables S8 and S9).
For comparison, we also analyzed the value of mean SBP over respective visits to predict subsequent, ischemic, and hemorrhagic stroke in the multivariate Cox regression model (adjusting for sex, age, study center, and baseline risk factors for stroke) (Tables S7 through S9). The results showed that mean SBP was an independent predictor of stroke, ischemic stroke, and hemorrhagic stroke, even if the number of visits used to calculate the mean SBP varied.
Predictive Value of Different Visit‐to‐Visit SBPV Levels for Stroke
When divided into quintiles, higher SBPV quintiles over 4, 6, and 8 visits, respectively, had higher risks of subsequent stroke (eg, for 6 visits, see Figure 2 and Table S10; for 8 visits, see Figure S1 and Table S11). As the number of visits increased, the predictive value of the highest quintiles of SBPV was even greater (Table 2). Similar trends were found in the relationship of SBPV quintiles and subsequent ischemic stroke (Table S12).
Figure 2.
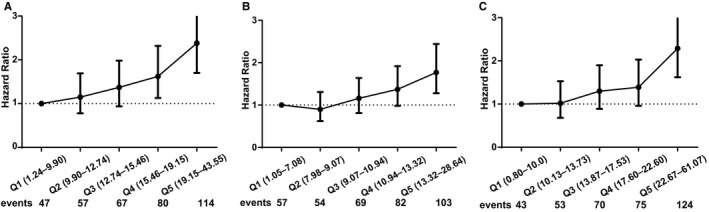
Hazard ratios for risk of subsequent stroke by quintiles of visit‐to‐visit systolic blood pressure standard deviation, coefficient of variation and average real variability over 6 visits, with the first quintile (Q1) as the reference. The hazard ratios (95% CI) for risks of subsequent stroke in a crude model by quintiles of visit‐to‐visit systolic blood pressure variability parameters over the first 6 visits. A, Standard deviation. B, Coefficient of variation. C, Average real variability. The first quintile of each parameter is the reference category. Numbers of subsequent stroke events by quintiles are given in Table S10; Q1 to Q5, each quintile of the same parameters.
Table 2.
HRs of Visit‐to‐Visit SBPV (Top Versus Bottom Quintile) and Mean SBP for the Risk of Subsequent Stroke, Calculated by Increasing Numbers of Visits
| Number of visits | HR for Mean SBP | HR for SBP Variability | ||
|---|---|---|---|---|
| HR (95% CI) P Value | HR (95% CI) P Value | |||
| SD | CV | ARV | ||
| 4 | 1.02 (1.01–1.03) | 1.33 (0.98–1.80) | 1.47 (1.09–1.98) | 1.44 (1.05–1.99) |
| <0.0001 | 0.068 | 0.012 | 0.026 | |
| 6 | 1.03 (1.02–1.03) | 1.49 (1.03–2.17) | 1.42 (1.01–2.01) | 1.55 (1.07–2.25) |
| <0.0001 | 0.035 | 0.045 | 0.021 | |
| 8 | 1.03 (1.02–1.04) | 1.59 (1.03–2.46) | 1.49 (1.00–2.21) | 1.78 (1.11–2.86) |
| <0.0001 | 0.038 | 0.051 | 0.017 | |
| 10 | 1.05 (1.03–1.06) | 1.41 (0.84–2.37) | 1.40 (0.87–2.24) | 1.60 (0.88–2.92) |
| <0.0001 | 0.19 | 0.16 | 0.12 | |
| 12 | 1.05 (1.03–1.07) | 0.91 (0.51–1.63) | 1.06 (0.63–1.76) | 1.66 (0.77–3.59) |
| <0.0001 | 0.76 | 0.83 | 0.19 | |
Each row shows the hazard ratio of visit‐to‐visit SBPV for subsequent stroke. The data are from patients who did not have a stroke during the first number of visits and had at least a respective number of visits. The model was adjusted for age, sex, center, treatment group, baseline stroke risk factors (baseline SBP, fasting glucose, total cholesterol, triglycerides, high‐density lipoprotein cholesterol, homocysteine, creatinine, smoking status, alcohol consumption, and body mass index), and mean SBP over the period of respective visits. Number of visits ranged from 4 (1 year) to 12 (4 years). ARV indicates average real variability; CV, coefficient of variation; HR, hazard ratio; SBP, systolic blood pressure; SBPV, systolic blood pressure variability; SD, standard deviation.
For example, when BPV was calculated over 6 visits, in the unadjusted Cox regression analyses, the HR of subsequent stroke increased when the SBPV levels increased; the HR for stroke was 2.38 (95% CI 1.70–3.35) for the highest versus the lowest quintiles of SBPV‐SD (19.15–43.55 versus 1.24–9.90 mm Hg), 1.77 (95% CI 1.28–2.44) for the highest versus the lowest quintile of SBPV‐CV (13.32–28.64% versus 1.05–7.08%), and 2.29 (95% CI 1.62–3.24) for the highest versus the lowest quintile of SBPV‐ARV (22.67–61.07 versus 0.80–10.00 mm Hg). The adjusted model (adjusted for sex, age, baseline risk factors, mean SBP, and number of visits) showed that the dose‐effect relationships among the 3 SBPV variables and subsequent stroke risk were still more significant in the highest quintiles after controlling for clinical data and mean SBP (6 visits: highest quintile of SD versus the lowest: HR 1.49, 95% CI 1.03–2.17, P=0.03; highest quintile of CV versus the lowest: HR 1.42, 95% CI 1.01–2.01, P=0.04; highest quintile of ARV versus the lowest: HR 1.55, 95% CI 1.07–2.25, P=0.02). Over 6 visits, the P value for trend was 0.0175 for the SBPV‐SD quintiles, 0.0065 for SBPV‐CV, and 0.0047 for SBPV‐ARV.
Different Predictive Values of Visit‐to‐Visit SBPV for Stroke by Stratification
When we further stratified the population by sex, there was no significant difference in visit‐to‐visit SBPV between male and female participants in our study (eg, BPV over 6 visits: SD, P=0.083; CV, P=0.140; ARV, P=0.093) (Table S13). Visit‐to‐visit SBPV‐SD, however, was more predictive for stroke in female than male participants after multivariate Cox regression analysis when calculated over number of visits; for example, adjusted HR for SBPV‐SD over 6 visits was 1.04 (95% CI 1.01–1.06) in female participants. Visit‐to‐visit SBPV‐CV and SBPV‐ARV showed the same predictive value for stroke in female participants (eg, 6 visits: adjusted HR for CV 1.06, 95% CI 1.02–1.10; adjusted HR for ARV 1.04, 95% CI 1.01–1.06) (Table 3).
Table 3.
Stratified Analysis of Multivariate HRs of Visit‐to‐Visit SBP Variability Over 6 Visits for Subsequent Stroke
| Events n (%) | Model 1a HR (95% CI) | Model 2b HR (95% CI) | P Valuec | |
|---|---|---|---|---|
| SD | ||||
| Male | 158 (2.0) | 1.05 (1.03–1.08)d | 1.03 (1.00–1.05) | 0.29 |
| Female | 207 (1.8) | 1.06 (1.04–1.09)d | 1.04 (1.01–1.06)d | |
| Aged <60 years | 138 (1.4) | 1.06 (1.03–1.09)d | 1.02 (0.99–1.05) | 0.24 |
| Aged ≥60 years | 227 (2.3) | 1.06 (1.04–1.08)d | 1.04 (1.02–1.06)d | |
| BMI <25 | 177 (1.7) | 1.05 (1.03–1.08)d | 1.02 (0.99–1.04) | 0.11 |
| BMI ≥25 | 188 (2.0) | 1.07 (1.04–1.09)d | 1.05 (1.02–1.08)d | |
| Mean SBP <140 mm Hg | 105 (1.2) | 1.04 (1.00–1.08)e | 1.04 (1.00–1.08) | 0.91 |
| Mean SBP ≥140 mm Hg | 260 (2.5) | 1.05 (1.03–1.07)d | 1.03 (1.01–1.05)d | |
| CV | ||||
| Male | 158 (2.0) | 1.05 (1.01–1.10)d | 1.04 (0.99–1.08) | 0.37 |
| Female | 207 (1.8) | 1.17 (1.03–1.11)d | 1.06 (1.02–1.10)d | |
| Aged <60 years | 138 (1.4) | 1.06 (1.01–1.10)e | 1.03 (0.98–1.07) | 0.23 |
| Aged ≥60 years | 227 (2.3) | 1.07 (1.03–1.10)d | 1.06 (1.02–1.10)d | |
| BMI <25 | 177 (1.7) | 1.05 (1.01–1.09)e | 1.03 (0.99–1.07) | 0.11 |
| BMI ≥25 | 188 (2.0) | 1.08 (1.04–1.13)d | 1.07 (1.03–1.12)d | |
| Mean SBP <140 mm Hg | 105 (1.2) | 1.05 (1.00–1.10) | 1.05 (0.99–1.10) | 0.94 |
| Mean SBP ≥140 mm Hg | 260 (2.5) | 1.03 (1.01–1.05)d | 1.05 (1.01–1.08)d | |
| ARV | ||||
| Male | 158 (2.0) | 1.04 (1.02–1.06)d | 1.02 (1.00–1.05) | 0.21 |
| Female | 207 (1.8) | 1.04 (1.03–1.06)d | 1.04 (1.01–1.06)d | |
| Aged <60 years | 138 (1.4) | 1.04 (1.01–1.06)d | 1.01 (0.99–1.03) | 0.09 |
| Aged ≥60 years | 227 (2.3) | 1.04 (1.03–1.06)d | 1.03 (1.01–1.05)d | |
| BMI <25 | 177 (1.7) | 1.04 (1.02–1.05)d | 1.01 (1.00–1.03) | 0.17 |
| BMI ≥25 | 188 (2.0) | 1.04 (1.03–1.06)d | 1.03 (1.01–1.05)d | |
| Mean SBP <140 mm Hg | 105 (1.2) | 1.03 (1.00–1.06) | 1.03 (1.00–1.05) | 0.94 |
| Mean SBP ≥140 mm Hg | 260 (2.5) | 1.03 (1.02–1.05)d | 1.02 (1.01–1.04)d | |
Blood pressure variability was calculated over the first 6 visits for patients who had a stroke during the course of the 6 visits, and patients who did not have at least 6 visits were excluded. ARV indicates average real variability; BMI, body mass index; CV, coefficient of variation; HR, hazard ratio; SBP, systolic blood pressure; SD, standard deviation.
Model 1 was adjusted for age, sex, and center;
Model 2 was adjusted for age, sex, center, treatment group, baseline stroke risk factors (baseline systolic blood pressure, fasting glucose, total cholesterol, triglycerides, high‐density lipoprotein cholesterol, homocysteine, creatinine, smoking status, alcohol consumption, and BMI), and mean systolic blood pressure over the period of visits.
P value indicates interaction P value between subgroups.
P<0.01.
P<0.05.
The 3 parameters of visit‐to‐visit SBPV were higher in older patients (aged ≥60 years, all P<0.001) (Table S13). In a multivariate Cox regression model for stroke after stratification by age (after adjustment for mean SBP and baseline risk factors), visit‐to‐visit SBPV was a stronger predictor in older patients (aged ≥60 years). In patients >60 years, for example, when SBPV was calculated over 6 visits, adjusted HR for CV was 1.06 (95% CI 1.02–1.10) (Table 3).
Patients with lower BMI levels (<25) were associated with higher visit‐to‐visit SBPV (all P<0.001) (Table S13). The association of visit‐to‐visit SBPV with subsequent stroke was stronger in patients with higher BMI. In an adjusted Cox regression model for subsequent stroke (after adjustment for mean SBP and all baseline risk factors), for patients with higher BMI, HR for CV over 6 visits was 1.07 (95% CI 1.03–1.12) (Table 3).
Higher mean SBP (≥140 mm Hg) was associated with higher visit‐to‐visit SBPV (all P<0.001) (Table S13), and the predictive value of visit‐to‐visit SBPV was greater in the group with higher mean SBP (≥140 mm Hg). After adjustment for baseline clinical data and mean SBP over the follow‐up period, SBPV was a stronger predictor of subsequent stroke in the group with higher mean SBP. For patients with higher mean SBP, the adjusted HR for SBPV‐CV over 6 visits was 1.05 (95% CI 1.01–1.08) (Table 3).
The interaction P value in each stratification noted in the results failed to show significant values.
Discussion
The data confirm that visit‐to‐visit variability of SBP remains a predictor of stroke in Chinese hypertensive patients, although all participants were using antihypertension therapy. Higher SBPV presents an even stronger predictive value for stroke. Based on the condition that visit‐to‐visit BP was measured every 3 months, more visits (range 4–8 visits) brought SBPV more significant predictive value for subsequent stroke.
In present major guidelines for hypertension, average BP is the recommended crucial component in the management of cardiovascular disease.8, 9 Nevertheless, because BP measurements often fluctuate from one visit to another, average BP can sometimes fail to accurately reflect a patient's real‐world BP or out‐of‐office BP. This kind of BP fluctuation is known as visit‐to‐visit BP variability. Formerly, visit‐to‐visit BP variability was regarded as “noise,” and using the average BP of ≥2 visits was recommended to reduce this noise.17 More evidence has shown that this variability in visit‐to‐visit BP is not an accidental phenomenon; it is reproducible and, furthermore, has an independent association with cardiovascular outcomes.18 A meta‐analysis of 13 prospective studies stated that the combined BPV‐SD HR among 60 096 individuals for stroke was 1.02 after adjustment for mean SBP and age,19 suggesting that visit‐to‐visit BP variability is a new marker worth studying for its effectiveness in predicting stroke.
Moreover, several studies have been published to prove relationships between visit‐to‐visit BPV and markers of vascular dysfunction, such as increased arterial stiffness, atherosclerosis,20 the activity of the sympathetic nerves,21 the effect of different antihypertensive drugs,22 and patients' adherence to treatment of hypertension.23
Average BP plays a crucial part in stroke, and this result was shown in our study (HR 1.03 for mean SBP over 8 visits). Average BP of more visits was an even better predictor of stroke. What cannot be overlooked is the role of visit‐to‐visit SBPV on stroke.
In this study, we focused on the visit‐to‐visit SBPV but not diastolic BPV because existing results show more evidence supporting the association between SBPV and future cardiovascular events than that of diastolic BPV.13
We stratified the power of SBPV to access the association with 2 stroke subtypes: ischemic and hemorrhagic stroke. A previous study from this research group showed that visit‐to‐visit BPV significantly accelerated the progress of cerebral microbleeds rather than the progress of cerebral white matter lesions during follow‐up of 1.5 years.24 Considering the higher risk of hemorrhagic stroke in Chinese patients,1 it is necessary to analyze the association between SBPV and subtypes of stroke in China. Overall, 18.8% of stroke patients and 0.57% of all participants in our study had hemorrhagic stroke; these proportions are higher than existing data in this field (eg, 0.4% of all participants in the ASCOT‐PBLA study).13 Although the absolute number of hemorrhagic stroke patients was only 120, and visit‐to visit SBPV failed to show a significant association with hemorrhagic stroke, it might still be meaningful. Moreover, mean SBP showed predictive value for hemorrhagic stroke. These findings demonstrate the potentially different mechanisms of visit‐to‐visit SBPV and mean SBP in predicting hemorrhagic stroke. Visit‐to‐visit SBPV and mean SBP are both independent predictors of ischemic stroke.
The difference in visit‐to‐visit SBPV between female and male participants was not significant in our study; however, SBPV was a more predictive marker for subsequent stroke in female than male participants. Moreover, 85% of the women in our study were postmenopausal (n=12 205). Perhaps the loss of the protective effect of the β‐adrenergic receptor in vasodilation together with decreased estrogen levels since menopause25 lead to susceptibility to stroke for postmenopausal women with higher visit‐to‐visit SBPV.
It is well accepted that age is a major cause of arterial stiffness, and BP has a positive association with age.26 In our results, the effect of visit‐to‐visit SBPV on stroke was also greater in older patients because older patients had higher SBPV. This conclusion was not in line with prior studies.13
Several studies have found an inverse relationship between BMI and BPV.27, 28 Our analysis revealed a similar result. In addition, the predictive value of visit‐to‐visit SBPV was more significant in patients with higher BMI (BMI ≥25).
We found that visit‐to‐visit SBPV was most predictive in patients with uncontrolled mean SBP levels (≥140 mm Hg), which reminded us of the potentially equal value of both mean SBP and visit‐to‐visit SBPV in clinical practice.
We must mention that the P value for interaction in each stratification failed to show a significant value, which means these stratification results may be less persuasive and may be affected by the sample size in each stratification.
There is still no consensus on the best way to define visit‐to‐visit BPV. Several metrics have been used to calculate BPV in the literature, namely, SD, CV, ARV, and variation independent of the mean, among which SD and CV are widely used. In a meta‐analysis of 77 299 patients,29 BPV‐SD turned out to be a better predictor of stroke than other indices, independent of mean SBP, but Rothwell proposed that variation independent of the mean and ARV were superior for predicting cardiovascular outcomes.13, 22 In this study, we used SD, CV, and ARV over the same numbers of BP measurements (or numbers of visits) to calculate visit‐to‐visit BPV and to predict subsequent stroke. When calculated over the same respective visits, BPV‐ARV seemed to be slightly more sensitive in the highest quintile than the other 2 variables for predicting subsequent stroke (Table 3). It is probable that SD, CV, and ARV reflect different determinants. SD and CV put emphasis on the extreme values, whereas ARV gives more weight to the consecutive changes that may have more value for predicting subsequent stroke.
In the existing studies to date, indices, number of visits, and visit‐to‐visit time intervals have been inconsistent. In the Trial of Preventing Hypertension study, BPV‐SD tended to increase when there were more measurement times during the follow‐up period and longer visit‐to‐visit time intervals (lower density of measurement).30 And there is still no standard definition in the assessment of visit‐to‐visit BPV. According to our finding, when more measurement times were used to calculate BPV (4, 6, and 8 visits, respectively), its predictive value for subsequent stroke increased. The precise estimation of BPV increases the predictive value of subsequent stroke. Because the purpose of CSPPT was based on antihypertension drugs with or without folic acid to prevent stroke in hypertensive patients, the BP readings were reliable, and the time intervals between visits were the same (3 months), which made the estimation of BPV reasonably accurate. When the number of visits was >10, BPV seemed to lose its predictive value for subsequent stroke. Perhaps the subsequent follow‐up period after 10 visits was not long enough to provide a sufficient sample of stroke events, thus the results of analyses were not precise enough for this reason.
Patients' emotional states and BP measurement circumference may also influence visit‐to‐visit BPV, but these factors are difficult to adjust for.
In clinical practice, episodic hypertension should not be dismissed or considered to be a random phenomenon and left untreated. Our finding suggests that visit‐to‐visit SBPV is an independent predictor of stroke. Furthermore, patient BP may be within the normal range on several requisite visits, but such patients may still have hypertension. In this situation, doctors should emphasize visit‐to‐visit BPV rather than just a single normal BP reading at 1 visit. Our finding also suggests that in female, older, higher BMI populations and those with uncontrolled mean BP, we should pay extra attention to patients' visit‐to‐visit SBPV levels.
Visit‐to‐visit BPV is easy to calculate and needs no additional devices or costs. We propose that long‐term management for reduction of visit‐to‐visit SBPV results in improved stroke outcomes. Generally, we should choose antihypertensive drugs, which could reduce both mean BP and visit‐to‐visit BPV at the same time. Calcium channel blockers were proven to be more effective in reducing visit‐to‐visit BPV, whereas beta blockers and angiotensin receptor blockers were found to increase visit‐to‐visit BPV.22 Moreover, according to the latest research, after adjustment for mean BP and visit‐to‐visit BPV, beta blockers and angiotensin receptor blockers increased stroke risks in older patients.31 This means that an underlying relationship exists among visit‐to‐visit BPV and stroke, but whether it is a causal link and how antihypertensive drugs affect this relationship remain uncertain. Consequently, how to manage visit‐to‐visit BPV is still unclear.
Our study has some potential shortcomings. First, the participants took other kinds of antihypertensive agents (except enalapril) at the same time to control their BP under prescription, but we had no data on the use of other antihypertensive drugs during the follow‐up period, thus we were not able to analyze the effect of different antihypertensive drugs on visit‐to‐visit BPV. Second, the CSPPT is a randomized controlled trial and has inclusion and exclusion criteria; it was not designed to study the association between visit‐to‐visit BPV and stroke. Moreover, our study is a secondary post hoc analysis, which naturally is a source of bias, and the findings may be chance observations. Third, we used the same number of visits to calculate BPV and to predict subsequent stroke; the overall mean follow‐up period from the first visit was 4.5 years, which limits the results' accuracy to some extent when more visits were used.
Conclusion
In Chinese hypertensive patients, visit‐to‐visit SBPV was a strong predictor of stroke, especially ischemic stroke, independent of mean SBP over the follow‐up period. In addition, higher visit‐to‐visit SBPV was associated with higher risk of stroke. This value was more predictive when more visits were used to calculate SBPV.
Sources of Funding
The CSPPT study was jointly supported by Shenzhen AUSA Pharmed Co Ltd and National; the National Science and Technology Major Projects Specialized for “Major New Drugs Innovation and Development” during the 12th Five‐Year Plan Period: China Stroke Primary Prevention Trial (grant zx09101105); the Major State Basic Research Development Program of China (973 program) (2012 CB517703); Clinical Center (grant zx09401013); Projects of National Natural Science Foundation of China (grants 81473052, 81441091, and 81402735); National Clinical Research Center for Kidney Disease, Nanfang Hospital, Nanfang Medical University, Guangzhou, China; State Key Laboratory for Organ Failure Research, Nanfang Hospital, Nanfang Medical University, Guangzhou, China; the Special Project on the Integration of Industry, Education and Research of Guangdong Province (2011A091000031); Science and Technology Planning Project of Guangdong Province, China (grant no. 2014B090904040); the Science, Technology and Innovation Committee of Shenzhen (JCYL20130401162636527); research grants from the Department of Development and Reform, Shenzhen Municipal Government (grant SFG 20201744).
Disclosures
None.
Supporting information
Table S1. Sample Size of the Total Number of Visits
Table S2. Sample Size, Number of Events, and Excluded Number in First Respective Number of Visits
Table S3. Baseline Systolic Blood Pressure, Mean Systolic Blood Pressure, and Visit‐to‐Visit Systolic Blood Pressure Variability Differences Between Different Treatment Groups
Table S4. Association Between Standard Deviation of Visit‐to‐Visit Blood Pressure Variability by Quintiles and Age, Baseline Systolic Blood Pressure, and Mean Systolic Blood Pressure Over 4, 6, 8, and 10 Visits During the Follow‐up Period
Table S5. Association Between Coefficient of Variation of Visit‐to‐Visit Blood Pressure Variability by Quintiles and Age, Baseline Systolic Blood Pressure, and Mean Systolic Blood Pressure Over 4, 6, 8, and 10 Visits During the Follow‐up Period
Table S6. Association Between Average Real Variability of Visit‐to‐Visit Blood Pressure Variability by Quintiles and Age, Baseline Systolic Blood Pressure, and Mean Systolic Blood Pressure Over 4, 6, 8, and 10 Visits During the Follow‐up Period
Table S7. Multivariate Hazard Ratios of Visit‐to‐Visit Systolic Blood Pressure Variability and Mean Systolic Blood Pressure for Subsequent Stroke
Table S8. Multivariate Hazard Ratios of Visit‐to‐Visit Systolic Blood Pressure Variability and Mean Systolic Blood Pressure for Subsequent Ischemic Stroke
Table S9. Multivariate Hazard Ratios of Visit‐to‐Visit Systolic Blood Pressure Variability and Mean Systolic Blood Pressure for Subsequent Hemorrhagic Stroke
Table S10. The Modifying Effect of Visit‐to‐Visit Systolic Blood Pressure Variability Over 6 Visits on Subsequent Stroke
Table S11. The Modifying Effect of Visit‐to‐Visit Systolic Blood Pressure Variability Over 8 Visits on Subsequent Stroke
Table S12. The Modifying Effect of Visit‐to‐Visit Systolic Blood Pressure Variability Over 6 Visits on Subsequent Ischemic Stroke
Table S13. Stratified Comparisons of Visit‐to‐Visit Systolic Blood Pressure Variability Over 6 Visits
Figure S1. Hazard ratios for risk of subsequent stroke by quintiles of visit‐to‐visit blood pressure variability over 8 visits (standard deviation, coefficient of variation, and average real variability).
Acknowledgments
We thank the investigators and participants of the China Stroke Primary Prevention Trial (CSPPT), the parent study, who made this report possible.
(J Am Heart Assoc. 2017;6:e004350. DOI: 10.1161/JAHA.116.004350.)
Contributor Information
Yining Huang, Email: ynhuang@sina.com.
Yong Huo, Email: huoyong@263.net.cn.
References
- 1. Rafael L, Mohsen N, Kyle F, Stephen L, Kenji S, Victor A, Jerry A, Timothy A, Rakesh A, Ahn SY. Global and regional mortality from 235 causes of death for 20 age groups in 1990 and 2010: a systematic analysis for the Global Burden of Disease Study 2010. Lancet. 2012;380:2163–2196. [DOI] [PMC free article] [PubMed] [Google Scholar]
- 2. Lloyd‐Jones D, Adams RJ, Brown TM, Carnethon M, Dai S, De Simone G, Ferguson TB, Ford E, Furie K, Gillespie C. Heart disease and stroke statistics—2010 update: a report from the American Heart Association. Circulation. 2011;123:e18–e209. [DOI] [PMC free article] [PubMed] [Google Scholar]
- 3. Charles W, Cathie S, Martin D, Joanna W, Peter S. Stroke. Lancet. 2003;362:1211–1224.14568745 [Google Scholar]
- 4. Lawes CMM, Hoorn SV, Rodgers A; For the International Society of Hypertension . Global burden of blood‐pressure‐related disease, 2001. Lancet. 2008;371:1513–1518. [DOI] [PubMed] [Google Scholar]
- 5. WHO document . A global brief on hypertension. 2015. Available at http://www.who.int/cardiovascular_disease/publication/global_brief_hypertension/. Accessed December 23, 2016.
- 6. Liu LS. 2010 Chinese guidelines for the management of hypertension. Chin J Hypertens. 2011;39:579–615. [PubMed] [Google Scholar]
- 7. Chobanian A; National Heart, Lung, and Blood Institute; National High Blood Pressure Education Program Coordinating Committee . Seventh report of the joint national committee on prevention, detection, evaluation, and treatment of high blood pressure. Hypertension. 2003;42:1206–1252. [DOI] [PubMed] [Google Scholar]
- 8. O'Brien E, Asmar R, Beilin L, Imai Y, Mancia G, Mengden T, Myers M, Padfield P, Palatini P, Parati G, Pickering T, Redon J, Staessen J, Stergiou G, Verdecchia P. Practice guidelines of the European Society of Hypertension for clinic, ambulatory and self blood pressure measurement. J Hypertens. 2005;23:697–701. [DOI] [PubMed] [Google Scholar]
- 9. Parati G, Stergiou GS, Asmar R, Bilo G, De LP, Imai Y, Kario K, Lurbe E, Manolis A, Mengden T. European Society of Hypertension guidelines for blood pressure monitoring at home: a summary report of the Second International Consensus Conference on Home Blood Pressure Monitoring. J Hypertens. 2008;26:1505–1530. [DOI] [PubMed] [Google Scholar]
- 10. Leenen FH. Blood pressure lowering, not vascular mechanism of action, is the primary determinant of clinical outcome. Can J Cardiol. 2004;20(suppl B):77B–82B. [PubMed] [Google Scholar]
- 11. Turnbull F, Neal B, Ninomiya T, Algert C, Arima H, Barzi F, Bulpitt C, Chalmers J, Fagard R, Gleason A. Effects of different regimens to lower blood pressure on major cardiovascular events in older and younger adults: meta‐analysis of randomised trials. BMJ. 2008;336:1121–1123. [DOI] [PMC free article] [PubMed] [Google Scholar]
- 12. Williams B, Lindholm LH, Sever P. Systolic pressure is all that matters. Lancet. 2008;371:2219–2221. [DOI] [PubMed] [Google Scholar]
- 13. Rothwell PM, Howard SC, Dolan E, O'Brien E, Dobson JE, Dahlöf B, Sever PS, Poulter NR. Prognostic significance of visit‐to‐visit variability, maximum systolic blood pressure, and episodic hypertension. Lancet. 2010;375:895–905. [DOI] [PubMed] [Google Scholar]
- 14. Tom M. When measurements are misleading: modelling the effects of blood pressure misclassification in the English population. BMJ. 2004;328:933. [DOI] [PMC free article] [PubMed] [Google Scholar]
- 15. Rothwell PM, Coull AJ, Giles MF, Howard SC, Silver LE, Bull LM, Gutnikov SA, Edwards P, Mant D, Sackley CM. Change in stroke incidence, mortality, case‐fatality, severity, and risk factors in Oxfordshire, UK from 1981 to 2004 (Oxford Vascular Study). Lancet. 2004;363:1925–1933. [DOI] [PubMed] [Google Scholar]
- 16. Yong H, Jianping L, Xianhui Q, Yining H, Xiaobin W, Gottesman RF, Genfu T, Binyan W, Dafang C, Mingli H. Efficacy of folic acid therapy in primary prevention of stroke among adults with hypertension in china: the CSPPT randomized clinical trial. JAMA. 2015;313:1325–1335. [DOI] [PubMed] [Google Scholar]
- 17. Bruce A, Brian MC, Stephen D, Barbara D, Laura H, Marc J, Larry M, Albert R, Julia S, Elaine U. Recommendations for blood pressure measurement in human and experimental animals; part 1: blood pressure measurement in humans. Hypertension. 2006;48:e3. [DOI] [PubMed] [Google Scholar]
- 18. Paul M, Cara J, Levitan EB, Elizabeth H, Daichi S, Webber LS, Suzanne O, Richard R, Marie KW. Reproducibility of visit‐to‐visit variability of blood pressure measured as part of routine clinical care. J Hypertens. 2011;29:2332–2338. [DOI] [PMC free article] [PubMed] [Google Scholar]
- 19. Diaz KM, Tanner RM, Louise F, Levitan EB, Kristi R, Daichi S, Paul M. Visit‐to‐visit variability of blood pressure and cardiovascular disease and all‐cause mortality: a systematic review and meta‐analysis. Hypertension. 2014;64:965–982. [DOI] [PMC free article] [PubMed] [Google Scholar]
- 20. Lau KK, Wong YK, Chan YH, Teo KC, Chan KH, Li LSW, Cheung RTF, Siu CW, Shu LH, Tse HF. Visit‐to‐visit blood pressure variability as a prognostic marker in patients with cardiovascular and cerebrovascular diseases—relationships and comparisons with vascular markers of atherosclerosis. Atherosclerosis. 2014;235:230–235. [DOI] [PubMed] [Google Scholar]
- 21. Paolo P, Stevo J. The role of cardiac autonomic function in hypertension and cardiovascular disease. Curr Hypertens Rep. 2009;11:199–205. [DOI] [PubMed] [Google Scholar]
- 22. Rothwell PM, Howard SC, Dolan E, O'Brien E, Dobson JE, Dahlöf B, Poulter NR, Sever PS. Effects of β blockers and calcium‐channel blockers on within‐individual variability in blood pressure and risk of stroke. Lancet Neurol. 2010;9:469–480. [DOI] [PubMed] [Google Scholar]
- 23. Krakoff LR. Fluctuation: does blood pressure variability matter? Circulation. 2012;126:525–527. [DOI] [PubMed] [Google Scholar]
- 24. Wenhong L, Ran L, Wei S, Qing P, Weiwei Z, En X, Yan C, Meiping D, Yansheng L, Zhen H. Different impacts of blood pressure variability on the progression of cerebral microbleeds and white matter lesions. Stroke. 2012;43:2916–2922. [DOI] [PubMed] [Google Scholar]
- 25. Briant LJB, Charkoudian N, Hart EC. Sympathetic regulation of blood pressure in normotension and hypertension: when sex matters. Exp Physiol. 2015;101:219–229. [DOI] [PubMed] [Google Scholar]
- 26. Avolio AP, Chen SG, Wang RP, Zhang CL, Li MF, O'Rourke MF. Effects of aging on changing arterial compliance and left ventricular load in a northern Chinese urban community. Circulation. 1983;68:50–58. [DOI] [PubMed] [Google Scholar]
- 27. Okada H, Fukui M, Tanaka M, Matsumoto S, Mineoka Y, Nakanishi N, Asano M, Yamazaki M, Hasegawa G, Nakamura N. Visit‐to‐visit blood pressure variability is a novel risk factor for the development and progression of diabetic nephropathy in patients with type 2 diabetes. Diabetes Care. 2013;36:1908–1912. [DOI] [PMC free article] [PubMed] [Google Scholar]
- 28. Kei A, Masahiro K, Rudolph S, Lutgarde T, Miki H, Michihiro S, Azusa H, Taku O, Ryusuke I, Hirohito M. Home blood pressure variability as cardiovascular risk factor in the population of Ohasama. Hypertension. 2012;61:61–69. [DOI] [PMC free article] [PubMed] [Google Scholar]
- 29. Chenhui T, Yuxi S, Neng D, Dachun X, Wei C, Jiguang W, Athanase P, Van Sloten TT, Jacques B, Safar ME. Prognostic significance of visit‐to‐visit systolic blood pressure variability: a meta‐analysis of 77,299 patients. J Clin Hypertens. 2015;17:107–115 (109). [DOI] [PMC free article] [PubMed] [Google Scholar]
- 30. Levitan EB, Niko K, Suzanne O, Stevo J, Paul M. Blood pressure measurement device, number and timing of visits, and intra‐individual visit‐to‐visit variability of blood pressure. J Clin Hypertens. 2012;14:744–750. [DOI] [PMC free article] [PubMed] [Google Scholar]
- 31. Tully PJ, Debette S, Dartigues J‐F, Helmer C, Artero S, Tzourio C. Antihypertensive drug use, blood pressure variability, and incident stroke risk in older adults. Stroke. 2016;47:1194–1200. [DOI] [PubMed] [Google Scholar]
Associated Data
This section collects any data citations, data availability statements, or supplementary materials included in this article.
Supplementary Materials
Table S1. Sample Size of the Total Number of Visits
Table S2. Sample Size, Number of Events, and Excluded Number in First Respective Number of Visits
Table S3. Baseline Systolic Blood Pressure, Mean Systolic Blood Pressure, and Visit‐to‐Visit Systolic Blood Pressure Variability Differences Between Different Treatment Groups
Table S4. Association Between Standard Deviation of Visit‐to‐Visit Blood Pressure Variability by Quintiles and Age, Baseline Systolic Blood Pressure, and Mean Systolic Blood Pressure Over 4, 6, 8, and 10 Visits During the Follow‐up Period
Table S5. Association Between Coefficient of Variation of Visit‐to‐Visit Blood Pressure Variability by Quintiles and Age, Baseline Systolic Blood Pressure, and Mean Systolic Blood Pressure Over 4, 6, 8, and 10 Visits During the Follow‐up Period
Table S6. Association Between Average Real Variability of Visit‐to‐Visit Blood Pressure Variability by Quintiles and Age, Baseline Systolic Blood Pressure, and Mean Systolic Blood Pressure Over 4, 6, 8, and 10 Visits During the Follow‐up Period
Table S7. Multivariate Hazard Ratios of Visit‐to‐Visit Systolic Blood Pressure Variability and Mean Systolic Blood Pressure for Subsequent Stroke
Table S8. Multivariate Hazard Ratios of Visit‐to‐Visit Systolic Blood Pressure Variability and Mean Systolic Blood Pressure for Subsequent Ischemic Stroke
Table S9. Multivariate Hazard Ratios of Visit‐to‐Visit Systolic Blood Pressure Variability and Mean Systolic Blood Pressure for Subsequent Hemorrhagic Stroke
Table S10. The Modifying Effect of Visit‐to‐Visit Systolic Blood Pressure Variability Over 6 Visits on Subsequent Stroke
Table S11. The Modifying Effect of Visit‐to‐Visit Systolic Blood Pressure Variability Over 8 Visits on Subsequent Stroke
Table S12. The Modifying Effect of Visit‐to‐Visit Systolic Blood Pressure Variability Over 6 Visits on Subsequent Ischemic Stroke
Table S13. Stratified Comparisons of Visit‐to‐Visit Systolic Blood Pressure Variability Over 6 Visits
Figure S1. Hazard ratios for risk of subsequent stroke by quintiles of visit‐to‐visit blood pressure variability over 8 visits (standard deviation, coefficient of variation, and average real variability).