

Abstract
Mercury (Hg) has been implicated as a factor contributing to autoimmune disease in animal models and humans. However the mechanism by which this occurs has remained elusive. Since the discovery of B cells it has been appreciated by immunologists that during the normal course of B cell development, some immature B cells must be generated that produce immunoglobulin reactive to self- antigens (auto-antibodies). However in the course of normal development, the vast majority of immature auto-reactive B cells are prevented from maturing by processes collectively known as tolerance. Autoimmune disease arises when these mechanisms of tolerance are disrupted. In the B cell compartment, it is firmly established that tolerance depends in part upon negative selection of self-reactive immature (transitional type 1) B cells. In these cells negative selection depends upon signals generated by the B Cell Receptor (BCR), in the sense that those T1 B cells who’s BCRs most strongly bind to, and so generate the strongest signals to self-antigens are neutralized. In this report we have utilized multicolor phosphoflow cytometry to show that in immature T1 B cells Hg attenuates signal generation by the BCR through mechanisms that may involve Lyn, a key tyrosine kinase in the BCR signal transduction pathway. We suggest that exposure to low, environmentally relevant levels of Hg, disrupts tolerance by interfering with BCR signaling in immature B cells, potentially leading to the appearance of mature auto-reactive B cells which have the ability to contribute to auto-immune disease.
Keywords: Mercury, Autoimmunity, B Cell Receptor (BCR), Transitional Type 1 (T1) B cell
Introduction
Although the etiologies of most autoimmune diseases (ADs) are unknown, it is clear that they are multifactorial involving both genetic and environmental drivers. Generally, an immune response to self -antigens is held in check by processes collectively known as tolerance. Autoimmune disease arises when normal tolerogenic mechanisms are disrupted, either by genetic abnormalities, environmental insults, or a combination of both. However while much progress has been made in elucidating underlying genetic lesions that contribute to the loss of tolerance to self-antigens, in comparison little is known mechanistically regarding how environmental factors drive the immune system to AD. One reason for this imbalance is that historically it has been difficult to unambiguously link exposure to specific environmental factors with the onset of autoimmune diseases.
One of the exceptions to this is the heavy metal mercury (Hg). The strongest association between Hg exposure and AD is found in animal models. Studies in rats and mice show that low level Hg2+ triggers a systemic lupus erythematosus (SLE)-like disorder: Hg induced autoimmune disease (HgIA) (reviewed in [(Bagenstose et al. 1999; Druet 1995; Pollard and Hultman 1997; Rowley and Monestier 2005)]). In humans epidemiological studies clearly indicate that exposure to Hg at levels that are common within current occupational settings, or in environments which have been contaminated with Hg as a result of illegal artisanal gold mining operations, contribute to immune system dysfunction and autoimmune disease [(Cooper et al. 2004; Dahlgren et al. 2007; Dantas and Queiroz 1997; Mayes 1999; Queiroz and Dantas 1997a; Queiroz and Dantas 1997b; Silbergeld et al. 2005)]. Significantly, a more recent epidemiological study has now shown that exposure to Hg at lower levels associated with typical environmental exposures outside of the workplace, and which have been perceived to be non-toxic, is correlated with the increased titers of auto-antibodies to double stranded DNA, a well-established autoimmune marker [(Somers et al. 2015)].
Signaling through the B cell receptor (BCR) complex is a major determinant that normally shapes the immune repertoire so as to establish tolerance to self-antigens. Immature B cells migrate into the spleen from the bone marrow, where they are initially referred to as type 1 (T1) B cells. In the spleen T1 B cells differentiate into type 2 transitional B cells (T2 B cells), and finally T2 B cells differentiate into mature B cells [(Chung et al. 2003; Loder et al. 1999)]. T1 and T2 B cells reside in a milieu of self-antigens, and due to the random nature of immunoglobulin genetic rearrangements during development, many T1 B cells initially express receptors which strongly recognize self-antigens. However the T1 to T2 transition depends upon BCR signal strength in the sense that T1 cells expressing BCRs with the highest affinity to encountered (mainly self) antigens are negatively selected. In this way the mature B cell repertoire is shaped to be poorly responsive to self-antigens, in that the most auto-reactive T1 B cell clones are eliminated by apoptosis, or else become anergic, before the clones can differentiate into T2 B cells [(Chung et al. 2003; Loder et al. 1999)].
Considering the importance of BCR signaling in the establishment of tolerance, it is not surprising that genetic abnormalities associated with key proteins within the BCR signaling pathway are linked with autoimmune disease [(Cambier 2013)]. Because of the similarity of HgIA to systemic lupus erythematosus (SLE), and the essential role played by auto-reactive B cells in the pathology of a variety of autoimmune diseases [(Yanaba et al. 2008)], especially SLE [(Grimaldi et al. 2005)], some time ago we hypothesized that the association of Hg with autoimmunity might likewise be in part explained by Hg negatively impinging upon the BCR signaling pathway, so as to disrupt the function of one or more key elements, thereby compromising tolerance. Using the WEHI 231 B cell line, an in vitro model of immature B cells [(Warner and Scott 1988)], we initially showed that low levels of Hg do indeed interfere with BCR function in a dose dependent manner [(McCabe, Jr. et al. 1999)]. BCR signaling is mediated by protein tyrosine phosphorylation events, and in particular activation of the ERK tyrosine kinase by tyrosine phosphorylation is an important signaling intermediary in the BCR signaling pathway [(Dal Porto et al. 2004)]. We have also previously shown that low levels of Hg2+ alter B cell tyrosine phosphorylation events in a dose-dependent manner [(Rosenspire et al. 1998)]. We subsequently showed that in WEHI 231, as well as in primary splenic B cells, that Hg exposure was associated with attenuation of ERK activity as assessed by ERK tyrosine phosphorylation. However at low levels Hg did not seem to act directly on ERK, but rather upstream of the kinase [(McCabe, Jr. et al. 2007)]. In any event, the idea that Hg could be associated with autoimmunity through interference with BCR signaling at the T1:T2 checkpoint seemed plausible.
The Src family tyrosine kinase Lyn is well known to be a critical regulatory component of the BCR signaling pathway upstream of ERK [(Lowell 2004; Xu et al. 2005)]. So this view was further reinforced when we used mass spectrometry to identify Lyn as the most significant phosphoprotein regulatory node affected in Hg2+ burdened B cells. Furthermore we found that several phospho-sites on Lyn were affected by Hg2+, but the carboxyl terminal dominant negative regulatory site was the most sensitive [(Caruso et al. 2014)].
We recently examined BCR signaling in Hg exposed WEHI-231 cells utilizing phospho-flow cytometry (Irish et al. 2006b; Krutzik et al. 2004) where we demonstrated the utility of the technique in examining the BCR signaling pathway in in vitro Hg burdened B cells [(Gill et al. 2014)]. In this report we have utilized phospho-flow cytometry to directly analyze BCR signaling in primary mouse splenic T1 B cells which have been exposed ex vivo to similar low cellular burdens of Hg 2+. We have found that in both instances ERK as well as upstream elements of the BCR signaling pathway, including phosphorylation of the immune tyrosine activation motif (ITAM) of the BCR co-receptor CD79a and activation of the tyrosine Syk are attenuated during signaling. Furthermore, we have found that phosphorylation of the Lyn C terminal dominant negative regulatory tyrosine, in response to BCR activation is also attenuated in Hg burdened T1 B cells.
Materials and methods
Experimental animals
Seven week old female BALB/c mice were ordered from Jackson Laboratories (Bar Harbor, ME). Mice were allowed to acclimate for one week after arrival at Wayne State University. The animals were housed under conventional conditions and given water and rodent laboratory chow (Ralston Purina, St. Louis, MO) ad libitum. The Wayne State University animal care program is AAALAC accredited and all experimental procedures received Institutional Animal Care and Use Committee approval. All animal care and treatment procedures were in compliance with the “Guiding Principles in the Care and Use of Animals” (DHEW Publication, NIH80-23).
Lymphocyte isolation
Mice were euthanized by CO2 narcosis followed by cervical dislocation. After euthanasia, spleens were removed, cleaned of fat and connective tissue and placed in cold RPMI buffered with 20 mM Hepes (ThermoFisher, Waltham MA). Cell suspensions were created by passing through a 70 um nylon screen and rinsing with additional RPMI. Splenocytes were pelleted at 900 × g for 6 minutes and suspended in cold RPMI. Splenocytes were then further purified by density gradient centrifugation utilizing Lymphocyte separation medium (ThermoFisher, Waltham MA). Cells were resuspended in serum-free RPMI 1640 supplemented with 20mM HEPES.
Ex Vivo exposure regimens
Half of the purified splenocytes were treated with 5 μM HgCl2 (in H2O) for 10 minutes, while the untreated cells served as controls. All cells were then treated with the identical dose of goat anti-mouse immunoglobulin (MP Biomedicals, Solon, OH) to initiate BCR signaling for timed periods. To stop BCR signaling, the cells were treated with an equal volume of Fix/Permablization Buffer containing 4% paraformaldhyde, 0.1% saponin and 0.01% HEPES in Dulbecco’s Phosphate buffer (DPBS) at pH 7.4. Cells were then incubated for 10 minutes at 37°C. Cells were washed in Permeablization/Wash (P/W) buffer containing 0.1% saponin, 0.1% BSA, 0.01 M HEPES and 0.1% sodium azide in DPBS at pH 7.4. Nonspecific antibody binding was blocked by incubating the fixed cells in P/W buffer containing 10% normal mouse serum and 10% normal rat serum for 10 minutes at room temperature. Cells were washed in P/W buffer and then stained for flow cytometry.
Antibodies and Lymphocyte staining for flow cytometry
The following monoclonal fluorochrome conjugated antibodies were used: CD45R (clone) conjugated to APC-CY7, CD24 (clone M1/69) conjugated to PE-CY7, phospho-ERK1/2 (pT202/pY204)(clone 20A) conjugated to PE, ZAP70 (PY319)/Syk(PY352)(clone 17A/P-ZAP70) conjugated to Alexa Fluor 647, IgD (clone 11-26c.2a) conjugated to APC. Antibodies were obtained from BD, Franklin Lakes NJ. Anti-CD21/CD35 (clone 7E9) conjugated to Pacific blue from Biolegend, San Diego, CA. Anti-Lyn (phospho Y507) (rabbit polyclonal) from Abcam, Cambridge, MA. Anti-phospho-CD79a (Tyr 182) (rabbit polyclonal) from Cell Signaling Technology, Danvers, MA. Goat anti-rabbit IgG conjugated to Alexa Flour 488 from Invitrogen/Thermo Fisher, Waltham, MA. Goat anti-mouse IgM conjugated to biotin from Jackson ImmunoResearch Laboratories, West Grove, PA. Biotin was detected by Pacific Orange conjugated streptavidin obtained from Invitrogen/Thermo Fisher, Waltham, MA. Cells were stained with a cocktail of the above described labeled antibodies in P/W buffer. Cells were then washed and stained with Pacific Orange conjugated streptavidin and/or goat anti-rabbit IgG conjugated to Alexa Fluor 488. Labeled cells were then examined on a Cyan (Beckman/Coulter) flow cytometer. Flow cytometry results were analyzed utilizing Summit software (Beckman/Coulter).
Presentation of results
Results are presented as the mean fluorescent index (MFI) for the indicated cell population, where MFI is defined as the mean value of the fluorescence intensity for the population of interest. At least 10,000 events (cells) were examined for each data point. Each experiment was independently replicated multiple times, with the number replicates indicated in the figure legend.
Results
The binding of antibody to membrane immunoglobulin (mIg) is unaffected by mercury
In the following experiments we have examined the effect of mercury on BCR signaling initiated by the interaction of membrane Ig with an anti-Ig reagent. Consequently, it is necessary to establish that a low level of mercury alone has no effect on the binding of anti-immunoglobulin to B cells. Accordingly, in figure 1, spleen cells were isolated as described above and treated with or without 5 μM Hg2+ for 10 minutes. The cells were then fixed and stained with fluorescently labeled anti-B220, anti-IgM and anti-IgD. Cells were then examined by flow cytometry. After gating on B220+ cells, mean fluorescence staining intensity for IgM and IgD were determined for cells which were treated with Hg and compared to those which were not. The results shown in figure 1 demonstrates that while the intensity of the IgM and IgD signals differs, Hg2+ has no effect on the binding of anti-IgM or anti-IgD to B cells.
Figure 1.

Binding of antibodies to membrane Ig on B cells is not affected by exposure to Hg2+. Spleen cells were (checkered pattern), or were not (solid pattern) exposed to Hg 2+ prior to treatment with fluorescently labeled anti-B220, anti-IgM and anti-IgD antibodies. Binding of labeled antibodies to the B220+ (B) cell population were then determined by flow cytometry. Results for the IgM and IgD signals are expressed as the population mean fluorescence (arbitrary units) ± SE.
Gating scheme for analysis of T1 B cells
B cells are first identified by gating on spleen cells expressing the B220 isotype of CD45 [(Dal Porto et al. 2004)]. After gating on the B220+ population, the T1 B cell population can be distinguished from T2 and mature B cell populations by CD21 and CD24 staining profiles [(Su and Rawlings 2002)]. Accordingly, figure 2 is a representative example demonstrative of this general gating scheme which we utilized throughout this report to identify T1 B cells. In figure 2 the whole spleen cell population was labeled with fluorescently tagged antibodies to B220, CD21 and CD24, and then analyzed by flow cytometry. In (A) B220 positive and negative populations are identified. Bivariate plots based on CD24 and CD21 expression levels are then shown for B220 ungated cells (B), after gating on B220 – cells (C) or B220 + cells (D). T1 B cells are characterized and best identified in (D) as B220+, CD21low, CD24Hi [(Su and Rawlings 2002)].
Figure 2.
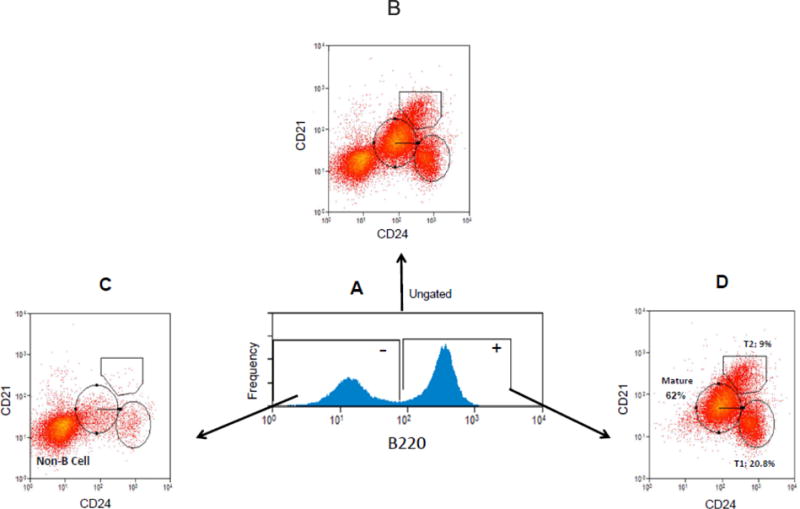
Gating scheme identifying T1 B cells. Spleen cells were fixed and labeled with fluorescently tagged anti-B220, anti-CD24 and anti-CD21 antibodies, and then examined by flow cytometry. B220 positive and negative spleen cell populations are initially identified (A). Non B cell, mature B cell, T2 B cell and T1 B cell populations are all shown in CD21, CD24 bivariate plots constructed from B220 ungated cells (B). Gating on B220− cells yields bivariate CD21, CD24 histograms primarily displaying non B cells which are predominantly CD21low, CD24low (C). T1 B cells are best identified in CD21, CD24 bivariate histograms (after first gating on B220+ cells) as B220+, CD21low, CD24Hi (D).
Low and Environmentally Relevant Hg2+ Exposures Attenuate BCR Mediated Activation of ERK in T1 B Cells
We have previously shown by western blotting that exposure to low levels of Hg2+ attenuates ERK activity during BCR signaling in a mouse B cell line as well as in whole mouse spleen cell populations [(McCabe, Jr. et al. 2007)]. It is expected that BCR signaling is to some extent dependent on genetics, so there might be differences in signaling strength and/or kinetics between individual mice, even of the same strain. By comparing signaling in individual Hg+2 exposed cells with unexposed cells from the same mouse, phosphoflow cytometry [(Gill et al. 2014; Irish et al. 2004; Irish et al. 2006a; Irish et al. 2006b; Irish et al. 2006c; Krutzik et al. 2004)] affords us the opportunity to investigate the effect of Hg+2 on BCR signaling independent of genetics. In figure 3 we utilized phospho-flow cytometry to selectively examine the effect of Hg2+ on BCR dependent activation of ERK in immature transitional T1 B cell populations.
Figure 3.
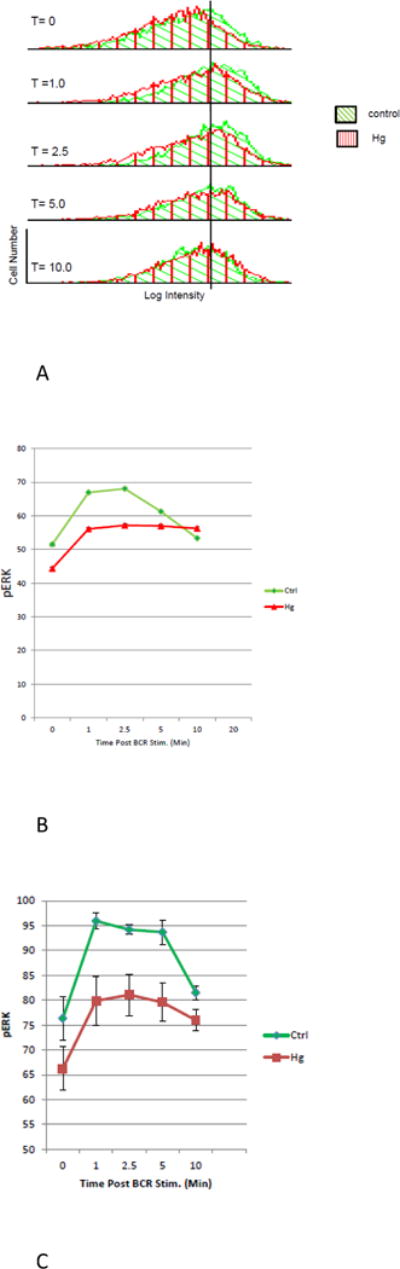
Hg2+ exposures attenuate activation of ERK in T1 B cells. Spleen cells were isolated from Balb/C mice and then exposed or not to 5 μM Hg2+ for 10 minutes. Control and Hg exposed cells were then treated with anti-Ig for timed periods to initiate BCR signaling, after which they were fixed and permeabilized. Cells were then incubated with a cocktail of fluorescently labeled antibodies to B220, CD21, CD24, and pERK (T202/Y204) to identify activated ERK. Labeled cells were then examined by flow cytometry. (A) In a representative example (n=6), after gating on T1 B cells, histograms plotting log pERK intensity vs cell number were constructed for each population of T1 cells at different times after BCR stimulation. Histograms depicting controls and Hg2+ treated cells for each time point are plotted together. Histograms for the various time points are arranged vertically.
(B) For each histogram in (A), the MFI of the pERK signal, as well as the standard deviation and number of cells analyzed was recorded. For each histogram with respect to the MFI, the associated standard error of the mean and 95% confidence interval were calculated. The MFI’s and their associated standard errors were then plotted as a function of time. However in most cases the standard errors were smaller than the graph symbols, and so are not visible. Analysis of the 95% confidence intervals demonstrated that at all time points post BCR stimulation (with the exception of 10 minutes) Hg2+ significantly (p < .05), attenuates the pERK signal.
(C) As in (A), the MFI of the pERK signal was determined for histograms associated with 5 additional replicate experiments. For each time point the results for cells treated or not with Hg2+ were then averaged and plotted as a function of time. To accomplish this, the results for each individual experiment was first normalized by expressing the value for each measurement of the pERK MFI as the percent of the maximum pERK MFI determined in that individual experiment. Next, for each time point (with or without Hg2+) the normalized values for pERK MFI were then the averaged over all of the experiments, and plotted along with the SEM.
Figure 3A is a representative example of an experiment (N=6), where spleen cells were isolated from a Balb/c mouse and exposed or not to 5 μM Hg2+ for 10 minutes. Control and Hg exposed cells (derived from the same mouse) were then treated with anti-Ig for timed periods to initiate BCR signaling, after which they were fixed and permeabilized. Cells were then incubated with a cocktail of fluorescently labeled antibodies to B220, CD21, CD24, and pERK (T202/Y204) to identify activated ERK and the T1 B cell population. The intensity of fluorescence for each label was then determined by flow cytometry.
Figure 3A shows histograms plotting cell number (y axis) vs log pERK intensity (x axis) which were generated for each time point after BCR stimulation for the T1 B cell population which had been exposed to Hg2+, and for the control T1 B cell population which was not. In figure 3A, the resulting pair (exposed or not exposed to Hg2+) of pERK histograms for each time point after BCR stimulation are plotted together utilizing identical x and y axis. The control histograms are plotted in green with angled cross hatches. The histograms designating T1 B cells which have been exposed to Hg2+ are plotted in red with vertical cross hatches. The histogram pairs for the different time points after initiation of BCR signaling are then arranged vertically. In order to facilitate comparisons between histograms, a vertical line marking the pERK intensity of the peak of the control histogram from the 0 time point is constructed and extended through the other histograms at the identical pERK intensity on each histogram x axis. Figure 3A suggests that for both Hg treated and control cells BCR stimulation generally increases pERK from baseline levels. The increases are maximal from between 2.5 to 5 minutes. However by 10 minutes pERK intensities are back to near base line levels. The important point though is that for all time points other than 10 minutes, although the histograms representing Hg treated cells and control cells are both shifted to the right, the histograms representing Hg treated cells are always to the left of the Hg naïve cells. In other words it appears that compared to controls, Hg2+ depresses pERK at all time points, with the possible exception of ten minutes.
The results suggested from the analysis of the histograms in figure 3A can be quantified and subject to statistical analysis. This is accomplished in figure 3B, where for each (control and Hg treated) histogram displayed in figure 3A the mean pERK fluorescence intensity (MFI), as well as the standard error and 95% confidence intervals of the MFI was determined. The MFI for each population of cells (taken as a measure of ERK activation for that population) is plotted (with the standard error) as a function of time after initiation of BCR signaling. However in figure 3B, because of the relatively large number of cells in each population (on the order of several thousand), the error bars representing the SEs are of the same size as the graph symbols, and so are not readily visible. With the exception of the 10 minutes time point, analysis of the 95% confidence intervals (not plotted) between the control and Hg treated populations at each time point are non-overlapping, indicating that Hg2+ significantly (P < .05) attenuates BCR activation of ERK in T1 cells at all time points other than 10 minutes.
Although we have pointed out that the results presented in figure 3B for one mouse is representative of several identical experiments with other mice, we thought it useful to look at all of the experiments together in a unified analysis. To this end, figure 3C presents the average results for the six similar experiments performed with different mice on different occasions, as described in figure 3A. To accomplish this, the results for each of the six individual experiments was first normalized by expressing the value for each individual determination of the pERK MFI as the percent of the maximum pERK MFI determined in that individual experiment. Next, for each time point (with or without Hg2+) the normalized values for pERK MFI were then the averaged over all of the experiments, and plotted along with the SEM. As above, control cells are plotted with green triangles and green connecting lines, while results for T1 B cells which have been exposed to Hg2+ are plotted as red squares with red connecting lines. Calculation of the 95% confidence limits (not shown) confirms that for the 1, 2.5 and 5 minute time points Hg significantly (p < .05) attenuates BCR stimulation of ERK.
Low and Environmentally Relevant Hg2+ Exposures Attenuate early BCR Signaling in T1 B Cells
After the initiation of BCR signaling by anti-Ig cross-linking mIg, it has been determined that the earliest biochemical events in the signal transduction cascade include phosphorylation of tyrosine residues on the BCR co-receptor CD79a and the protein tyrosine kinase Syk [(Cambier and Getahun 2010; Packard and Cambier 2013)]. This has enabled us to utilize phospho-flow cytometry to investigate BCR signaling kinetics proximal to the BCR (and upstream of ERK) in transitional T1 B cells, both in the absence and presence of Hg2+.
Figures 4 and 5 show representative results from several experiments (n = 6) where we have used phospho-flow cytometry to show that ex vivo exposure to a low concentration of Hg2+ attenuates BCR stimulated phosphorylation of Syk (figure 4) and CD79a (figure 5). In each figure spleen cells were isolated from a Balb/C mouse, and as in figure 3 then exposed or not ex vivo to 5 μM Hg2+ for 10 minutes. All cells were then treated ex vivo with identical doses of anti-Ig to initiate BCR signaling for timed periods. For each time point the MFI, the standard errors and the 95% confidence intervals of the pSyk or CD79a fluorescence signal was then determined in the T1 B cell population by phospho-flow cytometry utilizing the gating scheme outlined in figure 2. We find that early BCR signaling events (whether assessed by measuring either pCD79a or pSyk) in T1 B cells is significantly attenuated at time points up to 10 minutes after BCR signaling is initiated, in cells that have been exposed to environmentally relevant levels of Hg2+.
Figure 4.
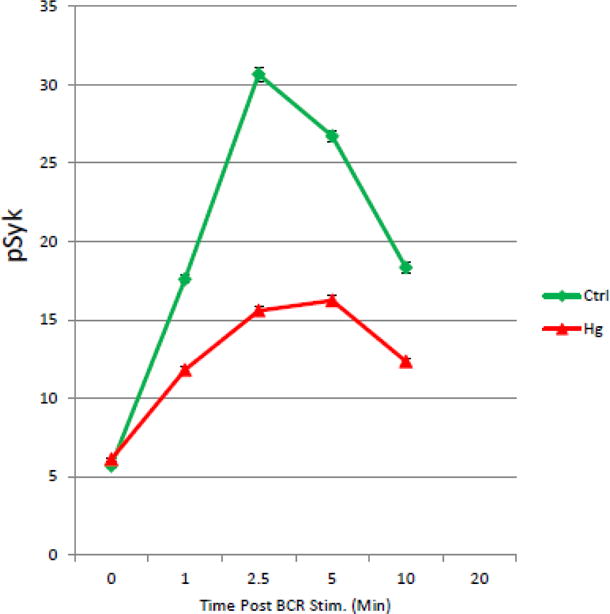
Hg2+ attenuates BCR activation of Syk in T1 B Cells. In a representative example (n=6), spleen cells were purified and exposed to Hg2+ ex vivo as in figure 3. Cells were then incubated with anti-Ig to initiate BCR signaling. At timed periods cells were fixed, permeablized and stained with fluorescently tagged antibodies to B220, CD21, CD24 and Syk pY346. The T1 B cell population was identified by flow cytometry as B220+, CD21low, CD24Hi as in figure 3, and levels of pSyk determined. The value for the pSyk MFI was then plotted as a function of time for cells which were treated or not with Hg2+. Error bars representing the SEM were plotted with the MFIs, but as in figure 3 were in most cases smaller than the graph symbols and so are not readily visible. Analysis of the 95% confidence intervals indicated that at all time points after BCR signaling that the pSyk signal is significantly (p<.05) attenuated in Hg2+ treated cells when compared to cells which have not been exposed to Hg2+.
Figure 5.
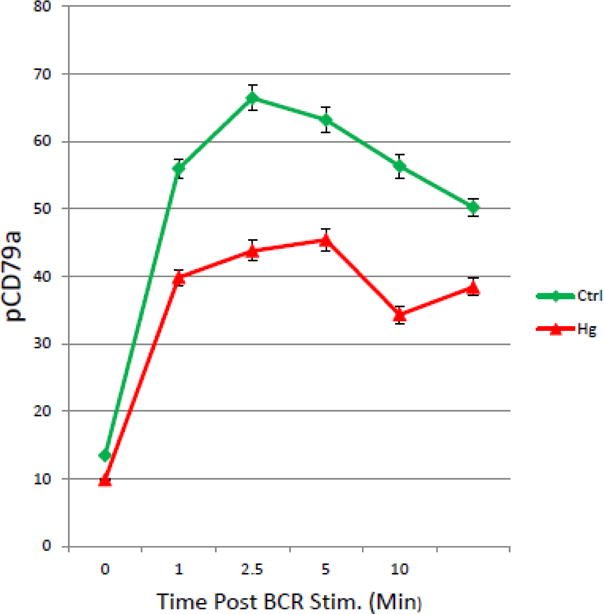
Hg2+ attenuates BCR dependent phosphorylation of CD79a in T1 B Cells. Figure 5 is a representative example (n=6), where spleen cells were purified and exposed to Hg2+ ex vivo as in figure 3. Cells were then incubated with anti-Ig to initiate BCR signaling. At timed periods cells were fixed, permeablized and stained with fluorescently tagged antibodies to B220, CD21, CD24 and a biotinylated antibody to pCD79a. Cells were then counter stained with fluorescently tagged streptavidin. T1 B cell populations were identified by flow cytometry as B220+, CD21low, CD24Hi as in figure 3, and levels of pCD79a in the T1 B cell population determined. The value for the pCD79a MFI was then plotted as a function of time for cells which were treated or not with Hg2+. Error bars representing the SEM were plotted with the MFIs. Analysis of the 95% confidence intervals indicated that at all time points after BCR signaling that the pCD95a signal is significantly (p<.05) attenuated in Hg2+ treated cells when compared to cells which have not been exposed to Hg2+.
Ex Vivo exposure to low levels of Hg2+ Depresses pLyn (Y508) in T1B Cells
As we have mentioned above, based on targeted mass spectrometry experiments, we have previously reported that in the WEHI 231 B Cell line, low level Hg2+ exposures alters phosphorylation of the dominant negative Lyn regulatory site (Y508) [(Caruso et al. 2014)]. In figure 6, we used phospho-flow cytometry to look at the effect of low level ex vivo exposures to Hg2+ on Lyn Y508 phosphorylation in response to BCR signaling in primary T1 B cells. As above, Balb/C spleen cells derived from a single mouse were or were not exposed to Hg2+, and then the cells incubated with anti-Ig to stimulate BCR signaling for timed periods. As in figures 3–5, cells were then fixed, permeabilized and stained with a cocktail of fluorescently labeled antibodies. In this case the cocktail contained antibodies to B220, CD21, CD24, and Lyn (pY508). Figure 6 shows representative results from 4 replicate experiments where T1 B cells were gated on and the MFI of Lyn pY508 in the T1 B cell population was determined as a function of time after BCR stimulation for Hg2+ treated and untreated control populations. Figure 6 demonstrates that as is the case for pSyk and pCD79a, pLyn(y508) is also stimulated in a time dependent manner by BCR signaling. Analysis of 95% confidence intervals demonstrates that for all time points greater than zero, Hg2+ significantly attenuates the signal.
Figure 6.
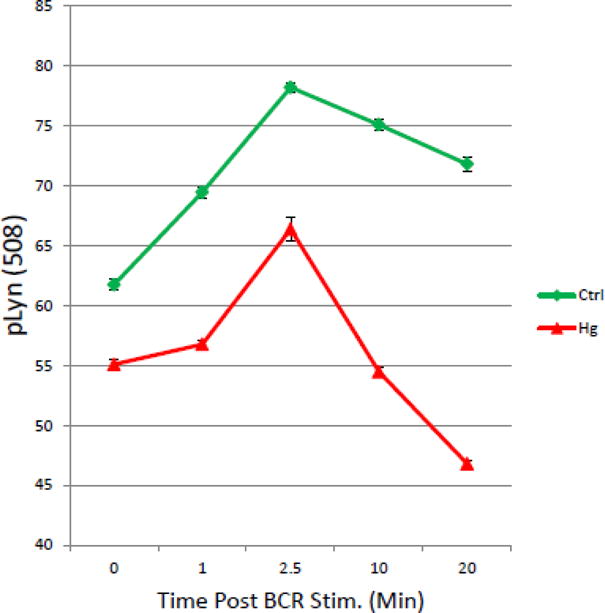
Hg2+ attenuates phosphorylation of Lyn Y508 during BCR signaling: Figure 6 shows the results for a representative experiment (n=4), where spleen cells were exposed to Hg2+ ex vivo, and then incubated with anti-Ig to initiate BCR signaling as in figures 3–5. At timed periods cells were fixed, permeablized and stained with fluorescently tagged antibodies to B220, CD21, CD24, and Lyn pY508. T1 B cell populations were identified by flow cytometry as B220+, CD21low, CD24Hi as in figure 2, and levels of pLyn Y508 determined in the T1 B cell population. The value for the pLyn MFI was then plotted as a function of time for cells which were treated or not with Hg2+. Error bars representing the SEM were plotted with the MFIs. Analysis of the 95% confidence intervals indicated that at all time points after BCR signaling that the pLyn508 signal is significantly (p<.05) attenuated in Hg2+ treated cells when compared to cells which have not been exposed to Hg2+.
Discussion
In this report we have examined the effect of Hg2+ on BCR signaling in Balb/C T1B cells. Studies of the mechanisms by which Hg2+ disrupts immune system function in mice are relevant to low level environmental Hg exposure in humans. Although most human environmental exposure to Hg is in the form of organic Hg through diet, it has been demonstrated that exposure to organic Hg produces many of the features of mercury induced autoimmunity (HgIA) in mice. The reason for this is that organic Hg is rapidly metabolized to Hg2+. In fact even for animals exposed exclusively to organic Hg, within a short period the mercury burden in the spleen is almost entirely Hg2+. Furthermore, it appears that while organic Hg is associated with immunosuppression, Hg2+ is the active metabolite interacting with the immune system that is responsible for autoimmune phenomena [(Havarinasab et al. 2005; Havarinasab and Hultman 2005)].
Although our experiments were based on ex vivo exposures, we wanted our findings to be relevant to actual environmental exposures. The way to overcome the exposure issues is to think in terms of Hg burden [(Clarkson and Magos 2006; McCabe, Jr. et al. 2005)]. Based on random autopsy data, it has been reported that the Hg burden in human spleen depends on age. Children have on average 1.3 ppm, while adults were found to have on average 7.7 ppm [(Kevorkian et al. 1972)]. Our standard protocol for “low dose” ex vivo exposure involves incubating cells with 5μM HgCl2 for 10 minutes prior to beginning an experiment. Under these conditions, in Balb/C mice, we have previously measured the final Hg burden on B cells to be 5.9 ng Hg/107 cells, which equates to 2.6 ppm Hg/g wet weight [(Laiosa et al. 2007)]. Thus our “low dose” ex vivo exposures in this study are within typical human environmental exposures.
In figure 3 we demonstrate that ex vivo exposure of mouse T1 transitional B cells to low levels of Hg2+ significantly attenuates activation of ERK during BCR signaling. In this respect primary T1 B cells behave essentially as we have previously found for WEHI 231 B cells, a transformed mouse B cell line often taken as a model for immature B cells [(McCabe, Jr. et al. 2007)]. While results found in transformed cells may not necessarily reflect what happens in primary cells, these new experiments give us confidence that our earlier findings with respect to the effect of Hg2+ on ERK activation in B cells are robust and meaningful. The implication is that in mercury exposed animals some transitional B cells expressing receptors that bind to self-antigens, which otherwise would have failed to make it through the T1:T2 checkpoint are allowed to do so, and eventually transition to mature B cells in the periphery. In other words, lowering BCR sensitivity in transitional B cells is expected to skew the immune repertoire towards a more auto-immune like phenotype, and so provide a foundation for a mechanistic explanation for the association of mercury with autoimmunity.
Another point worth mentioning is that figure 3 shows that even at the “0” time ERK phosphorylation in Hg2+ treated cells is depressed slightly from control cells. This confirms our previous findings that Hg2+ has a small but statistically significant inhibitory effect on ERK independent of the BCR [(McCabe, Jr. et al. 2007)]. This is not surprising though, as ERK activity depends on multiple inputs in addition to the BCR. In fact ERK has been referred to as a “signal integration node” [(Dal Porto et al. 2004)]. With respect to the BCR induced signals, the effect is to lower the “base-line” level of ERK phosphorylation, before the BCR signaling pathway is activated.
Our previous experiments with WEHI 231 also adopted a molecular ordering approach aimed at defining relevant Hg2+ targets, and suggested that the target of Hg2+ was upstream of ERK in the BCR signal transduction pathway. In fact we found that at low exposure levels that Hg2+ is bound to the cell surface and does not cross the B cell plasma membrane [(McCabe, Jr. et al. 2007)]. Thus while Hg2+ may not necessarily have to bind the BCR directly, this finding implied that the initial biochemical events in the BCR signal transduction pathway effected by Hg+2 were likely proximal to the BCR, the changes arising as a result of Hg interfering with the BCR function. Figures 4 and 5 confirms this for T1 B cells. Phosphorylation of Syk Y346 and the CD79a ITAM are among the earliest biochemical events associated with BCR signaling [(Dal Porto et al. 2004)]. We find that BCR sensitivity (whether assessed by measuring either pCD79a or pSyk) in T1 B cells is attenuated in cells obtained which have been exposed to environmentally relevant levels of Hg2+ ex vivo.
Previously we utilized mass spectrometry to investigate the mechanism whereby Hg2+ interacted with WEHI 231 B cells. Initial experiments identified the Src family tyrosine kinase Lyn as the most significant phosphoprotein regulatory node affected in Hg2+ exposed cells [(Caruso et al. 2014)]. Lyn is well known to be a critical early component of the B Cell Receptor (BCR) signaling pathway [(Lowell 2004; Xu et al. 2005)], and mice where Lyn has been knocked out, or otherwise conditionally diminished in activity, are characterized by an autoimmune phenotype [(Xu et al. 2005)]. In follow up experiments utilizing targeted mass spectrometry we found that after environmentally relevant exposures, Hg2+ likely interfered with WEHI 231 BCR signaling through a mechanism involving the phosphorylation of the dominant negative Lyn regulatory site (Lyn (Y508) [(Caruso et al. 2014)]. Significantly, in figure 6 we utilized phosphoflow cytometry to confirm that this is the case with primary T1 B cells after ex vivo exposures to Hg2+.
Generally during BCR signaling, the kinetics of Lyn Y508 phosphorylation in T1 B cells in the presence or absence of Hg2+ follows that of pCD79a and pSyk. Considering that Y508 is a dominant negative regulatory site, it appears that normally (in the absence of Hg2+) during BCR signaling Lyn activity is first diminished, and then augmented. For Syk, the phospho-site observed (Y346) is a positive regulatory site, so that after BCR activation, Syk kinase activity is first augmented and then diminished. This means that Lyn and Syk activities appear to be antagonistic; Lyn seems to function so as to bring the system back to homeostasis. This interpretation meshes nicely with the above mentioned observations linking diminished Lyn activity with autoimmunity.
However with respect to Hg2+, during BCR signaling in T1 B cells Hg2+ functions to depress Syk kinase activity, while enhancing Lyn kinase activity. In other words, if we consider that BCR signaling is characterized by a transient disruption of kinase activity from homeostasis, and assume that BCR signal strength is correlated with the size of the transient, then Hg2+ is seen to depress the size of the transient and consequently attenuate BCR sensitivity in T1 B cells. As we have pointed out, because BCR signaling in T1 B cells is responsible for negative selection of self-reactive B cell clones, any diminution of BCR sensitivity would be expected to skew the mature B cell repertoire towards a more autoimmune-like phenotype.
HIGHLIGHTS.
Hg2+ interferes with BCR-mediated activation of ERK in immature T1 B cells
Hg2+ acts upstream of ERK
BCR mediated activation of Syk and the CD79a ITAM are attenuated in immature T1 B cells by Hg2+
The mechanism whereby which Hg2+ affects Syk and CD7a activation involves the tyrosine phosphokinase Lyn
Acknowledgments
This work was supported by the National Institute of Environmental Health Sciences grants ES024476 and ES020957.
Abbreviations
- Hg
Mercury
- AD
Autoimmune Disease
- BCR
B Cell Receptor
- T1
Transitional Type 1 B cell
Footnotes
Publisher's Disclaimer: This is a PDF file of an unedited manuscript that has been accepted for publication. As a service to our customers we are providing this early version of the manuscript. The manuscript will undergo copyediting, typesetting, and review of the resulting proof before it is published in its final citable form. Please note that during the production process errors may be discovered which could affect the content, and all legal disclaimers that apply to the journal pertain.
CONFLICT OF INTEREST STATEMENT
The authors declare that there are no conflicts of interest
References
- Bagenstose LM, Salgame P, Monestier M. Murine mercury-induced autoimmunity: a model of chemically related autoimmunity in humans. Immunol Res. 1999;20(1):67–78. doi: 10.1007/BF02786508. [DOI] [PubMed] [Google Scholar]
- Cambier JC. Autoimmunity risk alleles: hotspots in B cell regulatory signaling pathways. J Clin Invest. 2013;123(5):1928–1931. doi: 10.1172/JCI69289. [DOI] [PMC free article] [PubMed] [Google Scholar]
- Cambier JC, Getahun A. B cell activation versus anergy; the antigen receptor as a molecular switch. Immunol Lett. 2010;128(1):6–7. doi: 10.1016/j.imlet.2009.09.006. [DOI] [PMC free article] [PubMed] [Google Scholar]
- Caruso JA, Stemmer PM, Dombkowski A, Caruthers NJ, Gill R, Rosenspire AJ. A systems toxicology approach identifies Lyn as a key signaling phosphoprotein modulated by mercury in a B lymphocyte cell model. Toxicol Appl Pharmacol. 2014;276(1):47–54. doi: 10.1016/j.taap.2014.01.002. [DOI] [PMC free article] [PubMed] [Google Scholar]
- Chung JB, Silverman M, Monroe JG. Transitional B cells: step by step towards immune competence. Trends Immunol. 2003;24(6):343–349. doi: 10.1016/s1471-4906(03)00119-4. [DOI] [PubMed] [Google Scholar]
- Clarkson TW, Magos L. The toxicology of mercury and its chemical compounds. Crit Rev Toxicol. 2006;36(8):609–662. doi: 10.1080/10408440600845619. [DOI] [PubMed] [Google Scholar]
- Cooper GS, Parks CG, Treadwell EL, St Clair EW, Gilkeson GS, Dooley MA. Occupational risk factors for the development of systemic lupus erythematosus. J Rheumatol. 2004;31(10):1928–1933. [PubMed] [Google Scholar]
- Dahlgren J, Takhar H, Anderson-Mahoney P, Kotlerman J, Tarr J, Warshaw R. Cluster of systemic lupus erythematosus (SLE) associated with an oil field waste site: a cross sectional study. Environ Health. 2007;6(1):8. doi: 10.1186/1476-069X-6-8. [DOI] [PMC free article] [PubMed] [Google Scholar]
- Dal Porto JM, Gauld SB, Merrell KT, Mills D, Pugh-Bernard AE, Cambier J. B cell antigen receptor signaling 101. Mol Immunol. 2004;41(6–7):599–613. doi: 10.1016/j.molimm.2004.04.008. [DOI] [PubMed] [Google Scholar]
- Dantas DCM, Queiroz MLS. Immunoglobulin E and autoantibodies in mercury-exposed workers. Immunopharmacol and Immunotoxicol. 1997;19:383–392. doi: 10.3109/08923979709046983. [DOI] [PubMed] [Google Scholar]
- Druet P. Metal-induced autoimmunity. Hum Exp Toxicol. 1995;14(1):120–121. doi: 10.1177/096032719501400129. [DOI] [PubMed] [Google Scholar]
- Gill RF, McCabe MJ, Rosenspire AJ. Elements of the B cell signalosome are differentially affected by mercury intoxication. Autoimmune Dis. 2014;2014:239358. doi: 10.1155/2014/239358. [DOI] [PMC free article] [PubMed] [Google Scholar]
- Grimaldi CM, Hicks R, Diamond B. B cell selection and susceptibility to autoimmunity. J Immunol. 2005;174(4):1775–1781. doi: 10.4049/jimmunol.174.4.1775. [DOI] [PubMed] [Google Scholar]
- Havarinasab S, Haggqvist B, Bjorn E, Pollard KM, Hultman P. Immunosuppressive and autoimmune effects of thimerosal in mice. Toxicol Appl Pharmacol. 2005;204(2):109–121. doi: 10.1016/j.taap.2004.08.019. [DOI] [PubMed] [Google Scholar]
- Havarinasab S, Hultman P. Organic mercury compounds and autoimmunity. Autoimmun Rev. 2005;4(5):270–275. doi: 10.1016/j.autrev.2004.12.001. [DOI] [PubMed] [Google Scholar]
- Irish JM, Czerwinski DK, Nolan GP, Levy R. Altered B-cell receptor signaling kinetics distinguish human follicular lymphoma B cells from tumor-infiltrating nonmalignant B cells. Blood. 2006a;108(9):3135–3142. doi: 10.1182/blood-2006-02-003921. [DOI] [PMC free article] [PubMed] [Google Scholar]
- Irish JM, Czerwinski DK, Nolan GP, Levy R. Kinetics of B cell receptor signaling in human B cell subsets mapped by phosphospecific flow cytometry. J Immunol. 2006b;177(3):1581–1589. doi: 10.4049/jimmunol.177.3.1581. [DOI] [PubMed] [Google Scholar]
- Irish JM, Hovland R, Krutzik PO, Perez OD, Bruserud O, Gjertsen BT, Nolan GP. Single cell profiling of potentiated phospho-protein networks in cancer cells. Cell. 2004;118(2):217–228. doi: 10.1016/j.cell.2004.06.028. [DOI] [PubMed] [Google Scholar]
- Irish JM, Kotecha N, Nolan GP. Mapping normal and cancer cell signalling networks: towards single-cell proteomics. Nat Rev Cancer. 2006c;6(2):146–155. doi: 10.1038/nrc1804. [DOI] [PubMed] [Google Scholar]
- Kevorkian J, Cento DP, Hyland JR, Bagozzi WM, Van Hollebeke E. Mercury content of human tissues during the twentieth century. Am J Public Health. 1972;62(4):504–513. doi: 10.2105/ajph.62.4.504. [DOI] [PMC free article] [PubMed] [Google Scholar]
- Krutzik PO, Irish JM, Nolan GP, Perez OD. Analysis of protein phosphorylation and cellular signaling events by flow cytometry: techniques and clinical applications. Clin Immunol. 2004;110(3):206–221. doi: 10.1016/j.clim.2003.11.009. [DOI] [PubMed] [Google Scholar]
- Laiosa MD, Eckles KG, Langdon M, Rosenspire AJ, McCabe MJ., Jr Exposure to inorganic mercury in vivo attenuates extrinsic apoptotic signaling in Staphylococcal aureus enterotoxin B stimulated T-cells. Toxicol Appl Pharmacol. 2007 doi: 10.1016/j.taap.2007.06.002. [DOI] [PMC free article] [PubMed] [Google Scholar]
- Loder F, Mutschler B, Ray RJ, Paige CJ, Sideras P, Torres R, Lamers MC, Carsetti R. B cell development in the spleen takes place in discrete steps and is determined by the quality of B cell receptor-derived signals. J Exp Med. 1999;190(1):75–89. doi: 10.1084/jem.190.1.75. [DOI] [PMC free article] [PubMed] [Google Scholar]
- Lowell CA. Src-family kinases: rheostats of immune cell signaling. Mol Immunol. 2004;41(6–7):631–643. doi: 10.1016/j.molimm.2004.04.010. [DOI] [PubMed] [Google Scholar]
- Mayes MD. Epidemiologic studies of environmental agents and systemic autoimmune diseases. Environ Health Perspect. 1999;107(Suppl 5):743–748. doi: 10.1289/ehp.99107s5743. [DOI] [PMC free article] [PubMed] [Google Scholar]
- McCabe MJ, Jr, Eckles KG, Langdon M, Clarkson TW, Whitekus MJ, Rosenspire AJ. Attenuation of CD95-induced apoptosis by inorganic mercury: caspase-3 is not a direct target of low levels of Hg2+ Toxicol Lett. 2005;155(1):161–170. doi: 10.1016/j.toxlet.2004.09.013. [DOI] [PubMed] [Google Scholar]
- McCabe MJ, Jr, Laiosa MD, Li L, Menard SL, Mattingly RR, Rosenspire AJ. Low and Nontoxic Inorganic Mercury Burdens Attenuate BCR-Mediated Signal Transduction. Toxicol Sci. 2007;99(2):512–521. doi: 10.1093/toxsci/kfm188. [DOI] [PubMed] [Google Scholar]
- McCabe MJ, Jr, Santini RP, Rosenspire AJ. Low and nontoxic levels of ionic mercury interfere with the regulation of cell growth in the WEHI-231 B-cell lymphoma. Scand J Immunol. 1999;50(3):233–241. doi: 10.1046/j.1365-3083.1999.00590.x. [DOI] [PubMed] [Google Scholar]
- Packard TA, Cambier JC. B lymphocyte antigen receptor signaling: initiation, amplification, and regulation. F1000Prime Rep. 2013;5:40. doi: 10.12703/P5-40. [DOI] [PMC free article] [PubMed] [Google Scholar]
- Pollard KM, Hultman P. Effects of mercury on the immune system. Met Ions Biol Syst. 1997;34:421–440. [PubMed] [Google Scholar]
- Queiroz MLS, Dantas DCM. B lymphocytes in mercury-exposed workers. Pharmacology & Toxicology. 1997a;81:130–133. doi: 10.1111/j.1600-0773.1997.tb00042.x. [DOI] [PubMed] [Google Scholar]
- Queiroz MLS, Dantas DCM. T lymphocytes in mercury-exposed workers. Immunopharmacol and Immunotoxicol. 1997b;19:499–510. doi: 10.3109/08923979709007671. [DOI] [PubMed] [Google Scholar]
- Rosenspire AJ, Bodepudi S, Mathews M, McCabe MJ., Jr Low levels of ionic mercury modulate protein tyrosine phosphorylation in lymphocytes. Int J Immunopharmacol. 1998;20(12):697–707. doi: 10.1016/s0192-0561(98)00045-9. [DOI] [PubMed] [Google Scholar]
- Rowley B, Monestier M. Mechanisms of heavy metal-induced autoimmunity. Mol Immunol. 2005;42(7):833–838. doi: 10.1016/j.molimm.2004.07.050. [DOI] [PubMed] [Google Scholar]
- Silbergeld EK, Silva IA, Nyland JF. Mercury and autoimmunity: implications for occupational and environmental health. Toxicol Appl Pharmacol. 2005;207(2 Suppl):282–292. doi: 10.1016/j.taap.2004.11.035. [DOI] [PubMed] [Google Scholar]
- Somers EC, Ganser MA, Warren JS, Basu N, Wang L, Zick SM, Park SK. Mercury Exposure and Antinuclear Antibodies among Females of Reproductive Age in the United States: NHANES. Environ Health Perspect. 2015;123(8):792–798. doi: 10.1289/ehp.1408751. [DOI] [PMC free article] [PubMed] [Google Scholar]
- Su TT, Rawlings DJ. Transitional B lymphocyte subsets operate as distinct checkpoints in murine splenic B cell development. J Immunol. 2002;168(5):2101–2110. doi: 10.4049/jimmunol.168.5.2101. [DOI] [PubMed] [Google Scholar]
- Warner GL, Scott DW. Lymphoma models for B-cell activation and tolerance. Cellular Immunology. 1988;115:195–203. doi: 10.1016/0008-8749(88)90173-6. [DOI] [PubMed] [Google Scholar]
- Xu Y, Harder KW, Huntington ND, Hibbs ML, Tarlinton DM. Lyn tyrosine kinase: accentuating the positive and the negative. Immunity. 2005;22(1):9–18. doi: 10.1016/j.immuni.2004.12.004. [DOI] [PubMed] [Google Scholar]
- Yanaba K, Bouaziz JD, Matsushita T, Magro CM, St Clair EW, Tedder TF. B-lymphocyte contributions to human autoimmune disease. Immunol Rev. 2008;223:284–299. doi: 10.1111/j.1600-065X.2008.00646.x. [DOI] [PubMed] [Google Scholar]