

Abstract
Heritability is well documented for psychiatric disorders and cognitive abilities which are, however, complex, involving both genetic and environmental factors. Hence, it remains challenging to discover which and how genetic variations contribute to such complex traits. In this article, they propose to use mediation analysis to bridge this gap, where neuroimaging phenotypes were utilized as intermediate variables. The Philadelphia Neurodevelopmental Cohort was investigated using genome‐wide association studies (GWAS) and mediation analyses. Specifically, 951 participants were included with age ranging from 8 to 21 years. Two hundred and four neuroimaging measures were extracted from structural magnetic resonance imaging scans. GWAS were conducted for each measure to evaluate the SNP‐based heritability. Furthermore, mediation analyses were employed to understand the mechanisms in which genetic variants have influence on pathological behaviors implicitly through neuroimaging phenotypes, and identified SNPs that would not be detected otherwise. Our analyses found that rs10494561, located in the intron region within NMNAT2, was associated with the severity of the prodromal symptoms of psychosis implicitly, mediated through the volume of the left hemisphere of the superior frontal region ( ). The gene NMNAT2 is known to be associated with brainstem degeneration, and produce cytoplasmic enzyme which is mainly expressed in the brain. Another SNP rs2285351 was found in the intron region of gene IFT122 which may be potentially associated with human spatial orientation ability through the area of the left hemisphere of the isthmuscingulate region ( ). Hum Brain Mapp 38:4088–4097, 2017. © 2017 Wiley Periodicals, Inc.
Keywords: genome‐wide association studies, imaging genetics, intermediate phenotypes, neuroimaging measures
INTRODUCTION
With the advent of modern biomedical techniques, the investigation on brain functions has been greatly facilitated. Existing works have characterized the genetic influence on many complex psychiatric disorders, such as schizophrenia [Meyer‐Lindenberg et al., 2005; Weinberger et al., 2001], autism [Belmonte et al., 2004], addictions [Goldman et al., 2005] and depression [Pezawas et al., 2005], and diverse cognitive abilities [Davies et al., 2011; Plomin et al., 2013].
However, the mechanisms regarding how genetic variations cause such psychiatric or cognitive phenotypes are not yet well understood. On one hand, such phenotypes are usually self‐reported and are hence subjective to a certain extent, potentially weakening the genetic effect. On the other hand, genes do not explicitly encode pathological behaviors [Meyer‐Lindenberg and Weinberger, 2006], for example, delusion or agitation. That is, directly associating genetic variants with pathological behaviors might lead to inaccurate or even incorrect results. Therefore, effective tools that can bridge the gap between genetic variations and behavioral phenotypes are urgently needed.
Imaging genetics, a transdisciplinary and thriving field which maps brain structures and functions to genetic variants [Bertram et al., 2007; Glahn et al., 2007; Potkin et al., 2009], has attracted a great deal of attention recently. Instead of directly measuring the association between behavioral phenotypes and genetic variations, imaging genetics seeks to utilize brain functions and neural activities as intermediate phenotypes. Such intermediate phenotypes are systematically measured, and hence their relation with genetic effects, if exist, could be more reliable. Furthermore, the influence of brain activities on psychiatric or cognitive behaviors is more interpretable and straightforward. Thus, investigation of psychiatric disorders and cognitive abilities could be greatly facilitated through incorporating neuroimaging information.
In this article, we apply imaging genetics techniques to discover the implicit mechanisms that the genetic architecture may have on psychiatric and cognitive phenotypes. Specifically, we investigated the Philadelphia Neurodevelopmental Cohort (PNC). Strict quality‐control criteria were imposed to guarantee the quality of included samples. We applied a two‐step procedure to identify genetic mechanisms. First, GWAS of each neuroimaging measure were conducted to identify genome‐wide significant single nucleotide polymorphisms (SNPs). Furthermore, for each neuroimaging measure associated with significant SNPs, we used mediation analyses to identify psychiatric and cognitive phenotypes. Thus, complete yet complex mechanisms from genetic variants to phenotypes, mediated through intermediate brain phenotypes, were identified.
The proposed method brings two advantages. First, mediation analysis utilizes additional information from intermediate neuroimaging measures, which leads to more accurate results and is able to detect genetic signals that are otherwise neglected. This is illustrated in the PNC data analysis where direct association studies between phenotypes and genetic variants cannot discover mechanisms that were constructed through the mediation analysis. Second, since genes do not encode behaviors that are resulted from psychiatric disorders or cognitive abilities, mediation analysis is able to detect more complicated mechanisms where genetic variations may have influence on psychiatric or cognitive traits implicitly through intermediate phenotypes including the neuroimaging measures. These advantages make mediation analysis a promising tool for imaging genetics, and for the discovery of hidden mechanisms in more general biological fields.
SAMPLES AND METHODS
The Philadelphia Neurodevelopmental Cohort
The Philadelphia Neurodevelopmental Cohort (PNC) is a population‐based sample collected from over 9,500 children and adolescents aged 8–21 years. The participants were from the greater Philadelphia area who received medical care at the Children's Hospital of Philadelphia network. The medical conditions of the participants varied, ranging from general health checkup to potentially life‐threatening health problems. During their clinical visit, the participants were genotyped upon consent with one of the six platforms including Affymetrix Affy60 and Axiom, and Illumina HumanHap550 (v1, v3), Human610‐Quad (v1), and HumanOmniExpress. Participants were assessed neuropsychiatrically through a structured interview, and a computerized neurocognitive battery was conducted to assess participants' cognitive abilities. Furthermore, participants were selected at random after population stratification, and were included if they satisfied the following inclusion criteria: informed consent, English language proficiency, and physical and cognitive abilities to participate in a clinical interview and neurocognitive tests. A subset of 1,445 participants also had neuroimaging scans including functional magnetic resonance imaging (MRI), structural MRI and diffusion tensor imaging (DTI). The PNC data were sourced from the Philadelphia Neurodevelopmental Cohort, a research initiative hosted by the Brain Behavior Laboratory at the University of Pennsylvania and the Center for Applied Genomics at the Children's Hospital of Philadelphia. See Gur et al. [2010, 2012] and https://www.med.upenn.edu/bbl/philadelphianeurodevelopmentalcohort.html for more details about the PNC dataset.
Psychiatric and Cognitive Phenotypes
A total of 905 clinical and neurocognitive variables were collected from 8,719 participants who participated in the clinical assessment and the computerized neurocognitive battery. In the clinical assessments, participants and their parents were interviewed to obtain demographic information, medical history, as well as screener for psychopathology. The screener is based on several psychiatric disorders, including anxiety disorder, attention deficit hyperactivity disorder, conduct disorder, eating disorder, mood disorder, oppositional defiant disorder, post‐traumatic stress disorder and psychosis. Meanwhile, the neurocognitive battery comprises of 14 tests assessing executive‐control (abstraction and mental flexibility, attention, and working memory), episodic memory (word memory, face memory, and spatial memory), complex cognition (language and analogical reasoning, nonverbal reasoning, and spatial processing), social cognition (emotion identification, emotion differentiation, and age differentiation), and sensorimotor speed (sensorimotor processing speed, and motor). Both accuracy and speed were measured except for the two tests regarding sensorimotor speed. In addition, a Wide Range Achievement Test [WRAT4; Wilkinson and Robertson, 2006] was conducted to estimate participants' IQ. When cleaning the data, we removed variables that were irrelevant to psychiatric or cognitive assessment, or had a more than 10% missing rate. In addition, we merged scores that measured the same psychiatric disorder, resulting in a total of 104 traits.
Intermediate Neuroimaging Phenotypes
A subsample of 1,445 participants attended the multimodal neuroimaging. The neuroimage results from 986 out of these 1,445 participants were further analyzed and converted into intermediate neuroimaging phenotypes through Freesurfer via the DK automated labeling system [Desikan et al., 2006]. That is, for each of the 986 participants, we acquired the total area, average thickness and total volume from the left and right hemispheres of 34 cortical and subcortical regions of interest. This resulted in a total of 204 neuroimaging measures for each participant. No missing data were observed. However, measures larger than four standard deviations from the mean were considered as outliers and removed.
Genotype Data
We investigated 513,519 SNPs which were available from 6,277 participants genotyped by using three Illumina arrays: HumanHap550 (v1, v3) and Human610‐Quad (v1). Among these SNPs, 301,462 were also available from additional 1,657 participants who were genotyped using the Illumina array HumanOmniExpress and were also included in our study. 68,314 SNPs were removed due to poor genotype call rate ( ), low minor allele frequency ( ) or disrupted Hardy–Weinberg equilibrium ( ), and a total of 445,205 SNPs from four arrays were considered in the following statistical analysis. Missing genotypes of the remaining SNPs were imputed according to the minor allele frequency reported by the 1000 Genome Project (phase 3) [1000 Genomes Project Consortium, 2015].
Sample Inclusion Criteria
Within the PNC data, a sample of 951 participants participated in: (1) clinical assessment and computerized neurocognitive battery, (2) genotyping, and (3) neuroimaging scans. Identity by descent was estimated in this sample to detect excess relatedness, for example, siblings and cousins. The younger of any pair of participants with relatedness greater than 0.2 was removed. Furthermore, a principal component analysis of the quality‐controlled genotype data was conducted to help determine participants' European genetic ancestry (see Fig. S1 in the Supporting Information material). Here population stratification was observed, possibly due to systematic ancestry differences such as physical separation between subpopulations and genetic drift of allele frequencies [Price et al., 2006]. Subsequently, we removed participants whose scores on the first two principal components were above the upper 1% quantiles of the self‐identified European descents. Finally, a sample of 452 participants with European genetic ancestry was selected for statistical analysis. Similarly, we identified 399 participants as having African genetic ancestry for their scores on the first principal component being above the lower 1% quantiles of the self‐identified African descents. The analytical results were then tested on the sub‐sample of African genetic ancestry. All statistical procedures in this article were conducted in R software unless otherwise noted. In the supplementary material, we also tested the analytical results using the entire sample excluding participants with excess relatedness.
Genome‐Wide Association Studies
Prior to the GWAS, as a standard practice [Mehta et al., 2016; Risacher et al., 2009; Shen et al., 2010], each neuroimaging measure was adjusted by age, sex, intracranial volume (ICV), handedness, array of genotyping, and the first two principal components of the genotype data through linear regression. Two hundred and four separate GWAS scans corresponding to 204 adjusted neuroimaging measures were conducted to identify genome‐wide significant SNPs. Linear regression was utilized for each scan, including the genetic variants as well as participants' age, sex and the first two principal components of the genotype data corresponding to population stratification. The P‐value for each SNP effect was determined by the Wald test. A threshold of was considered for significance after Bonferroni correction, controlling for the total of 445,205 SNPs. A Manhattan plot and a quantile–quantile (QQ) plot were utilized to visualize the significant GWAS results.
Mediation Analyses
We conducted mediation analyses to determine the complex mechanisms that a SNP is associated with a psychiatric or cognitive phenotype through an intermediate imaging phenotype, which is also called an “endophenotype” [Gottesman and Gould, 2003; Meyer‐Lindenberg and Weinberger, 2006]. Here we followed Baron and Kenny [1986] for mediation. Let y be a dependent variable which could be a psychiatric or cognitive phenotype, m a mediator which could be an intermediate imaging phenotype, x a genetic variant, and zi, i = 1, 2, 3, vectors of covariates including intercept that control for the genetic effects. Here x and zi are also called the independent variables. If the following three criteria are satisfied, we say that y is associated with x, mediated through m, which provides a mechanism regarding how x has influence on y implicitly through m.
Step 1: We regress the mediator m against x and controlling for z 1:
and the coefficient β 11 is significant (as defined below).
Step 2: We regress the outcome variable y against x and controlling for z 2:
and the coefficient β 21 is significant (as defined below).
Step 3: We regress the outcome variable y against both m and x, controlling for z 3:
The coefficient β 32 is significant (as defined below), and .
The mediation model is illustrated in Figure 1: Here the product of β 11 and β 32 corresponds to the indirect effects as in processes (a) and (c), and β 31 represents the direct effect of x on y, as illustrated in process (b). The total effect β 21 is the summation of direct and indirect effects, which equals , if all three regressions are conducted on the same sample. In addition to the three conditions above, we also require that the p‐value of β 31 is greater than that of β 21, representing that the total influence of x on y is partially explained by the indirect effect of x through m.
Figure 1.
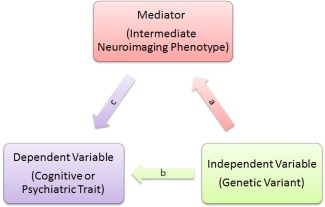
Mediation analysis. A mediation model was utilized to detect the direct and indirect effect that a genetic variant may have on a cognitive or psychiatric trait. a): Genome‐wide association scans were performed to search for pairs of intermediate neuroimaging phenotypes and genetic variants that had significant associations. b): The cognitive or psychiatric trait was fit against each candidate genetic variant to test for direct and significant influence. c): The cognitive or psychiatric trait was fit against identified genetic variant and its associated intermediate neuroimaging phenotype simultaneously. A mediation relationship is built if 1): the genetic variant is significant in a), 2): the genetic variant is significant in b), 3): the intermediate neuroimaging phenotype is significant in c), while the genetic variant has a smaller coefficient magnitude in c) than in a). A mediation relationship indicates a mechanism that the genetic variant may have implicit influence on the trait through the intermediate neuroimaging phenotype. [Color figure can be viewed at http://wileyonlinelibrary.com]
It can be seen that GWAS in the previous subsection represented step 1 of the mediation model. Hence, the significance level set for β 11 is as defined in the previous section. To perform the mediation analyses, we considered SNPs that were genome‐wide significant in the GWAS. Bonferroni correction was conducted for both steps 2 and 3. In step 2, the significance level set for β 21 is , where n traits = 104 is the number of traits and n SNPs is the number of significant SNPs identified in step 1. And in step 3, the significant level for β 32 is , where n mech is the number of phenotype‐neuroimaging‐SNP mechanisms that survives step 1 and 2 and has β 32 pass the 0.05 general significance level. Linear regression was utilized if the outcome variable in steps 2 and 3 was continuous or had more than two discrete values; logistic regression was utilized if the outcome variable was binary. Three normality tests were conducted for residuals of the neuroimaging measures that were fit against the identified SNPs, namely the Cramer–von Mises test, the Kolmogorov–Smirnov test, and the Pearson chi‐square test [Thode, 2002].
RESULTS
Genome‐Wide Association Studies
GWAS scans were conducted for 204 adjusted neuroimaging measures. In Table 1, we listed all pairs of SNPs and neuroimaging measures which had significant associations and reported their corresponding genes and P‐values. Specifically, thirteen pairs of SNPs and neuroimaging measures were found significant, among which three associations pinpoint to the isthmus cingulate region, including both area and volume. Furthermore, we found that rs10494561 on chromosome 1 was significantly associated with superior frontal volume of the left hemisphere (n = 452, ), and that rs2285351 on chromosome 3 (n = 451, ) and rs8106164 on chromosome 19 (n = 451, ) were significantly associated with isthmus cingulate area of the left hemisphere. As an example, Figures 2 and 3 display the QQ plots and Manhattan plots for the GWAS of the superior frontal volume and the isthmus cingulate area of the left hemisphere, respectively.
Table 1.
Identifying significant genetic variants
| Intermediate neuroimaging phenotype | Common genetic variant | ||||||
|---|---|---|---|---|---|---|---|
| Region of Interest | HS | Measure | SNP | CHR | Gene | P‐value | |
| Inferior temporal | Left | Area | rs9405882 | 6 | LOC105374898, |
|
|
| LOC107986516 | |||||||
| Isthmus cingulate | Left | Area | rs2285351 | 3 | IFT122 |
|
|
| Isthmus cingulate | Left | Area | rs8106164 | 19 | LOC100420587 |
|
|
| Posterior cingulate | Left | Area | rs16940638 | 15 | ADAM10 |
|
|
| Transverse temporal | Left | Area | rs7616413 | 3 | Intergenic |
|
|
| Fusiform | Right | Area | rs6879305 | 5 | SV2C |
|
|
| Insula | Right | Area | rs8106164 | 19 | LOC100420587 |
|
|
| Caudal anterior cingulate | Right | Thickness | rs919116 | 12 | Intergenic |
|
|
| Isthmus cingulate | Left | Volume | rs8106164 | 19 | LOC100420587 |
|
|
| Superior frontal | Left | Volume | rs10494561 | 1 | NMNAT2 |
|
|
| Cuneus | Right | Volume | rs2850531 | 18 | Intergenic |
|
|
| Pars orbitalis | Right | Volume | rs39823 | 5 | DOCK2 |
|
|
| Post central | Right | Volume | rs7182018 | 15 | LOC105370777 |
|
|
GWAS were conducted for each adjusted neuroimaging measure. Thirteen genome‐wide significant associations between SNPs and adjusted neuroimaging measures were detected. For neuroimaging phenotypes, their region of interest, hemisphere (HS) and measure were provided. For identified SNPs, their chromosome (CHR), gene, and P‐value were provided.
Figure 2.
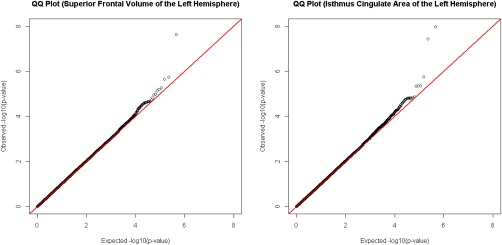
GWAS were conducted through linearly regressing the superior frontal volume and the isthmus cingulate area of the left hemisphere against each SNP, controlling for age, sex and the first two principal components of the genotype data. QQ plots for the two GWAS were illustrated on the left and right panels. The observed P‐values were plotted against the expected P‐values, after a transformation of negative ten‐based logarithm. The red straight lines had slope equal to 1. The genomic inflation factors were 1.013672 and 1.011903 for the left and the right panels, respectively. [Color figure can be viewed at http://wileyonlinelibrary.com]
Figure 3.
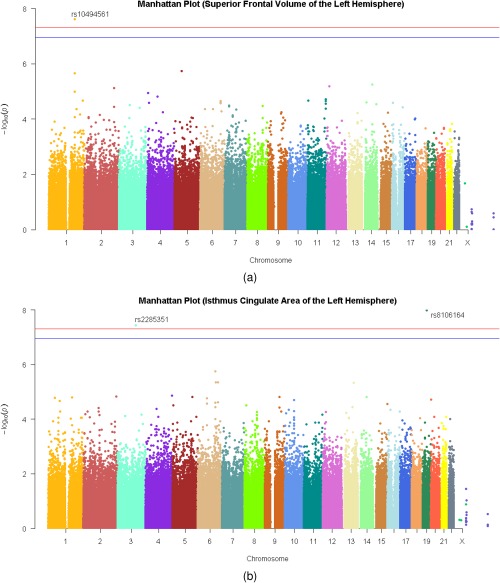
GWAS were conducted through linearly regressing the superior frontal volume and the isthmus cingulate area of the left hemisphere of the left hemisphere against each SNP, controlling for age, sex, and the first two principal components of the genotype data. Manhattan plot for each of the two measures were illustrated in the top and the bottom panel, where the blue horizontal line represented the multiple‐comparisons‐corrected threshold of , and the red horizontal line represented the common threshold of .
Mediation Analyses
Mediation analyses were conducted for the thirteen pairs of SNPs and neuroimaging measures. In step 2, since 104 psychiatric and cognitive traits were included and 13 pairs of SNPs and neuroimaging measures were identified, the threshold for P‐value was set to be . Furthermore, in step 3, three phenotype‐neuroimaging‐SNP trios were declared and hence the threshold for P‐value was set to be .
Among the three trios, two satisfied all of the mediation conditions and were listed in Table 3, for which the description of the traits was given in Table 2. Specifically, we found that rs10494561, which is located in the intron region of gene NMNAT2 on chromosome 1, was significantly associated with occupational functioning severity (n = 449, ), which is considered a predrome of psychosis. Recall that rs10494561 was significantly associated with superior frontal volume of the left hemisphere. Furthermore, superior frontal volume of the left hemisphere was significantly associated with occupational functioning severity (n = 449, P = 0.01), controlling for rs10494561, age, sex, and the first two principal components of the genotype data. Then based on the mediation model, these three observations indicated that rs10494561 implicitly had influence on occupational functioning severity, mediated through the superior frontal volume of the left hemisphere. Similarly, we found that rs2285351, which is located in the intron region of gene IFT122 on chromosome 3, was associated with human spatial orientation through the isthmus cingulate area of the left hemisphere. For the two complete mechanisms in Table 3, residuals of the neuroimaging measure fit against the identified SNP were illustrated in Figure S2 in the Supporting Information material. Residuals from both regressions passed the three normality tests, that is, the Cramer–von Mises test (P = 0.36 and 0.05), the Kolmogorov–Smirnov test (P = 0.27 and 0.13), and the Pearson chi‐square test (P = 0.97 and 0.47).
Table 3.
Mediation analysis to discover mechanisms
| Step 1 Model | Step 2 Model | Step 3 Model | ||||||||||||||||
|---|---|---|---|---|---|---|---|---|---|---|---|---|---|---|---|---|---|---|
| Trait | Mediator (HS, measure) | SNP | SNP effect (se) | P‐value | Sample size | Total effect (se) | P‐value | Sample size | Dir. effect (se) | P‐value | M. effect (se) | M. P‐value | Sample size | |||||
| SIP041 | Superior frontal | rs10494561 | 848.22 |
|
452 | 0.26 |
|
449 | 0.22 |
|
|
|
449 | |||||
| (lh, vol) | (149.24) | (0.05) | (0.06) | ( ) | ||||||||||||||
| PLOT | Isthmus cingulate | rs2285351 | 566.95 |
|
451 | 14,964.39 |
|
448 | 13,656.25 |
|
2.31 |
|
447 | |||||
| (lh, area) | (101.19) | (1,995.96) | (2,055.43) | (0.93) | ||||||||||||||
Mediation analyses were conducted for each pair of SNP and neuroimaging measure with significant association. Two significant mechanisms were detected, where SNPs had influence on psychiatric or cognitive traits implicitly, mediated through neuroimaging measures.
Note: The Step 1, 2, and 3 models correspond to the three steps of the mediation analysis in the main text. The description of each trait is listed in Table 2. Mediators were neuroimaging measures whose names consisted of region of interest with hemisphere and measure included in the parenthesis. SNP Effect was the effect of the SNP on the mediator. Total Effect and Dir. Effect corresponded to the total and direct effect of the SNP on the trait, respectively, while M. Effect corresponded to the effect of the mediator. The product of the SNP Effect and the M. Effect represents the indirect effect of the SNP. Standard errors were provided in the parentheses beneath effects, P‐values were provided in a separate column right to the corresponding effects.
Table 2.
Trait description
| Trait code | Trait name | Associated domain | Description |
|---|---|---|---|
| SIP041 | Structured interview for prodromal symptoms | Psychosis | Occupational functioning severity scale |
| PLOT | Pennsylvania line orientation test | Spatial processing | Median response time for correct trials |
The name, associated domain, and description of each selected trait are listed.
In Table 3, the total effect of each SNP was positive. That is, participants with a larger number of minor allele copies might have higher severity scales of occupational functioning or a longer response time for spatial processing. Furthermore, the direct effect of each SNP took account of a large proportion of the total effect. In other words, the SNPs' influence on psychiatric and cognitive traits were mostly direct than indirect. However, the indirect effect of SNPs on phenotypic traits, although small, rendered small P‐values, which indicated nonignorably strong signals. Meanwhile, it can be seen that if we considered only the total effect as in the step 2 model, then the identified SNP rs10494561 could not be detected by the GWAS alone. Therefore, the proposed mediation analysis, through utilizing additional information from intermediate neuroimaging measures, was able to discover potential signals that were otherwise neglected. The two complete mechanisms were tested on the sub‐sample of African genetic ancestry; however, none of them were significantly identified.
Another interesting finding was that rs8106164 on chromosome 19 had enhanced influence on working memory in the domain of executive‐control, if mediated through the insula area of the right hemisphere. Specifically, rs8106164's effect on working memory was enhanced from with to with when the insula area of the right hemisphere was included in the model. That is, we observed an improvement in both the magnitude and significance of the effect.
DISCUSSION
In this article, we presented genome‐wide association studies of cognitive and psychiatric traits to investigate potential genetic heritability. Furthermore, we proposed to utilize mediation analyses to discover possible mechanisms where genetic variants may have influence on cognitive and psychiatric traits implicitly, that is, through intermediate neuroimaging phenotypes. Such implicit mechanisms may not be identified via GWAS alone. Two significant mechanisms were detected. Specifically, the SNP rs10494561, located in the intron region within NMNAT2, was found to be associated with the severity of the prodromal symptoms of psychosis implicitly, mediated through the volume of the left hemisphere of the superior frontal region ( ). Another SNP rs2285351 was found in the intron region of the IFT122 gene that may be potentially associated with human spatial orientation ability through the area of the left hemisphere of the isthmuscingulate region ( ). The gene NMNAT2 is known to be associated with brainstem degeneration, and produce cytoplasmic enzyme which is mainly expressed in the brain; while the mutation of the gene IFT122 is known to be the cause of a rare disease cranioectodermal dysplasia [Walczak‐Sztulpa et al., 2010].
One bottleneck of our analysis is that the sample size of the imaging data is quite limited. For example, in the PNC data, around 8,000 participants were included in clinical assessment and genotyping. However, among these participants, only 951 of them participated in neuroimaging scans. In general, acquiring and cleaning imaging data are more difficult and time‐consuming than that of clinical and genetic data. Thus, lack of sample size is quite ubiquitous in many imaging genetics problems [Shen et al., 2010]. This imposes great challenges to the discovery of potential heritability. As included in the Supporting Information (Table S1), we also analyzed a larger sample of 901 participants by relaxing the quality control criteria. However, merely increasing the sample size did not yield more significant results. One possible solution is to merge multiple cohorts and conduct meta‐analyses [Hibar et al., 2015]. Meanwhile, other sources of intermediate phenotypes can be applied to bridge the gap between genetic variation and psychiatric traits, for example, traits measured in electrophysiology or neurobiochemistry. This is also a potential solution to the lack‐of‐sample problem.
One future direction is to develop an innovative statistical method which could incorporate participants who had only genotyping and clinical assessment. Borrowed from structural matrix completion and graphical modeling techniques, this calibration may enhance statistical power. In addition, European genetic ancestry entailed a small subset of samples especially when a strict quality‐control procedure was applied (n = 452 in this study). Thus, integrating samples from non‐European genetic ancestry is also worth investigation, which may increase the number of qualified samples as well as shed light on the genetic heritability on neuroimaging traits from minority populations.
Another future direction is to investigate the polygenic effects and gene‐environment interactions through mediation. It is well known that certain psychiatric diseases may be influenced by multiple genetic variants simultaneously, although each genetic variant may contribute insignificantly [Meyer‐Lindenberg and Weinberger, 2006]. However, implicit genetic mechanisms are not well understood where polygenic effects and gene–environment interactions have influence on psychiatric diseases or cognitive abilities indirectly through intermediate phenotypes. In addition, the mediation model utilized in this article, although intuitive, might not be able to accommodate complex polygenic effects and gene–environment interactions. Therefore, a more general and adaptive mediation model is urgently needed, such that a comprehensive mechanism can be presented which integrates genetic, environmental, and intermediate phenotypical information.
Although several problems are not fully addressed, this article demonstrates the potential capability of utilizing mediation analysis to bridge the gap between genetic variations and pathological behaviors. Meanwhile, our promising results illustrate that imaging genetics serves as a very important tool to the understanding of cognitive abilities and psychiatric disorders.
Supporting information
Additional Supporting Information may be found in the online version of this article
Supporting Information
ACKNOWLEDGMENTS
We thank Chintan M. Mehta for providing useful information about genetic data analysis. We also greatly appreciate the time and effort that the participants and their families spent at the Philadelphia Neurodevelopmental Cohort. Support for the collection of the data sets was provided by NIH grant RC2MH089983 awarded to Raquel Gur and RC2MH089924 awarded to Hakon Hakonarson. All subjects were recruited through the Center for Applied Genomics at The Children's Hospital in Philadelphia. The data sets used in this manuscript were obtained from dbGaP at http://www.ncbi.nlm.nih.gov/projects/gap/cgi-bin/study.cgi?study_id=phs000607.v1.p1 through dbGaP accession: phs000607.v1.p1.
The authors declare that they have no conflicts of interest.
REFERENCES
- 1000 Genomes Project Consortium (2015): A global reference for human genetic variation. Nature 526:68–74. [DOI] [PMC free article] [PubMed] [Google Scholar]
- Baron RM, Kenny DA (1986): The moderator‐mediator variable distinction in social psychological research: Conceptual, strategic, and statistical considerations. J Pers Soc Psychol 51:1173–1182. [DOI] [PubMed] [Google Scholar]
- Belmonte MK, Cook E, Anderson GM, Rubenstein JL, Greenough WT, Beckel‐Mitchener A, Courchesne E, Boulanger LM, Powell SB, Levitt PR, Perry EK, Jiang YH, DeLorey TM, Tierney E (2004): Autism as a disorder of neural information processing: Directions for research and targets for therapy. Mol Psychiatry 9:646–663. [DOI] [PubMed] [Google Scholar]
- Bertram L, McQueen MB, Mullin K, Blacker D, Tanzi RE (2007): Systematic meta‐analyses of Alzheimer disease genetic association studies: The alzgene database. Nat Genet 39:17–23. [DOI] [PubMed] [Google Scholar]
- Davies G, Tenesa A, Payton A, Yang J, Harris SE, Liewald D, Ke X, Le Hellard S, Christoforou A, Luciano M, McGhee K, Lopez L, Gow AJ, Corley J, Redmond P, Fox HC, Haggarty P, Whalley LJ, McNeill G, Goddard ME, Espeseth T, Lundervold AJ, Reinvang I, Pickles A, Steen VM, Ollier W, Porteous DJ, Horan M, Starr JM, Pendleton N, Visscher PM, Deary IJ (2011): Genome‐wide association studies establish that human intelligence is highly heritable and polygenic. Mol Psychiatry 16:996–1005. [DOI] [PMC free article] [PubMed] [Google Scholar]
- Desikan RS, Ségonne F, Fischl B, Quinn BT, Dickerson BC, Blacker D, Buckner RL, Dale AM, Maguire RP, Hyman BT, Albert MS, Killiany RJ (2006): An automated labeling system for subdividing the human cerebral cortex on mri scans into gyral based regions of interest. Neuroimage 31:968–980. [DOI] [PubMed] [Google Scholar]
- Glahn DC, Paus T, Thompson PM (2007): Imaging genomics: Mapping the influence of genetics on brain structure and function. Hum Brain Mapp 28:461–463. [DOI] [PMC free article] [PubMed] [Google Scholar]
- Goldman D, Oroszi G, Ducci F (2005): The genetics of addictions: Uncovering the genes. Nat Rev Genet 6:521–532. [DOI] [PubMed] [Google Scholar]
- Gottesman II, Gould TD (2003): The endophenotype concept in psychiatry: Etymology and strategic intentions. Am J Psychiatry 160:636–645. [DOI] [PubMed] [Google Scholar]
- Gur RC, Richard J, Hughett P, Calkins ME, Macy L, Bilker WB, Brensinger C, Gur RE (2010): A cognitive neuroscience‐based computerized battery for efficient measurement of individual differences: standardization and initial construct validation. J Neurosci Meth 187:254–262. [DOI] [PMC free article] [PubMed] [Google Scholar]
- Gur RC, Richard J, Calkins ME, Chiavacci R, Hansen JA, Bilker WB, Loughead J, Connolly JJ, Qiu H, Mentch FD, Abou‐Sleiman PM, Hakonarson H, Gur RE (2012): Age group and sex differences in performance on a computerized neurocognitive battery in children age 8‐ 21. Neuropsychology 26:251. [DOI] [PMC free article] [PubMed] [Google Scholar]
- Hibar DP, Stein JL, Renteria ME, Arias‐Vasquez A, Desrivières S, Jahanshad N, Toro R, Wittfeld K, Abramovic L, Andersson M, Aribisala BS, Armstrong NJ, Bernard M, Bohlken MM, Boks MP, Bralten J, Brown AA, Chakravarty MM, Chen Q, Ching CR, Cuellar‐Partida G, den Braber A, Giddaluru S, Goldman AL, Grimm O, Guadalupe T, Hass J, Woldehawariat G, Holmes AJ, Hoogman M, Janowitz D, Jia T, Kim S, Klein M, Kraemer B, Lee PH, Olde Loohuis LM, Luciano M, Macare C, Mather KA, Mattheisen M, Milaneschi Y, Nho K, Papmeyer M, Ramasamy A, Risacher SL, Roiz‐Santiañez R, Rose EJ, Salami A, Sämann PG, Schmaal L, Schork AJ, Shin J, Strike LT, Teumer A, van Donkelaar MM, van Eijk KR, Walters RK, Westlye LT, Whelan CD, Winkler AM, Zwiers MP, Alhusaini S, Athanasiu L, Ehrlich S, Hakobjan MM, Hartberg CB, Haukvik UK, Heister AJ, Hoehn D, Kasperaviciute D, Liewald DC, Lopez LM, Makkinje RR, Matarin M, Naber MA, McKay DR, Needham M, Nugent AC, Pütz B, Royle NA, Shen L, Sprooten E, Trabzuni D, van der Marel SS, van Hulzen KJ, Walton E, Wolf C, Almasy L, Ames D, Arepalli S, Assareh AA, Bastin ME, Brodaty H, Bulayeva KB, Carless MA, Cichon S, Corvin A, Curran JE, Czisch M, de Zubicaray GI, Dillman A, Duggirala R, Dyer TD, Erk S, Fedko IO, Ferrucci L, Foroud TM, Fox PT, Fukunaga M, Gibbs JR, Göring HH, Green RC, Guelfi S, Hansell NK, Hartman CA, Hegenscheid K, Heinz A, Hernandez DG, Heslenfeld DJ, Hoekstra PJ, Holsboer F, Homuth G, Hottenga JJ, Ikeda M, Jack CR Jr, Jenkinson M, Johnson R, Kanai R, Keil M, Kent JW Jr, Kochunov P, Kwok JB, Lawrie SM, Liu X, Longo DL, McMahon KL, Meisenzahl E, Melle I, Mohnke S, Montgomery GW, Mostert JC, Mühleisen TW, Nalls MA, Nichols TE, Nilsson LG, Nöthen MM, Ohi K, Olvera RL, Perez‐Iglesias R, Pike GB, Potkin SG, Reinvang I, Reppermund S, Rietschel M, Romanczuk‐Seiferth N, Rosen GD, Rujescu D, Schnell K, Schofield PR, Smith C, Steen VM, Sussmann JE, Thalamuthu A, Toga AW, Traynor BJ, Troncoso J, Turner JA, Valdés Hernández MC, van 't Ent D, van der Brug M, van der Wee NJ, van Tol MJ, Veltman DJ, Wassink TH, Westman E, Zielke RH, Zonderman AB, Ashbrook DG, Hager R, Lu L, McMahon FJ, Morris DW, Williams RW, Brunner HG, Buckner RL, Buitelaar JK, Cahn W, Calhoun VD, Cavalleri GL, Crespo‐Facorro B, Dale AM, Davies GE, Delanty N, Depondt C, Djurovic S, Drevets WC, Espeseth T, Gollub RL, Ho BC, Hoffmann W, Hosten N, Kahn RS, Le Hellard S, Meyer‐Lindenberg A, Müller‐Myhsok B, Nauck M, Nyberg L, Pandolfo M, Penninx BW, Roffman JL, Sisodiya SM, Smoller JW, van Bokhoven H, van Haren NE, Völzke H, Walter H, Weiner MW, Wen W, White T, Agartz I, Andreassen OA, Blangero J, Boomsma DI, Brouwer RM, Cannon DM, Cookson MR, de Geus EJ, Deary IJ, Donohoe G, Fernández G, Fisher SE, Francks C, Glahn DC, Grabe HJ, Gruber O, Hardy J, Hashimoto R, Hulshoff Pol HE, Jönsson EG, Kloszewska I, Lovestone S, Mattay VS, Mecocci P, McDonald C, McIntosh AM, Ophoff RA, Paus T, Pausova Z, Ryten M, Sachdev PS, Saykin AJ, Simmons A, Singleton A, Soininen H, Wardlaw JM, Weale ME, Weinberger DR, Adams HH, Launer LJ, Seiler S, Schmidt R, Chauhan G, Satizabal CL, Becker JT, Yanek L, van der Lee SJ, Ebling M, Fischl B, Longstreth WT Jr, Greve D, Schmidt H, Nyquist P, Vinke LN, van Duijn CM, Xue L, Mazoyer B, Bis JC, Gudnason V, Seshadri S, Ikram MA; Alzheimer's Disease Neuroimaging Initiative ; CHARGE Consortium ; EPIGEN ; IMAGEN ; SYS , Martin NG, Wright MJ, Schumann G, Franke B, Thompson PM, Medland SE (2015): Common genetic variants influence human subcortical brain structures. Nature 520:224–229. [DOI] [PMC free article] [PubMed] [Google Scholar]
- Mehta CM, Gruen JR, Zhang H (2016): A method for integrating neuroimaging into genetic models of learning performance. Genet Epidemiol 41:4–17. [DOI] [PMC free article] [PubMed] [Google Scholar]
- Meyer‐Lindenberg A, Weinberger DR (2006): Intermediate phenotypes and genetic mechanisms of psychiatric disorders. Nat Rev Neurosci 7:818–827. [DOI] [PubMed] [Google Scholar]
- Meyer‐Lindenberg A, Kohn PD, Kolachana B, Kippenhan S, McInerney‐Leo A, Nussbaum R, Weinberger DR, Berman KF (2005): Midbrain dopamine and prefrontal function in humans: Interaction and modulation by comt genotype. Nat Neurosci 8:594–596. [DOI] [PubMed] [Google Scholar]
- Pezawas L, Meyer‐Lindenberg A, Drabant EM, Verchinski BA, Munoz KE, Kolachana BS, Egan MF, Mattay VS, Hariri AR, Weinberger DR (2005): 5‐HTTLPR polymorphism impacts human cingulate‐amygdala interactions: A genetic susceptibility mechanism for depression. Nat Neurosci 8:828–834. [DOI] [PubMed] [Google Scholar]
- Plomin R, Haworth CMA, Meaburn EL, Price TS, Wellcome Trust Case Control Consortium 2, Davis OSP (2013): Common DNA markers can account for more than half of the genetic influence on cognitive abilities. Psychol Sci 562–568. [DOI] [PMC free article] [PubMed] [Google Scholar]
- Potkin SG, Guffanti G, Lakatos A, Turner JA, Kruggel F, Fallon JH, Saykin AJ, Orro A, Lupoli S, Salvi E, Weiner M, Macciardi F; Alzheimer's Disease Neuroimaging Initiative (2009): Hippocampal atrophy as a quantitative trait in a genome‐wide association study identifying novel susceptibility genes for Alzheimer disease. PloS One 4:e6501. [DOI] [PMC free article] [PubMed] [Google Scholar]
- Price AL, Patterson NJ, Plenge RM, Weinblatt ME, Shadick NA, Reich D (2006): Principal components analysis corrects for stratification in genome‐wide association studies. Nat Genet 38:904–909. [DOI] [PubMed] [Google Scholar]
- Risacher SL, Saykin AJ, Wes JD, Shen L, Firpi HA, McDonald BC (2009): Baseline MRI predictors of conversion from MCI to probable AD in the ADNI cohort. Curr Alzheim Res 6:347–361. [DOI] [PMC free article] [PubMed] [Google Scholar]
- Shen L, Kim S, Risacher SL, Nho K, Swaminathan S, West JD, Foroud T, Pankratz N, Moore JH, Sloan CD, Huentelman MJ, Craig DW, Dechairo BM, Potkin SG, Jack CR Jr, Weiner MW, Saykin AJ; Alzheimer's Disease Neuroimaging Initiative (2010): Whole genome association study of brain‐wide imaging phenotypes for identifying quantitative trait loci in MCI and AD: A study of the ADNI cohort. Neuroimage 53:1051–1063. [DOI] [PMC free article] [PubMed] [Google Scholar]
- Thode HC (2002): Testing for Normality. Boca Raton: CRC Press. [Google Scholar]
- Walczak‐Sztulpa J, Eggenschwiler J, Osborn D, Brown DA, Emma F, Klingenberg C, Hennekam RC, Torre G, Garshasbi M, Tzschach A, Szczepanska M, Krawczynski M, Zachwieja J, Zwolinska D, Beales PL, Ropers HH, Latos‐Bielenska A, Kuss AW (2010): Cranioectodermal dysplasia, sensenbrenner syndrome, is a ciliopathy caused by mutations in the IFT122 gene. Am J Hum Genet 86:949–956. [DOI] [PMC free article] [PubMed] [Google Scholar]
- Weinberger DR, Egan MF, Bertolino A, Callicott JH, Mattay VS, Lipska BK, Berman KF, Goldberg TE (2001): Prefrontal neurons and the genetics of schizophrenia. Biol Psychiatry 50:825–844. [DOI] [PubMed] [Google Scholar]
- Wilkinson GS, Robertson GJ (2006): Wide range achievement test (WRAT4). Psychological Assessment Resources, Lutz.
Associated Data
This section collects any data citations, data availability statements, or supplementary materials included in this article.
Supplementary Materials
Additional Supporting Information may be found in the online version of this article
Supporting Information