

The pathway consisting of the receptor programmed cell death 1 (PD-1; also called CD279) and its ligands, PD-L1 (B7-H1 or CD274) and PD-L2 (B7-DC or CD273), plays a vital role in the maintenance of peripheral tolerance (i.e., mechanisms that maintain the quiescence of autoreactive T cells that have already matured and escaped the mechanisms of central tolerance during development in the thymus). Tumors and pathogens that cause chronic infections can exploit this pathway to escape T-cell–mediated tumor-specific and pathogen-specific immunity. Therapies with antibodies targeting PD-1 and its ligands have been shown to be associated with remarkable response rates in various cancers and, together with antibodies targeting CTLA-4, have revolutionized cancer treatment. (See the Supplementary Appendix, available with the full text of this article at NEJM.org, for a list of the protein abbreviations used in this review.) In addition to the clinical success, ongoing work is currently revealing the molecular mechanisms targeted by PD-1. Here, I provide a brief overview of the molecular and biochemical events that are regulated by PD-1 ligation and their implications for mechanisms intrinsic and extrinsic to the cell that determine the fate and function of T cells.
IMMUNE CHECKPOINT BLOCKADE AS CANCER THERAPY
The development of blocking antibodies against the immune checkpoints as cancer therapies is based on the natural role of these checkpoint molecules as coinhibitory receptors of T-cell activation. Our knowledge about costimulatory and coinhibitory receptors has evolved from the two-signal model for the activation of naive T cells.1 According to this model, optimal activation of antigen-specific lymphocytes requires specific antigen recognition by lymphocytes (“signal 1”), as well as an additional signal (“signal 2,” or the costimulatory signal). Later, it was understood that negative costimulatory (i.e., coinhibitory) signals also exist. Receptors delivering coinhibitory signals function as immune checkpoints and have a decisive role in the maintenance of peripheral tolerance and the prevention of autoimmunity.2–5 The pathway involving either B7–1 or B7–2 plus either CD28 or CTLA-4 is the best-characterized costimulatory pathway and is crucial in T-cell activation and tolerance (Fig. 1A). The identification of the PD-1 inhibitory receptor and its ligands as additional members of the B7–CD28–CTLA-4 family6,7 revealed that the immune system has developed several coinhibitory pathways to safeguard the maintenance of T-cell tolerance by this molecular family.
Figure 1. B7–CD28–CTLA-4 Costimulatory Molecules and the Structure of Programmed Cell Death 1 (PD-1).
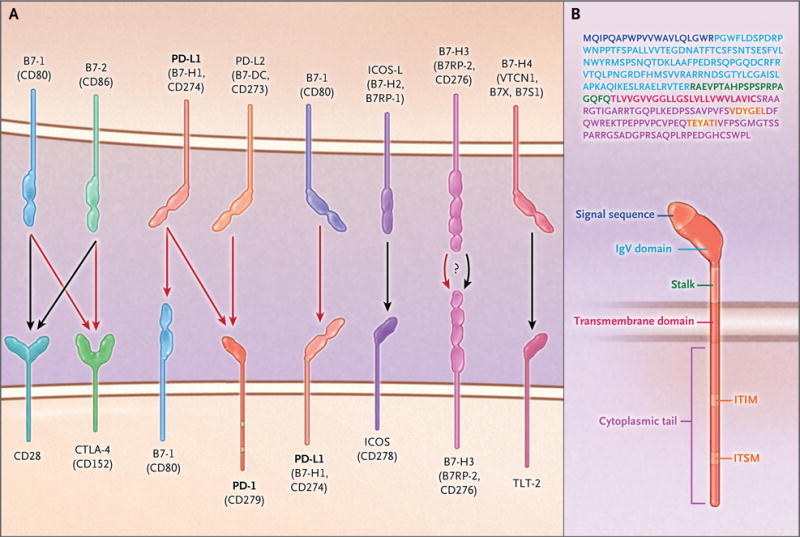
Panel A shows members of the B7–CD28–CTLA-4 family of costimulatory molecules. Black arrows indicate stimulatory signals, and red arrows indicate inhibitory signals. The receptors for B7-H3 and B7-H4 and their effects remain unclear. PD-L2 that is expressed on lung dendritic cells interacts with repulsive guidance molecule B, a coreceptor for bone morphogenetic proteins, expressed on alveolar macrophages, interstitial macrophages, and alveolar epithelial cells (not shown). Panel B shows the amino acid sequence and structure of human PD-1. The signal sequence is shown in purple, the immunoglobulin variable region (IgV)–like domain in light blue, the transmembrane segment in red, and the immunoreceptor tyrosine-based inhibition motif (ITIM) and immunoreceptor tyrosine-based switch motif (ITSM) in orange; the tyrosines within the ITIM and ITSM are highlighted in yellow. See the Supplementary Appendix, available with the full text of this article at NEJM.org, for a list of the protein abbreviations used in this review.
Since the early days after its discovery, costimulation was considered to be of therapeutic interest in cancer therapy because the augmentation of costimulatory signals could provide a means to enhance antitumor immune responses.8 However, it was the discovery that CTLA-4 functions as a potent negative regulator of immune responses2,3 that led to a radical shift in cancer immunotherapy, based on the concept that the preferred approach would not be the activation of the immune system to attack cancer but rather the removal of the coinhibitory signals that block antitumor T-cell responses.9 Indeed, blockade of CTLA-4 was found to promote antitumor immune responses in mouse models,10 which led to the successful use of an anti–CTLA-4 monoclonal antibody (ipilimumab) as cancer therapy in human patients.11 Subsequently, on the basis of the same concept, the PD-1–PD-L1 coinhibitory pathway was exploited therapeutically, which resulted in remarkable outcomes, with response rates of 20 to 50% in multiple clinical trials and for various types of cancer.12
EXPRESSION OF PD-1 AND ITS LIGANDS
PD-1 is a 288–amino acid protein that is induced on T cells on activation through the T-cell antigen receptor and through cytokine receptors.13 PD-1 was initially identified as being preferentially expressed in apoptotic cells,14 but it was later understood that its physiological role is not related to cell death. In addition to being expressed in activated mature T cells, PD-1 is expressed at low levels on double-negative (CD4−CD8−) T cells in the thymus, activated natural killer T cells, B cells, monocytes, and immature Langerhans’ cells.13 The functional and biochemical properties of PD-1 have been best studied in T cells. Transcription of PD-1 in T cells requires nuclear translocation of NFAT and binding of NFATc1 (NFAT2) to the PDCD1 promoter.15 FOXO1, Notch, and IRF9 also promote PD-1 transcription, whereas T-bet functions as a transcriptional repressor.16–19 Thus, both the induction and the repression of PD-1 are under the control of active mechanisms, which indicates that PD-1 mediates its effects on activated T cells within a finite window of time. This kinetics of expression indicates that up-regulation of PD-1 is a natural consequence of T-cell activation and is necessary for the termination of the immune response. Thus, PD-1 expression is not synonymous with the state of “exhaustion,” a condition that occurs when T cells are exposed to prolonged stimulation with antigen. In exhausted cells, levels of expression of not only PD-1 but other inhibitory receptors — which, like PD-1, are induced during T-cell activation — are persistently elevated, which leads to a profound inability of T cells to respond to activation signals.20
PD-L1 and PD-L2, the ligands for PD-1, have distinct patterns of expression.13,21 PD-L1 is constitutively expressed at low levels on antigen-presenting cells (APCs), including both professional APCs (i.e., those that express major histocompatibility complex [MHC] class I and II and costimulatory molecules and can activate naive CD4+ T cells) and nonprofessional APCs (i.e., those that use MHC class I molecules to interact with CD8+ T cells but do not normally express MHC class II and therefore do not activate naive CD4+ T cells efficiently), as well as on a wide variety of nonhematopoietic cell types, including vascular endothelial cells, pancreatic islet cells, and cells in sites of immune privilege, such as the placenta, testes, and eye. PD-L1 expression is also induced by proinflammatory cytokines, including type I and type II interferons, tumor necrosis factor α (TNF-α), and VEGF. PD-L2 is expressed on dendritic cells and macrophages after activation and is up-regulated mainly by the same cytokines as PD-L1. The kinetics of PD-1 expression on activated T cells, the constitutive expression of PD-L1 on tissues, and the induction of PD-1 ligands by proinflammatory signals underline the role of the PD-1 pathway in suppressing the activity of effector T cells, whereby it maintains self-tolerance and promotes the resolution of inflammation during immune responses. In addition to interacting with PD-1, PD-L1 also interacts with B7–1 expressed on T cells and mediates an inhibitory signal,22 whereas PD-L2 expressed on lung dendritic cells interacts with repulsive guidance molecule B (RGMB), a coreceptor for bone morphogenetic proteins that is expressed on alveolar macrophages, interstitial macrophages, and alveolar epithelial cells. The interaction of PD-L2 with RGMB plays a role in pulmonary tolerance.23
The role of PD-1 in peripheral tolerance was first noted when lupuslike glomerulonephritis and arthritis developed in aged, PD-1–deficient mice of the C57BL/6 strain.4 PD-1 deficiency in mice of the BALB/C strain results in dilated cardiomyopathy,5 whereas in mice of other genetic backgrounds it has been found to result in organ-specific autoimmunity, the specific type of which depends on the type of autoimmunity to which each mouse strain is prone.24,25 PD-L1 — and to a lesser extent, PD-L2 — is also expressed in several cancers,7,26 a finding that triggered the therapeutic exploitation of the PD-1–PD-L1 pathway in cancer immunotherapy. In contrast to its beneficial effects in maintaining peripheral tolerance, the suppression of antitumor immune responses by PD-1 has detrimental effects on protection against tumors.27 Similarly, in chronic viral infections, expression of PD-1 by virus-specific T cells prevents T-cell expansion and function and the clearance of the virus.28
PD-1 STRUCTURE AND ITS IMPLICATIONS FOR INHIBITION OF T-CELL RESPONSES
PD-1 consists of a single N-terminal immunoglobulin variable region (IgV)–like domain, a stalk consisting of approximately 20 amino acids that separates the IgV domain from the plasma membrane, a transmembrane domain, and a cytoplasmic tail containing tyrosine-based signaling motifs (Fig. 1B; an interactive graphic related to the figures in this review is available at NEJM.org). PD-1 is considered to be a member of the CD28 superfamily and has 15% amino acid identity with CD28, 20% identity with CTLA-4, and 13% identity with inducible T-cell costimulator (ICOS). However, PD-1 has distinct molecular features that distance it from the classical members of the CD28 family.29 CD28, CTLA-4, and ICOS have SH2-binding motifs (YxxM, in which × denotes any amino acid) located in the center of their cytoplasmic tails. CTLA-4 and CD28 also have one and two SH3-binding motifs (PxxP), respectively, in their cytoplasmic tails. No SH2-binding or SH3-binding motifs are present in the cytoplasmic tail of PD-1, which instead contains the N-terminal sequence VDYGEL; this sequence forms an immunoreceptor tyrosine-based inhibition motif (ITIM), defined as V/I/LxYxxL, which is known to recruit SH2 domain–containing phosphatases.30 The cytoplasmic tail of PD-1 also contains the C-terminal sequence TEYATI, which forms an immunoreceptor tyrosine-based switch motif (ITSM), defined as TxYxxL.
The role of the tyrosines in the cytoplasmic tail of PD-1 in T cells has been studied with the use of a chimeric CD28.PD-1 construct, in which the extracellular domain of mouse CD28 was fused to the cytoplasmic tail of human PD-1.31 Triggering of PD-1–mediated signals inhibited PI3K–Akt activation and suppressed interleukin-2 production. These inhibitory effects were preserved when the ITIM tyrosine was changed to phenylalanine (Y223F) but were lost when the ITSM tyrosine was changed (Y248F). The Y248 was found to interact with SHP-1 and SHP-2. The role of the interaction between the PD-1 Y248 and SHP-2 in mediating inhibition has also been identified in B cells, in which PD-1 engagement inhibits B-cell receptor–mediated mobilization of calcium ions and phosphorylation of Igβ, Syk, PLC-γ2, ERK1, and ERK2.32 Mass spectrometry studies have shown that a phosphorylated peptide corresponding to the ITSM of PD-1 could serve as a docking site of SHP-2.33 Although both SHP-1 and SHP-2 were found to interact with ITSM in these two systems,31,33 live-cell imaging to visualize events that occur during T-cell activation in real time revealed that only SHP-2 interacts with PD-1 in live cells.34 These studies showed that during T-cell activation, PD-1 is translocated to dynamic T-cell receptor microclusters and accumulates at the signaling central supramolecular activation cluster (c-SMAC). SHP-2 is recruited to PD-1 in the microclusters, and this event is correlated with dephosphorylation of T-cell receptor proximal signaling molecules.34
EFFECTS OF PD-1 ON T-CELL RECEPTOR–MEDIATED SIGNALING
The mechanism by which PD-1 antagonizes T-cell receptor signaling is a subject of intense investigation. By recruiting SHP-2 in proximity to the T-cell receptor, PD-1 ligation inhibits the activation of T-cell receptor proximal kinases, resulting in attenuation of Lck-mediated phosphorylation of ZAP-70 and initiation of downstream events33 (Fig. 2A). A key signaling target of PD-1–mediated inhibition is the PI3K–Akt pathway35,36 (Fig. 2B). Although PI3K–Akt is also a target of CTLA-4, the mechanisms of inhibition induced by these two checkpoint inhibitors appear to be distinct. PD-1 can block activation of PI3K by recruiting SHP-2, whereas CTLA-4 directly inhibits activation of Akt but not of PI3K, possibly by association with protein phosphatase 2A.36 One mechanism by which PD-1 inhibits the activation of PI3K–Akt involves the targeting of PTEN phosphorylation and phosphatase activity, which are mediated by CK2. PTEN is a serine–threonine phosphatase that opposes the activation of PI3K and suppresses the signals delivered by the PI3K–Akt pathway. CK2 mediates phosphorylation of the PTEN C-terminal serine–threonine cluster S380–T382–T383, which promotes PTEN stability while reducing PTEN lipid phosphatase activity.37,38 During T-cell activation, PTEN is phosphorylated by CK2 in the S380–T382–T383 cluster within the C-terminal regulatory domain.39 This phosphorylation stabilizes PTEN, resulting in increased protein abundance due to resistance to ubiquitin-dependent degradation, but it suppresses PTEN phosphatase activity. PD-1 inhibits the stabilizing phosphorylation of the S380–T382–T383 cluster within the C-terminal domain of PTEN, thereby resulting in diminished PTEN abundance but increased PTEN phosphatase activity (Fig. 2B).
Figure 2. Effects of PD-1 on Major Signaling Pathways in T Cells.

During T-cell receptor (TCR) crosslinking with antigen presented by major histocompatibility complex class II (MHCII) molecules (in CD4+ T cells) or class I molecules (in CD8+ T cells), the tyrosines of the cytoplasmic tail of PD-1 become phosphorylated (P). SHP-2 (and possibly SHP-1) is recruited to the ITSM, and an as-yet-unidentified partner is recruited to the ITIM. As a consequence, phosphorylation of TCR proximal signaling molecules, including Lck and ZAP-70, is impaired (Panel A). Activation of the PI3K–Akt–mTOR pathway (Panel B) and activation of the Ras–MEK–ERK pathway (Panel C) are inhibited. In contrast, other signaling events, such as the activation of the p38 pathway, remain unaffected or enhanced (e.g., BATF is up-regulated) (Panel D). The imbalanced activation of signaling pathways alters cell-cycle progression, gene transcription, metabolism, and epigenetic programs in T cells. Black arrows indicate activation signals, and red blocked arrows indicate inhibited signals.
The second major signaling pathway targeted by PD-1 is the Ras–MEK–ERK pathway33,35 (Fig. 2C). The major mechanism responsible for the activation of Ras and its downstream MEK–ERK MAP kinase pathway in T cells involves the activation of RasGRP1, which is activated by calcium and diacylglycerol downstream of PLC-γ1.40 PD-1 impairs the activation of the MEK–ERK MAP kinase pathway by inhibiting activation of PLC-γ1 and Ras.35 By altering Ras–MEK–ERK activation, PD-1 is likely to influence a plethora of downstream biochemical targets that are regulated by this pathway. It should be noted that PD-1 does not cause a global signal inhibition. For example, PD-1 does not inhibit p38 MAP kinase activation,35 and it induces expression of certain transcription factors, including BATF41 (Fig. 2D). T-cell functions are differentially sensitive to PD-1, which is consistent with a differential effect of PD-1 on signal-transduction pathways. High levels of PD-1 expression and ligation are required to inhibit Mib-1b production, lower levels are required to block cytotoxicity and interferon-γ production, and very low levels are required to inhibit production of TNF-α and interleukin-2 as well as to inhibit T-cell expansion.42
The altered T-cell receptor–mediated signaling events induced by PD-1 are correlated with altered dynamics of contact interactions between T cells and antigen-bearing dendritic cells. During the process of T-cell activation in vivo, the duration of T cell–dendritic cell contacts is highly variable, ranging from minutes to several hours, and can be divided into three distinct phases. During phase I (approximately 8 hours), T cells are highly migratory, making many contacts with dendritic cells. During phase II (8 to 20 hours), T cells form stable contacts with dendritic cells and begin to secrete cytokines. During phase III, which lasts for the subsequent 24 hours, T cells dissociate from dendritic cells and begin to proliferate.43 T cells that are unable to activate the stop signal but remain migratory instead of engaging in stable interactions with dendritic cells become anergic. In a model of diabetes in which islet-specific T-cell receptor–transgenic T cells stimulated with an islet antigen peptide-mimic lose the natural stop signal and become anergic, PD-1–PD-L1 blockade restores stable T cell–dendritic cell contacts and prevents induction of anergy.44 Similarly, in a model of delayed-type hypersensitivity in the skin, PD-1–PD-L1 blockade prolongs the interactions between T cells and antigen-bearing APCs.45 These studies suggest that PD-1 prevents the formation of stable T cell–dendritic cell contacts and thereby contributes to the cessation of effector function development. It is noteworthy that conversely to these findings, in a model of lymphocytic choriomeningitis virus infection — in which PD-1 is highly expressed in exhausted T cells — blocking of PD-1 during the first week of infection was found to cause more rapid detachment and migration of T cells away from antigen-bearing APCs.46 Because in this model PD-1 blockade reverses the exhaustion phenotype of pathogen-specific T cells, these findings suggest that interrupting the persistent antigen-mediated signaling prevents or reverses T-cell exhaustion. Although these findings seem to conflict with the two above-mentioned reports,44,45 it is likely that these experimental models reflect the role of the PD-1–PD-L1 pathway at different phases of T-cell migratory dynamics and reveal the multiple levels at which this pathway can affect the immune response.
ALTERATION OF METABOLISM BY PD-1
Metabolic reprogramming has a major effect on T-cell differentiation and function.47 Naive T cells have a metabolically quiescent phenotype and generate energy by using glucose, fatty acids, and amino acids to fuel oxidative phosphorylation, a process that requires oxygen consumption. On activation, T cells undergo metabolic reprogramming, and although oxidative phosphorylation persists and increases, aerobic glycolysis becomes the dominant metabolic program. Glutamine uptake and catabolism is also augmented and is required for the fitness of effector T cells and for the development of memory T cells. PD-1 suppresses oxygen consumption and impairs the ability of activated T cells to engage in glycolysis and glutaminolysis, but it promotes the utilization of fatty acids in beta-oxidation.48 Also, when T cells are stimulated with PD-1 ligation, there is a substantial accumulation of polyunsaturated fatty acids (Fig. 3A), which are recognized suppressors of T-cell immunity.49 Thus, PD-1 may alter T-cell differentiation by restraining T cells from remodeling their metabolism properly.
Figure 3. Alteration of Metabolism by the PD-1 Checkpoint Pathway.

Ligation of PD-1 that is expressed in activated T cells by PD-L1 expressed on antigen-presenting cells, nonhematopoietic parenchymal cells, or tumors alters T-cell metabolic reprogramming by inhibiting glycolysis, amino acid metabolism, and mitochondrial metabolism and promoting the accumulation of polyunsaturated fatty acids (PUFA) and activation of fatty acid oxidation (Panel A). By restraining T cells from remodeling their metabolism properly, PD-1 may alter T-cell differentiation, leading to impaired differentiation of T effector cells (TEFF) and T memory cells (TM) and enhanced differentiation of T regulatory cells (Treg) and T exhausted cells (TEX). PD-L1 functions as an inhibitory receptor to transmit antiapoptotic signals to cancer cells (Panel B). Because cancer cells are highly glycolytic and have enhanced activation of the PI3K–Akt pathway, expression of PD-L1 might result in increased levels of PI3K–Akt–mTOR activation and an elevated rate of tumor-intrinsic glycolysis as a consequence of improved survival.
As a consequence of these metabolic alterations, activated T cells receiving PD-1 signals seem to have a more oxidative environment, as indicated by a pronounced decrease in the levels of the key antioxidant reduced glutathione.48 After allogeneic bone marrow transplantation, alloreactive T cells simultaneously up-regulate expression of PD-1 and production of reactive oxygen species derived from fatty acid oxidation, and they become more sensitive to metabolic inhibition by F1F0–ATP synthase complex inhibitors; these findings are consistent with a role of PD-1 in creating an oxidative environment.50 Thus, the effects of PD-1 on T-cell metabolism may have therapeutic implications. These metabolic changes may also have an active role in PD-1–mediated T-cell dysfunction during chronic infections and cancer.
Although signaling, metabolic effects, and functional effects that are mediated by PD-1–PD-L1/L2 are known mainly as being directed toward T cells, it was reported that in a sarcoma tumor model, the expression of PD-L1 on cancer cells was associated with cell-intrinsic signaling through the PI3K–Akt pathway and mTOR, which leads to expression of glycolysis genes and enhanced glycolytic metabolism.51 Currently, it is unclear whether PD-L1 can trigger reverse signals (i.e., signaling from PD-1 toward PD-L1) to tumor cells, because PD-L1 has only a short cytoplasmic tail without obvious signaling motifs. However, PD-L1 functions as an inhibitory receptor to transmit antiapoptotic signals to cancer cells and to prevent immune-mediated distraction of cancer cells and Fas-mediated killing.52 Be cause cancer cells are highly glycolytic and have enhanced activation of the PI3K–Akt pathway, expression of PD-L1 might result in increased levels of PI3K–Akt activation and an elevated rate of tumor-intrinsic glycolysis as a consequence of improved survival (Fig. 3B).
CLINICAL IMPLICATIONS OF BIOLOGIC ASPECTS OF PD-1–PD-L1/L2 FOR CANCER THERAPY
A key mechanism by which cancer limits the host immune response is the up-regulation of PD-1 ligands in the tumor microenvironment and their ligation to PD-1 on tumor-specific CD8+ T cells. The expression of PD-1 ligands on tumor cells can be mediated through various mechanisms (Fig. 4). Aberrations of signaling pathways induced by oncogenic events, such as activation of EGFR, MAPK, or PI3K–Akt pathways,53 and elevated expression of STAT3 and HIF-1 transcription factors54,55 can up-regulate PD-L1 in various cancer types through transcriptional or post-transcriptional mechanisms. Amplification of 9p24.1 increases the gene dosage of PD-L1 and PD-L2 together with JAK2 in nodular sclerosing Hodgkin’s lymphoma and primary mediastinal large B-cell lymphoma.56 Epstein–Barr virus (EBV)–positive gastric and nasopharyngeal cancers without amplification of 9p24.1 express PD-L1, which suggests that EBV drives the expression of PD-L1.57,58 Levels of PD-L1 expression in cancer cells are also regulated by epigenetic mechanisms through microRNAs and have an inverse correlation with the microRNAs miR-34a, miR-200, miR-513, and miR-570.59
Figure 4. Inhibition of Tumor-Specific T-cell Function by the Expression of PD-1 and Its Ligands in the Tumor Microenvironment.

In the tumor microenvironment, T cells that are capable of recognizing tumor neoantigens produce interferon-γ, which can induce the expression of PD-1 ligands on cancer cells and immune cell types, including macrophages, stromal cells, and dendritic cells, which become myeloid suppressor cells. The expression of PD-1 ligands on cancer cells is also mediated by cell-intrinsic mechanisms that are activated by oncogenic events, which result in altered activation of signaling pathways and altered gene-expression programs through transcriptional and epigenetic mechanisms. The term pMHC denotes peptide plus MHC (i.e., MHC of either class I or class II).
In the tumor microenvironment, PD-L1 and PD-L2 can also be induced by inflammatory cytokines, among which interferon-γ is the most potent. These inflammatory mediators can induce expression of PD-L1 and PD-L2 on cancer cells but also on other cell types in the tumor microenvironment, including macrophages, dendritic cells, and stromal cells.60 Tumor-infiltrating T cells that are capable of recognizing tumor antigens are the producers of interferon-γ, which suggests that tumor-mediated immune responses initiate a pathway for immune suppression by mediating the expression of PD-L1 and PD-L2. This mechanism, termed “adaptive immune resistance,” is a process by which cancer cells protect themselves from attack by the immune system. Because PD-1 is expressed on T cells after activation, the PD-1–PD-L1/L2 inhibitory mechanism is engaged after T cells have recognized tumor antigens and have mounted tumor-specific responses, leading to selective suppression of tumor-specific T cells (Fig. 4). Under these conditions, therapeutic targeting of the PD-1 checkpoint pathway results in an expansion of oligoclonal populations of tumor-infiltrating CD8+ T cells, which recognize the tumor neoantigens generated by somatic nonsynonymous mutations in the tumor.61
A key mechanistic question in PD-1 biology that has direct clinical implications involves the factors that govern antitumor responses to PD-1–based immunotherapy. In biopsy specimens from patients with metastatic melanoma who had a response to treatment with anti–PD-1 blocking antibody, PD-1+CD8+ T cells were identified at the invasive tumor margin before therapy and progressively increased in number during treatment, and this increase was correlated with a reduction in tumor size. These PD-1+CD8+ T cells have an oligoclonal T-cell receptor repertoire and increased interferon-γ–mediated signaling, as determined by measuring the expression of pSTAT1.62 These findings are consistent with the conclusion that tumor-specific PD-1+CD8+ T cells are halted by PD-1–mediated inhibition and are unleashed by PD-1 blockade. Treatment with anti–PD-1 blocking antibody selectively increases the number of CD8+ memory T cells in the tumor microenvironment, a finding that is also consistent with this conclusion.63 It is noteworthy that the response to PD-1 therapeutic blockade requires the presence of both PD-1+CD8+ T cells and PD-L1–expressing cells in the tumor microenvironment. In sequential biopsy specimens from patients with various cancers who were treated with an anti–PD-L1 antibody, a gene signature of an activated effector T cell was correlated with therapeutic response, whereas a lack of an effector T-cell signature, lack of tumor-infiltrating immune cells, and minimal or no PD-L1 expression on the intratumoral immune infiltrate were correlated with treatment failure and with disease progression.64 These findings indicate that immunosuppression mediated by PD-1–PD-L1 is a local immunosuppression mechanism and that although anti–PD-1 blockade is administered systemically, its action is induced locally in cancer tissues.
Because the PD-1 checkpoint pathway has an important role in the maintenance of self tolerance, therapeutic targeting of this pathway can lead to imbalances in immunologic tolerance that result in unchecked immune responses. Such responses may clinically manifest with autoimmune-like or inflammatory side effects, termed “immune-related adverse events,” which cause damage to tissues and organs that are normally protected from autoimmune distraction. These immune-related adverse events may result in mucocutaneous, pulmonary, endocrine, and renal toxicity, as well as in damage to immune-privileged organs such as the eye.65 Some manifestations, such as renal or endocrine toxic effects and cardiomyopathy, resemble the autoimmune presentations observed in PD-1–deficient mice or in association with experimental targeting of the pathway.4,5,24 Knowledge of the toxic effects associated with PD-1–PD-L1/L2 blockade, as well as effective algorithms for the management of these toxic effects, will be pivotal in order to optimize the efficacy and safety of checkpoint-inhibitor immunotherapy.
MOLECULAR DETERMINANTS OF ANTITUMOR RESPONSES TO CHECKPOINT IMMUNOTHERAPY
During the past 3 years, substantial progress has been made in our knowledge about the identity of antigens that are expressed in tumors and that function as targets for T cells activated by checkpoint-inhibitor immunotherapy. Whole-genome sequencing has revealed that every tumor contains hundreds to thousands of somatic nonsynonymous mutations, which are accumulated throughout life.66 This mutational landscape of cancers is a key determinant that influences responses to checkpoint immunotherapy. With the use of genomics and bioinformatics approaches, it has been determined that such somatic tumor-specific mutations generate altered proteins that act as new antigens, named “neoantigens,” that form a major class of T-cell targets after checkpoint inhibitor blockade. The generation of neoantigens has been observed in tumor-bearing mice,67 as well as in patients treated with anti–CTLA-4 or anti–PD-1 antibodies.61,68 Neoantigen-specific T cells are present in progressively growing tumors but are unable to mediate effective antitumor responses. After treatment with checkpoint inhibitor blockade, neoantigen-specific T cells are reactivated and are capable of mediating tumor-specific immune responses and tumor rejection.61,67,68 The increased burden of nonsynonymous mutations and neoantigens in tumors is associated with improved efficacy, durable clinical benefit, and progression-free survival in patients treated with checkpoint blockade immunotherapy. These findings strongly suggest that the genomic landscape of cancers shapes the responses to anti–PD-1 therapy and explain the heterogeneity of outcomes observed among patients who have received similar treatment.
CONCLUSIONS
PD-1, which was initially considered to be a molecule that regulates cell death, has now been identified as a key checkpoint inhibitory receptor that alters the function of T cells after antigen-mediated stimulation. The imbalanced activation of signaling pathways induced by PD-1 ligation results in altered metabolic programs, differentiation profiles, and functional properties of T cells, with a net outcome of T-cell quiescence and immune suppression by cell-intrinsic and cell-extrinsic mechanisms. Evolving knowledge of the biochemical and signaling effects induced by PD-1 is shedding light on the molecular mechanisms responsible for PD-1–mediated hyporesponsiveness in patients with chronic infections and cancer. It may also reveal the reasons for the variable outcomes of therapeutic targeting of the PD-1 checkpoint for cancer immunotherapy and may aid in the identification of biomarkers to quantify responses and assess the efficacy of treatment. Further understanding of such biochemical events will also provide insight into the mechanisms responsible for the impairment of tolerance in patients with autoimmune diseases. Ultimately, such knowledge will guide the design of combination therapies to modulate PD-1 and its downstream targets, with the goal of improving immunity in chronic infections and cancer and inducing therapeutic tolerance in autoimmune diseases and allogeneic transplantation.
Supplementary Material
Footnotes
References
- 1.Bretscher PA. A two-step, two-signal model for the primary activation of precursor helper T cells. Proc Natl Acad Sci U S A. 1999;96:185–90. doi: 10.1073/pnas.96.1.185. [DOI] [PMC free article] [PubMed] [Google Scholar]
- 2.Tivol EA, Borriello F, Schweitzer AN, Lynch WP, Bluestone JA, Sharpe AH. Loss of CTLA-4 leads to massive lymphoproliferation and fatal multiorgan tissue destruction, revealing a critical negative regulatory role of CTLA-4. Immunity. 1995;3:541–7. doi: 10.1016/1074-7613(95)90125-6. [DOI] [PubMed] [Google Scholar]
- 3.Waterhouse P, Penninger JM, Timms E, et al. Lymphoproliferative disorders with early lethality in mice deficient in Ctla-4. Science. 1995;270:985–8. doi: 10.1126/science.270.5238.985. [DOI] [PubMed] [Google Scholar]
- 4.Nishimura H, Nose M, Hiai H, Minato N, Honjo T. Development of lupus-like autoimmune diseases by disruption of the PD-1 gene encoding an ITIM motif-carrying immunoreceptor. Immunity. 1999;11:141–51. doi: 10.1016/s1074-7613(00)80089-8. [DOI] [PubMed] [Google Scholar]
- 5.Nishimura H, Okazaki T, Tanaka Y, et al. Autoimmune dilated cardiomyopathy in PD-1 receptor-deficient mice. Science. 2001;291:319–22. doi: 10.1126/science.291.5502.319. [DOI] [PubMed] [Google Scholar]
- 6.Freeman GJ, Long AJ, Iwai Y, et al. Engagement of the PD-1 immunoinhibitory receptor by a novel B7 family member leads to negative regulation of lymphocyte activation. J Exp Med. 2000;192:1027–34. doi: 10.1084/jem.192.7.1027. [DOI] [PMC free article] [PubMed] [Google Scholar]
- 7.Latchman Y, Wood CR, Chernova T, et al. PD-L2 is a second ligand for PD-1 and inhibits T cell activation. Nat Immunol. 2001;2:261–8. doi: 10.1038/85330. [DOI] [PubMed] [Google Scholar]
- 8.Chen L, Linsley PS, Hellström KE. Costimulation of T cells for tumor immunity. Immunol Today. 1993;14:483–6. doi: 10.1016/0167-5699(93)90262-J. [DOI] [PubMed] [Google Scholar]
- 9.Allison JP, Hurwitz AA, Leach DR. Manipulation of costimulatory signals to enhance antitumor T-cell responses. Curr Opin Immunol. 1995;7:682–6. doi: 10.1016/0952-7915(95)80077-8. [DOI] [PubMed] [Google Scholar]
- 10.Leach DR, Krummel MF, Allison JP. Enhancement of antitumor immunity by CTLA-4 blockade. Science. 1996;271:1734–6. doi: 10.1126/science.271.5256.1734. [DOI] [PubMed] [Google Scholar]
- 11.Hodi FS, O’Day SJ, McDermott DF, et al. Improved survival with ipilimumab in patients with metastatic melanoma. N Engl J Med. 2010;363:711–23. doi: 10.1056/NEJMoa1003466. [DOI] [PMC free article] [PubMed] [Google Scholar]
- 12.Topalian SL, Hodi FS, Brahmer JR, et al. Safety, activity, and immune correlates of anti–PD-1 antibody in cancer. N Engl J Med. 2012;366:2443–54. doi: 10.1056/NEJMoa1200690. [DOI] [PMC free article] [PubMed] [Google Scholar]
- 13.Okazaki T, Honjo T. PD-1 and PD-1 ligands: from discovery to clinical application. Int Immunol. 2007;19:813–24. doi: 10.1093/intimm/dxm057. [DOI] [PubMed] [Google Scholar]
- 14.Ishida Y, Agata Y, Shibahara K, Honjo T. Induced expression of PD-1, a novel member of the immunoglobulin gene super-family, upon programmed cell death. EMBO J. 1992;11:3887–95. doi: 10.1002/j.1460-2075.1992.tb05481.x. [DOI] [PMC free article] [PubMed] [Google Scholar]
- 15.Oestreich KJ, Yoon H, Ahmed R, Boss JM. NFATc1 regulates PD-1 expression upon T cell activation. J Immunol. 2008;181:4832–9. doi: 10.4049/jimmunol.181.7.4832. [DOI] [PMC free article] [PubMed] [Google Scholar]
- 16.Staron MM, Gray SM, Marshall HD, et al. The transcription factor FoxO1 sustains expression of the inhibitory receptor PD-1 and survival of antiviral CD8(+) T cells during chronic infection. Immunity. 2014;41:802–14. doi: 10.1016/j.immuni.2014.10.013. [DOI] [PMC free article] [PubMed] [Google Scholar]
- 17.Mathieu M, Cotta-Grand N, Daudelin JF, Thébault P, Labrecque N. Notch signaling regulates PD-1 expression during CD8(+) T-cell activation. Immunol Cell Biol. 2013;91:82–8. doi: 10.1038/icb.2012.53. [DOI] [PubMed] [Google Scholar]
- 18.Terawaki S, Chikuma S, Shibayama S, et al. IFN-α directly promotes programmed cell death-1 transcription and limits the duration of T cell-mediated immunity. J Immunol. 2011;186:2772–9. doi: 10.4049/jimmunol.1003208. [DOI] [PubMed] [Google Scholar]
- 19.Kao C, Oestreich KJ, Paley MA, et al. Transcription factor T-bet represses expression of the inhibitory receptor PD-1 and sustains virus-specific CD8+ T cell responses during chronic infection. Nat Immunol. 2011;12:663–71. doi: 10.1038/ni.2046. [DOI] [PMC free article] [PubMed] [Google Scholar]
- 20.Blackburn SD, Shin H, Haining WN, et al. Coregulation of CD8+ T cell exhaustion by multiple inhibitory receptors during chronic viral infection. Nat Immunol. 2009;10:29–37. doi: 10.1038/ni.1679. [DOI] [PMC free article] [PubMed] [Google Scholar]
- 21.Francisco LM, Sage PT, Sharpe AH. The PD-1 pathway in tolerance and autoimmunity. Immunol Rev. 2010;236:219–42. doi: 10.1111/j.1600-065X.2010.00923.x. [DOI] [PMC free article] [PubMed] [Google Scholar]
- 22.Butte MJ, Keir ME, Phamduy TB, Sharpe AH, Freeman GJ. Programmed death-1 ligand 1 interacts specifically with the B7–1 costimulatory molecule to inhibit T cell responses. Immunity. 2007;27:111–22. doi: 10.1016/j.immuni.2007.05.016. [DOI] [PMC free article] [PubMed] [Google Scholar]
- 23.Xiao Y, Yu S, Zhu B, et al. RGMb is a novel binding partner for PD-L2 and its engagement with PD-L2 promotes respiratory tolerance. J Exp Med. 2014;211:943–59. doi: 10.1084/jem.20130790. [DOI] [PMC free article] [PubMed] [Google Scholar]
- 24.Keir ME, Liang SC, Guleria I, et al. Tissue expression of PD-L1 mediates peripheral T cell tolerance. J Exp Med. 2006;203:883–95. doi: 10.1084/jem.20051776. [DOI] [PMC free article] [PubMed] [Google Scholar]
- 25.Yoshida T, Jiang F, Honjo T, Okazaki T. PD-1 deficiency reveals various tissue-specific autoimmunity by H-2b and dose-dependent requirement of H-2g7 for diabetes in NOD mice. Proc Natl Acad Sci U S A. 2008;105:3533–8. doi: 10.1073/pnas.0710951105. [DOI] [PMC free article] [PubMed] [Google Scholar]
- 26.Dong H, Strome SE, Salomao DR, et al. Tumor-associated B7-H1 promotes T-cell apoptosis: a potential mechanism of immune evasion. Nat Med. 2002;8:793–800. doi: 10.1038/nm730. [DOI] [PubMed] [Google Scholar]
- 27.Iwai Y, Ishida M, Tanaka Y, Okazaki T, Honjo T, Minato N. Involvement of PD-L1 on tumor cells in the escape from host immune system and tumor immunotherapy by PD-L1 blockade. Proc Natl Acad Sci U S A. 2002;99:12293–7. doi: 10.1073/pnas.192461099. [DOI] [PMC free article] [PubMed] [Google Scholar]
- 28.Day CL, Kaufmann DE, Kiepiela P, et al. PD-1 expression on HIV-specific T cells is associated with T-cell exhaustion and disease progression. Nature. 2006;443:350–4. doi: 10.1038/nature05115. [DOI] [PubMed] [Google Scholar]
- 29.Carreno BM, Collins M. The B7 family of ligands and its receptors: new pathways for costimulation and inhibition of immune responses. Annu Rev Immunol. 2002;20:29–53. doi: 10.1146/annurev.immunol.20.091101.091806. [DOI] [PubMed] [Google Scholar]
- 30.Neel BG, Gu H, Pao L. The ‘Shp’ing news: SH2 domain-containing tyrosine phosphatases in cell signaling. Trends Biochem Sci. 2003;28:284–93. doi: 10.1016/S0968-0004(03)00091-4. [DOI] [PubMed] [Google Scholar]
- 31.Chemnitz JM, Parry RV, Nichols KE, June CH, Riley JL. SHP-1 and SHP-2 associate with immunoreceptor tyrosine-based switch motif of programmed death 1 upon primary human T cell stimulation, but only receptor ligation prevents T cell activation. J Immunol. 2004;173:945–54. doi: 10.4049/jimmunol.173.2.945. [DOI] [PubMed] [Google Scholar]
- 32.Okazaki T, Maeda A, Nishimura H, Kurosaki T, Honjo T. PD-1 immunoreceptor inhibits B cell receptor-mediated signaling by recruiting src homology 2-domain-containing tyrosine phosphatase 2 to phosphotyrosine. Proc Natl Acad Sci U S A. 2001;98:13866–71. doi: 10.1073/pnas.231486598. [DOI] [PMC free article] [PubMed] [Google Scholar]
- 33.Sheppard KA, Fitz LJ, Lee JM, et al. PD-1 inhibits T-cell receptor induced phosphorylation of the ZAP70/CD3zeta signalosome and downstream signaling to PKCtheta. FEBS Lett. 2004;574:37–41. doi: 10.1016/j.febslet.2004.07.083. [DOI] [PubMed] [Google Scholar]
- 34.Yokosuka T, Takamatsu M, Kobayashi-Imanishi W, Hashimoto-Tane A, Azuma M, Saito T. Programmed cell death 1 forms negative costimulatory microclusters that directly inhibit T cell receptor signaling by recruiting phosphatase SHP2. J Exp Med. 2012;209:1201–17. doi: 10.1084/jem.20112741. [DOI] [PMC free article] [PubMed] [Google Scholar]
- 35.Patsoukis N, Brown J, Petkova V, Liu F, Li L, Boussiotis VA. Selective effects of PD-1 on Akt and Ras pathways regulate molecular components of the cell cycle and inhibit T cell proliferation. Sci Signal. 2012;5:ra46. doi: 10.1126/scisignal.2002796. [DOI] [PMC free article] [PubMed] [Google Scholar]
- 36.Parry RV, Chemnitz JM, Frauwirth KA, et al. CTLA-4 and PD-1 receptors inhibit T-cell activation by distinct mechanisms. Mol Cell Biol. 2005;25:9543–53. doi: 10.1128/MCB.25.21.9543-9553.2005. [DOI] [PMC free article] [PubMed] [Google Scholar]
- 37.Vazquez F, Ramaswamy S, Nakamura N, Sellers WR. Phosphorylation of the PTEN tail regulates protein stability and function. Mol Cell Biol. 2000;20:5010–8. doi: 10.1128/mcb.20.14.5010-5018.2000. [DOI] [PMC free article] [PubMed] [Google Scholar]
- 38.Torres J, Pulido R. The tumor suppressor PTEN is phosphorylated by the protein kinase CK2 at its C terminus. Implications for PTEN stability to proteasome-mediated degradation. J Biol Chem. 2001;276:993–8. doi: 10.1074/jbc.M009134200. [DOI] [PubMed] [Google Scholar]
- 39.Patsoukis N, Li L, Sari D, Petkova V, Boussiotis VA. PD-1 increases PTEN phosphatase activity while decreasing PTEN protein stability by inhibiting casein kinase 2. Mol Cell Biol. 2013;33:3091–8. doi: 10.1128/MCB.00319-13. [DOI] [PMC free article] [PubMed] [Google Scholar]
- 40.Bivona TG, Pérez De Castro I, Ahearn IM, et al. Phospholipase Cgamma activates Ras on the Golgi apparatus by means of RasGRP1. Nature. 2003;424:694–8. doi: 10.1038/nature01806. [DOI] [PubMed] [Google Scholar]
- 41.Quigley M, Pereyra F, Nilsson B, et al. Transcriptional analysis of HIV-specific CD8+ T cells shows that PD-1 inhibits T cell function by upregulating BATF. Nat Med. 2010;16:1147–51. doi: 10.1038/nm.2232. [DOI] [PMC free article] [PubMed] [Google Scholar]
- 42.Wei F, Zhong S, Ma Z, et al. Strength of PD-1 signaling differentially affects T-cell effector functions. Proc Natl Acad Sci U S A. 2013;110(27):E2480–9. doi: 10.1073/pnas.1305394110. [DOI] [PMC free article] [PubMed] [Google Scholar]
- 43.Mempel TR, Henrickson SE, Von Andrian UH. T-cell priming by dendritic cells in lymph nodes occurs in three distinct phases. Nature. 2004;427:154–9. doi: 10.1038/nature02238. [DOI] [PubMed] [Google Scholar]
- 44.Fife BT, Pauken KE, Eagar TN, et al. Interactions between PD-1 and PD-L1 promote tolerance by blocking the TCR-induced stop signal. Nat Immunol. 2009;10:1185–92. doi: 10.1038/ni.1790. [DOI] [PMC free article] [PubMed] [Google Scholar]
- 45.Honda T, Egen JG, Lämmermann T, Kastenmüller W, Torabi-Parizi P, Germain RN. Tuning of antigen sensitivity by T cell receptor-dependent negative feedback controls T cell effector function in inflamed tissues. Immunity. 2014;40:235–47. doi: 10.1016/j.immuni.2013.11.017. [DOI] [PMC free article] [PubMed] [Google Scholar]
- 46.Zinselmeyer BH, Heydari S, Sacristán C, et al. PD-1 promotes immune exhaustion by inducing antiviral T cell motility paralysis. J Exp Med. 2013;210:757–74. doi: 10.1084/jem.20121416. [DOI] [PMC free article] [PubMed] [Google Scholar]
- 47.MacIver NJ, Michalek RD, Rathmell JC. Metabolic regulation of T lymphocytes. Annu Rev Immunol. 2013;31:259–83. doi: 10.1146/annurev-immunol-032712-095956. [DOI] [PMC free article] [PubMed] [Google Scholar]
- 48.Patsoukis N, Bardhan K, Chatterjee P, et al. PD-1 alters T-cell metabolic reprogramming by inhibiting glycolysis and promoting lipolysis and fatty acid oxidation. Nat Commun. 2015;6:6692. doi: 10.1038/ncomms7692. [DOI] [PMC free article] [PubMed] [Google Scholar]
- 49.Jaudszus A, Gruen M, Watzl B, et al. Evaluation of suppressive and pro-resolving effects of EPA and DHA in human primary monocytes and T-helper cells. J Lipid Res. 2013;54:923–35. doi: 10.1194/jlr.P031260. [DOI] [PMC free article] [PubMed] [Google Scholar]
- 50.Tkachev V, Goodell S, Opipari AW, et al. Programmed death-1 controls T cell survival by regulating oxidative metabolism. J Immunol. 2015;194:5789–800. doi: 10.4049/jimmunol.1402180. [DOI] [PMC free article] [PubMed] [Google Scholar]
- 51.Chang CH, Qiu J, O’Sullivan D, et al. Metabolic competition in the tumor microenvironment is a driver of cancer progression. Cell. 2015;162:1229–41. doi: 10.1016/j.cell.2015.08.016. [DOI] [PMC free article] [PubMed] [Google Scholar]
- 52.Azuma T, Yao S, Zhu G, Flies AS, Flies SJ, Chen L. B7-H1 is a ubiquitous antiapoptotic receptor on cancer cells. Blood. 2008;111:3635–43. doi: 10.1182/blood-2007-11-123141. [DOI] [PMC free article] [PubMed] [Google Scholar]
- 53.Akbay EA, Koyama S, Carretero J, et al. Activation of the PD-1 pathway contributes to immune escape in EGFR-driven lung tumors. Cancer Discov. 2013;3:1355–63. doi: 10.1158/2159-8290.CD-13-0310. [DOI] [PMC free article] [PubMed] [Google Scholar]
- 54.Marzec M, Zhang Q, Goradia A, et al. Oncogenic kinase NPM/ALK induces through STAT3 expression of immunosuppressive protein CD274 (PD-L1, B7-H1) Proc Natl Acad Sci U S A. 2008;105:20852–7. doi: 10.1073/pnas.0810958105. [DOI] [PMC free article] [PubMed] [Google Scholar]
- 55.Noman MZ, Desantis G, Janji B, et al. PD-L1 is a novel direct target of HIF-1α, and its blockade under hypoxia enhanced MDSC-mediated T cell activation. J Exp Med. 2014;211:781–90. doi: 10.1084/jem.20131916. [DOI] [PMC free article] [PubMed] [Google Scholar]
- 56.Green MR, Monti S, Rodig SJ, et al. Integrative analysis reveals selective 9p24.1 amplification, increased PD-1 ligand expression, and further induction via JAK2 in nodular sclerosing Hodgkin lymphoma and primary mediastinal large B-cell lymphoma. Blood. 2010;116:3268–77. doi: 10.1182/blood-2010-05-282780. [DOI] [PMC free article] [PubMed] [Google Scholar]
- 57.Fang W, Zhang J, Hong S, et al. EBV-driven LMP1 and IFN-γ up-regulate PD-L1 in nasopharyngeal carcinoma: Implications for oncotargeted therapy. Oncotarget. 2014;5:12189–202. doi: 10.18632/oncotarget.2608. [DOI] [PMC free article] [PubMed] [Google Scholar]
- 58.Derks S, Liao X, Chiaravalli AM, et al. Abundant PD-L1 expression in Epstein-Barr Virus-infected gastric cancers. Oncotarget. 2016;7:32925–32. doi: 10.18632/oncotarget.9076. [DOI] [PMC free article] [PubMed] [Google Scholar]
- 59.Chen J, Jiang CC, Jin L, Zhang XD. Regulation of PD-L1: a novel role of pro-survival signalling in cancer. Ann Oncol. 2016;27:409–16. doi: 10.1093/annonc/mdv615. [DOI] [PubMed] [Google Scholar]
- 60.Zou W, Chen L. Inhibitory B7-family molecules in the tumour microenvironment. Nat Rev Immunol. 2008;8:467–77. doi: 10.1038/nri2326. [DOI] [PubMed] [Google Scholar]
- 61.Rizvi NA, Hellmann MD, Snyder A, et al. Mutational landscape determines sensitivity to PD-1 blockade in non-small cell lung cancer. Science. 2015;348:124–8. doi: 10.1126/science.aaa1348. [DOI] [PMC free article] [PubMed] [Google Scholar]
- 62.Tumeh PC, Harview CL, Yearley JH, et al. PD-1 blockade induces responses by inhibiting adaptive immune resistance. Nature. 2014;515:568–71. doi: 10.1038/nature13954. [DOI] [PMC free article] [PubMed] [Google Scholar]
- 63.Ribas A, Shin DS, Zaretsky J, et al. PD-1 blockade expands intratumoral memory T cells. Cancer Immunol Res. 2016;4:194–203. doi: 10.1158/2326-6066.CIR-15-0210. [DOI] [PMC free article] [PubMed] [Google Scholar]
- 64.Herbst RS, Soria JC, Kowanetz M, et al. Predictive correlates of response to the anti-PD-L1 antibody MPDL3280A in cancer patients. Nature. 2014;515:563–7. doi: 10.1038/nature14011. [DOI] [PMC free article] [PubMed] [Google Scholar]
- 65.Naidoo J, Page DB, Li BT, et al. Toxicities of the anti-PD-1 and anti-PD-L1 immune checkpoint antibodies. Ann Oncol. 2015;26:2375–91. doi: 10.1093/annonc/mdv383. [DOI] [PMC free article] [PubMed] [Google Scholar]
- 66.Alexandrov LB, Nik-Zainal S, Wedge DC, et al. Signatures of mutational processes in human cancer. Nature. 2013;500:415–21. doi: 10.1038/nature12477. [DOI] [PMC free article] [PubMed] [Google Scholar]
- 67.Gubin MM, Zhang X, Schuster H, et al. Checkpoint blockade cancer immunotherapy targets tumour-specific mutant antigens. Nature. 2014;515:577–81. doi: 10.1038/nature13988. [DOI] [PMC free article] [PubMed] [Google Scholar]
- 68.Snyder A, Makarov V, Merghoub T, et al. Genetic basis for clinical response to CTLA-4 blockade in melanoma. N Engl J Med. 2014;371:2189–99. doi: 10.1056/NEJMoa1406498. [DOI] [PMC free article] [PubMed] [Google Scholar]
Associated Data
This section collects any data citations, data availability statements, or supplementary materials included in this article.